 Fanfan Guan
 Yanrong Li
 Guohong Gao1
 Mary Antonette Beroya-Eitner
- 1Department of Earth Sciences and Engineering, Taiyuan University of Technology, Taiyuan, China
- 2Department of Civil and Environmental Engineering, Institute of Geotechnics, Technical University of Darmstadt, Darmstadt, Germany
Tensile strength is an important parameter in many engineering applications. In loess slopes, for instance, it governs the development and propagation of tension cracks that usually ultimately lead to crack–sliding and toppling failures, which are among the most common modes of slope failure in the Loess Plateau of China. Reliable measurement of tensile strength of geomaterial is therefore a necessity. Commonly used methods for tensile strength measurement have important limitations and shortcomings, which become magnified when dealing with soil and soft rock. This study developed a new indirect tensile test, the Horizontal Compression test, for use with these materials. The proposed method not only involves simple sample preparation and test operation, it also addresses the eccentric force and stress concentration problems that are common in conventional tensile tests. To evaluate the method’s validity, its performance was compared with the ISRM-suggested direct tensile test and the closely related Brazilian test. The tensile strength values from the horizontal compression test strongly correlate with those from the direct tension test, and are more stable than those obtained with either of the two conventional tests. Thus, the proposed method can be used and deemed more suitable for tensile strength determination than these conventional test methods.
Introduction
Tensile strength is one of the most important parameters in many engineering and science-based applications. In geotechnical engineering, the interest in tensile strength is on its role in crack initiation and propagation in soils and rocks (Griffith, 1921; Tapponnier and Brace, 1976; Stacey, 1981; Haimson and Cornet, 2003), and therefore in the failure of earth structures, such as slopes embankment, and dams. In loess slopes, for instance, cracking–sliding and toppling are common failure modes that are usually initiated by the development of tension cracks at the slope crown, then propagating vertically down from a few to several meters (Li, 2018). These modes of failure are a frequent occurrence in the Loess Plateau of China, causing an average of 100 deaths per year and considerable economic loss (Li et al., 2018b). Prevention and mitigation measures are therefore needed, which, for performance and cost effectiveness, require proper evaluation of the tensile strength of loess soil. To date, however, there exists no standard test for tensile strength similar to those for other geotechnical soil properties such as shear strength and compressive strength.
Tensile strength is the fracture stress under uniaxial pulling (tension) force. As such, it is ideally determined by direct tensile testing, whereby a cylindrical specimen is loaded in axial tension until failure. Tensile strength is calculated by dividing the fracture force by the cross-sectional area of the specimen under the assumption that the stress is uniform and purely uniaxial. However, as Coviello et al. (2005) pointed out, this assumption is most often invalid since anomalous stress concentration tends to occur at specimen ends, leading to early rupture in these parts. Moreover, even when the rupture occurs in the middle portion of the specimen, the stress distribution over the entire cross section may not be uniform owing to the bending moments introduced by small geometrical imperfections and/or misalignment between the specimen’s axis and the machine cap axes.
Several solutions have been adopted to address the aforementioned problems, such as preparing the specimen in a dumbbell shape (e.g., Tolooiyan et al., 2014; Demirdag et al., 2019) or etching a notch on the surface to force the specimen to fracture at the middle portion, using special connectors between the specimen and the loading frame (e.g. Fairhurst, 1961; Hawkes and Mellor, 1970; Okubo and Fukui, 1996; Perras and Diederichs, 2014), and using a centering apparatus (Zhang et al., 2017). Some of these techniques are effective, but complicated and expensive (Mellor and Hawkes, 1971; Butenuth et al., 1993; Coviello et al., 2005). As a result, direct tensile test is seldom carried out in laboratories. As alternatives, several indirect test methods have been developed, including the Brazilian test (Hudson et al., 1972; ISRM, 1978), bending test (He et al., 1990), hydraulic fracturing test (Zoback et al., 1977), hoop test (Xu et al., 1988), axial fracturing test (Fang and Chen, 1972) and ring test (Hobbs, 1964).
Among the indirect tensile tests, the Brazilian test, also known as splitting tension test, is widely used due to ease of operation. In this test, tensile failure is induced in a thin, circular disc by subjecting it to diametrical compression. The principle behind the test is based on the experimental fact that most rocks in biaxial stress fields fail in tension at their uniaxial tensile strength when one principal stress is tensile and the other is compressive, where the magnitude of the latter does not exceed three times that of the former (ISRM, 1978; Li and Wong, 2013). The intermediate principal stress is assumed to have no influence on disc failure (Fairhurst, 1964). The maximum tensile stress at failure is then computed by applying the Continuum Mechanics under the assumption that the specimen is homogeneous, isotropic and linearly elastic before brittle failure occurs (Mellor and Hawkes, 1971). It is also assumed that this failure occurs at the point of maximum tensile stress, i.e. at the center of the disc. However, in many Brazilian tests, crack initiation has been observed at points away from the center of the disc and near the disc-loading platen contact where stress concentration exists (Fairhurst, 1964; Hooper, 1971; Hudson et al., 1972; Swab et al., 2011). Moreover, similar to the direct tensile test, eccentric force often appears in Brazilian test due to the difficulty of keeping the applied force along the vertical diametrical plane of the specimen throughout the test. Like most tensile tests, the main application of the Brazilian test is on rock and rock-like materials; it was recommended by the International Society for Rock Mechanics (ISRM) as the standard for determining the tensile strength of rocks (ISRM, 1978). When applied to soil and soft rocks, said test limitations can be magnified due to greater geometric tolerances that must be accepted in the specimen preparation and the difficulty of obtaining samples with smooth surfaces (Coviello et al., 2005).
Motivated by the need to understand the tensile behavior of earth materials, particularly soils and soft rocks, and realising the limitations of conventional tensile tests, we developed and proposed a new indirect tensile test called Horizontal Compression test, which is particularly suited to these materials. The proposed method is easy to use; it does not require special and expensive techniques in sample preparation and operation of the apparatus is simple. It generally operates under the same principle as the Brazilian test but improves on the latter in that the applied compressive force strictly passes through the central diametrical plane of the specimen, thereby preventing the development of eccentric forces.
In the development of the proposed method, we conducted two major laboratory test campaigns: the first was aimed at establishing the optimal parameters for use with the method, whereas the second was to evaluate the method’s performance. This paper presents the proposed method and the results of the said test campaigns.
Test Method and Device
The device (Figure 1A) developed for the proposed test method mainly comprises fracturing rods (Figure 1B), specimen positioning frame (Figure 1C), load cell, displacement sensor and data processor. A servo-controlled tension system is adopted, and a case is used to protect the tensile test frame.
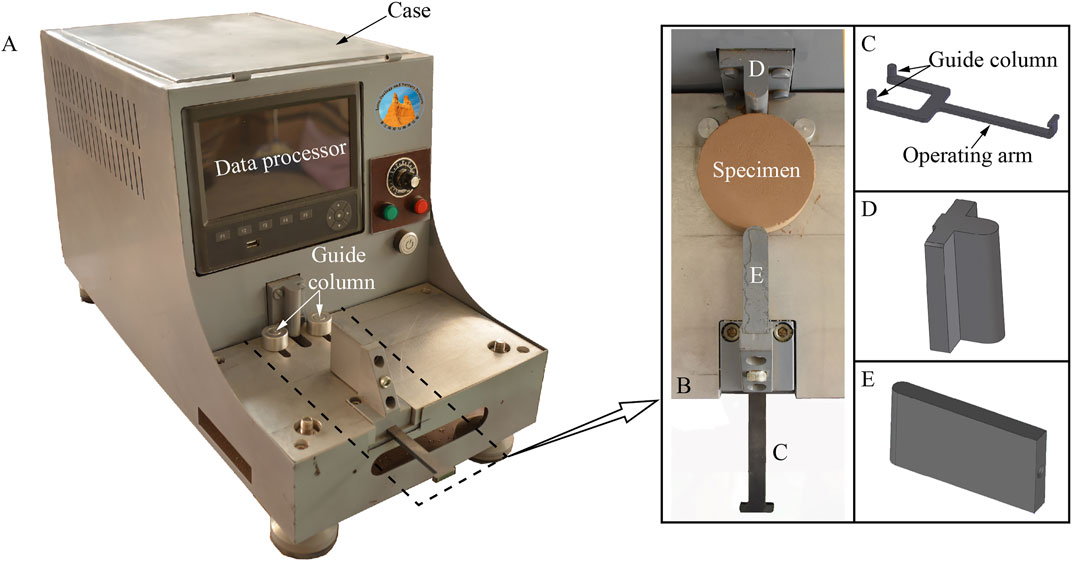
FIGURE 1. Horizontal compression test device (A) overview (B) fracturing rods (C) specimen positioning frame (D) active fracturing rod and (E) stationary fracturing rod.
Compression is carried out by the fracturing rods (Figure 1B), one of which is active (Figure 1D) and the other stationary and fixed on the frame platform (Figure 1E). The specimen is placed horizontally between these two rods, which are kept separated at a pre-set distance depending on the size of the specimen. Driven by the electric cylinder, the active fracturing rod then moves towards the stationary fracturing rod and fractures the specimen at a specified loading rate. The frame platform is designed to be smooth such that frictional resistance can be considered negligible.
The apparatus is equipped with a specimen positioning frame that is fitted with an operating arm and two guide columns (Figure 1C). The frame is manipulated through the operating arm for setting the specimen so that the active fracturing rod, the stationary fracturing rod and the central axis of the specimen are aligned in the same vertical plane. This ensures that the direction of the force strictly passes through the center of the specimen, minimizing eccentric force.
The load cell with an accuracy of 0.1 N is set up on the active fracturing rod to detect the pressure from the rod. A linear variable differential transformer with an accuracy of 0.001 mm is installed between the frame platform and the active fracturing rod to detect the displacement of the rod. The data processor then receives the data from the load cell and the displacement sensor. The load cell and the displacement sensor are easy to replace in case of malfunction.
The tensile strength of the specimen and corresponding strain can be evaluated using the same equations for the Brazilian test (ISRM, 1978):
where P is the force at failure; D is the specimen diameter; T is the specimen thickness; δ is the compressive strain (equal to Δd/d, where Δd is the measured vertical displacement at failure); v is the Poisson’s ratio of the specimen.
The main procedure of the proposed horizontal compression test is in accordance with the Chinese Specification of Rock Test (GB/T 50266, 2013), ISRM Standard (ISRM, 1978) and ASTM Standard (ASTM C496/C496M-17, 2017).
A requirement of the test is the preparation of the specimen in a cylindrical form. This study utilized loess soil as test specimen, which is a strongly anisotropic geological material in its natural state (Li et al., 2018a). Thus, the soil was remolded to obtain a more homogeneous fabric than the intact specimens (Jiang et al., 2014), and thereby ensure reliable and comparable test data. The remolded specimens were prepared using a self-made mold and the universal testing frame. The stipulations of the Chinese Specification of Soil Test (GB/T 50123, 2019), British Standard (BS 1377-1, 2016) and ASTM standard (ASTM D7015-18, 2018) were strictly followed in the sampling and specimen preparation.
Determination of Optimal Test Parameters
Test Specimen
For the optimal specimen size determination, specimens with diameters of 40, 50, 60, 80, and 100 mm and respective thickness of 20, 25, 30, 40 and 50 mm (i.e., radius: thickness ratio of 1, following the 1978 ISRM recommendation for Brazilian test specimen) were prepared. For each specimen size, five specimens were tested. For the determination of loading rate, another six sets were prepared, each corresponding to different loading rates (0.05, 0.1, 0.3, 0.5, 0.7 and 0.9 mm/min) and comprising five specimens. All the remolded specimens had a dry density of 1.32 g/cm3 and zero moisture content.
Jaw Shape
One of the most important parameters affecting the results of tensile tests is how the applied load is transferred to the specimen. In this regard, the shape of the loading jaw plays a major role. Thus, prior to starting the testing program, extensive trial tests were conducted to select the most suitable jaw shape for the proposed apparatus. Four different jaw shapes were considered (Figure 2). Jaws Ⅰ and Ⅱ (Figures 2A,B), which more or less represent point load contact, were found to cause initial fracture in the disc-jaw contact area and are therefore considered unsatisfactory. Jaws Ⅲ and Ⅳ (Figures 2C,D), representing a curved contact, showed a much better performance although like Jaws Ⅰ and Ⅱ, Jaw III also tended to penetrate the specimen. With Jaw Ⅳ (Figure 2D), the initiation and propagation of cracking occurred simultaneously. No jaw penetration into the specimen was observed.
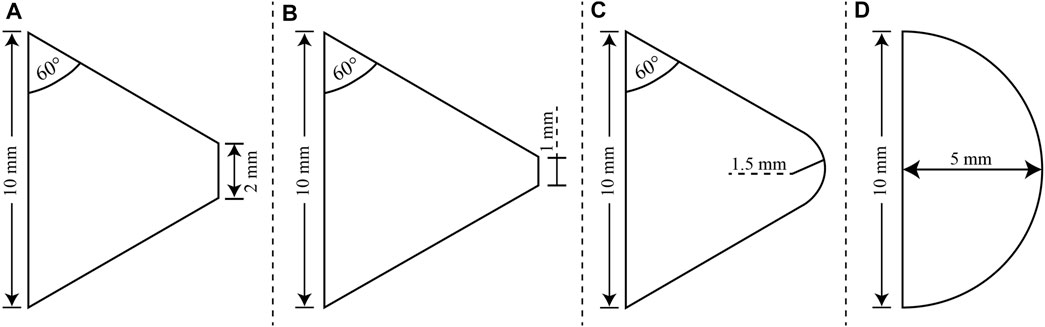
FIGURE 2. Different jaw shapes (A) Jaw Ⅰ (B) Jaw Ⅱ (C) Jaw Ⅲ and (D) Jaw Ⅳ.
To gain further insights into how load is transferred by the different jaw shapes, a 2D finite element simulation was conducted using Abaqus Standard 2019. The soil was modeled as a homogeneous, linearly elastic material with the following elastic constants: Young’s Modulus = 15,000 kPa and Poisson’s ratio = 0.23. The model was meshed with roughly 6,000 plane stress elements. The loading jaws were simulated as a rigid body, one of which was fixed whilst the other was displacement controlled and moved in the +y direction. There was no bonding between the sample and the jaws. As shown in Figure 3, the numerical simulation results are generally consistent with the experimental results. Stress concentration, particularly at the jaw edges, is noticeable with Jaws Ⅰ and Ⅱ (Figures 3A,B), explaining the triangular fracture area that develops at the specimen-jaw contact when these jaws are used. The stress distribution with Jaws Ⅲ and Ⅳ have the same pattern (Figures 3C,D), although stress in the former is more concentrated and higher at the disc-jaw contact. This may explain the observed penetration of the jaw into the specimen. Of all the jaws, Jaw Ⅳ gives the most homogenous stress distribution pattern, explaining the simultaneous occurrence of crack initiation and propagation. Jaw Ⅳ, therefore, was adopted for use with the proposed method.
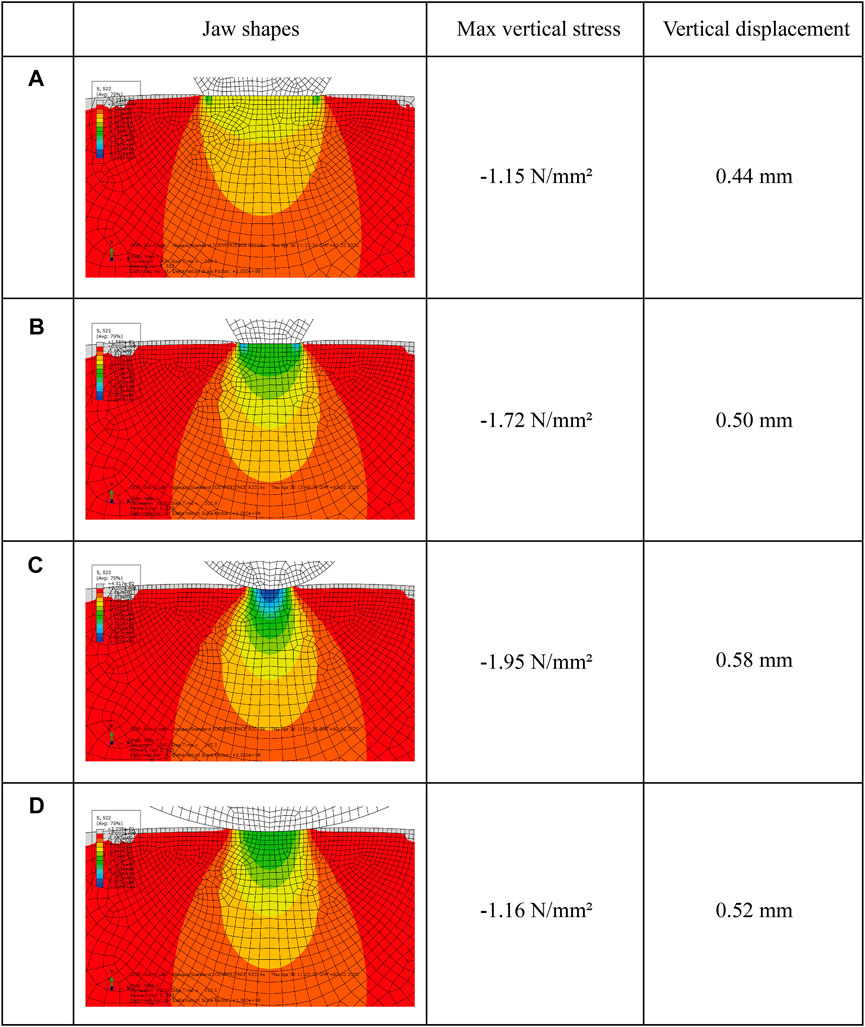
FIGURE 3. Comparison of vertical stress concentration in the specimen with different shapes of jaws under a load of 40 N (A) Jaw Ⅰ (B) Jaw Ⅱ (C) Jaw Ⅲ and (D) Jaw Ⅳ.
Specimen Size
A series of tests was carried out to explore how the tensile strength obtained with the proposed method is affected by specimen size and to determine the optimal size for use with the method. To this end, specimens of different sizes with diameters of 40, 50, 60, 80 and 100 mm and respective thickness of 20, 25, 30, 40 and 50 mm were tested at a loading rate of 0.5 mm/min.
Figure 4 shows typical load-displacement curves for the different specimen sizes. Clear and sharp peaks can be observed, indicating the possibility of determining tensile strength with the horizontal compression test. The load increases with displacement until a peak is reached after which the load falls rapidly to zero. The peak load and displacement increase with increase in diameter.
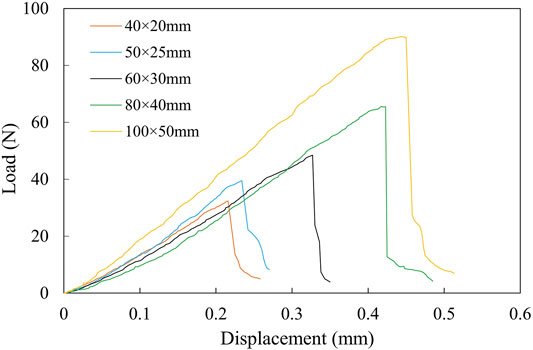
FIGURE 4. Load vs. displacement curves for the different specimens sizes (e.g., 40 × 20 mm refers to diameter × thickness).
The average tensile strength (σt) obtained for each specimen size is shown in Figure 5. The σt values decrease by 46.48% with increase in diameter from 40 to 60 mm. However, further increase in diameter did not produce significant variation in the σt values, indicating that the measured tensile strength is relatively stable at diameter range of 60–100 mm. Hence, the minimum specimen size requirement for the proposed method is determined to be 60 mm in diameter and 30 mm in thickness following the method used by Kuruppu and Funatsu (2012) and Hudson (1969) to determine the critical specimen size for tensile fracture toughness test and ring tensile test, respectively. With the method, the point at which the tensile strength becomes constant may be defined as the minimum specimen size that yields size-independent tensile strength. This critical or minimum specimen size is recommended for use with the proposed method, given that with larger specimens, the possibility of encountering larger and more material flaws is increased. Preparing a larger specimen without disturbance is also difficult. Thus, there exists a maximum practical size that can be tested in the proposed apparatus, which was determined to be 100 mm × 50 mm. The optimal application of the proposed method, therefore, is on fine-to medium-grained soils and rocks.
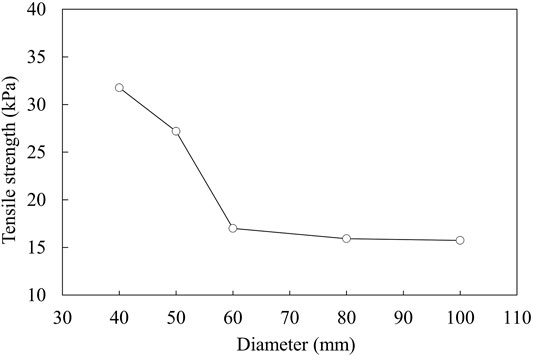
FIGURE 5. Correlation between the measured tensile strengths and specimen diameter.
Loading Rate
Six loading rates (0.05, 0.1, 0.3, 0.5, 0.7 and 0.9 mm/min) were considered and following the test results in Specimen Size, specimens with a diameter of 60 mm and thickness of 30 mm were used.
As shown in Figure 6, the measured tensile strength gradually increases with increasing loading rate. The most stable test results, with a minimum coefficient of variation (Cv) of 3.72%, were obtained at a loading rate of 0.1 mm/min. Therefore, this loading rate can be used with the suggested method. With this low rate, problems that may arise with high loading rates (such as subcritical crack growth) can be avoided, while allowing for the test to be performed within a reasonable length of time.
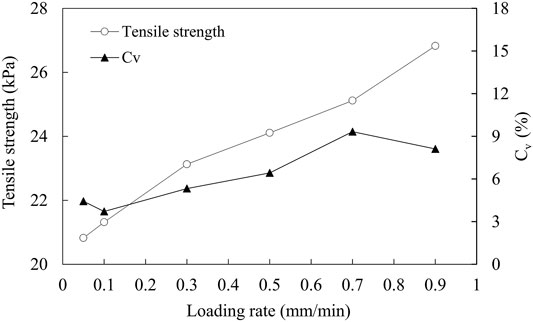
FIGURE 6. Influences of loading rate on the measured tensile strengths (Cv is coefficient of variation, equals to the standard deviation of the tensile strength values divided by the average value).
Performance Evaluation
To evaluate the performance of the proposed method, another test campaign was conducted to compare the tensile strengths obtained with the method to those obtained with the direct tension test and the closely-related Brazilian test.
Test Specimen
For the direct tension test, 50 × 100 mm dumbbell-shaped specimens were prepared following the method proposed by Li et al. (2020), where a rotation grooving device was used to create a 15 mm-wide section with a reduced diameter (40 mm) in the mid-height of the specimen. For the Brazilian test, an appropriately sized (50 mm diameter and 25 mm thickness) mold was used. Each of the three test methods was carried out on seven soil specimens, all with a dry density of 1.38 g/cm3 and zero moisture content.
Given that the direct tensile test is considered the ideal method for tensile strength determination, the performance of any indirect test method is compared and measured against this test (Liao et al., 2019). Insights from the comparison of the proposed method with the direct tension test is therefore deemed very important. Thus, to further ensure sample uniformity and data comparability, gypsum-sand specimens were additionally tested with the two test methods. Moreover, given that the artificial mixture can be prepared into stiffer and denser specimens simulating soft rock, its use allows the evaluation of the capability of the proposed method over a wider range of tensile strengths. The artificial specimen preparation followed the method proposed by Li et al. (2020). Specimens were prepared at four different densities (1.57, 1.73, 1.77 and 1.82 g/cm3) by mixing predetermined proportions of gypsum, standard sand and water. This mixture was put in a container, stirred evenly and placed in a self-made mold for compaction by static pressing method. The mold was then put in an oven at 50 C for 12 h and then demolded. Finally, the specimens were put back in the oven at 50 C and dried to a constant mass. For each of the direct tension test and the proposed method, four sets of gypsum-sand specimens were prepared, each set corresponding to different densities and comprising five specimens. The properties of the gypsum, standard sand and the mixed specimen are similar to those reported in Li et al. (2020).
Direct Tension and Brazilian Tests
The direct tension and the Brazilian tests were conducted using the universal testing frame. The direct tension test (ISRM test) was performed following the procedure suggested by the International Society for Rock Mechanics (ISRM, 1978). Tensile strength and averaged tensile strain were calculated using Eqs (3), (4) below:
where P is the maximum applied load, A is the original cross-sectional area of the crack plane, δ is the measured displacement and Hf is the height of the free area of the specimen (i.e. the area outside of the metal grips holding the specimen ends).
For the Brazilian test, a Chinese standard V-shaped loading strip (GB/T 23561.10, 2010) was attached to the universal testing machine (Figure 7). Tensile strength and corresponding critical tensile strain were respectively calculated using Eqs 1, 2.
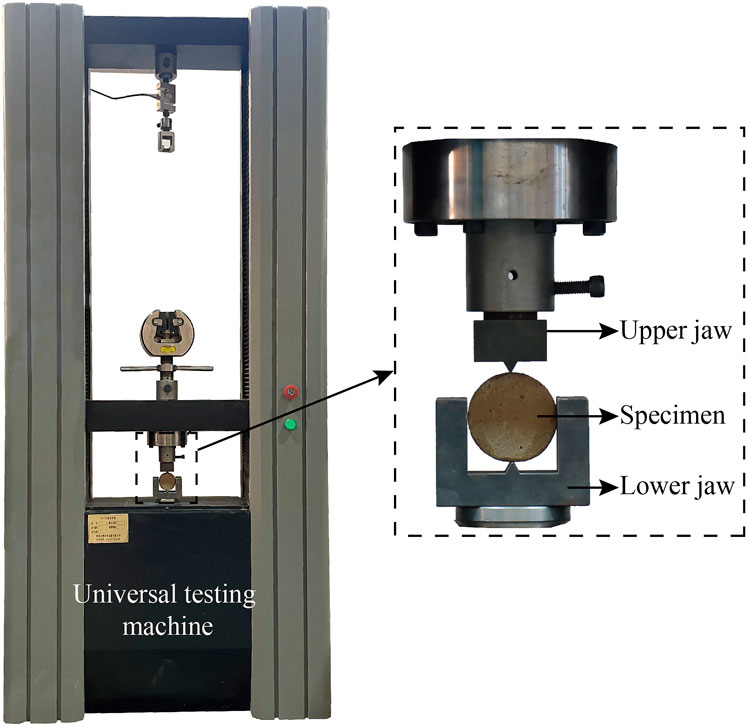
FIGURE 7. V-shaped loading strip (GB/T 23561.10, 2010) attached to the universal testing machine.
For both methods as well as the proposed method, a loading rate of 0.1 mm/min was applied following the results of Loading Rate.
Evaluation of Results
To investigate the specimen failure behavior under the different test methods, a high-speed camera (1,280 × 1,024 pixels) with a filming rate of 1,000 frames per second (fps) was used, allowing to record the initiation and propagation of cracks in the specimens. With this, cracks were observed to develop in the middle part of the grooved section in the ISRM, whereas in the Brazilian test, cracks were initiated in the middle and upper parts of the samples, and then extended gradually to the entire loaded diameter. Penetration of the loading jaws into the specimen was commonly observed in the latter test. The observed crack initiation in the middle and upper parts of the Brazilian test specimen was very similar to the results of Komurlu and Kesimal (2015) on testing andesitic basalt specimens. In fact, a major drawback observed by many workers with Brazilian tests is this premature failure of specimen close to the loading zone (e.g., Aonoa et al., 2012; Gutiérrez-Moizant et al., 2020), which, depending on the geometry of the loading jaw and the material tested, may lead to catastrophic failure (Erarslan et al., 2012; Komurlu and Kesimal, 2015). In the Horizontal Compression test, crack developed instantaneously along the loaded diameter of the specimen. Figure 8 presents typical images of a specimen at various stages of loading in the proposed method: pre-loading (Figure 8A), crack initiation (Figure 8B) and post failure (Figure 8C). Figures 8B,C are consecutive images, i.e. they were taken 2/1,000 s apart, which therefore show that crack initiation and propagation occurred instantaneously along the loading axis. No measurable penetration of the fracturing rod into the specimen was observed.
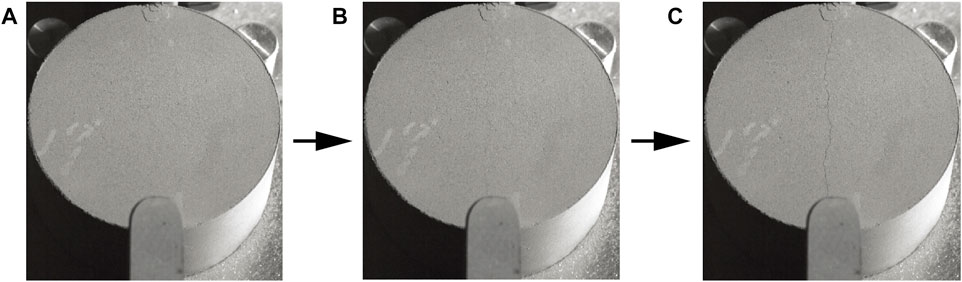
FIGURE 8. Soil specimen at different loading stages (A) pre-loading (B) crack initiation and (C) post failure. Images in (B) and (C) are consecutive, showing that crack initiation and propagation happened instantaneously within 2/1,000 s.
Figure 9 shows the typical stress-strain curves for each test. All the curves display a similar trend of tensile stress increasing nearly linearly with strain until a peak stress is reached, after which point the stress dropped rapidly to zero, indicating the brittle nature of tensile failure. In the direct tension test, relatively bigger strain developed before failure occurred. This is ascribed to the relative slippage (roughly 0.2 mm as observed with the high-speed camera) between the fixture and the specimen (Figure 10), which is a common problem in direct tension test regardless of the gripping technique used (Alhussainy et al., 2019).
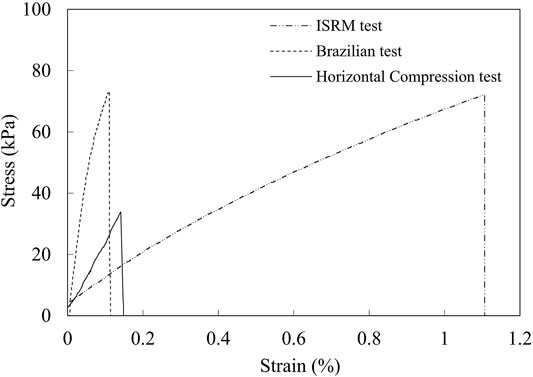
FIGURE 9. Typical stress-strain curves for ISRM test, Brazilian test, and Horizontal Compression test.
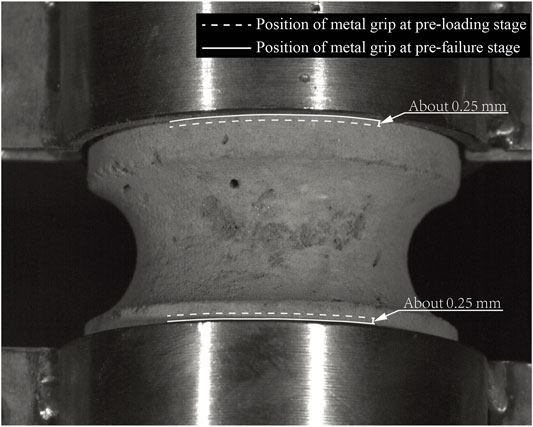
FIGURE 10. Relative vertical slippage between the specimen and the metal grip determined by comparing the positions of metal grip at pre-loading and pre-failure stages.
Figure 11 compares the tensile strengths obtained from each test, indicating that the ISRM test gave the highest value, followed by the Brazilian test then by the proposed method. This difference in the strength values is due to the interplay of several factors. For instance, the above-mentioned specimen-fixture connection problem in the ISRM test must have contributed to the high tensile strength obtained with this test. Meanwhile, the penetration of the loading jaws into the specimen in the Brazilian test means that the tensile fracture may be shorter than the specimen diameter. With reference to Eq. (1), this may cause tensile strength underestimation. Referring to the Brazilian test and the proposed method, the scale effect may have contributed to the lower tensile strength obtained with the latter. This scale effect was originally hypothesized by Griffith (1921), positing that the bigger the specimen (such as that of the proposed method relative to that of the Brazilian Test), the higher the probability of defects. On tensile loading, stress concentration develops around these flaws, resulting in early failure at lower stress levels. The scale effect is generally validly assessed on materials of geometrically similar structure but different sizes (Biolzi et al., 2001), such as the specimens of the two tests. The tensile strength values obtained from each test and corresponding coefficient of variation (Cv) are plotted in Figure 11. As can be seen, the proposed method gave the most stable results of the three methods, followed by the Brazilian test and then the ISRM test.
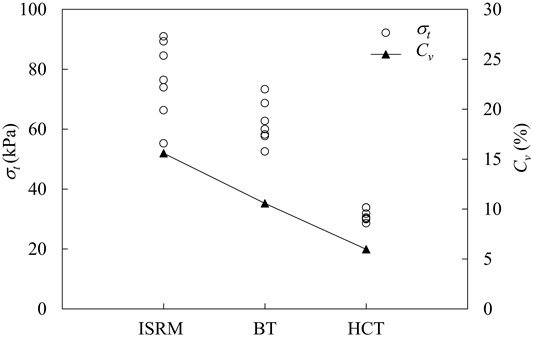
FIGURE 11. Tensile strength obtained from ISRM test (ISRM), Brazilian test (BT) and Horizontal Compression test (HCT).
For the comparison of the proposed method with the ISRM test using artificial specimens, Figure 12 shows the load-displacement curves obtained from the two tests for each of the dry density considered. The following can be gleaned: 1) the shape of the curves from both tests are consistent with each other and with that obtained using soil specimens. All the curves are near-linear until the peak load is reached, after which the load sharply drops; 2) the measured peak load and the corresponding displacement increase with dry density for both tests; and 3) at the same density, the peak load obtained with the Horizontal Compression test is larger than that with the ISRM test, whereas the corresponding displacement is smaller.
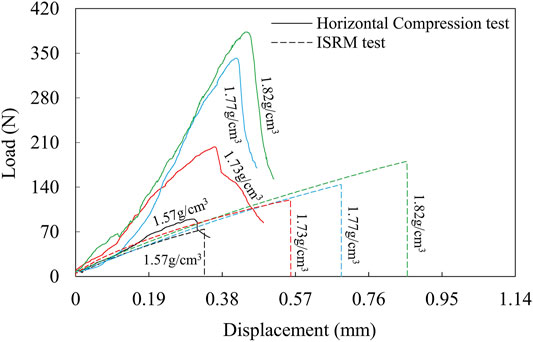
FIGURE 12. Plot of load vs displacement for artificial specimens at different dry densities for the Horizontal Compression and ISRM tests, ISRM test data are from Li et al. (2020).
Results further show that in both methods, the tensile strength increases with increase in dry density, with their tensile strength‒dry density plots generally following the same trend/shape (Figure 13A). At the same dry density, the tensile strength obtained with the Horizontal Compression test is lower than that with the ISRM test, consistent with the results using the soil specimen. Again, as in the soil specimen, the Cv of the tensile strengths obtained with the former is significantly lower than that with the latter (Figure 13A). For instance, at a dry density of 1.73 g/cm3, the Cv of the former is 7%, compared with the latter’s 25%, confirming that the horizontal compression test gives more stable results than the ISRM test.
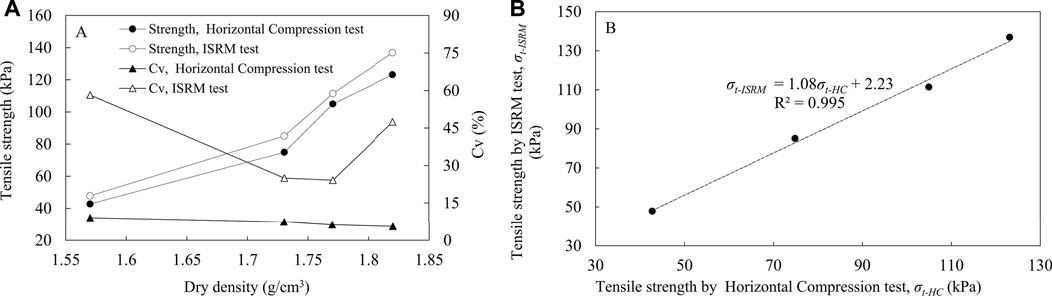
FIGURE 13. Comparison of test results between the horizontal compression and ISRM tests (A) tensile strength vs dry density and (B) relationship of the tensile strengths obtained from both methods (Cv is coefficient of variation, and R2 is correlation coefficient), ISRM test data are from Li et al. (2020).
In Figure 13B, the tensile strengths obtained from the Horizontal Compression test (σt-HC) are plotted against those obtained from the ISRM test (σt-ISRM). The σt-ISRM values are strongly correlated with the σt-HC values, with correlation coefficient, R2 of 0.995.
Generally, therefore, results of the performance evaluation using natural soils and artificial mixture both indicate that the proposed method can and may even be more suitable for tensile strength determination of soil and soft rocks. Tensile strength values obtained are more stable than those obtained with either the Brazilian test or the ISRM test, which can be ascribed largely to the absence of eccentric forces in and the simplicity and ease of the proposed method’s operation. Moreover, these strength values are strongly correlated with the ISRM test values.
Basic Test Requirements
The basic requirements of the proposed method are outlined below on the basis of our experience in using the method and in accordance with international standards, such as the ISRM (1978), ISRM (1979) and ASTM C496/C496M (2017).
The diameter of the specimen shall be at least 10 times greater than the largest grain in the specimen (ISRM, 1978; ASTM C496/C496M-17, 2017). The end surfaces must be flat at 0.02 mm and should not deviate from the plane perpendicular to the longitudinal axis of the specimen by more than 0.001 radian or 0.05 mm in 50 mm (ISRM, 1979).
The sides of the specimen should be smooth, free of abrupt irregularities and straight to within 0.5 mm over the full length of the specimen (ISRM, 1978), given that unfavorable stress concentrations may occur at such irregularities.
The diameter D of the specimen should be measured to the nearest 0.1 mm by averaging three diameter measurements taken at points six0° apart from each other, one of which must be along the loading diameter. The thickness T of the specimen must be determined to the nearest 1 mm by averaging three measurements taken along the thickness of the specimen and at points 120° apart from each other. The average diameter D and thickness T should be used for calculating the cross-sectional area.
At least five specimens per sample set shall be tested to obtain a meaningful average value (ISRM, 1978). If the reproducibility of the test results is good (Cv < 5%), a smaller number of specimens is acceptable. Each specimen of a set must be tested under the same conditions (ASTM C496/C496M-17, 2017).
When the test is finished, the state of the fractured specimen must be preserved for in-depth observation of the failure mode. The test should be rejected if the crack surface deviates from the loading axis by more than 0.05D (Figure 14). In our test campaign of over 120 specimens, nearly 6% were deemed unacceptable. Rough preparation, non-standard operation and inherent defects in the specimen are responsible for these failures.
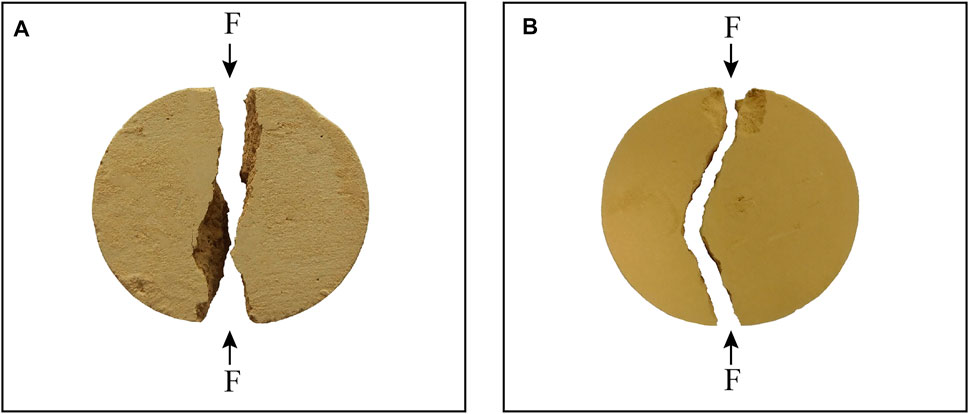
FIGURE 14. Typical unacceptable failure modes: (A) Central + Twisted fracture plane mode; (B) Non-central mode.
Together with the tension test conditions and results, the following information must be recorded for each test: specimen storage and preparation process, moisture content and specimen size. Any macroscopic characteristics of the specimen surfaces, and any adjustment made with the specimen conditions (e.g., adjustment in moisture content) must also be reported. The surrounding environmental conditions must also be recorded, if applicable.
Summary and Conclusion
We developed a new indirect tensile test method, the Horizontal Compression test, which purports to address the limitations of commonly used tensile test methods. This new method involves simple specimen preparation and test operation, and therefore suitable for routine use. Moreover, it minimizes the appearance of eccentric force and the concentration of stresses that are common issues in conventional test methods. The tensile strength values from the Horizontal Compression test strongly correlate with those from the direct tension test, and are more stable than those obtained with either the direct tension test and Brazilian test. Thus, the proposed method can be used and deemed more suitable for tensile strength determination than these conventional test methods. The Horizontal Compression test was originally designed for use with soil and soft rocks. However, the technology can be easily adapted for application to other types of materials, such as hard rocks, concrete and steel.
Data Availability Statement
The original contributions presented in the study are included in the article/Supplementary Material, further inquiries can be directed to the corresponding author.
Author Contributions
YL conceived the project and designed the experiment. FG and GG carried out the laboratory tests. YL and FG jointly interpreted the test data. HZ, GE and MB-E conduced the numerical simulation. YL and FG developed the theoretical analysis. FG, YL, and MB-E wrote the paper.
Funding
This study was supported by the following: National Natural Science Foundation of China (No. 41877276), Key Program of National Natural Science Foundation of China (No. 41630640), Major Program of the National Natural Science Foundation of China (No. 41790445).
Conflict of Interest
The authors declare that the research was conducted in the absence of any commercial or financial relationships that could be construed as a potential conflict of interest.
Publisher’s Note
All claims expressed in this article are solely those of the authors and do not necessarily represent those of their affiliated organizations, or those of the publisher, the editors, and the reviewers. Any product that may be evaluated in this article, or claim that may be made by its manufacturer, is not guaranteed or endorsed by the publisher.
References
Alhussainy, F., Hasan, H. A., Sheikh, M. N., and Hadi, M. N. S. (2019). A New Method for Direct Tensile Testing of concrete. Wollongong: Faculty of Engineering and Information Sciences. Papers: Part B. 1716.
Aonoa, Y., Tani, K., Okada, T., and Sakai, M. (2012). “Failure Mechanism of the Specimen in the Splitting Tensile Strength Test,” in Proceedings of the 7th Asian Rock Mechanics Symposium, Seoul, South Korea, October, 2012, 615–623.
ASTM C496/C496M-17 (2017). Standard Test Method for Splitting Tensile Strength of Cylindrical Concrete Specimens. West Conshohocken, PA: ASTM International.
ASTM D7015-18 (2018). Standard Practices for Obtaining Intact Block (Cubical and Cylindrical) Samples of Soils. West Conshohocken, PA: ASTM International.
Biolzi, L., Cattaneo, S., and Rosati, G. (2001). Flexural/Tensile Strength Ratio in Rock-like Materials. Rock Mech. Rock Eng. 34, 217–233. doi:10.1007/s006030170010
BS 1377-1 (2016). Methods of Test for Soils for Civil Engineering Purposes-Part 1: General Requirements and Sample Preparation. London: British Standards Institution.
Butenuth, C., De Freitas, M. H., Al-Samahiji, D., Park, H. D., Cosgrove, J. W., and Schetelig, K. (1993). Observations on the Measurement of Tensile Strength Using the Hoop Test. Int. J. Rock Mech. Mining Sci. Geomech. Abstr. 30, 157–162. doi:10.1016/0148-9062(93)90708-L
Coviello, A., Lagioia, R., and Nova, R. (2005). On the Measurement of the Tensile Strength of Soft Rocks. Rock Mech. Rock Eng. 38, 251–273. doi:10.1007/s00603-005-0054-7
Demirdag, S., Tufekci, K., Sengun, N., Efe, T., and Altindag, R. (2019). Determination of the Direct Tensile Strength of Granite Rock by Using a New Dumbbell Shape and its Relationship with Brazilian Tensile Strength. IOP Conf. Ser. Earth Environ. Sci. 221, 012094. doi:10.1088/1755-1315/221/1/012094
Erarslan, N., Liang, Z. Z., and Williams, D. J. (2012). Experimental and Numerical Studies on Determination of Indirect Tensile Strength of Rocks. Rock Mech. Rock Eng. 45, 739–751. doi:10.1007/s00603-011-0205-y
Fairhurst, C. (1961). “Laboratory Measurement of Some Physical Properties of Rock,” in Proceedings of the Fourth Symposium on Rock Mechanics, Pennsylvania, USA, March 1961.
Fairhurst, C. (1964). On the Validity of the 'Brazilian' Test for Brittle Materials. Int. J. Rock Mech. Mining Sci. Geomech. Abstr. 1, 535–546. doi:10.1016/0148-9062(64)90060-9
Fang, H. Y., and Chen, W. F. (1972). “Further Study of Double-Punch Test for Tensile Strength of Soils,” in Proceedings of the Third Southeast Asian Conference on Soil Engineering, Hong Kong, September 1972.
GB/T 23561.10 (2010). Methods for Determining the Physical and Mechanical Properties of Coal and Rock-Part 10: Methods for Determining Tensile Strength of Coal and Rock. Beijing: Standards Press of China.
GB/T 50123-2019 (2019). Standard for Soil Test Method. Ministry of Construction. Beijing: China Planning Press.
GB/T 50266-2013 (2013). Standard for Test Methods of Engineering Rock Mass. Beijing: China Planning Press.
Griffith, A. A. (1921). VI. The Phenomena of Rupture and Flow in Solids. Phil. Trans. R. Soc. Lond. A. 221, 163–198. doi:10.1098/rsta.1921.0006
Gutiérrez-Moizant, R., Ramírez-Berasategui, M., Santos-Cuadros, S., and García-Fernández, C. C. (2020). A Novel Analytical Solution for the Brazilian Test with Loading Arcs. Math. Probl. Eng. 2020, 1–19. doi:10.1155/2020/2935812
Haimson, B. C., and Cornet, F. H. (2003). ISRM Suggested Methods for Rock Stress Estimation-Part 3: Hydraulic Fracturing (HF) And/or Hydraulic Testing of Pre-existing Fractures (HTPF). Int. J. Rock Mech. Mining Sci. 40, 1011–1020. doi:10.1016/j.ijrmms.2003.08.002
Hawkes, I., and Mellor, M. (1970). Uniaxial Testing in Rock Mechanics Laboratories. Eng. Geol. 4, 179–285. doi:10.1016/0013-7952(70)90034-7
He, M. Y., Cao, H. C., and Evans, A. G. (1990). Mixed-mode Fracture: the Four-point Shear Specimen. Acta Metal. Material. 38, 839–846. doi:10.1016/0956-7151(90)90037-h
Hobbs, D. W. (1964). The Tensile Strength of Rocks. Int. J. Rock Mech. Mining Sci. Geomech. Abstr. 1, 385–396. doi:10.1016/0148-9062(64)90005-1
Hooper, J. A. (1971). The Failure of Glass Cylinders in Diametral Compression. J. Mech. Phys. Sol. 19, 179–188. doi:10.1016/0022-5096(71)90027-5
Hudson, J. A., Brown, E. T., and Rummel, F. (1972). The Controlled Failure of Rock Discs and Rings Loaded in Diametral Compression. Int. J. Rock Mech. Mining Sci. Geomech. Abstr. 9, 241–248. doi:10.1016/0148-9062(72)90025-3
Hudson, J. A. (1969). Tensile Strength and the Ring Test. Int. J. Rock Mech. Mining Sci. Geomech. Abstr. 6, 91–97. doi:10.1016/0148-9062(69)90029-1
ISRM (1978). Suggested Methods for Determining Tensile Strength of Rock Materials. Int. J. Rock Mech. Min. Sci. Geomech. Abstr. 15, 99–103. doi:10.1016/0148-9062(78)90003-7
ISRM (1979). Suggested Methods for Determining the Uniaxial Compressive Strength and Deformability of Rock Materials. Int. J. Rock Mech. Min. Sci. Geomech. Abstr. 16, 137–140. doi:10.1016/0148-9062(79)91450-5
Jiang, M., Zhang, F., Hu, H., Cui, Y., and Peng, J. (2014). Structural Characterization of Natural Loess and Remolded Loess under Triaxial Tests. Eng. Geol. 181, 249–260. doi:10.1016/j.enggeo.2014.07.021
Komurlu, E., and Kesimal, A. (2015). Evaluation of Indirect Tensile Strength of Rocks Using Different Types of Jaws. Rock Mech. Rock Eng. 48, 1723–1730. doi:10.1007/s00603-014-0644-3
Kuruppu, M. D., and Funatsu, T. (2012). “Development of a Standard Method for Determining the Plane Strain Fracture Toughness of Rock,” in Proceedings of the Seventh Australasian Congress on Applied Mechanics, Australia, December 2012.
Li, D., and Wong, L. N. Y. (2013). The Brazilian Disc Test for Rock Mechanics Applications: Review and New Insights. Rock Mech. Rock Eng. 46, 269–287. doi:10.1007/s00603-012-0257-7
Li, Y., He, S., Deng, X., and Xu, Y. (2018a). Characterization of Macropore Structure of Malan Loess in NW china Based on 3d Pipe Models Constructed by Using Computed Tomography Technology. J. Asian Earth Sci. 154, 271–279. doi:10.1016/j.jseaes.2017.12.028
Li, Y., Mao, J., Xiang, X., and Mo, P. (2018b). Factors Influencing Development of Cracking-Sliding Failures of Loess across the Eastern Huangtu Plateau of China. Nat. Hazards Earth Syst. Sci. 18, 1223–1231. doi:10.5194/nhess-18-1223-2018
Li, Y., Guan, F., Su, H., Aydin, A., Beroya-Eitner, M. A., and Zachert, H. (2020). A New Direct Tension Test Method for Soils and Soft Rocks. Geotech. Test. J. 43, 20190308–20191334. doi:10.1520/GTJ20190308
Li, Y. (2018). A Review of Shear and Tensile Strengths of the Malan Loess in China. Eng. Geol. 236, 4–10. doi:10.1016/j.enggeo.2017.02.023
Liao, Z. Y., Zhu, J. B., and Tang, C. A. (2019). Numerical Investigation of Rock Tensile Strength Determined by Direct Tension, Brazilian and Three-point Bending Tests. Int. J. Rock Mech. Mining Sci. 115, 21–32. doi:10.1016/j.ijrmms.2019.01.007
Mellor, M., and Hawkes, I. (1971). Measurement of Tensile Strength by Diametral Compression of Discs and Annuli. Eng. Geol. 5, 173–225. doi:10.1016/0013-7952(71)90001-9
Okubo, S., and Fukui, K. (1996). Complete Stress-Strain Curves for Various Rock Types in Uniaxial Tension. Int. J. Rock Mech. Mining Sci. Geomech. Abstr. 33, 549–556. doi:10.1016/0148-9062(96)00024-1
Perras, M. A., and Diederichs, M. S. (2014). A Review of the Tensile Strength of Rock: Concepts and Testing. Geotech. Geol. Eng. 32, 525–546. doi:10.1007/s10706-014-9732-0
Stacey, T. R. (1981). A Simple Extension Strain Criterion for Fracture of Brittle Rock. Int. J. Rock Mech. Mining Sci. Geomech. Abstr. 18, 469–474. doi:10.1016/0148-9062(81)90511-8
Swab, J. J., Yu, J., Gamble, R., and Kilczewski, S. (2011). Analysis of the Diametral Compression Method for Determining the Tensile Strength of Transparent Magnesium Aluminate Spinel. Int. J. Fract. 172, 187–192. doi:10.1007/s10704-011-9655-1
Tapponnier, P., and Brace, W. F. (1976). Development of Stress-Induced Microcracks in Westerly Granite. Int. J. Rock Mech. Mining Sci. Geomech. Abstr. 13, 103–112. doi:10.1016/0148-9062(76)91937-9
Tolooiyan, A., Mackay, R., and Xue, J. (2014). Measurement of the Tensile Strength of Organic Soft Rock. Geotech. Test. J. 37 (6), 20140028. doi:10.1520/GTJ20140028
Xu, S., De Freitas, M. H., and Clarke, B. A. (1988). “The Measurement of Tensile Strength or Rock,” in Proceedings of the Symposium on Rock Mechanics and Power Plants, Spain, September, 1988, 125–132.
Zhang, Q., Duan, K., Xiang, W., Yuan, S., and Jiao, Y.-Y. (2017). Direct Tensile Test on Brittle Rocks with the Newly Developed Centering Apparatus. Geotech. Test. J. 41 (1), 20160301. doi:10.1520/GTJ20160301
Keywords: horizontal compression, tensile strength, test method, test device, soil and soft rocks
Citation: Guan F, Li Y, Gao G, Zachert H, Eichhoff G and Beroya-Eitner MA (2022) Horizontal Compression Test: A Proposed Method for Indirect Determination of Tensile Strength of Stiff Soils and Soft Rocks. Front. Earth Sci. 10:839073. doi: 10.3389/feart.2022.839073
Received: 19 December 2021; Accepted: 11 March 2022;
Published: 28 March 2022.
Edited by:
Fanyu Zhang, Lanzhou University, ChinaCopyright © 2022 Guan, Li, Gao, Zachert, Eichhoff and Beroya-Eitner. This is an open-access article distributed under the terms of the Creative Commons Attribution License (CC BY). The use, distribution or reproduction in other forums is permitted, provided the original author(s) and the copyright owner(s) are credited and that the original publication in this journal is cited, in accordance with accepted academic practice. No use, distribution or reproduction is permitted which does not comply with these terms.
*Correspondence: Yanrong Li, bGkuZGVubmlzQGhvdG1haWwuY29t