 Lejun Lu
 Yu Zhou1,2*
- 1Guangdong Provincial Key Laboratory of Geodynamics and Geohazards, School of Earth Sciences and Engineering, Sun Yat-Sen University, Zhuhai, China
- 2Southern Marine Science and Engineering Guangdong Laboratory (Zhuhai), Zhuhai, China
- 3School of Geospatial Engineering and Science, Sun Yat-Sen University, Zhuhai, China
The frequency of earthquakes on active faults is usually revealed by palaeoseismic trenching and geological dating. Nonetheless, field trenching and sampling are sometimes limited by difficulties in logistics, therefore impeding palaeoseismological studies. As surface rupture earthquakes create fault scarps that evolve with time, they may also provide important information about the timing of earthquakes. In this study, we provide a new approach to determine earthquake history based on the morphology of fault scarps. We select the Muztagh Ata and Tahman normal faults in the Chinese Pamir as a test area, on which fault scarps are well preserved but the earthquake history has not been quantified yet. We first simulate fault scarp degradation using a nonlinear transport model to obtain the empirical relationship between scarp width and its evolution time. We then measure 68 fault scarps from high-resolution topographic data derived from WorldView-2 stereo imagery. The measured fault scarps are clustered in four groups, each group possibly representing one earthquake event. Combining the time-width relationship and scarp width measurements, we infer that four earthquakes occurred at 0.1±0.4 kyrs before the present (BP), 2.1±0.5 kyrs BP, 2.9±0.4 kyrs BP and 4.9±0.5 kyrs BP, respectively. The first event is likely to be the most recent earthquake occurred on the faults, i.e., the 1895 Tashkurgan earthquake ( ∼0.13 kyrs BP). Based on the estimated earthquake recurrence intervals and vertical offsets, we obtain a vertical slip rate of 2.2±0.3 mm/yr on the Muztagh Ata and Tahman faults, conforming to previous geological rate estimates.
1 Introduction
The frequency of earthquakes that have occurred along a fault ultimately determines its seismic potential and is therefore important for hazard assessment. A direct way to reveal the number of surface rupture events is palaeoseismic trenching (Deng and Liao, 1996; Marco et al., 2005; Rockwell and Ben-Zion, 2007), but it is often limited by difficulties in logistics in the field. Since earthquakes are recorded on the earth’s surface in the form of offset geomorphic features, such offsets can be used as an alternative method to characterise repeating earthquakes and fault slip behaviour. Under the assumption that similar-aged offset geomorphic features experienced the same number of earthquakes, offset measurements appear as groups, which can be used as an indicator of repeating earthquakes (Sieh, 1978; McGill and Sieh, 1991). This method, now known as “cumulative offset probability distribution, COPD”, requires a large amount of offset measurements for statistical analysis (e.g., Zielke et al., 2015; Bi et al., 2018). During the last decade, high-resolution remote-sensing data promote the application of the “COPD” method in various places around the world (e.g., Zielke et al., 2010; Klinger et al., 2011; Li et al., 2012; Ren et al., 2016; Bi et al., 2018; Choi et al., 2018). For instance, Zielke et al. (2010) measured 149 offsets along the Carrizo segment of the San Andreas fault using light detection and ranging (LiDAR) data, and identified five peaks (5.3, 9.8, 14.9, 20.1, and 24.5 m, respectively) from the offset measurements, with the first peak corresponding to the slip of the 1857 Mw 7.9 Fort Tejon earthquake. Klinger et al. (2011) measured five slip peaks that are multiples of 6 m along the Fuyun fault in the south of the Altay Mountains, Northeastern Xinjiang, China, based on Quickbird images, and concluded that ruptures on the Fuyun fault exhibits characteristic slip behaviour. Nonetheless, a recent study by Lin et al. (2020) pointed out that the COPD method is only applicable to a few large mature strike-slip faults such as the San Andreas and Fuyun faults.
Surface offsets are important for estimating the magnitude of slip in past earthquakes. Several early studies, e.g., Arrowsmith et al. (1998); Avouac (1993); Colman and Watson (1983); Culling (1960); Jayangondaperumal et al. (2013); Jayangondaperumal et al. (2017), have noted that the morphology of a scarp is useful for constraining the evolution time since its formation. However, previous studies based on the COPD method depend solely on the offset itself, and ignore the shape of the geomorphic features. In this study, we propose a new method to constrain earthquake history by modelling scarp degradation. The method is applied to the Muztagh Ata and Tahman faults in the Chinese Pamir, providing new information about regional earthquake records.
2 Tectonic Background of the Kongur Shan Extensional System
The Pamir, located in the western end of the Indo-Asian collision zone, is a tectonically active region in central Asia (Arnaud et al., 1993; Brunel et al., 1994; Burtman and Molnar, 1993; Cao et al., 2013; Schurr et al., 2014; Sobel et al., 2011) (Figure 1) The deformation of the eastern Pamir is dominated by E-W extension along the Kongur Shan (Robinson et al., 2004; Yuan et al., 2013), a 250-km-long NW-SE-striking fault system, which can be divided into four segments from north to south: the right-lateral strike-slip Muji fault, the Kongur Shan and Muztagh Ata normal faults, the Tahman normal fault, and the Tashkurgan normal fault (Robinson et al., 2004; Thiede et al., 2013).
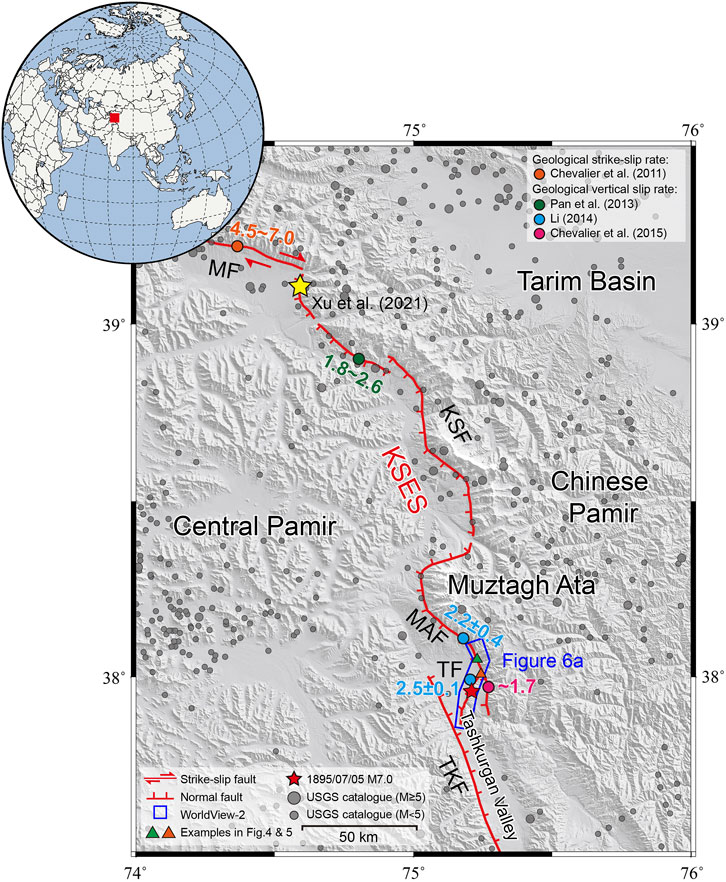
FIGURE 1. Tectonic setting of the Kongur Shan extensional system (KSES). Base map is a 30-m Advanced Land Observing Satellite (ALOS) DEM. Red lines delineate regional active faults, taken from Cao et al. (2013); Robinson et al. (2004); Thiede et al. (2013). MF, Muji fault; KSF, Kongur Shan fault; MAF, Muztagh Ata fault; TF, Tahman fault; TKF, Tashkurgan fault. Coloured dots are the geological slip rates (mm/yr) of faults taken from Chevalier et al. (2015); Pan et al. (2013); Chevalier et al. (2011); Li (2014). Grey dots are historical earthquakes in the region from the USGS earthquake catalogue. Yellow star marks the area where Xu et al. (2021) tested the parameters in the scarp degradation model.
In this study, we focus on the Muztagh Ata and Tahman faults in the southern part of the Kongur Shan extensional system (Figure 1). The Muztagh Ata fault, a 70-km-long NW-SE-striking normal fault, forms the western boundary of the Muztagh Ata Mountain. Chevalier et al. (2015) combined geomorphic analysis and 10Be dating of alluvial terrace risers to determine the late Quaternary vertical slip rate of the southern Muztagh Ata fault. They obtained a rate of ∼1.7 mm/yr, corresponding to a NE-SW extension rate of 1.3–2.0 mm/yr for a fault dip of 35°–45° (Chevalier et al., 2015) (Figure 1). The Tahman fault, extending 20 km north-south, is separated into two segments by a 0.5-km step-over zone (Li et al., 2011). The vertical slip rate was estimated to be 2.5±0.1 mm/yr from 10Be dating of alluvial terraces (Li, 2014) (Figure 1).
Both the Muztagh Ata and Tahman faults have been seismically active since the Quaternary (Yuan et al., 2013; Li, 2014; Chevalier et al., 2015). The USGS earthquake catalogue shows that hundreds of Mw ≥ 2 earthquakes occurred in the region since 1900, including 46 Mw ≥ 5 earthquakes. The largest event that occurred in the Tashkurgan Valley is the 1895/07/05 Ms 7.0 earthquake, which reached a maximum intensity of IX (Li et al., 2011). Up to now, the fault scarps created by the 1895 Ms 7.0 Tashkurgan earthquake are well-preserved along the southern Muztagh Ata and Tahman faults (Li et al., 2011; Chevalier et al., 2015). Nonetheless, due to difficulties in palaeoseismic trenching and sampling in the area, the regional earthquake history remains largely unknown.
3 Modelling Fault Scarp Degradation
The scarps along the Muztagh Ata and Tahman faults are potentially useful for constraining the timing of surface rupture events. We use the well-established scarp degradation model (Culling, 1960, 1963; Kokkalas and Koukouvelas, 2005; Pelletier and Cline, 2007) to analyse the relationship between scarp morphology and its age. The derivation of the model can be found in many studies, (e.g., Andrews and Bucknam, 1987; Roering et al., 1999; Pelletier and Cline, 2007; Xu et al., 2021). Here, we briefly introduce the set-up of the model.
Sediment flux S(x) down surface topography h is related to local slope
where we take a nonlinear diffusion coefficient f(h) that follows the general form (Andrews and Bucknam, 1987; Pelletier and Cline, 2007):
where k is a constant, Sc is the critical slope, n is an empirical exponent, and c is a threshold to limit the maximum ratio between the hillslope and the critical slope Sc.
The continuity equation is used to relate sediment flux and the evolution of topography with time
where ρs and ρr are the bulk densities of sediment and rock, and C0 is the subsidence/uplift rate.
Combining Equations 1–3, and ignoring the subsidence/uplift term ρrC0, we derive the nonlinear model for scarp degradation:
The method is best suitable for normal fault scarps, the shape of which is less affected by gravity. Reliable estimates of the geomorphological parameters in the diffusion model (k, Sc, n, and c) need to be obtained first by local geological survey. Xu et al. (2021) have analysed the fluvial terrace riser degradation along the Kongur Shan fault ( ∼130 km north of our study area, yellow star in Figure 1) in great detail. They tested a variety of parameters in the diffusion model, and obtained the best-fit by comparing the ages derived from morphological modelling to those from geological dating. We use their best-fitting parameters (k = 1, n = 2, c = 0.99, Sc = tan 33°) in our study because the sediment transport processes should be similar given the close distance. The geometry of a scarp at its formation is determined by the initial slope angle and vertical offset. Also, a scarp degrades faster with a steeper slope. The typical vertical offset is associated with earthquake slip. We use an initial slope angle of 35° [average value from Li. (2014)] and a typical vertical offset of 2.5 m from a single event [from Li et al. (2011)].
Using Equation 4, we model the evolution of fault scarp with time. We assume repeating earthquakes every 2 kyrs, i.e., earthquakes occur at 0, 2, 4, 6 kyr with a vertical offset of 2.5 m (Figures 2A,D,G,J). This value is chosen based on the geomorphological dating in Chevalier et al. (2015), which suggests that the oldest geomorphic surface along the Muztagh Ata fault (∼20 kyrs) may have recorded ∼10 large earthquakes. We calculate the slope (first derivative of topography with respect to horizontal distance,
where x is the distance, and σ is an exponential factor to be determined.
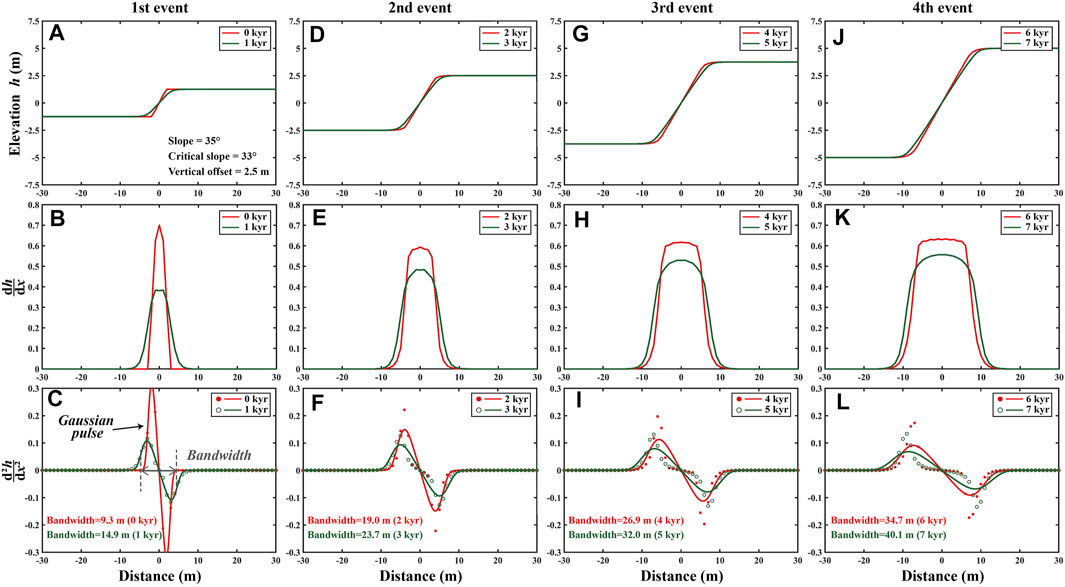
FIGURE 2. Modelling fault scarp degradation. The parameters are: slope = 35°, critical slope = 33°, the vertical offset of a single event = 2.5 m, recurrence interval = 2 kyrs. We calculate the evolution of the fault scarp from 0 to 7 kyrs after its formation. (A–C) The widths at 0 and 1 kyr are 9.3 and 14.9 m, respectively. (D–F) The widths at 2 and 3 kyr are 19.0 and 23.7 m, respectively. (G–I) The widths at 4 and 5 kyr are 26.9 and 32.0 m, respectively. (J–L) The widths at 6 and 7 kyr are 34.7 and 40.1 m, respectively. The width of the fault scarp increases with time.
We use the Gaussian pulse function to define the width of fault scarp: the distance between two points with
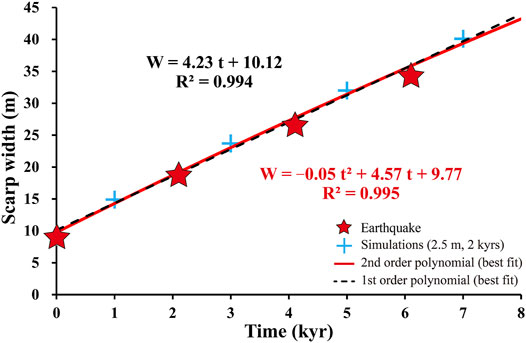
FIGURE 3. Empirical time-width relationship assuming offset = 2.5 m and recurrence interval = 2 kyrs. Black dashed line and red line are the first- and second-order polynomial regressions. Red stars indicate the occurrence of earthquakes.
4 Testing the Sensitivity of Scarp Width to Different Earthquake Slip Modes
To investigate how the initial parameters in the model including earthquake recurrence intervals and offsets affect the time-width relationship, we simulated four different earthquake modes: 1) offset = 2 m, recurrence interval = 2 kyrs; 2) offset = 2.5 m, recurrence interval = 2 kyrs; 3) offset = 2.5 m, recurrence interval = 3 kyrs; 4) offsets = 2.5, 3.5, 2.5, and 1.5 m, with recurrence intervals of 3, 2, and 1 kyr, respectively. The time-width relationships of the four earthquake modes are shown in Figure 4.
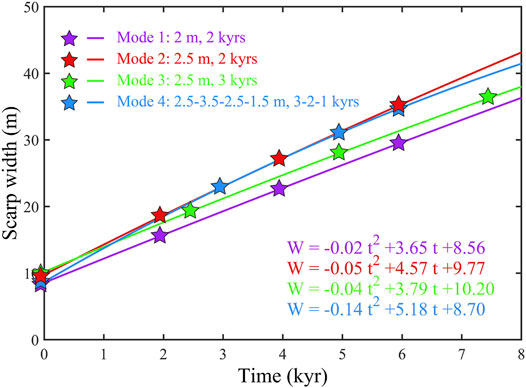
FIGURE 4. Scarp time-width relationships from different earthquake modes. Mode 1 (purple): offset = 2 m, recurrence interval = 2 kyrs. Mode 2 (red): offset = 2.5 m, recurrence interval = 2 kyrs. Mode 3 (green): offset = 2.5 m, recurrence interval = 3 kyrs. Mode 4 (blue): offsets = 2.5, 3.5, 2.5, and 1.5 m, with corresponding recurrence intervals of 3, 2 and 1 kyrs, respectively. Stars indicate the occurrence of earthquakes.
Comparing modes 2 (red line) and 3 (green line), we noted that scarp width increases more rapidly with shorter recurrence intervals. For a scarp width of 35.2 m (the maximum scarp width observed in this study), the inferred ages from modes 2 and 3 are 6.0 kyrs before the present (BP) and 7.1 kyrs BP, respectively. Given that most scarps in our study area are narrower than 30 m, the age uncertainties caused by the initial recurrence interval in the model set-up should be within ∼1 kyr. The difference between modes 1 (purple line) and 2 (red line) in Figure 4 shows that larger offsets create wider scarps. Based on the time-width relationships, the age estimates of the widest scarp (35.2 m) are 7.6 kyrs BP (mode 1) and 6.0 kyrs BP (mode 2).
The actual earthquake rupture history is often more complicated, with different slips and recurrence intervals (Zielke et al., 2015). To test this scenario, we vary the offsets from 1.5 to 3.5 m, and recurrence intervals from 1 kyr to 3 kyrs. Interestingly, the time-width relationship of mode 4 is similar to that from mode 2, the long-term fault slip rates of which are equal (1.25 mm/yr). This means that the change in width of a fault scarp is ultimately determined by the fault slip rate. The simulations also suggest that although the time-width relationship varies with the assumed earthquake offsets and recurrence intervals, the age uncertainty for scarps of narrower than 30 m seems to be less than 1.4 kyr. By analysing a large amount of fault scarps, we may further bring down the uncertainty.
5 Data and Results
5.1 Mapping Fault Scarps From High-Resolution Stereo Data
We purchased 0.5 m resolution WorldView-2 stereo imagery covering a 30 km long segment of the southern Muztagh Ata and Tahman faults to investigate the regional earthquake history, including the 1895 Ms 7.0 Tashkurgan rupture (Figure 1). The Leica Photogrammetry Suite in ERDAS was used to process the stereo imagery. We generated 63 tie points automatically and removed those mismatches, yielding a root-mean-square error of ∼0.1 pixels. A pixel-by-pixel matching procedure was performed to produce a dense point cloud with a search window size of 5×5 pixels (Zhou et al., 2015). The extracted point cloud was then gridded with 1-m spacing to derive the WorldView-2 digital elevation model (DEM) (coordinate system: WGS84 UTM 43 N). The WorldView-2 images were then orthorectified using the 1-m DEM.
Based on the WorldView-2 orthoimage and DEM, we mapped a 26-km-long fault trace (Figure 6A). We extracted elevation stacking profiles (20-m wide, 100-m long) across the mapped fault scarps (Figures 5A,B,E,F for example). To make sure that the offsets are estimated correctly, we removed those profiles that cross different geomorphic surfaces (Bi et al., 2018). We measured the offsets by fitting two straight lines to each side of the fault, and calculated the minimum and maximum distances between the two lines (see Figures 5C,G for example). A total of 68 vertical offsets ranging from 1.2 to 14.8 m were obtained (Figure 6E and Table 1).
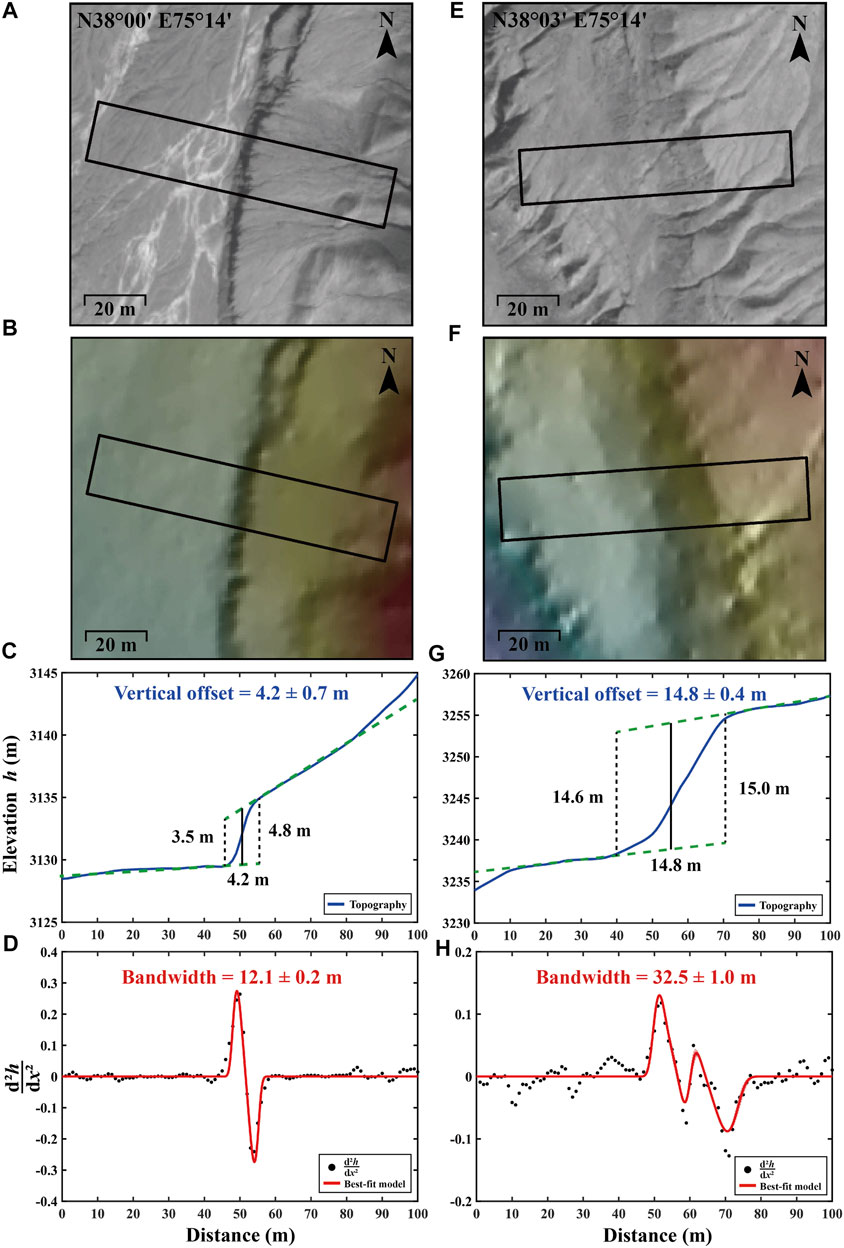
FIGURE 5. Examples of scarp width calculation. (A) WorldView-2 panchromatic orthoimage. (B) Shaded WorldView-2 DEM of the scarp. The polygon shows the swath profile. (C) Estimating the vertical offset of the scarp. Blue solid line shows the topography across the scarp. Green lines are the best-fitting straight lines to each side of the scarp that are used to calculate the vertical offsets. (D) Estimating the scarp width by a single Gaussian pulse. Black dots trace the
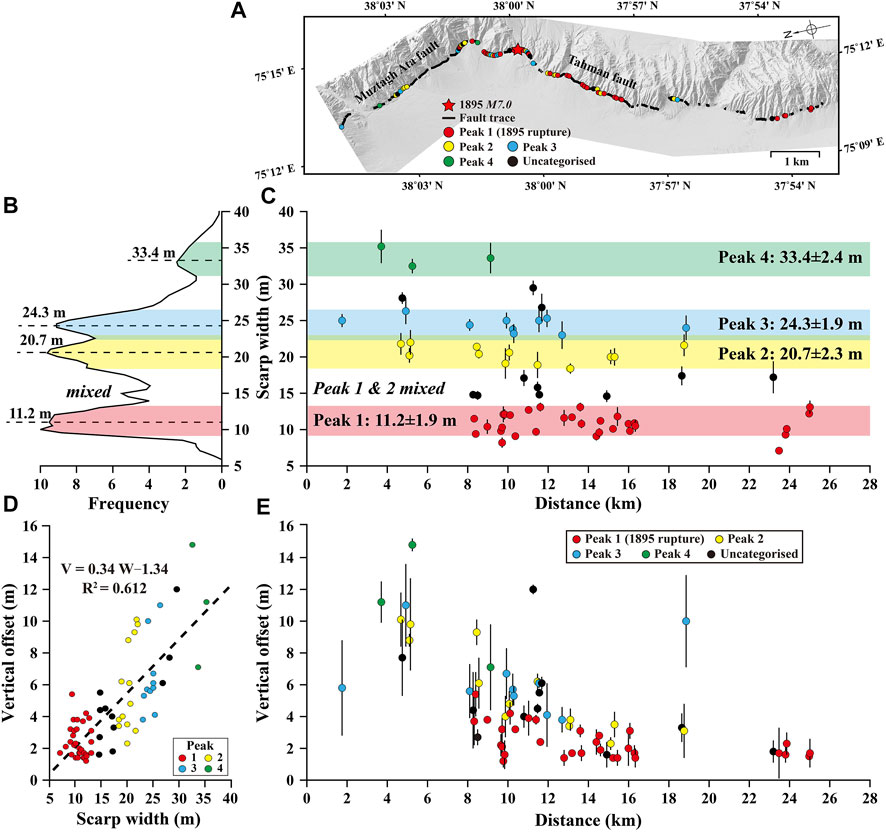
FIGURE 6. Scarp width probability distribution (SWPD) and cumulative offset probability distribution (COPD). (A) WorldView-2 DEM shows the fault trace (black solid lines). Coloured dots are the locations of the scarp measurements. Red star marks the epicentre of the 1895 earthquake, inferred by Li et al. (2011). (B) SWPD of the southern Muztagh Ata and Tahman faults, showing four peaks at 11.2, 20.7, 24.3 and 33.4 m. (C) The distribution of scarp width along the faults. Measurements (with 1-σ) are clustered in four groups (11.2±1.9, 20.7±2.3, 24.3±1.9 and 33.4±2.4 m). (D) The empirical width-offset relationship. (E) Along-fault distribution of vertical offsets.
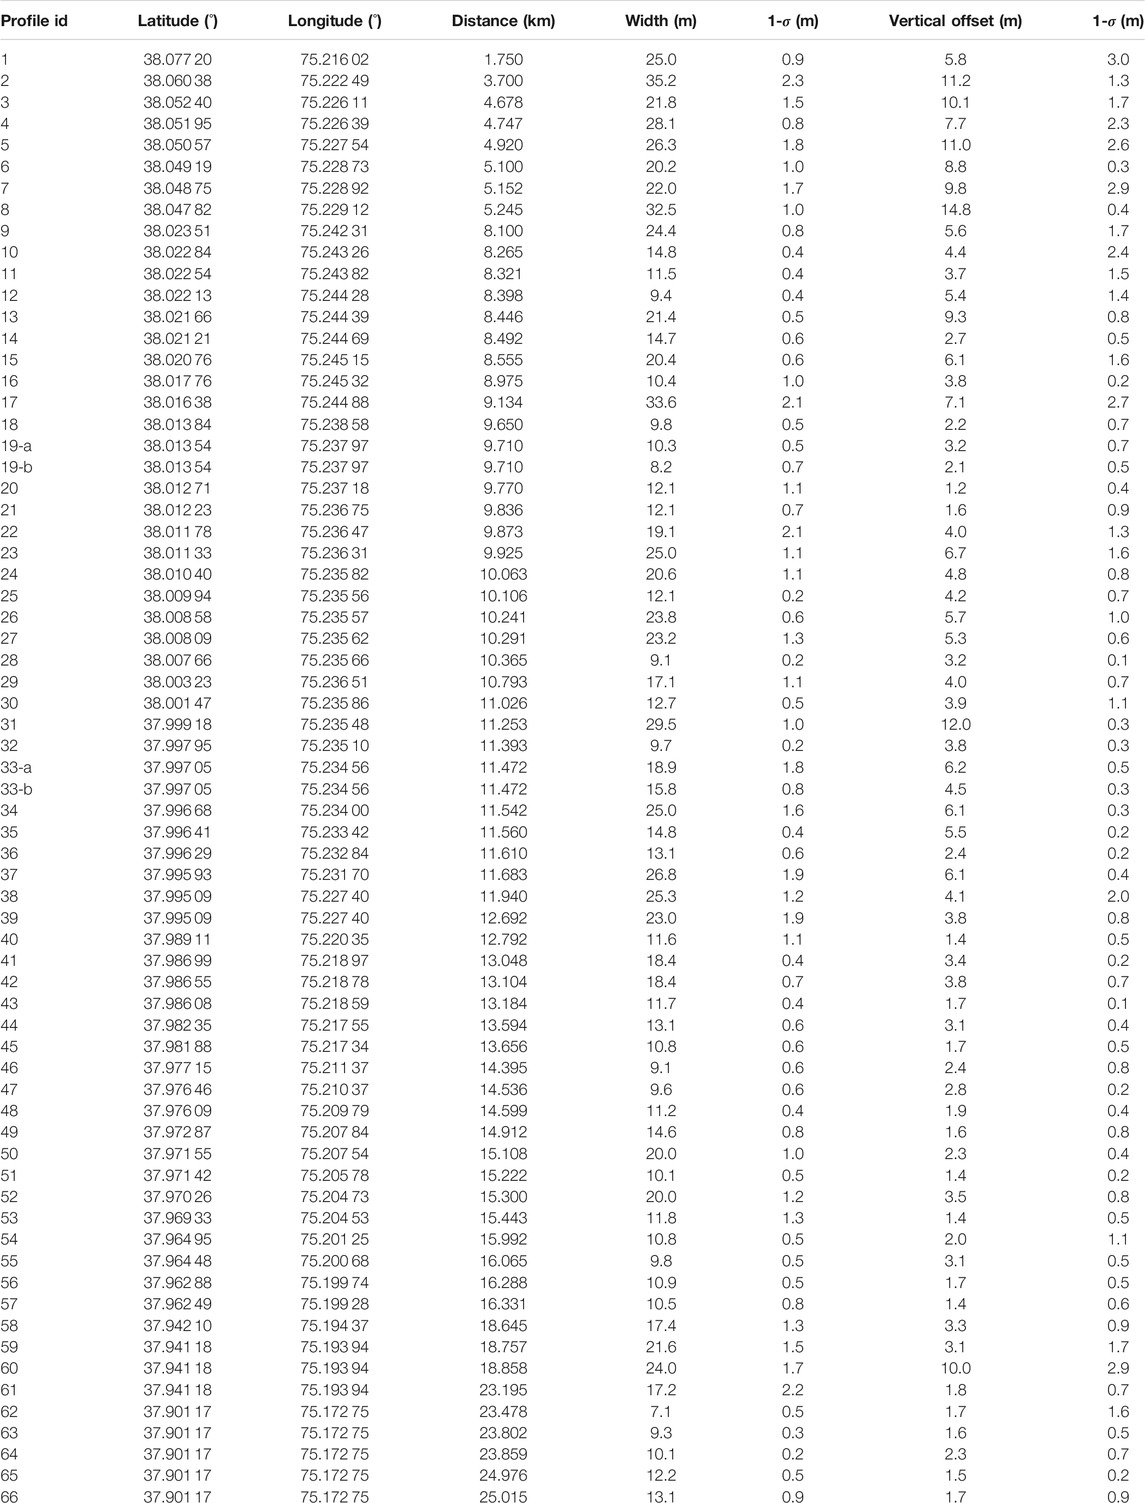
TABLE 1. Measurements of 68 fault scarps. Profiles 8 and 25 are the selected examples shown in Figure 5.
5.2 Calculating Scarp Width
Based on the elevation stacking profiles extracted from the WorldView-2 DEM, we calculated
where a1, b1, σ1, a2, b2 and σ2 are the coefficients that can be determined by fitting the equation to the profile.
After solving for the best-fitting pulse function using a least-squares adjustment, we compute the widths of all the scarps along the faults (see Figures 5D,H for example). The scarp widths range from 7.1 to 35.2 m (Figure 6C). We use 1-σ as the uncertainty of the width estimates.
5.3 Probability Density Function of Scarp Widths
We calculated the scarp width probability distribution (SWPD) by summing up the Gaussian probability density of the 68 width measurements. The peak value and uncertainty (1-σ) are determined by applying a normal distribution function. As shown in Figures 6B,C, the SWPD shows four peaks centred at 11.2±1.9, 20.7±2.3, 24.3±1.9 and 33.4±2.4 m, respectively, indicating that the widths are clustered in four groups. If we assume that the scarps have experienced similar sediment transport processes, the clustering implies that each group of scarps may have been formed at the same time, possibly during the same earthquake. We calculated the ages of the four peaks of scarp widths from our initial empirical time-width relationship (Figure 3) and obtained: 0.3±0.4 kyrs BP (peak 1), 2.5±0.5 kyrs BP (peak 2), 3.3±0.5 kyrs BP (peak 3) and 5.5±0.6 kyrs BP (peak 4), respectively (red markers in Figure 7A).
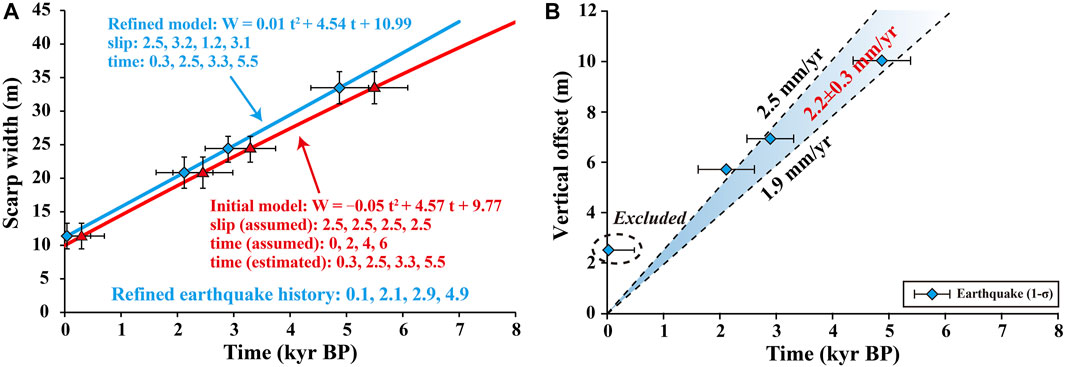
FIGURE 7. Earthquake history and vertical slip rate of the Muztagh Ata and Tahman faults. (A) The corresponding ages of the four peaks in SWPD. Red line is the initial model with assumed offset = 2.5 m and recurrence interval = 2 kyrs. Blue line is the refined model with constraints from the initial model (occurrence time: 0.3, 2.5, 3.3, 5.5 yrs BP and offsets: 2.5, 3.2, 1.2, 3.1 m). (B) Estimating vertical slip rate from the inferred earthquake history using the refined model.
6 Discussion
6.1 Earthquake History on the Muztagh Ata and Tahman Faults
Given that the parameters in the initial time-width relationship (recurrence interval = 2 kyrs and characteristic slip = 2.5 m) are to some extent random, we refine the relationship using the estimated earthquake timing derived from the initial model. Also, we find that the vertical offsets increase linearly with scarp widths (Figure 6D), allowing us to estimate the average vertical slip of each earthquake for a given scarp width. With the new constraints on slip and timing, we refined the scarp degradation model (Figure 7A) and obtained four new ages: 0.1±0.4 kyrs BP, 2.1±0.5 kyrs BP, 2.9±0.4 kyrs BP and 4.9±0.5 kyrs BP, respectively. The refined model shows a good consistency with the initial model, with a difference of
The SWPD reveals four earthquakes along the southern Muztagh Ata and Tahman faults in the past 6,000 years. The inferred most recent event (∼0.1 kyrs BP) is likely to be the 1895 Tashkurgan rupture (∼0.13 kyrs BP). We use the ages and offsets from the SWPD to estimate the fault slip rate. We excluded the most recent event as it will lead to an overestimate. We obtained a vertical slip rate of 2.2±0.3 mm/yr for the Muztagh Ata and Tahman faults (Figure 7B), in agreement with previous geological estimates of 1.7–2.5 mm/yr from Chevalier et al. (2015) and Li. (2014).
6.2 Distribution of Vertical Displacements Along the Fault and Fault Segmentation
The vertical offsets that we obtained along the fault trace are a mixture of slip from the 1895 Tashkurgan earthquake and older events. Because the scarps formed during the most recent event should have a relatively narrow width given the shorter evolution time, we use this as a criterion to distinguish the 1895 rupture from older ruptures. We considered the scarps with a width of less than 13.1 m as the 1895 rupture and plotted the measurements in red in Figure 6E. We found that the slip of the 1895 earthquake is concentrated along the Tahman fault (between 8–26 km). The average vertical displacement of the 1895 rupture is 2.4±1.2 m (1-σ) (consistent with our initial assumption of 2.5-m characteristic slip) with a maximum displacement of 5.5±0.2 m (1-σ). According to the empirical relationships between the moment magnitude and each of the maximum and average displacements in Wells and Coppersmith. (1994), we obtained Mw 7.2 and Mw 7.3 for the 1895 Tashkurgan earthquake, respectively.
Slip distributions depicted by Figures 6A,C,E manifest a remarkable feature of fault rupture segmentation. The surface ruptures associated with the 1895 Tashkurgan earthquake distribute only along the North-northeast-trending Tahman fault. No evident fresh scarps has been found along the North-northwest-trending Muztagh Ata fault. Although old scarps may also record the most recent rupture, it would be extraordinary that earthquake propagates along the entire fault segment without any fresh scarps. Therefore, it is likely that the intersection region acts as a fault segmentation boundary that impedes earthquake rupture from one fault segment to another (Schwartz and Coppersmith, 1984). The Tahman fault seems to have experienced less earthquake events than the Muztagh Ata fault as most of the high and wide fault scarps are present along the Muztagh Ata fault (Figures 6C,E), suggesting different behaviours of different fault segments.
7 Conclusion
In this study, we proposed a new approach of using fault scarp degradation model to constrain earthquake history, with applications to the Muztagh Ata and Tahman faults in the Chinese Pamir. We mapped fault scarps based on WorldView-2 stereo imagery and determined the widths of the scarps using a modified Gaussian pulse function. The measurements show that the widths of the scarps are clustered in four groups, each group representing a surface rupture event. Given the empirical time-width relationship, we calculated the timing of the earthquakes, with the youngest cluster, 0.1±0.4 kyrs BP, corresponding to the 1895 Tashkurgan earthquake. Based on the inferred earthquake recurrence intervals and offsets, we estimated the vertical slip rate (2.2±0.3 mm/yr) of the Muztagh and Tahman faults, in agreement with the geological estimates of 1.7–2.5 mm/yr from Chevalier et al. (2015); Li. (2014). The consistent results suggest that the proposed method provides an innovative means for investigating earthquake history and can be potentially applied to other active faults where surface scarps are well-preserved.
Data Availability Statement
The original contributions presented in the study are included in the article/Supplementary Material, further inquiries can be directed to the corresponding author.
Author Contributions
LL and YZ conceptualised and designed the research. LL performed the simulations, processed and analysed the data. YZ was responsible for the overall supervision of the data processing and analysis. The manuscript was drafted by LL and then reviewed and edited by YZ, PZ, and XC.
Funding
This work was supported by the Second Tibetan Plateau Scientific Expedition and Research Program (STEP) (2019QZKK0901), National Natural Science Foundation of China (41874020), Guangdong Province Introduced Innovative R&D Team of Geological Processes and Natural Disasters around the South China Sea (2016ZT06N331) and Deep Earth Exploration and Resource Environment (2017ZT07Z066).
Conflict of Interest
The authors declare that the research was conducted in the absence of any commercial or financial relationships that could be construed as a potential conflict of interest.
Publisher’s Note
All claims expressed in this article are solely those of the authors and do not necessarily represent those of their affiliated organizations, or those of the publisher, the editors and the reviewers. Any product that may be evaluated in this article, or claim that may be made by its manufacturer, is not guaranteed or endorsed by the publisher.
References
Andrews, D. J., and Bucknam, R. C. (1987). Fitting Degradation of Shoreline Scarps by a Nonlinear Diffusion Model. J. Geophys. Res. 92, 12857–12867. doi:10.1029/JB092iB12p12857
Arnaud, N. O., Brunel, M., Cantagrel, J. M., and Tapponnier, P. (1993). High Cooling and Denudation Rates at Kongur Shan, Eastern Pamir (Xinjiang, China) Revealed by 40Ar/39Ar Alkali Feldspar Thermochronology. Tectonics 12, 1335–1346. doi:10.1029/93TC00767
Arrowsmith, J. R., Rhodes, D. D., and Pollard, D. D. (1998). Morphologic Dating of Scarps Formed by Repeated Slip Events along the San Andreas Fault, Carrizo Plain, California. J. Geophys. Res. 103, 10141–10160. doi:10.1029/98JB00505
Avouac, J.-P. (1993). Analysis of Scarp Profiles: Evaluation of Errors in Morphologic Dating. J. Geophys. Res. 98, 6745–6754. doi:10.1029/92JB01962
Bi, H., Zheng, W., Ge, W., Zhang, P., Zeng, J., and Yu, J. (2018). Constraining the Distribution of Vertical Slip on the South Heli Shan Fault (Northeastern Tibet) from High-Resolution Topographic Data. J. Geophys. Res. Solid Earth 123, 2484–2501. doi:10.1002/2017JB014901
Brunel, M., Arnaud, N., Tapponnier, P., Pan, Y., and Wang, Y. (1994). Kongur Shan normal Fault: Type Example of Mountain Building Assisted by Extension (Karakoram Fault, Eastern Pamir). Geol. 22, 707–710. doi:10.1130/0091-7613(1994)022<0707:ksnfte>2.3.co;2
Burtman, V. S., and Molnar, P. H. (1993). Geological and Geophysical Evidence for Deep Subduction of continental Crust beneath the Pamir. Geol. Soc. America 281, 1–76. doi:10.1130/spe281-p1
Cao, K., Bernet, M., Wang, G.-C., van der Beek, P., Wang, A., Zhang, K.-X., et al. (2013). Focused Pliocene-Quaternary Exhumation of the Eastern Pamir Domes, Western China. Earth Planet. Sci. Lett. 363, 16–26. doi:10.1016/j.epsl.2012.12.023
Chevalier, M.-L., Li, H., Pan, J., Pei, J., Wu, F., Xu, W., et al. (2011). Fast Slip-Rate along the Northern End of the Karakorum Fault System, Western Tibet. Geophys. Res. Lett. 38, a–n. doi:10.1029/2011GL049921
Chevalier, M.-L., Pan, J., Li, H., Liu, D., and Wang, M. (2015). Quantification of Both normal and Right-Lateral Late Quaternary Activity along the Kongur Shan Extensional System, Chinese Pamir. Terra Nova 27, 379–391. doi:10.1111/ter.12170
Choi, J.-H., Klinger, Y., Ferry, M., Ritz, J.-F., Kurtz, R., Rizza, M., et al. (2018). Geologic Inheritance and Earthquake Rupture Processes: The 1905 M ≥ 8 Tsetserleg-Bulnay Strike-Slip Earthquake Sequence, Mongolia. J. Geophys. Res. Solid Earth 123, 1925–1953. doi:10.1002/2017JB013962
Colman, S. M., and Watson, K. (1983). Ages Estimated from a Diffusion Equation Model for Scarp Degradation. Science 221, 263–265. doi:10.1126/science.221.4607.263
Culling, W. E. H. (1963). Soil Creep and the Development of hillside Slopes. J. Geology. 71, 127–161. doi:10.1086/626891
Deng, Q., and Liao, Y. (1996). Paleoseismology along the Range-Front Fault of Helan Mountains, north central China. J. Geophys. Res. 101, 5873–5893. doi:10.1029/95jb01814
Jayangondaperumal, R., Daniels, R. L., and Niemi, T. M. (2017). A Paleoseismic Age Model for Large-Magnitude Earthquakes on Fault Segments of the Himalayan Frontal Thrust in the central Seismic gap of Northern india. Quat. Int. 462, 130–137. doi:10.1016/j.quaint.2017.04.008
Jayangondaperumal, R., Mugnier, J. L., and Dubey, A. K. (2013). Earthquake Slip Estimation from the Scarp Geometry of Himalayan Frontal Thrust, Western Himalaya: Implications for Seismic hazard Assessment. Int. J. Earth Sci. (Geol Rundsch) 102, 1937–1955. doi:10.1007/s00531-013-0888-2
Klinger, Y., Etchebes, M., Tapponnier, P., and Narteau, C. (2011). Characteristic Slip for Five Great Earthquakes along the Fuyun Fault in China. Nat. Geosci 4, 389–392. doi:10.1038/NGEO1158
Kokkalas, S., and Koukouvelas, I. K. (2005). Fault-scarp Degradation Modeling in central Greece: The Kaparelli and Eliki Faults (Gulf of Corinth) as a Case Study. J. Geodynamics 40, 200–215. doi:10.1016/j.jog.2005.07.006
Li, H., Van der Woerd, J., Sun, Z., Si, J., Tapponnier, P., Pan, J., et al. (2012). Co-seismic and Cumulative Offsets of the Recent Earthquakes along the Karakax Left-Lateral Strike-Slip Fault in Western Tibet. Gondwana Res. 21, 64–87. doi:10.1016/j.gr.2011.07.025
Li, W. (2014). Active Tectonics and strong Earthquakes in Tashkurgan Valley in the Northeastern Pamir Plateau. Recent Dev. World Seismology 8, 35–41. (in Chinese). doi:10.3969/j.issn.0235-4975.2014.08.007
Li, W., Chen, J., Yuan, Z., Huang, M., Li, T., Yu, S., et al. (2011). Coseismic Surface Ruptures of Multi Segments and Seismogenic Fault of the Tashkorgan Earthquake in Pamir, 1895. Seismology Geology. (in Chinese) 33, 260–276. doi:10.3969/j.issn.0253-4967.2011.02.002
Lin, Z., Liu-Zeng, J., Weldon, R. J., Tian, J., Ding, C., and Du, Y. (2020). Modeling Repeated Coseismic Slip to Identify and Characterize Individual Earthquakes from Geomorphic Offsets on Strike-Slip Faults. Earth Planet. Sci. Lett. 545, 116313. doi:10.1016/j.epsl.2020.116313
Marco, S., Rockwell, T., Heimann, A., Frieslander, U., and Agnon, A. (2005). Late Holocene Activity of the Dead Sea Transform Revealed in 3D Palaeoseismic Trenches on the Jordan Gorge Segment. Earth Planet. Sci. Lett. 234, 189–205. doi:10.1016/j.epsl.2005.01.017
McGill, S. F., and Sieh, K. (1991). Surficial Offsets on the central and Eastern Garlock Fault Associated with Prehistoric Earthquakes. J. Geophys. Res. 96, 21597–21621. doi:10.1029/91JB02030
Pan, J., Li, H., Chevalier, M., Liu, D., Sun, Z., Pei, J., et al. (2013). Holocene Slip Rate along the Northern Kongur Shan Extensional System: Insights on the Large Pull-Apart Structure in the NE Pamir. AGU Fall Meet. Abstr. 2013, T31A–T2495.
Pelletier, J. D., and Cline, M. L. (2007). Nonlinear Slope-dependent Sediment Transport in Cinder Cone Evolution. Geol 35, 1067–1070. doi:10.1130/G23992A.1
Ren, Z., Zhang, Z., Chen, T., Yan, S., Yin, J., Zhang, P., et al. (2016). Clustering of Offsets on the Haiyuan Fault and Their Relationship to Paleoearthquakes. Geol. Soc. America Bull. 128, B311551–18. doi:10.1130/B31155.1
Robinson, A. C., Yin, A., Manning, C. E., Harrison, T. M., Zhang, S.-H., and Wang, X.-F. (2004). Tectonic Evolution of the Northeastern Pamir: Constraints from the Northern Portion of the Cenozoic Kongur Shan Extensional System, Western China. Geol. Soc. America Bull. 116, 953–973. doi:10.1130/B25375.1
Rockwell, T. K., and Ben-Zion, Y. (2007). High Localization of Primary Slip Zones in Large Earthquakes from Paleoseismic Trenches: Observations and Implications for Earthquake Physics. J. Geophys. Res. 112. doi:10.1029/2006JB004764
Roering, J. J., Kirchner, J. W., and Dietrich, W. E. (1999). Evidence for Nonlinear, Diffusive Sediment Transport on Hillslopes and Implications for Landscape Morphology. Water Resour. Res. 35, 853–870. doi:10.1029/1998WR900090
Schurr, B., Ratschbacher, L., Sippl, C., Gloaguen, R., Yuan, X., and Mechie, J. (2014). Seismotectonics of the Pamir. Tectonics 33, 1501–1518. doi:10.1002/2014TC003576
Schwartz, D. P., and Coppersmith, K. J. (1984). Fault Behavior and Characteristic Earthquakes: Examples from the Wasatch and San Andreas Fault Zones. J. Geophys. Res. 89, 5681–5698. doi:10.1029/JB089iB07p05681
Sieh, K. E. (1978). Slip along the San Andreas Fault Associated with the Great 1857 Earthquake. Bull. Seismological Soc. America 68, 1421–1448. doi:10.1785/BSSA0680051421
Sobel, E. R., Schoenbohm, L. M., Chen, J., Thiede, R., Stockli, D. F., Sudo, M., et al. (2011). Late Miocene-Pliocene Deceleration of Dextral Slip between Pamir and Tarim: Implications for Pamir Orogenesis. Earth Planet. Sci. Lett. 304, 369–378. doi:10.1016/j.epsl.2011.02.012
Thiede, R. C., Sobel, E. R., Chen, J., Schoenbohm, L. M., Stockli, D. F., Sudo, M., et al. (2013). Late Cenozoic Extension and Crustal Doming in the India-Eurasia Collision Zone: New Thermochronologic Constraints from the NE Chinese Pamir. Tectonics 32, 763–779. doi:10.1002/tect.20050
Wells, D. L., and Coppersmith, K. J. (1994). New Empirical Relationships Among Magnitude, Rupture Length, Rupture Width, Rupture Area, and Surface Displacement. Bull. seismological Soc. America 84, 974–1002. doi:10.1785/BSSA0840040974
Xu, J., Arrowsmith, J. R., Chen, J., Schoenbohm, L. M., Li, T., Yuan, Z., et al. (2021). Evaluating Young Fluvial Terrace Riser Degradation Using a Nonlinear Transport Model: Application to the Kongur normal Fault in the Pamir, Northwest China. Earth Surf. Process. Landforms 46, 280–295. doi:10.1002/esp.5022
Yuan, Z., Chen, J., Owen, L. A., Hedrick, K. A., Caffee, M. W., Li, W., et al. (2013). Nature and Timing of Large Landslides within an Active Orogen, Eastern Pamir, China. Geomorphology 182, 49–65. doi:10.1016/j.geomorph.2012.10.028
Zhou, Y., Parsons, B., Elliott, J. R., Barisin, I., and Walker, R. T. (2015). Assessing the Ability of Pleiades Stereo Imagery to Determine Height Changes in Earthquakes: A Case Study for the El Mayor‐Cucapah Epicentral Area. J. Geophys. Res. Solid Earth 120, 8793–8808. doi:10.1002/2015JB012358
Zielke, O., Arrowsmith, J. R., Ludwig, L. G., and Akçiz, S. O. (2010). Slip in the 1857 and Earlier Large Earthquakes along the Carrizo Plain, San Andreas Fault. Science 327, 1119–1122. doi:10.1126/science.1182781
Keywords: scarp degradation modelling, scarp width, Muztagh Ata and Tahman faults, earthquake history, 1895 earthquake, Chinese pamir
Citation: Lu L, Zhou Y, Zhang P and Cheng X (2022) Modelling Fault Scarp Degradation to Determine Earthquake History on the Muztagh Ata and Tahman Faults in the Chinese Pamir. Front. Earth Sci. 10:838866. doi: 10.3389/feart.2022.838866
Received: 18 December 2021; Accepted: 18 February 2022;
Published: 09 March 2022.
Edited by:
Daoyang Yuan, Lanzhou University, ChinaReviewed by:
Shimin Zhang, Ministry of Emergency Management, ChinaR. Jayangonda Perumal, Wadia Institute of Himalayan Geology, India
Copyright © 2022 Lu, Zhou, Zhang and Cheng. This is an open-access article distributed under the terms of the Creative Commons Attribution License (CC BY). The use, distribution or reproduction in other forums is permitted, provided the original author(s) and the copyright owner(s) are credited and that the original publication in this journal is cited, in accordance with accepted academic practice. No use, distribution or reproduction is permitted which does not comply with these terms.
*Correspondence: Yu Zhou, emhvdXl1MzZAbWFpbC5zeXN1LmVkdS5jbg==