 Yiwei Ren
 Qiang Yuan
 Yanfei Kang1,2*
 Deyi Jiang
- 1State Key Laboratory of Coal Mine Disaster Dynamics and Control, Chongqing University, Chongqing, China
- 2Technology Innovation Center of Geohazards Automatic Monitoring, Ministry of Natural Resources, Chongqing Engineering Research Center of Automatic Monitoring for Geological Hazards, Chongqing, China
- 3Shanghai Jianke Engineering Consulting Co., Ltd., Shanghai, China
Salt rock is recognized as one of the most suitable parent rocks for geological disposal of high level radioactive waste due to its low permeability, good ductility, good thermal conductivity and damage self-healing properties. The thermal conductivity of salt rock directly affects the temperature of disposal storage and surrounding rock, high temperature will lead to a series of problems such as nuclear waste storage tank rupture, mechanical and permeability reduction of surrounding rock. In this paper, the thermal conductivity, specific heat and thermal diffusion coefficient of NaCl single crystal made by crystallization method in the laboratory and polycrystalline salt rock from Khewra salt mine were measured in the range of 22–240°C by the transient plane source method. The results showed that the thermal conductivity and thermal diffusivity of salt rock decrease gradually with the increase of temperature, while the specific heat capacity increases with the increase of temperature. The thermal conductivity of salt rock is slightly lower than that of single-crystal NaCl. The reason for this phenomenon may be that there are a few pores in salt rock. Based on the experimental data, the models of thermal conductivity, thermal diffusivity and specific heat of salt rock with temperature were established. The results can provide a reference for the construction of underground salt rock high-level radioactive waste disposal repository. Based on the thermal conductivity model of polycrystalline salt rock established in this paper, the temperature field evolution during the operation of the underground salt rock high-level nuclear waste repository in 1,000 years was studied. It was found that the temperature of the glass solidified of high-level radioactive waste reached the highest (177.6°C) and then dropped rapidly. The decay heat radiation influence radius of the nuclear waste reaches its maximum in about 50 years of operation of the repository and then gradually decreases.
1. Introduction
Salt rock is internationally recognized as one of the best geological media for oil and gas storage and hazardous waste isolation because of its excellent quality, such as low porosity (Chen et al., 2016), low permeability (Popp et al., 2012), good rheology (Fan et al., 2019; Fan et al., 2020) water-soluble mining (Li et al., 2015) and excellent damage self-healing ability (Chen et al., 2018; Kang et al., 2019). At present, underground salt rock caverns have been widely used in the underground storage construction of oil (Costa et al., 2015) and natural gas (Schiebahn et al., 2015; Chen et al., 2020). The applications of underground salt rock caverns in hydrogen (Liu et al., 2016) underground storage and compressed air energy storage (CAES) (Chen et al., 2017) are in research stage. Moreover, salt rock is also one of the main target strata for the construction of underground high-level nuclear waste disposal repository. Germany and the United States have carried out a lot of research on the construction of high level nuclear waste disposal repository in underground salt rock (Ge, 2011). Spain, Netherlands and Denmark are planning to use salt rock as the parent rock for underground nuclear waste disposal repository (Bechthold et al., 2004).
The thermal conductivity of salt rock is one of the important issues for the design and performance evaluation of the underground salt rock high level nuclear waste disposal repository, as well as the temperature field evolution of surrounding rock of natural gas storage and CAES in salt rock during the long-term injection and production. Some studies have shown that due to the factors such as the compression work of storage media (natural gas, air and hydrogen) in the salt cavern (Figure 1A), the temperature of the surrounding rock of the salt cavern would gradually increase, for example, the surrounding rock temperature of the CAES would rise to 80–90°C (Vollaro et al., 2015). In the underground salt rock high-level nuclear waste repository (Figure 1B), due to the decay and heat release of nuclear waste and other factors, the temperature of the surrounding rock of the disposal chamber will be higher, even more than 200°C (Blanco-Martín et al., 2016). The increase of the surrounding rock temperature will affect the mechanical properties and permeability of salt cavern surrounding rock and threaten the safety of reservoir (Kang et al., 2021). Therefore, it is of great engineering significance to clarify the thermal conductivity of salt rock and accurately predict the evolution of the surrounding rock temperature field of underground salt rock storage and disposal.
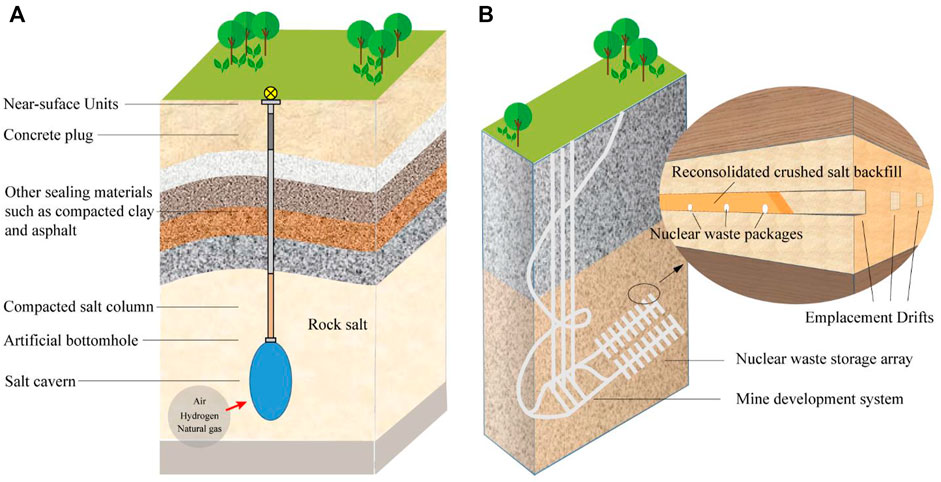
FIGURE 1. Schematic diagram of underground engineering facilities in salt rock (Kang et al., 2021). (A) Salt cavern is used to store natural gas, compressed air, hydrogen, etc.; (B) Schematic diagram of underground salt rock high-level nuclear waste repository and reconsolidated crushed salt as backfill material.
Another important significance of clarifying the thermal conductivity of salt rock is to realize the accurate modeling of the thermal conductivity of reconsolidated crushed salt (Figure 1B). Reconsolidated crushed salt is the most commonly used backfill material in underground salt rock high-level nuclear waste repository, and its thermal conductivity is also an important factor affecting the evolution of the temperature field of nuclear waste repository. The thermal conductivity of reconsolidated crushed salt is related to the degree of consolidation of crushed salt and ambient temperature. Establishing an effective thermal conductivity model for reconsolidated salt is the main way to accurately describe the thermal conductivity of backfill materials (Bauer and Urquhart, 2016). As a heterogeneous material composed of air and salt rock, the thermal conductivity of air and salt rock is the basis for establishing the effective thermal conductivity model of reconsolidated crushed salt. At present, the thermal characteristic parameters such as thermal conductivity, thermal diffusion coefficient and specific heat capacity of air have been widely studied and clearly understood (Paneru et al., 2018). Therefore, the accuracy of the thermal conductivity of the salt rock is the main factor that determines the accuracy of the reconsolidated crushed salt effective thermal conductivity model.
The thermal conductivity of salt rock is an important parameter in evaluating the underground salt rock high level nuclear waste disposal repository and monitoring the temperature field evolution of surrounding rock of natural gas storage and CAES in salt rock. However, it is difficult to prepare the actual salt rock sample with small size (diameter less than 10 mm) in accordance with the requirements of conventional thermal parameter test method, as the actual salt rock in the formation is brittle when the size is small. As a result, the thermal parameters of the salt rock are usually replaced by NaCl single crystals in previous studies (Urquhart and Bauer, 2015). Different from NaCl single crystal, naturally deposited salt rocks in the stratum usually show polycrystalline structure (Desbois et al., 2012). Simply using the thermal parameters of NaCl single crystal instead of salt rock will cause a certain deviation during the evolution of surrounding rock temperature field of underground salt rock facilities, as well as affect the accuracy of effective thermal conductivity modeling of reconsolidated crushed salt. Therefore, it is necessary to test the thermal conductivity of polycrystalline salt rock in formation.
In this paper, the thermal parameters of polycrystalline salt rock from Khewra salt mine in Pakistan, which represent most salt dome deposits were tested. The variation of thermal conductivity, thermal diffusivity and specific heat with temperature of polycrystalline salt rock was clarified. The differences of thermal parameters between polycrystalline salt rock and NaCl single crystal were revealed. The study provided basic data for the prediction of temperature field evolution of the surrounding rock and the establishment of a thermal conductivity model of backfill materials. The test data in this paper could improve the accuracy of temperature field evolution prediction of the surrounding rock and effective thermal conductivity model of backfill material.
2. Materials and Methods
2.1 Experiment Materials
The purposes of this paper were to test the thermal parameters of polycrystalline salt rock in actual salt structure, including thermal conductivity, thermal diffusivity and specific heat, and to reveal the differences in thermal parameters between polycrystalline salt rock and NaCl single crystal. Therefore, two kinds of specimens were prepared in our tests: NaCl single crystals and high-purity polycrystalline salt rock.
(1) NaCl Single Crystal
The NaCl single crystal specimen was prepared in the laboratory by the crystallization growth method. The lattice constant of the sample is 5.642 A and the density is 2.16 g/cm3. The NaCl single crystal was processed into a rectangular shape of 10 × 10 × 2 mm, and the upper and lower surfaces of the specimen were polished, as shown in Figure 2A.
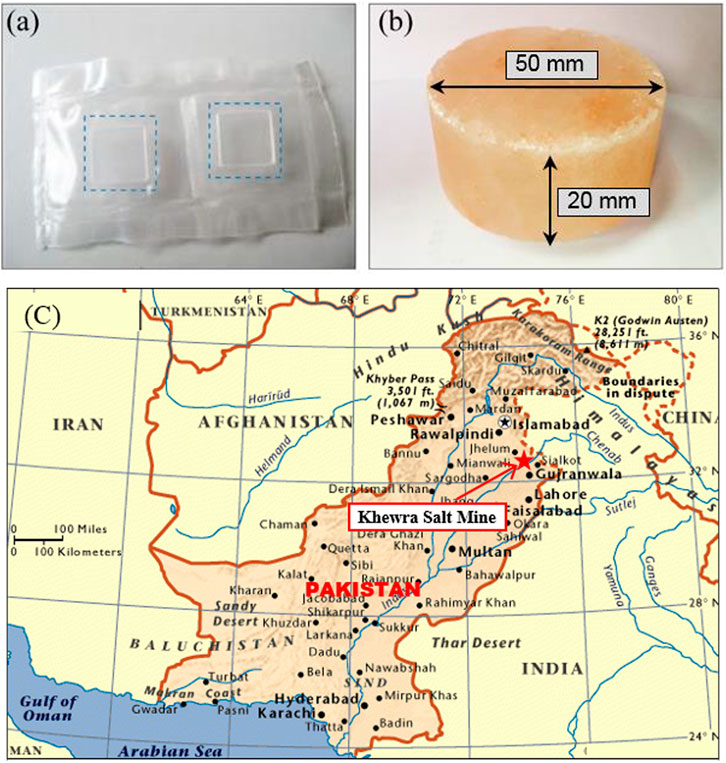
FIGURE 2. The experimental specimens and origin of polycrystalline salt rock. (A) NaCl single crystal; (B) Polycrystalline salt rock from Khewra mines; (C) The location of Khewra salt mine, Pakistan.
(2) Polycrystalline Salt Rock
The polycrystalline salt rock specimen was made of the “mine-run” salt rock excavated from the Khewra Salt Mines, Pakistan, as shown in Figure 2C. There are seven salt seams with a cumulative thickness of about 150 m in Khewra Salt Mines, which cover an area of about 110 km2 as an irregular dome-like structure in Pre-Cambrian rocks. The salt of Khewra mines is translucent and appears white, pink, reddish, or beef-color red. The sodium chloride content in salt rock of Khewra mines exceeds 98% and the main component of a very small amount of impurities is soluble matter such as sodium sulfate and magnesium chloride, as shown in Figure 2B. The specimens in these tests were processed into a cylinder with a diameter of 50 mm and a height of 20 mm, and the top and bottom surfaces of the salt rock specimen were finely polished with 1,000 mesh ultra-fine sandpaper to ensure that the upper and lower surfaces of the specimens were flat and parallel to each other.
2.2 Experiment Methods
2.2.1 Selection of Thermal Parameters Testing Methods
At present, the more mature test methods for thermal parameters of solid materials mainly include guarded-hot-plate (GHP) method and laser flash (LF) method. GHP method is mainly used to measure the thermal conductivity of construction and insulation materials, and LF method is mainly used to test the thermal conductivity of small volume solid materials and high thermal conductivity materials. Due to the strict sample size requirements and long test time, GHP method and LF method have certain limitations for rock materials with the characteristics of difficult sample acquisition, anisotropy and difficult preparation of small-size samples.
Transient plane source (TPS) method is an emerging method for non-stationary testing of thermal conductivity of solid materials. When using the TPS method to measure the thermal conductivity, only a relatively flat sample surface is required without other special sample preparation. At the same time, TPS method has the advantages of short measurement time, wide test range and high measurement accuracy, so it is very suitable for the measurement of thermal conductivity of rock materials. The comparison of the TPS method with GHP method and LF method is shown in Table 1. In our tests, the thermal parameters of the NaCl single crystal specimens were tested by the LF method, and the thermal parameters of the polycrystalline salt rock specimens were tested by the TPS method.
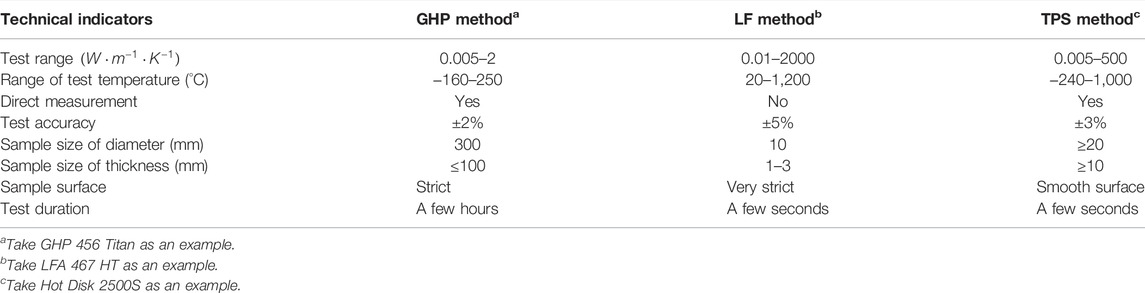
TABLE 1. Thermal conductivity test method comparison.
2.2.2 Introduction to the Transient Plane Source Method
For a better understanding, the test principle of TPS method is briefly introduced in this section. TPS method, evolving from the hot wire method, is a non-stationary thermal conductivity measurement method. In this method, a plane probe is made of thermal resistance material, which can be used as a heat source and temperature sensor at the same time.
During the test, the thermal conductivity and thermal diffusivity of the test sample are obtained directly from the mathematical model by recording the temperature and the response time of the probe, and thus the volumetric specific heat capacity of the material. During the test, the temperature and the response time of the probe were recorded and the thermal conductivity and thermal diffusivity of the specimen are directly obtained through the mathematical model, then the volumetric specific heat of the material was obtained. The principle of TPS method is based on the transient temperature response generated by a disc-shaped heat source capable of heating in an infinitely large material medium.
The Hot Disk 2500S thermal constant analyzer is a common instrument for measuring thermal conductivity of materials based on TPS method, and its core component is a thin disk-shaped temperature dependent probe (Figure 3A). During the test, the probe was sandwiched between two samples (Figure 3B) and outputted a constant current and causes the change of sample temperature. The increase of temperature will change the resistance of the probe, resulting in a certain voltage drop at both ends of the probe. Different thermal conductivity of the specimen results in different voltage changes. As a result, the change of probe temperature can be accurately obtained by recording the change of voltage over a period of time, and then the thermal conductivity of the measured specimen can be obtained.
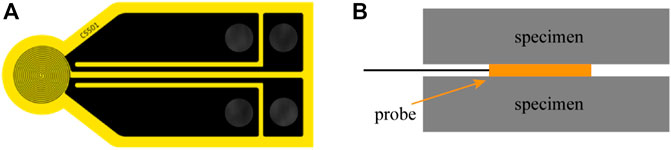
FIGURE 3. Schematic diagram of thermal parameters by Hot Disk 2500S. (A) A thin disk-shaped temperature dependent probe; (B) The sandwich structure formed by the sample and the probe during testing.
At the beginning of the test, the resistance value of the probe varies with time as shown in Eq. 1:
Where:
Where:
Define:
Substituting Eq. 2 into Eq. 1, then:
According to Eq. 5,
2.2.3 Test Scheme Design
Based on the temperature range of surrounding rock during the operation of underground compressed air storage power station and underground high-level nuclear waste repository, the thermal conductivity, thermal diffusivity and specific heat of the NaCl single crystal and polycrystalline salt rock were measured in the temperature range of 20 ∼ 240°C. LF method (LFA 467 HT) and TPS method (Hot Disk 2500S) are used to test the thermal parameters of NaCl single crystal and polycrystalline salt rocks respectively. The temperature gradient during the tests was 20°C. One temperature series of five measurements was made at every temperature, followed by a second temperature series, to show reproducibility, of three measurements at each temperature. All measurements at each temperature within each series were within 1% of their average; the series averages at every temperature were within 2% of each other.
The series averages are reported and discussed. The uncertainties in the temperature values reported are less than 1% and material property values are approximately 2%. The test results mentioned in the Results and Discussion below were the series averages of each temperature to avoid the uncertainty.
3. Results and Analysis
3.1 Thermal Properties of NaCl Single Crystal
The average values of the test results of NaCl single crystal specimens at different temperatures were shown in Table 2. The variation of thermal conductivity, thermal diffusivity and specific heat of NaCl single crystal with temperature in the temperature range of 20–240°C are shown in Figure 4.

TABLE 2. Test results of thermal parameters of NaCl single crystal.
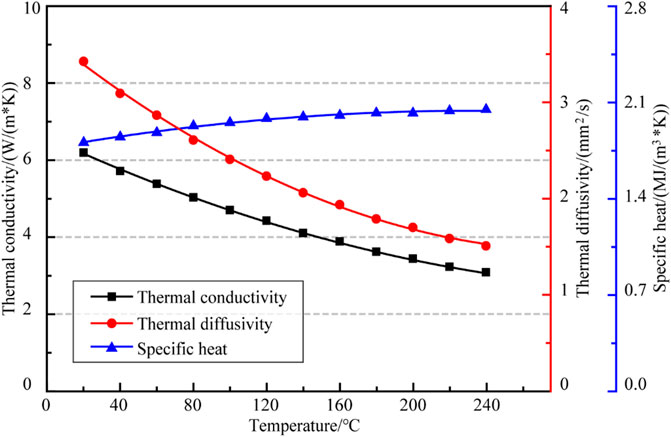
FIGURE 4. Test results of thermal parameters of NaCl single crystal.
As shown in Figure 4, both the thermal conductivity and thermal diffusivity of NaCl single crystal decreased with increasing temperature, and the rate of descent decreased with increasing temperature. The thermal conductivity decreased from 6.182
Where, λ is the thermal conductivity of the specimen
3.2 Thermal Properties of Polycrystalline Salt Rocks
The testing results of thermal conductivity, thermal diffusivity and specific heat of polycrystalline salt rocks in the temperature range of 20–240°C were shown in Table 3; Figure 5.
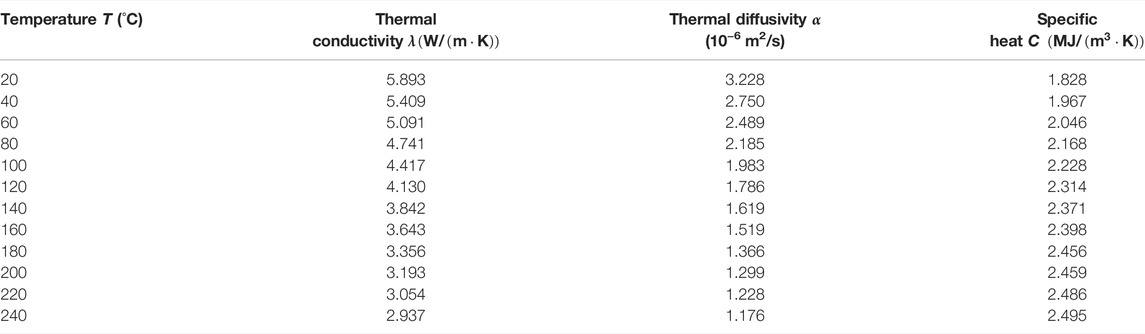
TABLE 3. Test results of thermal parameters of polycrystalline salt rock.
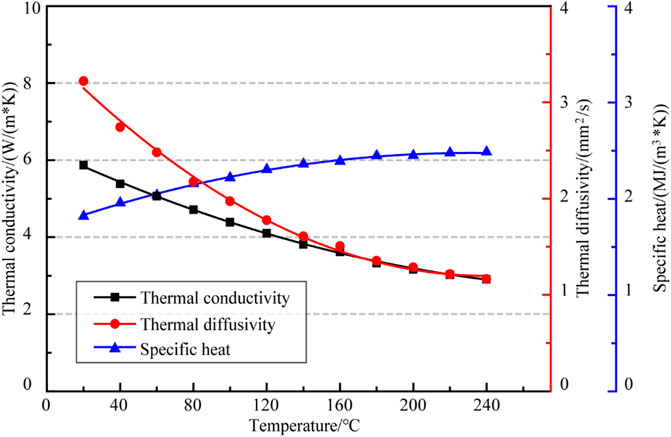
FIGURE 5. Test results of thermal parameters of polycrystalline salt rock.
As shown in Figure 5, the variation of thermal conductivity, thermal diffusivity and specific heat of polycrystalline salt rock with temperature were basically the same as those of NaCl single crystal, where the thermal conductivity and thermal diffusivity decreased with increasing temperature and the specific heat increased with increasing temperature. Thermal conductivity decreased from 5.893
All the determination coefficients
3.3 Comparative Analysis
Alexander and Stephen (Urquhart and Bauer, 2015) used the TPS method to test the thermal conductivity of a transparent single crystal salt rock (Figure 6) from a coarse-grained salt rock extracted from the Hockley salt mine in Harris County, Texas, United States. The test results (selected in the temperature range of 25–250°C) and the comparison with NaCl single crystal and polycrystalline pure salt rock in our tests are compared in Figure 7.
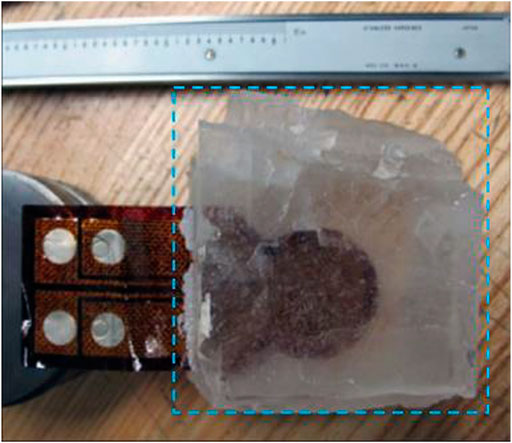
FIGURE 6. NaCl single crystal mined in situ from Hockley salt mine (Urquhart and Bauer, 2015)
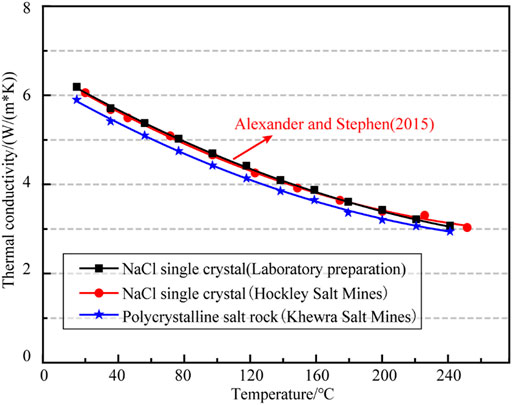
FIGURE 7. Test results of thermal parameters of different kinds of salt rock samples.
As shown in Figure 7, the thermal conductivity curves of the NaCl single crystals made by the crystallization method in our tests coincide with those of the NaCl single crystals mined from the Hockley salt mine. It was indicated that, for undamaged and unadulterated NaCl single crystals, there was no significant difference in thermal conductivity between the naturally grown salt rock crystals in salt mines and those made by crystallization method in the laboratory. Therefor the data obtained from laboratory tests could be used to estimate the thermal parameters of salt rock in underground salt mines. The accuracy of the TPS method for measuring the thermal parameters of rock materials was also verified.
It can be found from Figure 7 that both polycrystalline salt rock from Khewra salt mine and NaCl single crystal specimens showed a trend similar in thermal conductivity curves. However, the thermal conductivity of polycrystalline salt rock was smaller than that of NaCl single crystal at the same temperature, which might be caused by the tiny pores or impurities in the natural polycrystalline salt rock. The differences in thermal parameters between polycrystalline salt rocks and NaCl single crystals also suggest that the thermal property parameters of actual salt rocks in salt mines are more realistic for the assessment of the evolution of the temperature field of the surrounding rocks in salt rock underground projects than using the thermal property parameters of NaCl.
4. Numerical Simulation of Salt Rock Disposal Repository
Based on the thermal conductivity model of polycrystalline salt rock, the temperature field evolution of the geologic repository of underground salt rock high-level radioactive nuclear waste in 1,000 years was studied by ABAQUS finite element software.
4.1 Physical Model
The physical model was established by the layout of horizontal roadway commonly used in the construction of high-level nuclear radioactive waste disposal repository, as shown in Figure 8A. The burial depth of physical model was 2000 m considering the actual burial of large salt mine and the influence of groundwater. The disposal caverns were excavated on both sides of the main disposal roadway and the metal waste tank of high-level nuclear waste was installed in the disposal cavern. Polycrystalline salt rock was packed around the waste tanks as backfill material. The shape of disposal cavern was a straight wall semicircular arch with width of 6 m and height of 6 m, the diameter of high-level radioactive nuclear waste was 1 m and the diameter of metal waste tank was 1.5 m, the metal waste tank was placed around the center, 1 m from the bottom of the disposal cavern, as shown in Figure 8B. The object of the numerical simulation was a disposal cavern with a size of 100 m × 100 m. Quadrilateral grid cells were used for grid division, generating 40,627 nodes and 40,226 cells, as shown in Figure 8C.
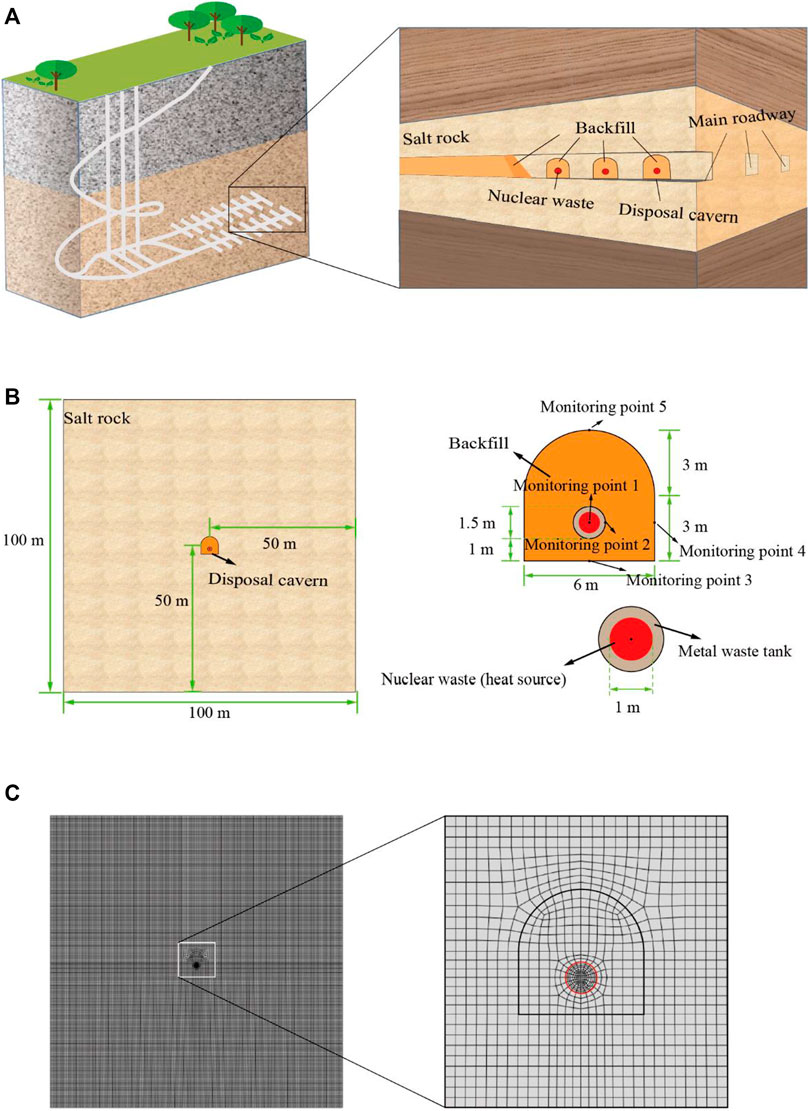
FIGURE 8. Description of geological repository model for underground salt rock high-level radioactive nuclear waste. (A) Layout of nuclear waste repository; (B) Physical model geometry parameters and monitoring point location; (C) Model grid meshing.
The simulation only focused on the evolution of temperature field without considering the influence of stress and other factors. The temperature of the constant temperature layer was 7°C and the geothermal gradient is 3°C/100 m. The initial temperature of the disposal layer and the boundary both were set at 67°C, the boundary maintained heat exchange with the outside.
4.2 Material Parameters
4.2.1 Nuclear Waste Heat Source
In the simulation, based on data of single exothermic decay function diagram of the glass solidified of high-level radioactive waste from SNFWN, Sweden (Figure 9), the heat source of the model was set. It can be seen that the thermal power of nuclear waste decreases gradually with the increase of time and approaches 0 after about 3,000 years. The exothermic decay function of nuclear waste was piecewise fitted based on Figure 9.
Where, Q(t) is the thermal power of a single nuclear waste, W/tank; T is time, a.
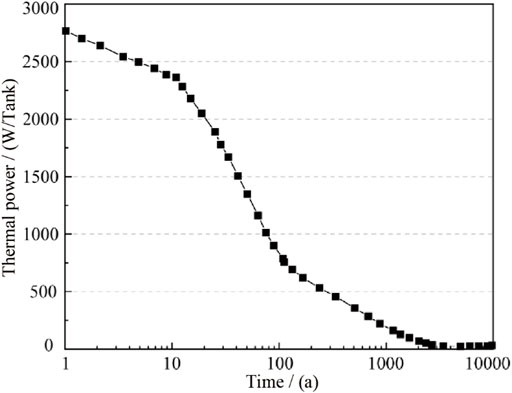
FIGURE 9. Exothermic decay function of solidified glass of high-level radioactive waste.
The heat source was set in the form of heat flux. For this calculation model, the high-level radioactive nuclear waste body was a circle with a diameter of 1 m in the two-dimensional plane and its circumference was π, so the heat flux P(t) of each tank could be obtained from Eq. 16:
4.2.2 Physical and Thermal Parameters
Based on the damage self-healing properties of salt rock, the reconsolidation salt as the backfilling material is expected to have similar properties to salt rock after long-term consolidation. Therefore, the thermal parameters of salt rock are used to replace the reconsolidation salt in this calculation. Therefore, the physical and thermal parameters of the nuclear waste, metal waste tank, backfill and salt rock are shown in Table 4.
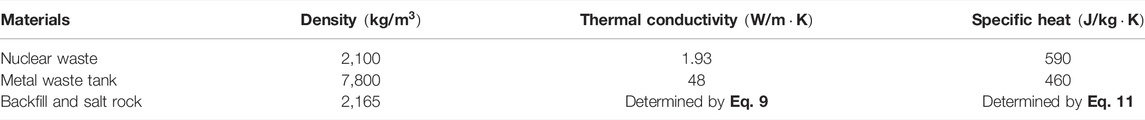
TABLE 4. Physical and thermal parameters of materials.
4.3 Temperature Field Evolution of Disposal Repository
In order to reveal the spatial and temporal evolution of temperature field of the disposal cavern and surrounding rock, five points were selected for temperature monitoring: nuclear waste body (monitoring point 1), outer wall of metal waste tank (monitoring point 2), bottom of the treatment chamber (monitoring point 3), side (monitoring point 4) and top (monitoring point 5). The evolution of temperature field was shown in Figure 10A.
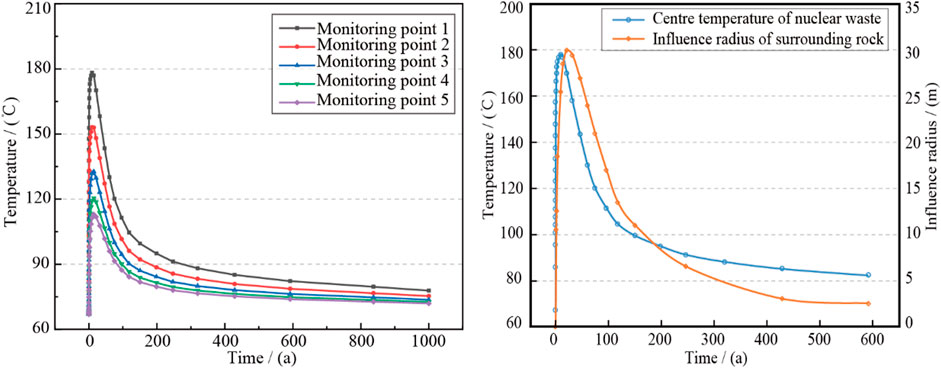
FIGURE 10. The variation of disposal temperature with time. (A) Changes in temperature at different locations of the repository with time; (B) Change of radius of influence of surrounding rock temperature with time.
It can be seen from Figure 10A that the temperature changes over time at the five monitoring points were basically the same. At the beginning of the operation of the disposal repository, the temperature of each monitoring point increased rapidly, and reached the maximum value about 10 years. Then, with the increase of operation time, the temperature of each monitoring point decreased rapidly, and the longer the distance from the nuclear waste body, the longer the time for each monitoring point to reach the maximum temperature. In terms of absolute value, as the heat source center, the temperature of the nuclear waste body was the highest in the whole disposal repository at all stages. When the nuclear waste body reached the highest point of temperature, its central temperature was 30°C higher than the surface temperature of the metal waste tank. The temperature of the bottom, side and top of the disposal chamber decreased successively, which should be related to the distance of the nuclear waste body. It could be found from the peak temperature of each monitoring point in 10 years that the peak temperature of each monitoring point in the disposal repository was very sensitive to the distance from the nuclear waste body. The peak temperature at the top of the disposal cavern 3.75m away from the nuclear waste body was only 112°C, which differed about 65°C from the peak temperature at the center of the nuclear waste body, while the temperature of surrounding rock during the operation of the disposal repository was basically below 100°C.
Figure 11 showed the temperature field cloud diagram when the disposal repository operates at 5 a, 10 a, 50a, 100 a, 500 a and 1,000 a. At the beginning of the operation of the repository, the temperature of the waste body and the disposal cavern gradually increases and then decreases rapidly. In terms of the range of temperature influence, the influence radius of temperature increased caused by nuclear waste gradually increased first and then decreased. In the first 10 years, the temperature of surrounding rock increased gradually from near to far, and the influence radius increased gradually caused by nuclear waste releasing. After 50 years, the temperature influence radius gradually decreased. At 500 years, only the temperature near the metal waste tank in the disposal cavern was higher than the ground temperature. At 1,000 years, it was almost impossible to see any significant warming effect on the surrounding area caused by nuclear waste releasing. By comparing Figure 11B and Figure 11C, it could be found that the temperature of nuclear waste decreased rapidly after the temperature rose to the peak, while its temperature influence radius in 50 years gradually increased. This indicated that the influence radius evolution of temperature was not synchronous with the temperature evolution of nuclear waste.
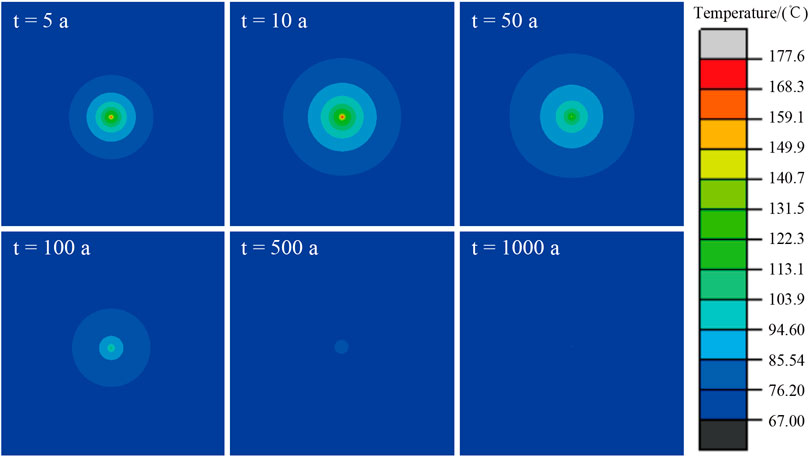
FIGURE 11. The characteristics of the temperature field of the repository in 1,000 years.
To reveal the variation rule of the influence boundary of surrounding rock temperature caused by nuclear waste releasing with the operation time of the disposal repository, ABAQUS software was used to measure the influence radius of surrounding rock temperature with time (within rising 10°C), as shown in Figure 10B. The temperature influence radius gradually increased in the early stage of operation, and reached the maximum value of 30 m at 21.3 years. Subsequently, the temperature influence radius decreased rapidly, and narrowed to the disposal carven at 300 years.
In addition, the temperature influence radius of surrounding rock was not synchronous with the temperature variation of nuclear waste body over time, and the variation of temperature influence radius of surrounding rock lagged behind the temperature variation of nuclear waste body, which should be attributed to the heat released by nuclear waste takes a certain time to conduct in surrounding rock.
5. Conclusion
1) Compared with the guarded-hot-plate (GHP) method and laser flash (LF) method, the transient plane source (TPS) method was more suitable for the measurement of thermal parameters of rock materials.
2) The thermal conductivity, thermal diffusivity and specific heat of NaCl single crystal and polycrystalline salt rock were measured in the range of 20–240°C by the laser flash (LF) method and transient plane source (TPS), respectively.
3) The thermal conductivity and thermal diffusivity of salt rock decrease gradually with the increase of temperature, while the specific heat capacity increases with the increased of temperature. The thermal conductivity of polycrystalline salt rock was slightly lower than that of single-crystal NaCl.
4) The models of thermal conductivity, thermal diffusivity and specific heat of NaCl single crystal and polycrystalline salt rock with temperature in the range of 20–240°C were established, which could improve the accuracy of temperature field evolution prediction of surrounding rock and effective thermal conductivity model of backfill material.
5) Based on the thermal conductivity model of polycrystalline salt rock established in this paper, the temperature field evolution during the operation of the underground salt rock high-level nuclear waste repository in 1,000 years was studied. It was found that the temperature of the glass solidified of high-level radioactive waste reached the highest (177.6°C) and then dropped rapidly. The decay heat radiation influence radius of the nuclear waste reaches its maximum in about 50 years of operation of the repository and then gradually decreases.
Data Availability Statement
The original contributions presented in the study are included in the article/Supplementary Material, further inquiries can be directed to the corresponding authors.
Author Contributions
YR, QY, YK and DJ contributed to conception and design of the study. ZL organized the database. HH performed the statistical analysis. YR and YK wrote the first draft of the manuscript. QY, LW and HX wrote sections of the manuscript. All authors contributed to manuscript revision, read, and approved the submitted version.
Funding
This work was supported by the National Natural Science Foundation of China (No. 52022014, 51834003, 51804052), Special Project for Performance Incentive and Guidance of Scientific Research Institutions in Chongqing (cstc2021jxjl120007), which are all greatly appreciated.
Conflict of Interest
Author HH is employed by Shanghai Jianke Engineering Consulting co.
The remaining authors declare that the research was conducted in the absence of any commercial or financial relationships that could be construed as a potential conflict of interest.
Publisher’s Note
All claims expressed in this article are solely those of the authors and do not necessarily represent those of their affiliated organizations, or those of the publisher, the editors, and the reviewers. Any product that may be evaluated in this article, or any claim that may be made by its manufacturer, is not guaranteed or endorsed by the publisher.
References
Bauer, S., and Urquhart, A. (2016). Thermal and Physical Properties of Reconsolidated Crushed Rock Salt as a Function of Porosity and Temperature. Acta Geotech. 11 (4), 913–924. doi:10.1007/s11440-015-0414-8
Bechthold, W., Smailos, E., Heusermann, S., Bollingerfehr, W., Bazargan Sabet, B., Rothfuchs, T., et al. (2004). Backfilling and Sealing of Underground Repositories for Radioactive Waste in Salt (BAMBUS-II Project). Comm. Eur. Communities, EUR 20621, 272.
Blanco-Martín, L., Wolters, R., Rutqvist, J., Lux, K.-H., and Birkholzer, J. T. (2016). Thermal-hydraulic-mechanical Modeling of a Large-Scale Heater Test to Investigate Rock Salt and Crushed Salt Behavior under Repository Conditions for Heat-Generating Nuclear Waste. Comput. Geotechnics 77, 120–133. doi:10.1016/j.compgeo.2016.04.008
Chen, J., Jiang, D., Ren, S., and Yang, C. (2016). Comparison of the Characteristics of Rock Salt Exposed to Loading and Unloading of Confining Pressures. Acta Geotech. 11 (1), 221–230. doi:10.1007/s11440-015-0369-9
Chen, J., Kang, Y., Liu, W., Fan, J., Jiang, D., and Chemenda, A. (2018). Self-healing Capacity of Damaged Rock Salt with Different Initial Damage. Geomechanics Eng. 15 (1), 615–620. doi:10.12989/gae.2018.15.1.615
Chen, J., Liu, W., Jiang, D., Zhang, J., Ren, S., Li, L., et al. (2017). Preliminary Investigation on the Feasibility of a Clean CAES System Coupled with Wind and Solar Energy in China. Energy 127, 462–478. doi:10.1016/j.energy.2017.03.088
Chen, J., Lu, D., Liu, W., Fan, J., Jiang, D., Yi, L., et al. (2020). Stability Study and Optimization Design of Small-Spacing Two-Well (SSTW) Salt Caverns for Natural Gas Storages. J. Energ. Storage 27, 101131. doi:10.1016/j.est.2019.101131
Costa, A., Amaral, C., and Poiate, E. (2015). Hydrocarbon Production and Storage Using Offshore Underground Salt Caverns, Mechanical Behaviour of Salt VIII. London, United Kingdom: CRC Press, 221–228. doi:10.1201/b18393-29
Desbois, G., Urai, J. L., and de Bresser, J. H. P. (2012). Fluid Distribution in Grain Boundaries of Natural fine-grained Rock Salt Deformed at Low Differential Stress (Qom Kuh Salt fountain, central Iran): Implications for Rheology and Transport Properties. J. Struct. Geology. 43, 128–143. doi:10.1016/j.jsg.2012.07.002
Fan, J., Jiang, D., Liu, W., Wu, F., Chen, J., and Daemen, J. (2019). Discontinuous Fatigue of Salt Rock with Low-Stress Intervals. Int. J. Rock Mech. Mining Sci. 115, 77–86. doi:10.1016/j.ijrmms.2019.01.013
Fan, J., Liu, W., Jiang, D., Chen, J., Tiedeu, W. N., and Daemen, J. J. (2020). Time Interval Effect in Triaxial Discontinuous Cyclic Compression Tests and Simulations for the Residual Stress in Rock Salt. Rock Mech. Rock Eng. 53 (9), 4061–4076. doi:10.1007/s00603-020-02150-y
Ge, P. (2011). “Analysis of Temperature, Deformation and Stress fields of Nuclear Waste Repository in Salt Rock,” (China: Hebei University of Technology in China). Master Thesis.
Kang, Y., Chen, J., Jiang, D., Liu, W., and Fan, j. (2019). Summary on Damage Self-Healing Property of Rock Salt. Rock Soil Mech. 40 (1), 55–69. doi:10.16285/j.rsm.2017.1096
Kang, Y., Fan, J., Jiang, D., and Li, Z. (2021). Influence of Geological and Environmental Factors on the Reconsolidation Behavior of Fine Granular Salt. Nat. Resour. Res. 30 (1), 805–826. doi:10.1007/s11053-020-09732-1
Li, M., Zhang, H., Xing, W., Hou, Z., and Were, P. (2015). Study of the Relationship between Surface Subsidence and Internal Pressure in Salt Caverns. Environ. Earth Sci. 73 (11), 1–12. doi:10.1007/s12665-015-4405-8
Liu, W., Chen, J., Jiang, D., Shi, X., Li, Y., Daemen, J., et al. (2016). Tightness and Suitability Evaluation of Abandoned Salt Caverns Served as Hydrocarbon Energies Storage under Adverse Geological Conditions (AGC). Appl. Energ. 178, 703–720. doi:10.1016/j.apenergy.2016.06.086
Paneru, L. P., Bauer, S. J., and Stormont, J. C. (2018). Thermal Properties of Consolidated Granular Salt as a Backfill Material. Rock Mech. Rock Eng. 51 (3), 911–923. doi:10.1007/s00603-017-1353-5
Popp, T., Minkley, W., Salzer, K., and Schulze, O. (2012). “Gas Transport Properties of Rock Salt–Synoptic View.” in Proceedings of the seventh conference on the mechanical behavior of salt. (London, UK: Taylor & Francis Group)
Schiebahn, S., Grube, T., Robinius, M., Tietze, V., Kumar, B., and Stolten, D. (2015). Power to Gas: Technological Overview, Systems Analysis and Economic Assessment for a Case Study in Germany. Int. J. Hydrogen Energ. 40 (12), 4285–4294. doi:10.1016/j.ijhydene.2015.01.123
Urquhart, A., and Bauer, S. (2015). Experimental Determination of Single-crystal Halite thermal Conductivity, Diffusivity and Specific Heat from −75 °C to 300 °C. Int. J. Rock Mech. Mining Sci. 78, 350–352. doi:10.1016/j.ijrmms.2015.04.007
Keywords: thermal conductivity, thermal diffusivity, specific heat, salt rock, temperature field evolution
Citation: Ren Y, Yuan Q, Kang Y, Wei L, Li Z, Jiang D, He H and Xu H (2022) Experimental Determination of Polycrystalline Salt Rock Thermal Conductivity, Diffusivity and Specific Heat From 20 to 240°C. Front. Earth Sci. 10:835974. doi: 10.3389/feart.2022.835974
Received: 05 January 2022; Accepted: 31 March 2022;
Published: 04 May 2022.
Edited by:
Chong Xu, Ministry of Emergency Management, ChinaReviewed by:
Siyuan Ma, China Earthquake Administration, ChinaZhanping Song, Xi’an University of Architecture and Technology, China
Copyright © 2022 Ren, Yuan, Kang, Wei, Li, Jiang, He and Xu. This is an open-access article distributed under the terms of the Creative Commons Attribution License (CC BY). The use, distribution or reproduction in other forums is permitted, provided the original author(s) and the copyright owner(s) are credited and that the original publication in this journal is cited, in accordance with accepted academic practice. No use, distribution or reproduction is permitted which does not comply with these terms.
*Correspondence: Qiang Yuan, cWlhbmd5dWFuQGNxdS5lZHUuY24=; Yanfei Kang, NjQ5MTkwNDU5QHFxLmNvbQ==; Deyi Jiang, ZGV5aWpAY3F1LmVkdS5jbg==