 Yumeng Yang
 Liang Zhao
 Xinyong Shen
 Ziniu Xiao
 Qingquan Li
94% of researchers rate our articles as excellent or good
Learn more about the work of our research integrity team to safeguard the quality of each article we publish.
Find out more
ORIGINAL RESEARCH article
Front. Earth Sci., 17 February 2022
Sec. Atmospheric Science
Volume 10 - 2022 | https://doi.org/10.3389/feart.2022.835101
This article is part of the Research TopicCryosphere and Climate Change in the Arctic, the Antarctic and the Tibetan PlateauView all 24 articles
The atmospheric heat source over the Qinghai–Tibetan Plateau (QTP) in spring has an important impact on the climate of the surrounding regions. However, there have been few systematic studies of the dominant mode of the heat source and the cross-seasonal connections with the preceding winter and following summer. Using a distinct empirical orthogonal function (DEOF) decomposition method, we obtained the leading mode of the spring heat source over the QTP and the surrounding regions and analyzed its precursors in the previous winter and lagging effects in the following summer. Our results show that the first mode (DEOF1) was characterized by a warm plateau and cold surrounding regions. The positive phase was significantly associated with the warm Arctic–cold Siberia (WACS) pattern (r = 0.39, p = .01) and the La Niña-like SST anomaly in the Pacific in the preceding winter and the following East Asian subtropical summer monsoon (r = –0.44, p = .01), resulting in a widespread drought in China during the following summer. The cold anomaly in Siberia and the warm anomaly at mid-to low latitudes in winter associated with the WACS pattern coincide with the DEOF1 mode of the heat source over the QTP and its surroundings through change of meridional temperature gradient and wave-flow interactions. A mid-latitude wave train excited by the WACS and the thermal difference in the meridional direction of the spring DEOF1 mode caused high-pressure anomalies over the QTP and the mid-latitude region of East Asia, influencing central and eastern China. This anomaly was not conducive to the northward advancement of the East Asian summer monsoon, resulting in drought in most of China in spring and summer. The cross-seasonal relationship between the main mode of the spring heat source on the QTP and the preceding winter WACS pattern and the following East Asian summer monsoon can be used as a reference in climate prediction studies.
The Qinghai–Tibetan Plateau (QTP) covers a quarter of China’s land area and has an average altitude >4,000 m, making it the highest and most complex plateau in the world. The QTP heats the upper troposphere over the plateau more effectively than the surrounding areas through the transfer of sensible heat, latent heat and radiation (Flohn, 1957; Flohn and Reiter, 1968; Ye et al., 1979; Kuo and Qian, 1983; Zheng et al., 2015). The changing trend of temperature over the QTP is stronger than in other regions at the same latitude and this affects the atmospheric circulation of the surrounding areas (e.g., Zhang and Zhou, 2008). The huge dynamic and thermodynamic effects of the QTP not only affect the formation and development of the South Asian high (Liu et al., 1989; Liu et al., 2007; Shan et al., 2020; Zhao et al., 2020), but also affect the maintenance and development of the subtropical high (Zhang et al., 2015; Luo et al., 2016) and the overall climate and circulation in the northern hemisphere (Ye, 1952; Ye and Gu, 1955; Li et al., 2007; Zheng et al., 2021). Seasonal changes in the circulation and climate in East Asia are also influenced by the QTP (Matsumoto, 1992; Murakami and Matsumoto, 1994).
As an important heat source in spring and summer, the dynamic and thermodynamic effects of the QTP have important effects on the atmospheric circulation in East Asia, including the East Asian summer monsoon (EASM) (Luo, 1989; Li and Yanai, 1996; Dong et al., 2001; Zhang et al., 2006). Numerical simulations have shown that the thermal role of the underlying surface of the QTP is more important than the dynamic role of the terrain for the EASM, but both are equally important for the Indian summer monsoon (Liu et al., 1989; Luo and Zhang, 1991).
The thermal effects of the QTP affect the EASM in two ways. Heating of the slope of the QTP increases the energy of the air mass moving toward the plateau, causing it to rise. This alters the temperature and circulation over the QTP and stimulates the monsoonal meridional circulation in summer (Wu et al., 2015). This, in turn, affects the establishment and outbreak of the EASM (Luo and Yanai, 1983; Luo and Yanai, 1984; Huang, 1985; Shao and Qian, 2001; Liu et al., 2002; Sun and Ding, 2002; Liang et al., 2005; Wu et al., 2012; Duan et al., 2014; Duan et al., 2018). The QTP also affects the monsoon through the thermal contrast with the surrounding oceans (Ren and Qian, 2003; Yan et al., 2005; Zhu et al., 2007; Liu et al., 2012; Luo et al., 2016; Xu et al., 2016; Zhang et al., 2017). The thermal difference between the eastern plateau and the western Pacific has the strongest correlation with the intensity of the EASM (Xu et al., 2016).
The nature of the QTP heat source changes in spring, from a cold source in winter to a heat source in summer. Some studies have shown that this change is an important signal of the seasonal change in the thermal field over the QTP (Yanai et al., 1992; Daisuke et al., 2003). This transformation of the heat source has an important impact on the seasonal transition of the atmospheric circulation in late summer. Heating of the QTP in spring leads to a reversal in the nearby temperature gradient and affects the establishment of the EASM (Flohn, 1957; Flohn and Reiter, 1968; He et al., 1987; Liu et al., 2002; Zhang and Qian, 2002). The thermal and dynamic effects of the QTP accelerate the northward advancement of the monsoon and the seasonal transition in East Asia (Zheng et al., 2001). However, there have been few studies of the early circulation signals of the anomaly in the spring heat source of the QTP, especially for signals in the Eurasia continent in winter.
As a result of the large spatial differences in the thermal status of the QTP caused by the complex terrain, the regional average cannot accurately reflect the spatial heterogeneity of the change in the heat source. Analysis of the main mode can better account for the spatial heterogeneity of the change in the heat source and help to analyze the precursory signals and later impacts. Some studies have made progress. Wang et al. (2007) found that the intensity of the heat source in the eastern QTP is negatively correlated with the intensity of the EASM and positively correlated with the intensity of the South Asian summer monsoon. The leading first mode of the heat source changed in the 1970s (Wang et al., 2011). Zhang et al. (2019) found that the importance of the east–west inverse change in the mode of the QTP heat source during summer on the summer precipitation in China is increasing.
There have been few studies of the main mode of the heat source over the plateau and its surrounding areas and of the cross-seasonal connection of the main mode. Most of the previous thermal indices for the QTP were obtained based on the regional average of low-resolution data and the topographic factors were not fully considered. We therefore need to use higher resolution heat source data for an analysis of the principal mode to obtain an index that can more accurately describe the thermal characteristics of the QTP.
Previous analyses of the main mode of the heat source were often based on the empirical orthogonal function (EOF) method. However, the modes obtained by EOF analysis may have a false dipole distribution (Dommenget and Latif, 2002). Studies have shown that if the data field is a random system and satisfies the relationship that the correlation of various points in space (time) attenuates with increasing distance, then its EOF mode often appears as a false dipole distribution (Dommenget and Latif, 2002; Gerber and Vallis, 2005; Cook et al., 2010). Dommenget (2007) therefore proposed a new EOF method: the distinct EOF (DEOF) method. DEOF can eliminate features of randomness from strong noise and highlight features with more physical information. It can better estimate real climate modes (Dommenget, 2007; Cook et al., 2010). This method has been applied in the fields of meteorology and oceanography (e.g., Cook et al., 2010; Feng et al., 2014; Hu et al., 2018).
We used the DEOF method proposed by (Dommenget, 2007) to decompose the atmospheric heat source over the QTP and its surrounding domain based on high-resolution ERA5 data. We obtained the main mode of the heat source in spring and studied its cross-seasonal relationship with the atmospheric circulation in the preceding winter and following summer. This is of great scientific significance for the in-depth understanding of the change in the QTP heat source in spring and climate variability in East Asia and can also be used as a reference value for cross-seasonal climate prediction.
The ERA5 reanalysis dataset consists of monthly reanalysis data with a horizontal resolution of (0.25° × 0.25°) (Hersbach et al., 2018). Most of the reanalysis data used in previous studies to calculate the heat sources of the QTP were from the National Centers for Environmental Prediction–National Center for Atmospheric Research (NCEP/NCAR) (Liu et al., 2007; Wang et al., 2007; Luo et al., 2016), the NCEP/Department of Energy (DOE) (Tian et al., 2017; Wang et al., 2019) and the ERA-Interim (Ao and Li, 2015; Zhang et al., 2019) datasets. To facilitate comparison with the NCEP data, we interpolated the heat source data calculated from the ERA5 dataset to a (2.5° × 2.5°) grid when comparing it with the heat sources based on the NCEP data. The DEOF results of heat source of different resolutions (1° and 0.25°) are shown in text and supplementary material, respectively.
The NCEP/DOE reanalysis (NCEP2) dataset is a monthly reanalysis dataset with a horizontal resolution of (2.5° × 2.5°) (Kanamitsu et al., 2002). The NCEP/NCAR reanalysis dataset (NCEP1) is also a monthly reanalysis dataset with a horizontal resolution of (2.5° × 2.5°) (Kalnay et al., 1996).
The subtropical EASM index was provided by the National Tibetan Plateau Data Center of China (Zhao et al., 2015; Huang and Zhao 2019) (www.tpdc.ac.cn/zh-hans/). The South Asian summer monsoon index was from Li and Zeng (2003) (http://lijianping.cn/dct/page/1). The northern Pacific subtropical high index and the western Pacific warm pool intensity index were provided by the National Climate Center of China (https://cmdp.ncc-cma.net/cn/download.htm). The Arctic oscillation index was from the National Oceanic and Atmospheric Administration National Weather Service–NCEP Climate Prediction Center (www.cpc.ncep.noaa.gov/products/precip/CWlink/daily_ao_index/ao.shtml). The multivariate El Niño–Southern Oscillation index version two was derived from the National Oceanic and Atmospheric Administration Physical Sciences Laboratory (https://psl.noaa.gov/enso/mei/). The warm Arctic–cold Siberia (WACS) index was derived from the time coefficient of the second mode (PC2) of the EOF analysis of the winter 2 m temperature of the ERA5 in the Eurasia continent (Guan et al., 2020; Jin et al., 2020).
We used the outputs of five models from the World Climate Research Programme Coupled Model Intercomparison Project (phase 6) (CMIP6) Historical simulation (Eyring et al., 2016; https://esgf-node.llnl.gov/projects/cmip6/). Supplementarty Table S1 presents a brief description of these models. The period for the analysis based on the observations/simulations was from January 1979 to December 2020/2014. The simulation data were remapped onto the same (1° × 1°) grid for comparison with observations.
We also used atmospheric heat source/sink dataset over the Tibetan Plateau based on satellite and 80 routine meteorological station (Duan, 2019), provided by the National Tibetan Plateau Data Center of China, to verify the heat source data calculated by the ERA5 reanalysis data.
Following previous work (Yanai et al., 1973), the apparent heat source can be calculated by:
where
The EOF method, also known as eigenvector analysis or principal components analysis, is a method of analyzing the structural features of matrix data and extracting the main data feature quantities. The EOF method is able to decompose the field of time-varying variables into a part that does not vary with time as a function of space and a part that depends only on the time variation as a function of time. It allows the main information of the original variable field to be concentrated on a few main components so that a study of the variation with time of the main components only needs to be studied instead of the original variable field. The results derived from this analysis can also be used to explain the physical variation characteristics of the variable field. Lorenz first introduced this analysis method into meteorological and climate studies in the 1950s. As long as the data field satisfies the relationship of the correlation between points in space (or time) decaying with distance, then the EOF modes have a dipole-type distribution (Gerber and Vallis, 2005) and not all the EOF modes are physically significant.
Dommenget (2007) proposed the DEOF method, which uses a stochastic isotropic diffusive process to simulate the stochastic null hypothesis for the spatial structure and then finds the modes that differ most from the null hypothesis. These are then used as the modes for DEOF analysis, which better excludes randomness and has a clearer physical meaning than EOF analysis. Dommenget (2007) introduced a diffusion process to extend a spatial first-order autoregressive (AR (1)) process to two dimensions:
where Φ is the climate element, t is time, cdamp is constant damping, cdiffuse is the diffusion coefficient and f represents the spatial and temporal white noise. The diffusion process introduced in the equation is statistically significant and is used to represent the correlation between two spatial points in the element field.
When neither cdamp nor cdiffuse are a function of the location, then Eq. 3 notes that, for an isotropic diffusive process driven by homogenous forcing, f is an AR (1) process in the spatial domain. The covariance matrix of Φ is therefore:
where
The effective spatial degrees of freedom Neff characterizes the spatially effective dimensionality and quantifies the degree of complexity in the spatial variability of the domains:
where
By projecting the eigenvectors
where cij is the uncentered pattern correlation coefficient between the two EOF patterns. The variance that the mode
where
where
There are usually large differences in the QTP apparent heat source among different datasets. Therefore, before calculating the DEOF modes of the heat source, we first need to evaluate the reliability of the heat source in the region calculated using the ERA5 data by comparing the apparent heat source results from different reanalysis datasets. Figure 1 shows the multi-year mean climatology (1979–2020) of the apparent heat source in spring calculated from the three reanalysis datasets. The spatial distribution shows that all three datasets identify the QTP and its surrounding areas as the main source of heat and that there are large heat values on the southeastern, northeastern and western sides of the QTP. However, the details of the specific distribution are inconsistent among the three datasets. The ERA5 dataset shows more details, larger extreme values and an uneven distribution of the heat source, especially near the boundary regions with the 3,000 m altitude contour, where there are dramatic changes in altitude. The two groups of NCEP data are similar and show a heat source in the central and eastern parts of the QTP; the spatial variation is less severe than that in the ERA5 dataset. This may be a result of the high spatial resolution of the ERA5 data before interpolation, which means that it contains more topographic information.
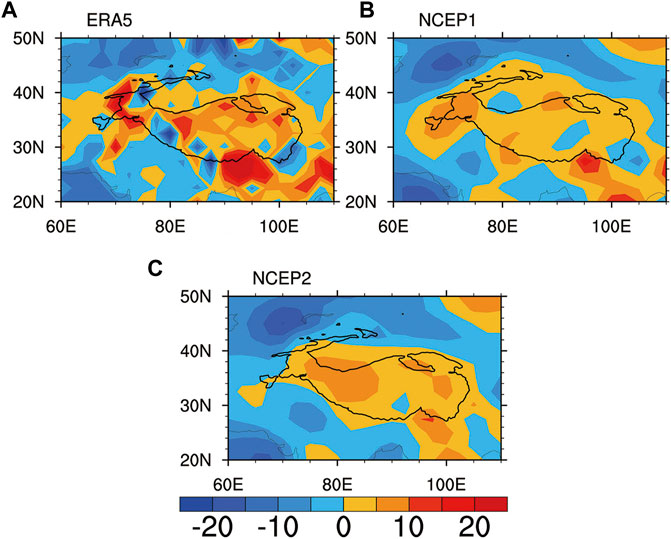
FIGURE 1. Climatology of the vertically integrated (from the land surface to 100 hPa) atmospheric apparent heat source in spring (color shading; units: W m−2) over the QTP and its surrounding areas from 1979 to 2020 based the three reanalysis datasets: (A) ERA5, (B) NCEP1 and (C) NCEP2. The black lines represent the 3,000 m altitude contours.
Some studies indicated that elevation dependence may be exist in the trends in temperature and precipitation on the QTP (e.g., Qin et al., 2009; Li et al., 2017). To further verify whether the similarities and differences in the apparent heat sources in different datasets are affected by the terrain and resolution, we calculated the climatology of the vertically integrated heat source from 500 to 100 hPa (Figure 2) and compared this with the heat source integrated from the ground. The 500 hPa altitude layer is located >5,000 m above sea-level and is not far from ground level on the plateau. Therefore, in theory, the heat source integrated from this height should not be very different from the heat source integrated from the ground.
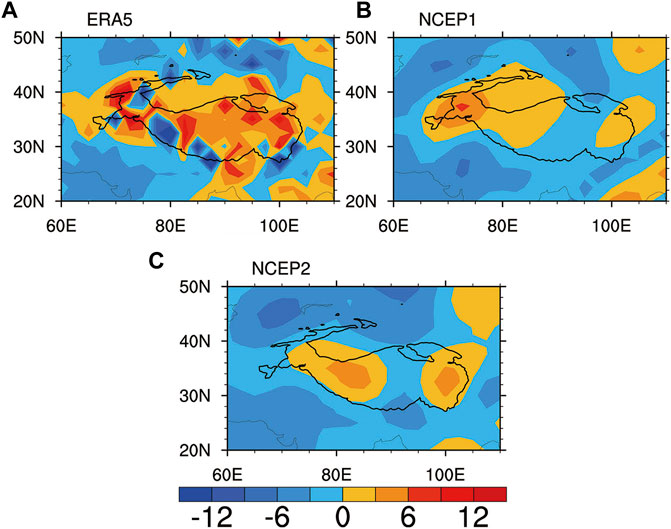
FIGURE 2. Climatology of the vertically integrated (from 500 to 100 hPa) atmospheric apparent heat source in spring (color shading; units: W m−2) over the QTP and its surrounding areas from 1979 to 2020 based the three reanalysis datasets: (A) ERA5, (B) NCEP1 and (C) NCEP2. The black lines represent the 3,000 m altitude contours.
The results showed that, in the plateau region, the spatial distribution of the three groups of heat source tended to be more inconsistent than the heat source integrated from the ground. The ERA5 heat source did not change very much and showed a staggered distribution of positive and negative extremes at the boundary of the QTP, suggesting that it still reflects some topographic effects. However, the other two groups of data showed very different results for the heat source over the QTP: the area of the heat source was significantly smaller and the central area of QTP was a cold source. This indicates that the 500 hPa layer in the NCEP database may be further away from the ground layer and that the heat source near the ground layer is not integrated. The distribution of the NCEP heat sources was relatively smooth, which is an unreasonable result. This suggests that the difference in the results from the three datasets is related to the terrain and resolution. The ERA5 dataset has a higher spatial resolution and retains more realistic terrain information, impacting of vertically integrated result. Therefore, the ERA5 heat source may be more reasonable.
We carried out a quantitative analysis of the consistency of the three sets of heat source data. Supplementary Table S2 gives the field correlation coefficients of the climatology of the heat sources and the correlation coefficients of the time series of the regionally averaged heat sources among the three datasets based on different integral heights. For the whole-layer integration, all the field correlations among the three sets of heat source data and the correlation of the time series between the ERA5 and NCEP2 datasets passed the significance level test. For the heat source data integrated above 500 hPa, the field correlation coefficients significantly decreased and the correlations of the time series increased. This verifies the comparison between Figure 1 and Figure 2. The NCEP data have a low resolution, are strongly affected by the terrain and the accuracy of the near-ground elements is low, resulting in large differences between the integration results from the ground and 500 hPa. It is therefore necessary to use high-resolution data to calculate the heat source on the plateau and the distribution of the heat source in the plateau area from the ERA5 dataset is more reasonable.
Besides, we also compared heat sources from the reanalysis data with station data (Duan, 2019). The results are shown in Supplementary Figure S1. Although there are some differences among the results of heat sources calculated using the ERA5 reanalysis data and station data, the main body of the plateau is characterized by a heat source in the two datasets (Supplementary Figures S1A,B). The temporal correlation at the 80 station sites between station data and ERA5 data (Supplementary Figure S1C) shows that correlations in most of stations are positive, and correlations with 0.10 significant level are basically positive (red circles) and only one station with 0.10 significant level has a negative correlation (a blue circle). And stations in the southern part of the plateau basically pass the significant test. The complex topographic conditions in the southern part of the plateau prove that ERA5 can characterize the topographic factors on the plateau well. And combined with the above comparison results with NCEP reanalysis data, the ERA5 data are feasible for calculating heat sources on the plateau, and can reflect the more topographic effects which are not presented in the low-resolution reanalysis.
Based on our analysis, we have some confidence in the heat sources calculated by the ERA5 dataset. The main modes of the spring
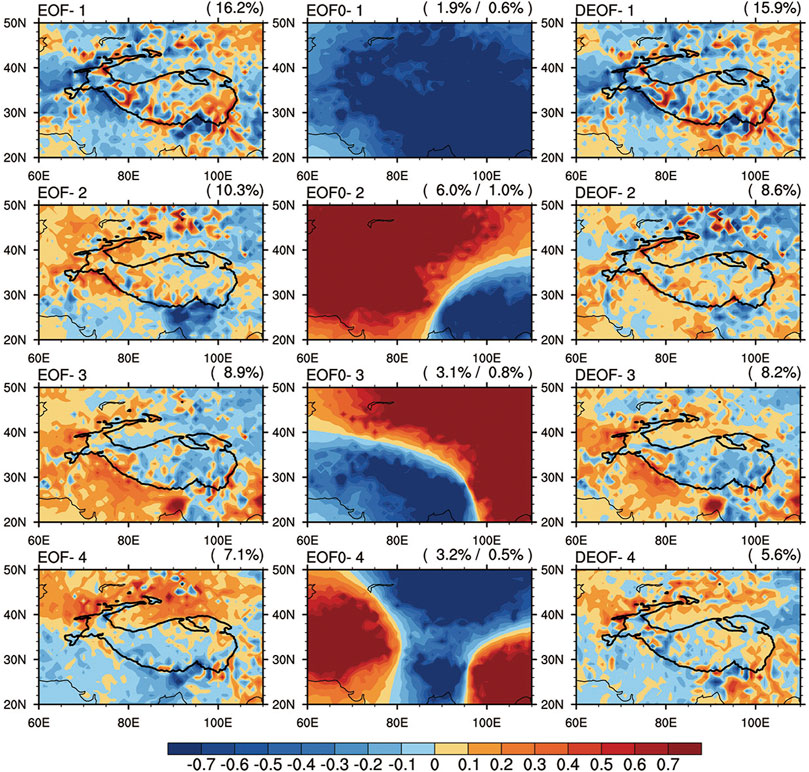
FIGURE 3. Spring
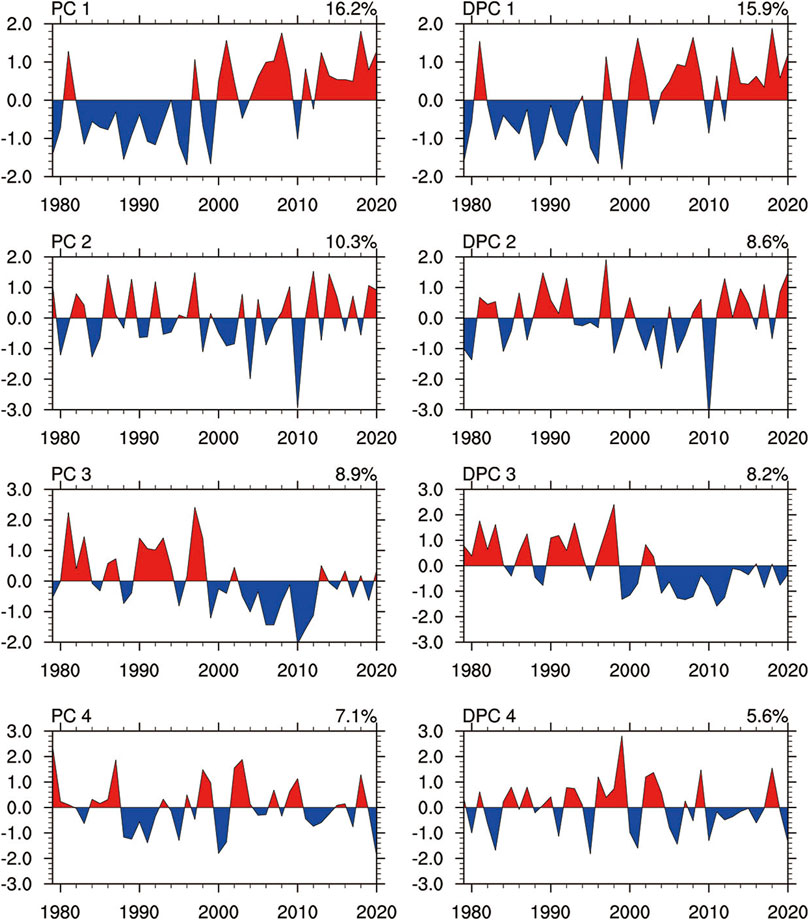
FIGURE 4. Time series corresponding to the modes of EOF (left-hand panel) and DEOF (right-hand panel) analyses for the spring
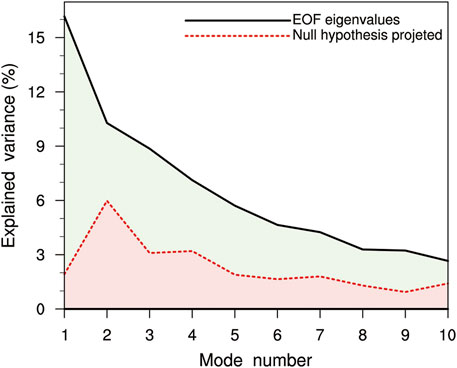
FIGURE 5. Variance contribution of each mode of the spring
The variance contribution of the first mode of the
The EOF2 modal variance contributed 10.3%. In terms of the spatial distribution, this is an east–west dipole-type distribution with a cold source in the central-eastern part of the plateau and a hot source in the west. The strongest cold source was in the southeast of the QTP, with 85° E as the dividing line. The corresponding time series (PC2) mainly showed an interannual variability (Figure 4).
The EOF3 modal variance contributed 8.9%. The spatial distribution was characterized by a northeast–southwest dipole-type distribution with the QTP and its northeastern side as the cold source and the southern area as the heat source; the strongest warm center was located on the southern side of the plateau. The corresponding time series (PC3) was characterized by both an interannual and a decadal variability, with a clear downward trend after 2003.
The EOF4 modal variance contributed 7.1%. The distribution was north–south, with cold sources near the southern edge of the QTP and its southern flank and heat sources on the northern flank of the plateau. PC4 showed a significant interannual variation and there was no significant abrupt change in the variation of the sequence.
Analysis of the null hypothesis process (Figure 3, middle column) revealed that the first mode (EOF0-1) had a monopole distribution, EOF0-2 had a northwest–southeast dipole distribution, EOF0-3 had a northeast–southwest dipole distribution and EOF0-4 had a + − + quasi-zonal distribution. Comparing the variance contribution of each mode of the EOF with the stochastic null hypothesis (Figure 5), we found that the variance contribution of EOF1 was 16.2%. The explained variance of the null hypothesis was 1.9%, which was a significant difference with an effective variance contribution of 14.3%, proving that EOF1 was physically significant and reflected more realistic physical information. Although the spatial modes of EOF2, EOF3 and EOF4 all had dipole-type characteristics, their variance contributions were 10.3, 8.9 and 7.1%, respectively, and the explained variance of the stochastic null hypothesis was 6.0, 3.1 and 3.2%, respectively, which differ by only 4.3, 5.8 and 3.9%, respectively, indicating that EOF2, EOF3 and EOF4 contain only a very small amount of physical information.
This EOF analysis showed that the spatial modes of EOF2, EOF3 and EOF4 all had dipole-type characteristics and the variance contribution was not very different from that of the stochastic null hypothesis, indicating that their physical reality is yet to be verified. It is therefore essential to use DEOF analysis to exclude noise effects and to determine the modes with the most significant difference from the null hypothesis to obtain more realistic physical information and modes.
The DEOF analysis (Figure 3 and Supplementary Figure S2, right-hand column) showed that the first mode of the
DEOF2 differed markedly from the original EOF2. Although both showed an east–west anti-phase distribution, the center of the cold source in the southern part of the QTP was significantly weaker in DEOF2 and the heat source on the northwestern side of the plateau was also weaker, whereas the heat source on the southern side strengthened and expanded.
DEOF2 generally had a more northeast–southwest inversion distribution, a feature more similar to EOF3. The spatial distribution of DEOF2 was essentially a combination of EOF2 and EOF3; the spatial correlation between DEOF2 and EOF2 (EOF3) was 0.84 (0.39). A comparison of the time series (Figure 4) showed that although DPC2 and PC2 were generally similar with a more pronounced interannual variability, DPC2 had a more pronounced decadal variability. The variance contribution of DEOF2 to the noise was 1.0%, which was considerably less than the variance contribution of EOF2 to the stochastic null hypothesis (6.0%). It can be assumed that the DEOF analysis filtered out the spurious physical information in the original EOF2 and that the reliable-to-noise ratio of DEOF2 increased, reflecting a more realistic physical mode.
The distribution of DEOF3 showed some changes compared with EOF3. It no longer had a reverse northeast–southwest distribution, but was closer to the + − + radial distribution with a cold source in the QTP and heat sources on the southern and northern sides of the QTP. The interannual variation was more pronounced in DPC3 than in PC3. DEOF3 only contributed 0.8% to the environmental noise, which showed that the physical information in DEOF3 was more realistic than that in EOF3.
The heat sources in DEOF4 were mainly on the southern and northeastern sides of the QTP, with a zonal distribution of cold sources on the eastern and western sides. DPC4 had changed relative to PC4, but still had a significant interannual variability.
The DEOF1 distributions were therefore similar to EOF1 and both had significant variance contributions (∼16%). They both explained the microscopic variance in the null hypothesis process (∼1%), suggesting that both EOF1 and DEOF1 truly reflected the main modes of variation in the heat source. The first mode of
DEOF3 mainly had a meridional distribution, with the QTP varying inversely between the north and south sides. DEOF4 mainly had an east–west zonal distribution. The reliable-to-noise ratio of each mode became larger after the DEOF analysis, indicating that the DEOF was more realistic and reliable than the EOF.
The DEOF method showed that DEOF1 was the most realistic and physically meaningful mode. As a result, detecting the cross-seasonal relationship between the spring
Table 1 gives the correlation coefficients between the DPC1 series and various factors in different seasons. The first mode was significantly correlated with the WACS index (Figure 6A; r = 0.39), the El Niño–Southern Oscillation index (Figure 6B) in the previous winter, the EASM index (Figure 6D; r = –0.44) and the western Pacific warm pool index in summer (Figure 6C), but not significantly correlated with Arctic oscillation index in winter and the north Pacific subtropical high northern boundary index in summer. Specifically, when DPC1 was high, then the subsequent subtropical EASM was significantly weaker and the tropical South Asian summer monsoon was strong. The cross-seasonal relationship between DPC1 and the EASM didn’t depend on different monsoon index [e.g., the EASM indices by Zhang et al. (2003) and Li and Zeng (2003)]. The atmospheric circulation usually featured a warm Arctic with a cold Eurasia, a La Niña-like SST anomaly and prominent warm pools in the previous winter.
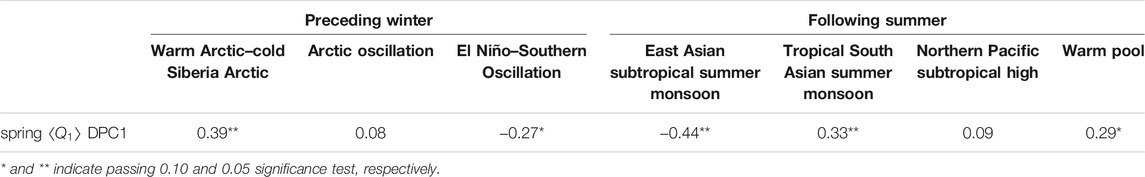
TABLE 1. Correlation coefficients of the DPC1 series with the monsoon, circulation and SST indices for 1979–2020 spring heat sources.
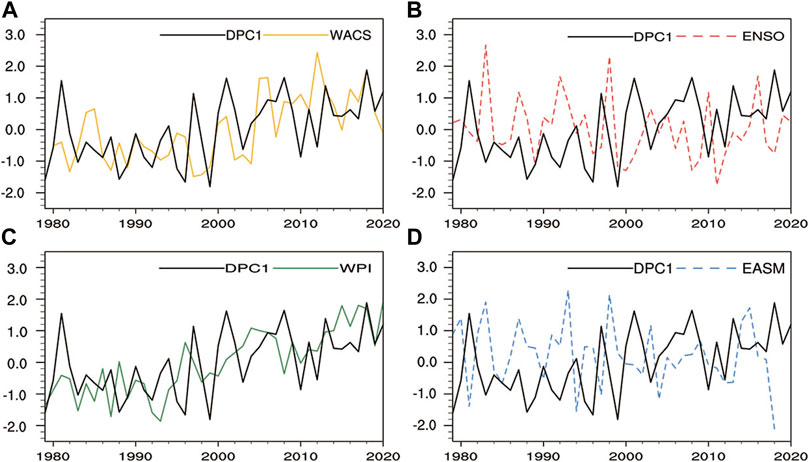
FIGURE 6. DPC1 series and the previous winter (A) WACS index, (B) El Niño–Southern Oscillation (ENSO) index, the summer (C) western Pacific warm pool index and (D) EASM index series.
We analyzed the relationship between the DEOF1 and systems in the previous winter and late summer to explore the precursor of the DEOF1 in the previous winter and its possible influence on the later summer climate in East Asia and the physical process of signal transmission. Figure 7 shows the correlation between the 2 m air temperature (2 mT) and the DPC1 in different seasons.
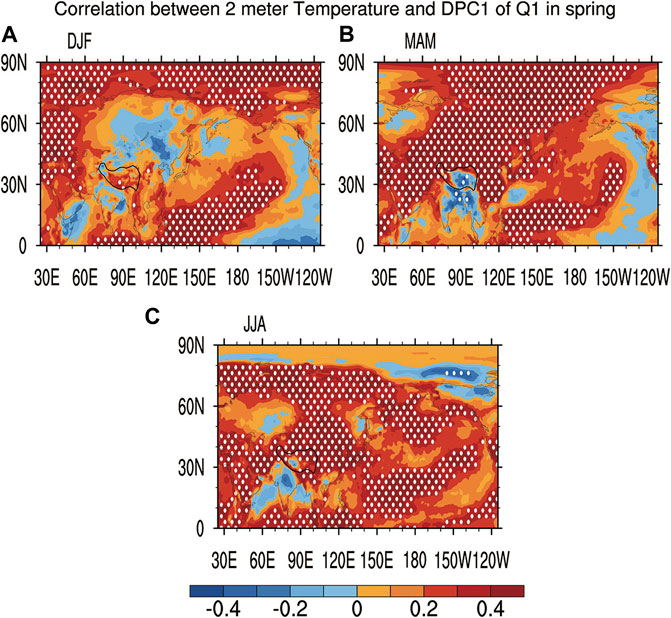
FIGURE 7. Distribution of the correlation coefficients between DPC1 and the 2 m air temperature in the time period 1979–2020 in (A) previous winter, (B) spring and (C) summer. The white dots indicate statistical significance at the 95% confidence level.
The distribution of the 2 mT showed a WACS-like pattern in the previous winter, with a strong positive correlation covering Eastern Europe and the Arctic. In the high DPC1 winter, the temperature over Eastern Europe, the Barents Sea region and the entire Arctic are unusually warm, while it was colder in Siberia and northern East Asia. Previous studies have shown that the WACS pattern has been the dominant mode in winter throughout Eurasia in recent years and may share a close relationship with the winter blocking high (the Ural blocking high), the Arctic oscillation and sea ice cover (Cohen et al., 2014; Luo et al., 2017; Cohen et al., 2020; Dong et al., 2020; Jin et al., 2020). In addition, subtropical regions are warm, which is often seen as WACS-related temperature anomalies (Cohen et al., 2014; Francis and Skific, 2015).
In spring, the region of positive temperature correlation in Eurasia expanded further eastward to the surrounding sea area, but the temperature decreased in the QTP and on its southern side. The meridional temperature distribution showed a + − + tripolar pattern. According to the theory of thermal winds, such an anomaly in the meridional temperature gradient will stimulate an easterly wind anomaly near the QTP and East Asia and a westerly wind anomaly at high latitudes. This facilitates strengthening and expansion of the South Asian high and the development of high-pressure systems in East Asia in summer.
The anomaly in the meridional temperature gradient did not favor the northward movement of the subtropical monsoon and hindered the establishment and advancement of the subtropical EASM. By contrast, it generated a westerly wind anomaly in the tropical and South Asian monsoon regions, thereby strengthening the South Asian summer monsoon. This anomalous pattern lasted until summer. The warm area expanded further to the south and the reduced East Asia–West Pacific temperature contrast was not conducive to the enhancement and northward movement of the EASM. We therefore conclude that the DEOF1 may be intimately related to the WACS anomaly between Eurasia and the Arctic in the previous winter.
Figure 8 shows the correlation coefficients between
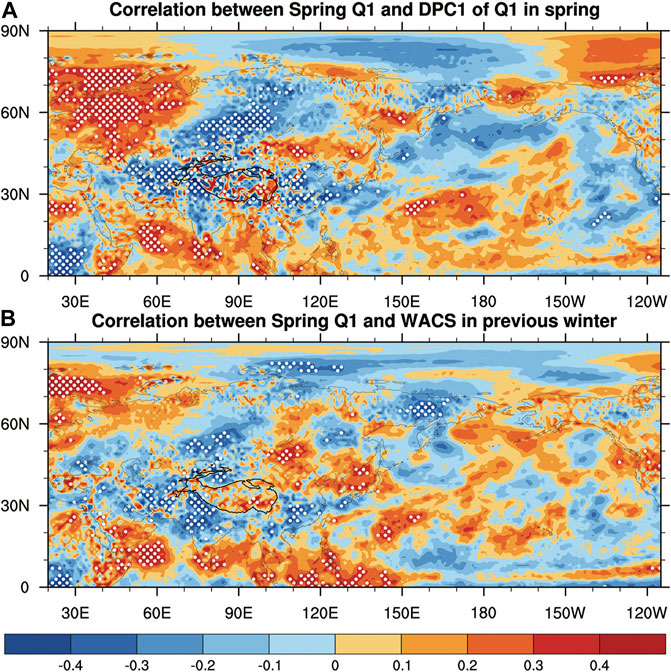
FIGURE 8. (A) Spatial distribution of correlation coefficients between DPC1 and
When the DPC1 was positive in spring, although the central-eastern part of the QTP was a heat source, the other regions of the QTP and its surroundings were mainly a cold source and the tropical ocean was a heat source. The land–sea thermal contrast was therefore reduced, which did not favor strengthening of the EASM. The WACS in the previous winter may therefore be related to the formation of the DEOF1 mode characterizing the warm QTP and cold surroundings in spring.
Figures 9, 10 show that DPC1 was significantly associated with the Pacific SST in all seasons. In the year with a high DPC1, there was a negative anomaly in the central-eastern Pacific in the previous winter and spring and a strong positive anomaly near the western Pacific warm pool, which was similar to the La Niña SST anomaly (SSTA). This SSTA pattern was consistent with the distribution of 2mT (Figure 7) and Figure 10, suggesting that this SSTA pattern may be related to the WACS. The warm SST anomaly in the western Pacific lasted until summer, which did not favor an enhancement of the land–sea thermal contrast in the Asia–Pacific region and the inversion of the high- and low-latitude SST gradients and therefore hindered the formation of the EASM.
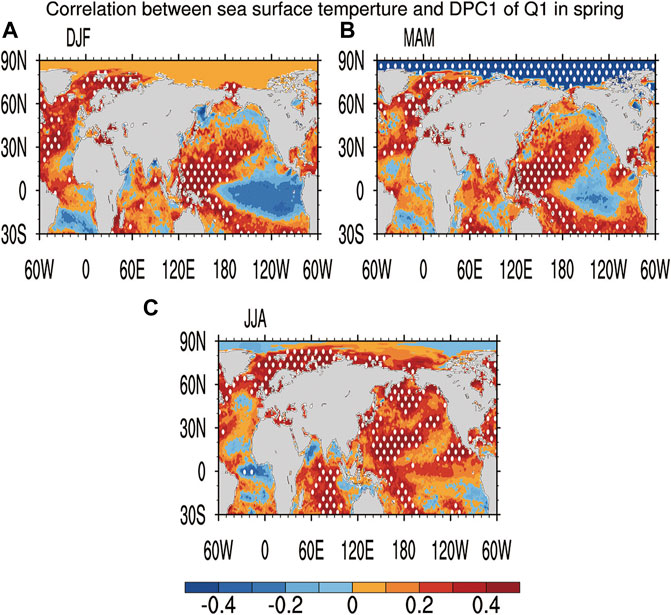
FIGURE 9. Distribution of the correlation coefficients between DPC1 and the SST in the time period 1979–2020 in (A) previous winter, (B) spring and (C) summer. The white dots indicate statistical significance at the 95% confidence level.
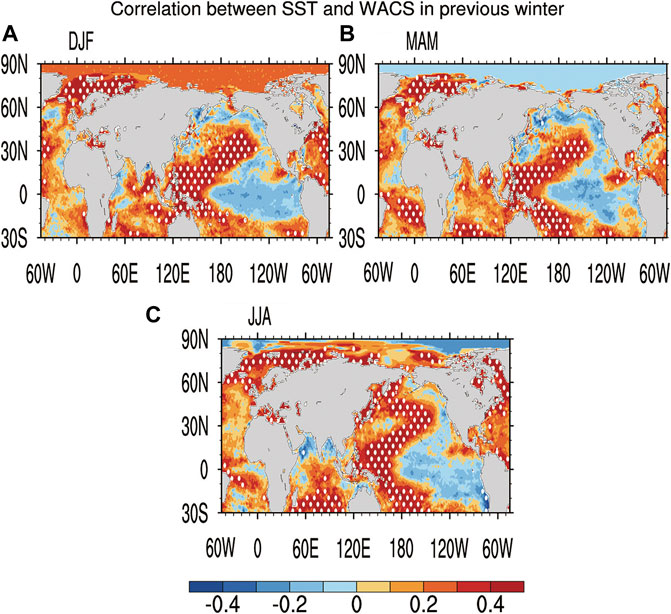
FIGURE 10. Distribution of the correlation coefficients between the WACS index and the SST in the time period 1979–2020 in (A) previous winter, (B) spring and (C) summer. The white dots indicate statistical significance at the 95% confidence level.
We investigated the cross-seasonal relationship between the DEOF1 and the atmospheric circulation in the previous winter and the following summer. Extensive studies have been undertaken to demonstrate that the winter WACS contributes to weakening of the contemporaneous and summer storm track, enhancing wave activity and causing an offset of the jet, which leads, in turn, to frequent warm–dry events in summer (Petrie et al., 2015; Chang et al., 2016; Coumou et al., 2018). However, few studies have attempted to determine how
Figure 11 shows the correlation of DPC1 with the 500 hPa geopotential height and the 300 hPa T-N wave activity flux and Figure 12 shows the 700 hPa wind field for each season. Arrows denote vector resultants of correlation coefficient between DPC1 and zonal and meridional components. A positive correlation for zonal or meridional component is denoted by an eastward or poleward arrow, respectively (Kodera and Kuroda, 2005; Zhao et al., 2016). In the previous winter (Figures 11A, 12A), the wave activity was strong from the polar regions through Siberia to the northwest Pacific. The blocking high in the Western Asia–Eastern Europe region caused warmer temperatures in the Arctic due to poleward transports of the warm air-flow behind of the ridge and the cool Siberia due to the southward transport of cold air in the front of the high ridge. This caused a WACS pattern of Figure 7A. The cold Siberia is likely favored the formation of the DEOF1 of
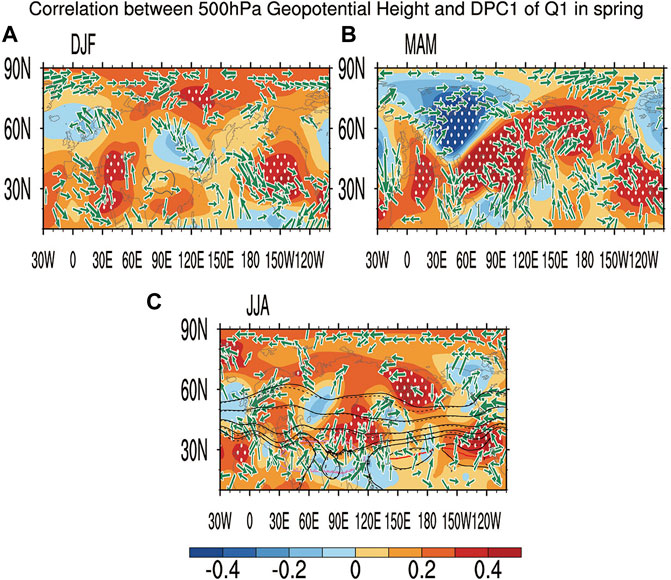
FIGURE 11. Distribution of the correlation coefficients between DPC1 and 500 hPa geopotential height (shading; gpm) and vector resultants of correlation coefficient between DPC1 and the 300 hPa T-N wave activity flux (arrows; m/s) in the time period 1979–2020 in (A) previous winter, (B) spring and (C) summer. The white dots indicate statistical significance at the 95% confidence level. In part (C), the black solid/dashed lines are the composite geopotential height contours in summer of DPC1 high (DPC1 > 1)/low (DPC1 < −1) years (only the 5,860, 5,840, 5,800, 5,720, and 5,640 gpm lines are shown). The red solid/dashed lines are the composite subtropical high in summer of DPC1 high (DPC1 > 1)/low (DPC1 < −1) years. The purple lines are the composite 12,500 contour of the DPC1 high (DPC1 > 1)/low (DPC1 < −1) in summer (the South Asian high-pressure range). Vectors are plotted as arrows only when statistical significance of zonal component of T-N wave activity flux is at the 90% confidence level. A positive correlation for zonal or meridional component is denoted by an eastward or poleward arrow, respectively.
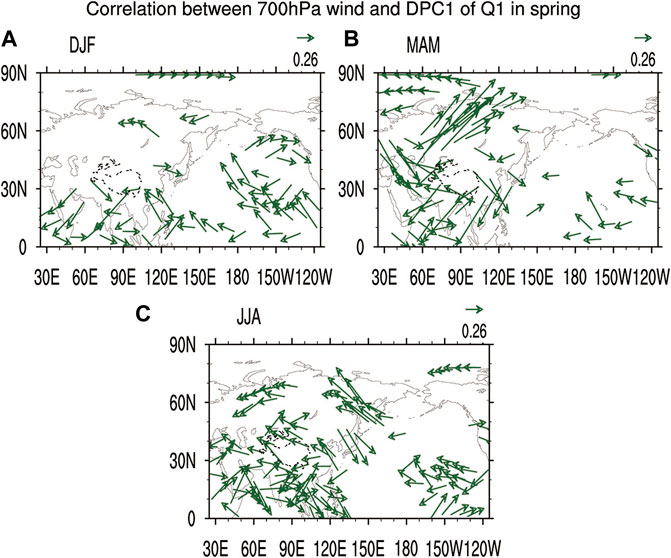
FIGURE 12. Vector resultants (arrows) of correlation coefficient between DPC1 and 700 hPa zonal and meridional wind in the time period 1979–2020 in (A) previous winter, (B) spring and (C) summer. A positive correlation for zonal or meridional wind is denoted by an eastward or poleward arrow, respectively. Arrows are shown only when the statistical significance at the 90% confidence level for the correlations of zonal wind.
We also found that the mid-high latitude planetary waves continue to propagate to the southeast, causing positive and negative phase interval anomalies in the geopotential height and wind fields over the East Asia–Pacific region, further affecting the SST. Strong easterly winds south of the north Pacific high-pressure region strengthened the trade winds and could cause a La Niña-like SSTA (Figures 9A, 10A). The positive SSTA in the western Pacific had a seasonal persistence, which did not enhance the land–sea thermal contrast in East Asia and thus affected the establishment of the subtropical monsoon.
For the same period (spring) (Figures 11A, 12B), the correlation coefficient field of DPC1 with the geopotential height showed a significant − + dipole distribution from the northwest to the southeast in Eurasia. The low-pressure anomaly accompanied by an anomalous cyclonic circulation may be related to feedback from the warm, dry underlying surface caused by the blocking high (Fischer et al., 2007; Coumou et al., 2018). The anomalous low pressure also caused an intensified southwesterly wind anomaly on its southeastern side. The planetary wave propagating southeast from the Barents Sea converged with the north-moving planetary wave east of Lake Baikal, which was responsible for the development of an easterly wind. In this way, a large-scale high-pressure anomaly with an anomalous anticyclonic circulation extended from the QTP to the northeast, eventually resulting in warm, dry weather.
We determined the DEOF of
The mode with a warm QTP weakened the mid-latitude meridional temperature gradient, which hindered strengthening of the storm track and the generation of cyclones, but favored the formation of a high-pressure ridge (Matsumura et al., 2014; Petrie et al., 2015). The positive geopotential height anomaly and the anticyclonic circulation anomaly on the northeastern side of the QTP were present in both spring and summer (Figures 11B,C, 12B,C), reflecting the existence of intensified high-pressure systems, such as the South Asian high-pressure region and blocking high, and suppressing precipitation in northern China.
The winter WACS pattern can affect the atmospheric circulation in the northern hemisphere and planetary wave activity in summer. This causes a weak mid-latitude zonal circulation with east–west waveguides in summer, which can excite latitudinal global wave columns (Petoukhov et al., 2016; Coumou et al., 2018) and affect the weather in distant regions. Figure 11C shows that the trough and ridge were more pronounced at mid- and high latitudes in summer when the DPC1 was positive in spring, with the WACS pattern in the previous winter and that there was significant planetary wave activity near the jet belt. This is consistent with previous studies (Petoukhov et al., 2016; Coumou et al., 2018). Thermal anomalies over the QTP may also have an important role because the QTP is higher in elevation and is located south of this global zonal wave train; thermal anomalies in the QTP can affect areas over and downstream of this region via the zonal wave train.
Planetary waves tend to converge in southern East Asia and disperse in the north, which results in an anticyclonic (high-pressure) anomaly. This anticyclonic circulation dominates the central and northern regions of China. Such an anomalous circulation causes a sinking trend, which does not favor the transport of water vapor (Haarsma et al., 2009). Zhu, 1934) proposed that droughts in the Yangtze River region are mainly caused by easterly winds, which are not conducive to the formation of the northward-moving monsoon. Such a dominant high-pressure anomaly may therefore be responsible for drought over most of China in summer.
The results of our dynamic field analysis can also be verified in the precipitation field. Figure 13 shows the correlation fields between DPC1 in spring and precipitation in different seasons. Precipitation in summer was significantly suppressed in the Yangtze river basin, Central China and North China in summer, apart from coastal South China and the western part of the QTP, which denotes the rain belt is obviously south in summer due to the slow advancement of the EASM. And there is more precipitation in the Indian Peninsula, the Bay of Bengal and the western plateau, corresponding to the strong south Asian summer monsoon (Table 1).
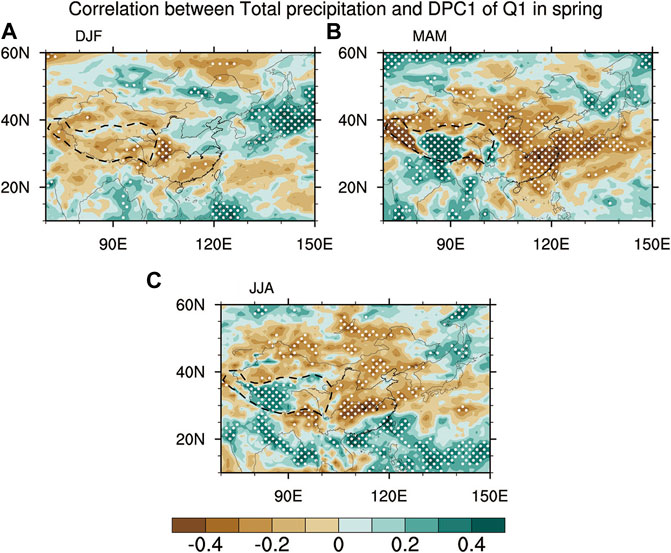
FIGURE 13. Distribution of the correlation coefficients between DPC1 and precipitation in the time period 1979–2020 in (A) previous winter, (B) spring and (C) summer. White dots indicate statistical significance at the 90% confidence level.
In conclusion, when the DEOF1 was in the positive phase, it was often accompanied by a WACS pattern in the previous winter and an active global zonal wave train, which caused a large-scale circulation anomaly (a high-pressure anomaly) and a Pacific SSTA (west warm winter cold) in East Asia–Pacific region. It not only caused a warm QTP and cool surroundings in spring and summer, but had a seasonal persistence, which led to a circulation anomaly in East Asia in summer. The seasonal persistence of the western Pacific SST warming and the main mode of
We verified the cross-seasonal relationships in the observations between the spring QTP
Table 2 shows the results of the partial correlation analysis. The correlation between the WACS pattern and the EASM in the previous winter was −0.34 (p < .05). When the effect of DPC1 was excluded, the correlation decreased to −0.18, which was not significant. This suggests that the cross-seasonal relationship between the WACS pattern and the EASM is related to the DEOF1 of
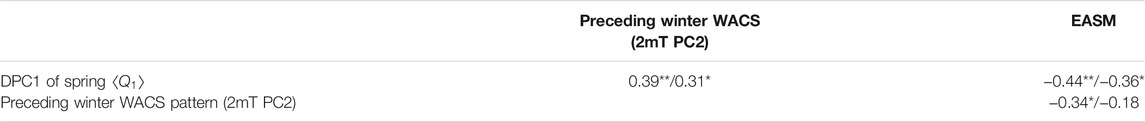
TABLE 2. Correlation/partial correlation coefficients of the DPC1 with the previous winter WACS pattern and the EASM index.
We used the CMIP6 historical simulation data to validate our results. The model DEOF analysis (Supplementary Figures S7,8) showed that the multi-model ensemble DEOF2 characterized the pattern of a warm plateau with cold surroundings. DPC2 also had a high correlation with the observational DPC1, with the correlation coefficient reaching 0.38 (p < .05; Supplementary Figure S9). Therefore, although the observational DEOF1 may not be reproduced in the model DEOF1, it may correspond to the model DEOF2. To validate this suggestion, we calculated the correlation coefficient between the model DPC2 in the three seasons and the atmospheric circulation variables (Supplementary Figures S10–S14) to determine whether the correlation coefficient field displayed the warm Arctic–cold Eurasia pattern and was related to the La Niña in the previous winter and whether there was a significant high-pressure anomaly and large-scale droughts in East Asia in the following summer.
The model DEOF results showed that the Arctic and Ural Mountains underwent exceptional warming in the previous winter. The fact that the northwestern Pacific warmed while the eastern Pacific was cold agreed with the observations. The cold Siberia signal was not obvious, which also agreed with the observations. In the model SST field, the La Niña-like Pacific SSTA in the observations (warm in the west and cold in the east) was reproduced well and was maintained until the summer. This implies a coupling relationship between the WACS pattern and the Pacific SSTA, which means that the two factors both affect
We compared
We found that the reliable-to-noise ratio of
We analyzed the relationship between DEOF1 and the atmospheric circulation in the previous winter and the EASM. We found that DEOF1 was linked to both the WACS temperature anomaly in the previous winter and the weakened EASM and droughts in most parts of China (the Yangtze river basin, Central China and North China) in the following summer mainly based on ERA5 data. The WACS pattern in the previous winter was associated with intensified blocking in Eastern Europe and a warmer Barents Sea, and was likely related to decrease in snow on the middle and eastern QTP in winter and spring (Si and Ding, 2013). The WACS signal affected Siberia, the area around the plateau and the north Pacific Ocean through the propagation of planetary waves at mid- and high latitudes, resulting in a colder Siberia with the tropical Pacific Ocean featuring a La Niña-like pattern. The SSTA was maintained from spring to summer, reducing the land–sea thermal contrast in the subtropical monsoon region of the East Asia. This WACS pattern facilitates the formation of the QTP’s dominant mode, leading to a + − + tripolar distribution of the temperature anomaly near the plateau in spring and summer, which coincided with the tripole mode between the Arctic and the QTP region (Li, et al., 2021; Liu et al., 2021b). And the weakened temperature gradient at mid- and high latitudes led to a weaker storm track and fewer cyclones at mid-latitudes (Chang et al., 2016). A widespread easterly wind anomaly and anticyclonic (high-pressure) anomaly were therefore generated in the surroundings of the plateau and East Asia, which hindered the establishment and northward movement of the monsoon airflow in East Asia and led to widespread drought. The cross-seasonal relationship between the winter WACS pattern and the leading mode of the spring
Data availability Statement Publicly available datasets were analyzed in this study. These data can be found here: ERA5 data is available via https://cds.climate.copernicus.eu/cdsapp#!/search?type=dataset&text=era5. The NCEP/DOE reanalysis data is available via https://psl.noaa.gov/data/gridded/reanalysis/. The EASM index (Huang and Zhao, 2019) and atmospheric heat source/sink dataset over the Tibetan Plateau based on satellite and station (Duan, 2019) isare available via http://www.tpdc.ac.cn/zh-hans/. The South Asian summer monsoon index is available via http://ljp.gcess.cn/dct/page/1http://lijianping.cn/dct/page/1. The northern Pacific subtropical high index and the western Pacific warm pool intensity index is available via https://cmdp.ncc-cma.net/cn/download.htm. The Arctic oscillation index is available via www.cpc.ncep.noaa.gov/products/precip/CWlink/daily_ao_index/ao.shtml. The multivariate El Niño–Southern Oscillation index version 2 is available via https://psl.noaa.gov/enso/mei. CMIP6 Historical simulation is available via https://esgf-node.llnl.gov/projects/cmip6.
YY carried out data collection and data analysis. YY and LZ drafted the manuscript. LZ and XS designed the methods and edited the manuscript. ZX and QL edited and reviewed the manuscript.
This work is supported by the Strategic Priority Research Program of the Chinese Academy of Sciences (XDA20100304 and XDA20060501), the Second Tibetan Plateau Scientific Expedition and Research Program (STEP) (2019QZKK0208), Guangdong Major Project of Basic and Applied Basic Research (2020B0301030004), the National Natural Science Foundation of China (41790471, 41975054, 41930967, and U2033207) and the National Key Research and Development Program of China (2018YFA0606203 and 2019YFC1510400).
The authors declare that the research was conducted in the absence of any commercial or financial relationships that could be construed as a potential conflict of interest.
All claims expressed in this article are solely those of the authors and do not necessarily represent those of their affiliated organizations, or those of the publisher, the editors and the reviewers. Any product that may be evaluated in this article, or claim that may be made by its manufacturer, is not guaranteed or endorsed by the publisher.
We thank the reviewers and editor for insightful remarks. We would like to thank the European Centre for Medium-Range Weather Forecasts for providing the ERA5 reanalysis data and the NOAA/OAR/ESRL PSL for providing NCEP data. We thank the National Climate Center of China, National Tibetan Plateau Data Center of China, Prof. Jianping Li and Prof. Gang Huang for the index data. The authors acknowledged the World Climate Research Program’s Working Group on Coupled Modeling and thank the climate modeling groups for producing and making available their model output.
The Supplementary Material for this article can be found online at: https://www.frontiersin.org/articles/10.3389/feart.2022.835101/full#supplementary-material
Ao, T., and Li, Y. Q. (2015). Summer Thermal Characteristics over Qinghai-Xizang Plateau and Surrounding Areas and its Relationship with Precipitation in East Asia. Plateau Meteorol. 34 (5), 1204–1216. doi:10.7522/j.issn.1000-0534.2014.00100
Chang, E. K. M., Ma, C. G., Zheng, C., and Yau, A. M. W. (2016). Observed and Projected Decrease in Northern Hemisphere Extratropical Cyclone Activity in Summer and its Impacts on Maximum Temperature. Geophys. Res. Lett. 43, 2200–2208. doi:10.1002/2016GL068172
Cohen, J., Screen, J. A., Furtado, J. C., Barlow, M., Whittleston, D., Coumou, D., et al. (2014). Recent Arctic Amplification and Extreme Mid-latitude Weather. Nat. Geosci 7 (9), 627–637. doi:10.1038/ngeo2234
Cohen, J., Zhang, X., Francis, J., Jung, T., Kwok, R., Overland, J., et al. (2020). Divergent Consensuses on Arctic Amplification Influence on Midlatitude Severe winter Weather. Nat. Clim. Chang. 10 (6), 20–29. doi:10.1038/s41558-019-0662-y
Cook, E. R., Anchukaitis, K. J., Buckley, B. M., D’Arrigo, R. D., Jacoby, G. C., and Wright, W. E. (2010). Asian Monsoon Failure and Megadrought During the Last Millennium. Sci. 328 (5977), 486–489. (in Chinese). doi:10.1126/science.1185188
Coumou, D., Di Capua, G., Vavrus, S., Wang, L., and Wang, S. (2018). The Influence of Arctic Amplification on Mid-latitude Summer Circulation. Nat. Commun. 9 (1). doi:10.1038/s41467-018-05256-8
Daisuke, M., Ryuichi, K., and Tomonori, M. (2003). A Mechanism of the Onset of the South Asian Summer Monsoon. Meteorol. Soc. Jpn. 81 (3), 563–580. doi:10.2151/jmsj.81.563
Dommenget, D. (2007). Evaluating EOF Modes against a Stochastic Null Hypothesis. Clim. Dyn. 28 (15), 517–531. doi:10.1007/s00382-006-0195-8
Dommenget, D., and Latif, M. (2002). A Cautionary Note on the Interpretation of EOFs. J. Clim. 15 (2), 2162–2225. doi:10.1175/1520-0442(2002)015<0216:ACNOTI>2.0
Dong, M., Zhu, W. M., and Xu, X. D. (2001). The Variation of Surface Heat Flux over Tibetan Plateau and its Influences on the East Asia Circulation in Early Summer. J. Appl. Meteot Sci. 12 (4), 459–468.
Dong, W., Zhao, L., Zhou, S., and Shen, X. (2020). A Synergistic Effect of Blockings on a Persistent Strong Cold Surge in East Asia in January 2018. Atmosphere 11 (2), 215. doi:10.3390/atmos11020215
Duan, A. (2019). Atmospheric Heat Source/sink Dataset over the Tibetan Plateau Based on Satellite and Routine Meteorological Observations (1984-2015). National Tibetan Plateau Data Center (in Chinese). doi:10.1080/20964471.2018.15141
Duan, A. M., Xiao, Z. X., and Wang, Z. Q. (2018). Impacts of the Tibetan Plateau winter/spring Snow Depth and Surface Heat Source on Asian Summer Monsoon: A Review. Chin. J. Atmos Sci. 42 (4), 755–766. doi:10.3878/j.issn.1006-9895.1801.17247
Duan, A. M., Xiao, Z. X., Wu, G. X., and Wang, M. R. (2014). Study Progress of the Influence of the Tibetan Plateau Winter and Spring Snow Depth on Asian Summer Monsoon. Meteorol. Environ Sci 37 (3), 95–101. doi:10.16765/j.cnki.1673-7148.2014.03.012
Eyring, V., Bony, S., Meehl, G. A., Senior, C. A., Stevens, B., Stouffer, R. J., et al. (2016). Overview of the Coupled Model Intercomparison Project Phase 6 (CMIP6) Experimental Design and Organization. Geosci. Model. Dev. 9 (5), 1937–1958. doi:10.5194/gmd-9-1937-2016
Feng, Z. G., Chen, X., Cheng, X. W., Xu, S., and Liang, S. X. (2014). DEOF Analysis and its Application to the Research on the Rainstorms in the Huaihe River Basin. Acta Meteorol. Sinica 72 (6), 1246–1256.
Fischer, E. M., Seneviratne, S. I., Vidale, P. L., Lüthi, D., and Schär, C. (2007). Soil Moisture-Atmosphere Interactions during the 2003 European Summer Heat Wave. J. Clim. 20 (20), 5081–5099. doi:10.1175/JCLI4288.1
Flohn, H. (1957). Large-scale Aspects of the “Summer Monsoon” in South and East Asia. J. Meteorol. Soc. Jpn. 35A, 180–186. doi:10.2151/jmsj1923.35A.0_180
Flohn, H., and Reiter, E. R. (1968). Contributions to Meteorology of the Tibetan Highland, Fort Collins, CO: Department of Atmospheric Science, Colorado State University, 130.
Francis, J., and Skific, N. (20152045). Evidence Linking Rapid Arctic Warming to Mid-latitude Weather Patterns. Phil. Trans. R. Soc. A. 373, 20140170. doi:10.1098/rsta.2014.0170
Gerber, E. P., and Vallis, G. K. (2005). A Stochastic Model for the Spatial Structure of Annular Patterns of Variability and the North Atlantic Oscillation. J. Clim. 18 (12), 2102–2118. doi:10.1175/JCLI3337.1
Guan, W. N., Jiang, X. N., Ren, X. J., Chen, G., and Ding, Q. H. (2020). Role of Atmospheric Variability in Driving the “Warm-Arctic, Cold-Continent” Pattern Over the North America Sector and Sea Ice Variability Over the Chukchi-Bering Sea. Geophys. Res. Lett. 47 (13). doi:10.1029/2020GL088599
Haarsma, R. J., Selten, F., Hurk, B. v., Hazeleger, W., and Wang, X. (2009). Drier Mediterranean Soils Due to Greenhouse Warming Bring Easterly Winds over Summertime central Europe. Geophys. Res. Lett. 36 (4), 1–7. doi:10.1029/2008GL036617
He, H., Mcginnis, J. W., Song, Z., and Yanai, M. (1987). Onset of the Asian Summer Monsoon in 1979 and the Effect of the Tibetan Plateau. Mon. Wea. Rev. 115 (9), 1966–1995. doi:10.1175/1520-0493(1987)115<1966:ootasm>2.0.co;2
Hersbach, H., Bell, B., Berrisford, P., Biavati, G., Horányi, A., Muñoz Sabater, J., et al. (2018). ERA5 Monthly Averaged Data on Pressure Levels from 1979 to present(C3S) Climate Data Store (CDS). Available at: https://cds.climate.copernicus.eu/cdsapp#!/dataset/10.24381/cds.bd0915c6?tab=overview (Accessed on July 27, 2021).
Hu, J. Q., Yang, Y. C., Liao, L. P., Deng, S. M., and Chen, L. H. (2018). Characteristics and Future Trend of Seasonal Dry and Wet Evolution in Guangxi Based on Multiple Rainfall Data. Mountain Res. 36 (2), 148–159. doi:10.16089/j.cnki.1008-2786.000320
Huang, G., and Zhao, G. (2019). The East Asian Summer Monsoon index (1851-2021). National Tibetan Plateau Data Center (in Chinese). doi:10.11888/Meteoro.tpdc.270323
Huang, R. H. (1985). The thermal Effect of the Qinghai-Xizang Plateau on Formation and Maintenance of the Mean Monsoon Circulation over South Asia in Summer. J. Trop. Meteorol. 1 (1), 2–8. doi:10.16032/j.issn.1004-4965.1985.01.001
Jianping, L., and Qingcun, Z. (2003). A New Monsoon index and the Geographical Distribution of the Global Monsoons. Adv. Atmos. Sci. 20 (2), 299–302. doi:10.1007/s00376-003-0016-5
Jin, C., Wang, B., Yang, Y. M., and Liu, J. (2020). "Warm Arctic‐Cold Siberia" as an Internal Mode Instigated by North Atlantic Warming. Geophys. Res. Lett. 47 (9). doi:10.1029/2019GL086248
Kalnay, E., Kanamitsu, M., Kistler, R., Collins, W., Deaven, D., Gandin, L., et al. (1996). The NCEP/NCAR 40-year Reanalysis Project. Bull. Amer. Meteorol. Soc. 77, 437–471. doi:10.1175/1520-0477(1996)077<0437:tnyrp>2.0.co;2
Kanamitsu, M., Ebisuzaki, W., Woollen, J., Yang, S., Hnilo, J. J., Fiorino, M., et al. (2002). NCEP–DOE AMIP-II Reanalysis (R-2). Bull. Am. Meteorol. Soc. 83 (11), 1631–1643.
Kodera, K., and Kuroda, Y. (2005). A Possible Mechanism of Solar Modulation of the Spatial Structure of the North Atlantic Oscillation. J. Geophys. Res. 110 (D2), D02111. doi:10.1029/2004JD005258
Kuo, H. L., and Qian, Y. F. (1983). Numerical Simulation of the Development of Mean Monsoon Circulation in July. Mon. Weather Rev. 110 (12), 1879–1897. doi:10.1175/1520-0493(1982)110<1879:NSOTDO>2.0.CO;2
Li, C., and Yanai, M. (1996). The Onset and Interannual Variability of the Asian Summer Monsoon in Relation to Land-Sea Thermal Contrast. J. Clim. 9 (2), 358–375. doi:10.1175/1520-0442(1996)009<0358:toaivo>2.0.co;2
Li, D. L., He, J. H., Tang, X., Lei, X. T., and Hou, Y. L. (2007). The Relationship between the Intensity of Surface Heating Fields over the Qinghai-Xizang Plateau and ENSO Cycle. Plateau Meteorol. 26 (1), 40–46. (in Chinese).
Li, Q., Zhao, M., Yang, S., Shen, X., Dong, L., and Liu, Z. (2021). A Zonally-Oriented Teleconnection Pattern Induced by Heating of the Western Tibetan Plateau in Boreal Summer. Clim. Dyn. 57, 2823–2842. doi:10.1007/s00382-021-05841-6
Li, X., Wang, L., Guo, X., and Chen, D. (2017). Does Summer Precipitation Trend over and Around the Tibetan Plateau Depend on Elevation? Int. J. Climatol 37, 1278–1284. doi:10.1002/joc.4978
Liang, X. Y., Liu, Y. M., and Wu, G. X. (2005). The Impact of Qinghai-Xizang Plateau Uplift on Asian General Circulation in Spring and Summer. Plateau Meteorol. 24 (6), 838–845. (in Chinese).
Liu, B. Q., Duan, Y. N., Li, J., Mao, Y., and Mao, J. Y. (2021a). Intraseasonal Oscillation of Atmospheric Heat Source over the Qinghai-Xizang Plateau in Boreal Spring and its Maintaining Mechanism. Plateau Meteorology 40 (6), 1419–1431.
Liu, H., Zhou, T., Zhu, Y., and Lin, Y. (2012). The Strengthening East Asia Summer Monsoon since the Early 1990s. Chin. Sci. Bull. 57 (9), 1553–1558. doi:10.1007/s11434-012-4991-8
Liu, X. D., Luo, S. W., and Qian, Y. F. (1989). Numerical Simulations of Influences of Different thermal Characteristics on Ground Surface of Tibetan Plateau on the over Se-Asian. Plateau Meteorol. 8 (3), 206–216. (in Chinese).
Liu, X., Li, W. P., Xu, H. X., and Wu, G. X. (2007). The Effect of Tibetan Plateau Heating on the East Asian Summer Precipitation. Plateau Meteorol. 26 (6), 1288–1292. (in Chinese).
Liu, X., Liu, Y., Wang, X., and Wu, G. (2020). Large‐Scale Dynamics and Moisture Sources of the Precipitation over the Western Tibetan Plateau in Boreal Winter. J. Geophys. Res. Atmos. 125, e2019JD032133. doi:10.1029/2019JD032133
Liu, X., Lu, J., Liu, Y., and Wu, G. (2021b). Meridional Tripole Mode of Winter Precipitation over the Arctic and Continental North Africa-Eurasia. J. Clim. 34 (24), 1–9678. doi:10.1175/JCLI-D-21-0212.1
Liu, X., Wu, G. X., Liu, Y. M., and Liu, P. (2002). Diabatic Heating over the Tibetan Plateau and the Seasonal Variations of the Asian Circulation and Summer Monsoon Onset. Chin. J. Atmos Sci. 26 (6), 782–793. (in Chinese).
Luo, D., Yao, Y., Dai, A., Simmonds, I., and Zhong, L. (2017). Increased Quasi Stationarity and Persistence of Winter Ural Blocking and Eurasian Extreme Cold Events in Response to Arctic Warming. Part II: A Theoretical Explanation. J. Clim. 30 (10), 3569–3587. doi:10.1175/JCLI-D-16-0262.1
Luo, H., and Yanai, M. (1983). The Large-Scale Circulation and Heat Sources over the Tibetan Plateau and Surrounding Areas during the Early Summer of 1979. Part I: Precipitation and Kinematic Analyses. Mon. Wea. Rev. 111 (5), 922–944. doi:10.1175/1520-0493(1983)111<0922:tlscah>2.0.co;2
Luo, H., and Yanai, M. (1984). The Large-Scale Circulation and Heat Sources over the Tibetan Plateau and Surrounding Areas during the Early Summer of 1979. Part II: Heat and Moisture Budgets. Mon. Wea. Rev. 112 (5), 966–989. doi:10.1175/1520-0493(1984)112<0966:tlscah>2.0.co;2
Luo, L. S., Duan, C. F., Bi, Y., Tang, W. A., and Ding, X. J. (2016). Relation between Atmospheric Heat Source in spring over Tibetan Plateau and Mid-summer High Temperature Events in Middle-Lower Reaches of the Yangtze River. Scientia Meteorol. Sinica 36 (5), 614–621. doi:10.3969/2015jms.0062
Luo, L. S. (1989). Review of Study on Weather and Circulation in Qinghai-Xizang Plateau Area. Plateau Meteorol. 8 (2), 122–126. (in Chinese).
Luo, M. X., and Zhang, K. S. (1991). Numerical experiment on the Effects of the Large Scale Topography and Diabatic Heating on the Formation of East Asian Monsoon and India Monsoon Sirculation. Chin. J. Atmos Sci. 15 (2), 41–52. (in Chinese).
Matsumoto, J. (1992). The Seasonal Changes in Asian and Australian Monsoon Regions. J. Meteorol. Soc. Jpn. 70 (1B), 257–273. doi:10.2151/jmsj1965.70.1B_257
Matsumura, S., Zhang, X., and Yamazaki, K. (2014). Summer Arctic Atmospheric Circulation Response to spring Eurasian Snow Cover and its Possible Linkage to Accelerated Sea Ice Decrease. J. Clim. 27 (17), 6551–6558. doi:10.1175/JCLI-D-13-00549.1
Murakami, T., and Matsumoto, J. (1994). Summer Monsoon over the Asian Continent and Western North Pacific. J. Meteorol. Soc. Jpn. 72 (5), 719–745. doi:10.2151/jmsj1965.72.5_719
Petoukhov, V., Petri, S., Rahmstorf, S., Coumou, D., Kornhuber, K., and Schellnhuber, H. J. (2016). Role of Quasiresonant Planetary Wave Dynamics in Recent Boreal spring-to-autumn Extreme Events. Proc. Natl. Acad. Sci. USA 113 (25), 6862–6867. doi:10.1073/pnas.1606300113
Petrie, R. E., Shaffrey, L. C., and Sutton, R. T. (2015). Atmospheric Response in Summer Linked to Recent Arctic Sea Ice Loss. Q.J.R. Meteorol. Soc. 141, 2070–2076. doi:10.1002/qj.2502
Qin, J., Yang, K., Liang, S., and Guo, X. (2009). The Altitudinal Dependence of Recent Rapid Warming over the Tibetan Plateau. Clim. Change 97 (1–2), 321–327. doi:10.1007/s10584-009-9733-9
Ren, X. J., and Qian, Y. F. (2003). Numerical Simulation Experiments of the Impacts of Local Sea-Land Thermodynamic Contrasts on the SCS Summer Monsoon Onset. J. Trop. Meteorol. 18 (4), 328–334. doi:10.16032/j.issn.1004-4965.2002.04.005
Shan, X., Zhou, S. W., Wang, M. R., Zheng, D., and Wang, C. H. (2020). Effects of Spring Sensible Heat in the Tibetan Plateau on Minsummer Precipitation in South China under ENSO. J. Trop. Metror 36 (1), 60–71. doi:10.16032/j.issn.1004-4965.2020.007
Shao, H., and Qian, Y. F. (2001). Thermal Influences of Land-Sea Contrast and Topography on Summer Monsoon of 1998. J. Trop. Meteorol. 17 (1), 46–56.
Si, D., and Ding, Y. (2013). Decadal Change in the Correlation Pattern between the Tibetan Plateau Winter Snow and the East Asian Summer Precipitation during 1979-2011. J. Clim. 26 (19), 7622–7634. doi:10.1175/jcli-d-12-00587.1
Sun, Y., and Ding, Y. H. (2002). Influence of Anomalous Heat Source over Tibetan Plateau on the Anomalous Activities of the 1999 East Asian Summer Monsoon. Chin. J. Atmos Sci. 26 (6), 818–828. (in Chinese).
Tian, Y. R., Li, G. P., and Liu, Y. F. (2017). Comparison of the Atmospheric Heat Sources over the Tibetan Plateau Computed by Three Reanalysis Data Sets. Desert Oasis Meteorol. 11 (4), 1–8.
Wang, M. R., Guo, D., and Zhong, S. S. (2019). Comparision of the Multi-Source Datasets in Calculation of the Atmospheric Heat Source over the Tibetan Plateau. Meteorol. Mon 42 (12), 1718–1726. doi:10.7519/j.issn.1000-0526.209.12.009
Wang, Q., Guo, P. W., and Cao, Y. Y. (2007). Interdecadal Variations of the Relationship of Spring Thermal Anomaly over Easten Tibetan Plateau and East Asian Summer Monsoon. J. Nanjing Inst. Meteorology 30 (2), 259–265.
Wang, Q., Guo, P. W., and Zhou, H. W. (2011). Climatic Character of Heat Source in Tibetan Plateau. Scientia Meteorol. Sinica 31 (2), 179–186.
Wu, G., Duan, A., Liu, Y., Mao, J., Ren, R., Bao, Q., et al. (2015). Tibetan Plateau Climate Dynamics: Recent Research Progress and Outlook. Natl. Sci. Rev. 2 (1), 100–116. doi:10.1093/nsr/nwu045
Wu, G., Liu, Y., He, B., Bao, Q., Duan, A., and Jin, F.-F. (2012). Thermal Controls on the Asian Summer Monsoon. Sci. Rep. 2 (1), 404. doi:10.1038/srep00404
Xu, T. T., Fan, G. Z., Lai, X., and Zhang, Y. L. (2016). The Thermal Contrast over the Tibetan Plateau, the East Asian and the Pacific Ocean in Strong and Weak East Asian Monsoon Years. J. Chengdu Univ. Inf. Technol. 31 (6), 600–606. doi:10.16836/j.cnki.jcuit.2016.06.009
Yanai, M., Esbensen, S., and Chu, J.-H. (1973). Determination of Bulk Properties of Tropical Cloud Clusters from Large-Scale Heat and Moisture Budgets. J. Atmos. Sci. 30 (4), 611–627. doi:10.1175/1520-0469(1973)030<0611:dobpot>2.0.co;2
Yanai, M., Li, C., and Song, Z. (1992). Seasonal Heating of the Tibetan Plateau and its Effects on the Evolution of the Asian Summer Monsoon. J. Meteorol. Soc. Jpn. 70 (1), 319–351. doi:10.2151/jmsj1965.70.1B_319
Yan, H. M., Qi, M. H., Xiao, Z. N., and Chen, Y. (2005). The Influence of Wintertime Thermal Contrast over the Asian Contient on Asian Monsoon. Chinese J. Atmos. Sci. 29 (4), 550–564 (in Chinese). doi:10.3878/j.issn.1006-9895.2005.04.06
Ye, D. Z., and Gu, Z. C. (1955). Impact of the Tibetan Plateau on the East Asian Atmospheric Circulation and China's Weather. Chin. Sci Bull. 6 (6), 29–33. doi:10.1360/csb1955-0-6-29
Ye, D. Z. (1952). The Seasonal Cariation of the Influence of Tibetan Plateau on the General Circulation. Acta Meteorol. Sin. 23 (1/2), 33–47.
Ye, D. Z., Yang, G. J., and Wang, X. D. (1979). The Average Vertical Circulations over the East-Asia and the Pacific Area, (I) in Summer. Chin. J. Atmos Sci. 3 (1), 2–10. doi:10.1016/0146-6364(79)90015-x
Zhang, L. L., Xie, Q., and Yang, X. Q. (2015). Interdecadal Anomaly of Atmospheric Diabatic Heating and Interdecadal Weakening of East Asian Summer Monsoon at the End of 1970s. Scientia Meteorol. Sinica 35 (6), 663–671. doi:10.3969/2015jms.0064
Zhang, Q., Tao, S., and Chen, L. (2003). The Interannual Variability of East Asian Summer Monsoon Indices and its Association with the Pattern of General Circulation over East Asia (In Chinese). Acta Meteorologica Sinica 56, 199–211.
Zhang, Q. Y., Jin, Z. H., and Peng, J. B. (2006). The Relationships between Convection over the Tibetan Plateau and Circulation over East Asian. Chinese. J. Atmos. Sci. 30 (5), 803–812.
Zhang, R. H., and Zhou, S. W. (2008). The Air Temperature Change over the Tibetan Plateau during 1979-2002 and its Possible Link Age with Ozone Depletion. Acta Meteorol. Sinica 66 (6), 916–925.
Zhang, Y., Fan, G., Hua, W., Zhang, Y., Wang, B., and Lai, X. (2017). Differences in Atmospheric Heat Source between the Tibetan Plateau-South Asia Region and the Southern Indian Ocean and Their Impacts on the Indian Summer Monsoon Outbreak. J. Meteorol. Res. 31 (3), 540–554. doi:10.1007/s13351-017-6042-5
Zhang, Y., and Qian, Y. F. (2002). Thermal Effect of Surface Heat Source over the Tibetan Plateau on the Onset of Asian Summer Monsoon. J. Nanjing Inst. Meteorology 25 (3), 299–306. doi:10.13878/j.cnki.dqkxxb.2002.03.002
Zhang, Z. H., Cai, J. J., Qiao, Y. T., and Jian, M. Q. (2019). Interdecadal Change in the Relation between Atmospheric Apparent Heat Sources over Tibetan Plateau and Precipitation in Eastern China in Summer. Chin. J. Atmos Sci. 43 (5), 990–1004. doi:10.3878/j.issn.1006-9895.1901.18141
Zhao, G., HuangWu, G. R. G., Wu, R., Tao, W., Gong, H., Qu, X., et al. (2015). A New Upper-Level Circulation Index for the East Asian Summer Monsoon Variability. J. Clim. 28 (24), 9977–9996. doi:10.1175/JCLI-D-15-0272.1
Zhao, L., Liu, H., Hu, Y., Cheng, H., and Xiao, Z. (2020). Extratropical Extended-Range Precursors Near the Tropopause Preceding Persistent strong Precipitation in South China: a Climatology. Clim. Dyn. 55 (5633), 3133–3150. doi:10.1007/s00382-020-05437-6
Zhao, L., Zhu, Y., Liu, H., Liu, Z., Liu, Y., Li, X., et al. (2016). A Stable Snow-Atmosphere Coupled Mode. Clim. Dyn. 47 (7), 2085–2104. doi:10.1007/s00382-015-2952-z
Zheng, Q. L., Wang, S. S., Zhang, C. L., and Song, Q. L. (2001). Numerical Study of the Effects of Dynamic and Thermodynamic of Qinghai-Xizang Plateau on Tropical Atmospheric Circulation in Summer. Plateau Meteorol. 20 (1), 15–21. (in Chinese).
Zheng, R., Li, D. L., and Jiang, Y. C. (2015). New Characteristics of Temperature Change over Qinghai-Xizang Plateau on the Background of Global Warming. Plateau Meteorol. 35 (4), 1531–1539. (in Chinese). doi:10.7522/j.issn.1000-0534.2014.00123
Zheng, R., Liu, J. H. M., Wang, C. X., Li, D. L., Tang, Y. H., and Liu, B. (2021). Anomaly of Autumn Rain in the South Area of West China and its Response to Atmospheric Cold Sources over the Tibetan Plateau in Winter. Arid Meteorol. 39 (2), 225–234. (in Chinese). doi:10.11755/j.issn.1006-7639(2021)-02-0225
Zhu, K. Z. (1934). The Enigma of Southeast Monsoon in China. Acta Geographica Sinica (1), 4–30. (in Chinese).
Keywords: atmospheric heat source, Qinghai-Tibetan Plateau, warm arctic-cold siberia, east asian summer monsoon, precipitation, drought
Citation: Yang Y, Zhao L, Shen X, Xiao Z and Li Q (2022) The Spring Heat Source Over the Qinghai–Tibetan Plateau Linked With the Winter Warm Arctic–Cold Siberia Pattern Impacting Summer Drought in China. Front. Earth Sci. 10:835101. doi: 10.3389/feart.2022.835101
Received: 14 December 2021; Accepted: 17 January 2022;
Published: 17 February 2022.
Edited by:
Xichen Li, Institute of Atmospheric Physics (CAS), ChinaReviewed by:
Haiwen Liu, Civil Aviation University of China, ChinaCopyright © 2022 Yang, Zhao, Shen, Xiao and Li. This is an open-access article distributed under the terms of the Creative Commons Attribution License (CC BY). The use, distribution or reproduction in other forums is permitted, provided the original author(s) and the copyright owner(s) are credited and that the original publication in this journal is cited, in accordance with accepted academic practice. No use, distribution or reproduction is permitted which does not comply with these terms.
*Correspondence: Liang Zhao, emhhb2xAbGFzZy5pYXAuYWMuY24=; Xinyong Shen, c2hlbnh5QG51aXN0LmVkdS5jbg==
Disclaimer: All claims expressed in this article are solely those of the authors and do not necessarily represent those of their affiliated organizations, or those of the publisher, the editors and the reviewers. Any product that may be evaluated in this article or claim that may be made by its manufacturer is not guaranteed or endorsed by the publisher.
Research integrity at Frontiers
Learn more about the work of our research integrity team to safeguard the quality of each article we publish.