 Hua Yu
 Chao Wang
 Xuyang Ge
- Key Laboratory of Meteorological Disaster of Ministry of Education, Joint International Research Laboratory of Climate and Environment Change and Collaborative Innovation Center on Forecast and Evaluation of Meteorological Disasters, Nanjing University of Information Science and Technology, Nanjing, China
In this study, two leading modes of the late season (October–December) TC track frequency are identified with the empirical orthogonal function analysis. It is found that circulation anomalies associated with the two modes are linked to the concurrent El Niño-Southern Oscillation (ENSO), but with distinct locations of maximum sea surface temperature (SST). For the first mode, the maximum SST warming and the resulted heating can extend to the equatorial central Pacific, which emanates a cyclonic circulation extending to the east of the Philippines, and then generates an anti-cyclonic circulation to the west of the Philippines by dry advection and local air–sea interaction. In contrast, for the second mode, the maximum SST warming and the corresponding heating shift eastward to the equatorial eastern Pacific, the related cyclonic circulation, and the compensation descending motion migrate eastward and are confined to the east of 150°E. The associated suppressed heating then emanates an anti-cyclonic circulation to the west of 150°E. These anomalous circulations can modulate TC genesis and steering flow and thus contribute to variations in the two modes. A set of physics-based empirical models is further built, which shows a promising pathway for the seasonal forecasting of the two modes and the basin-wide total TC track frequency. The results highlight the importance of the location of ENSO maximum SST in understanding and seasonal prediction of the late-season TC tracks over the WNP.
Introduction
Understanding the climate variabilities in tropical cyclone (TC) track over the western North Pacific (WNP) is of great importance owing to enormous TC-generated disasters (Zhang et al., 2009; Peduzzi et al., 2012). Variabilities in the WNP TC tracks are modulated by multi-timescale oscillations. The intra-seasonal oscillation has been known to be important to TC track through modulating large-scale steering flow and TC genesis location owing to the distinct convection and circulation features in its different phases (Li and Zhou 2013; Kim and Seo 2016). As the dominant mode on the interannual time scale, El Niño-Southern Oscillation (ENSO) serves as a major driver of the interannual variability in the WNP TC tracks (Wang and Chan 2002; Wu and Wang 2004; Camargo et al., 2007; Hu et al., 2018). TC genesis locations tend to shift eastward during the warm phase of ENSO, leading to more TCs reaching the subtropical WNP (Zhao et al., 2010). However, the recently emerged central Pacific ENSO shows a distinct impact on the WNP TC tracks compared to the eastern Pacific ENSO (Chen and Tam 2010; Hong et al., 2011). The WNP subtropical high was suggested to play an essential role in the connection between ENSO and TC tracks through modulating the TC genesis location and steering flow (Wang and Wang 2019). In addition, the stratospheric quasi-biennial oscillation was found to be important for TC tracks in the subtropical WNP (Ho et al., 2009). On the decadal time scale, zonal migration of the WNP subtropical high can inhibit or favor TCs influencing the subtropical WNP, resulting in notable variability in TC tracks over the WNP (Ho et al., 2004; Wu et al., 2005; Liu and Chan 2008; Zhao and Wu 2014). The inter-decadal variability in the subtropical high is partially attributed to the Pacific Decadal Oscillation (Liu and Chan 2008). Zhao et al. (2020) found that the ENSO-like sea surface temperature (SST) pattern and the global warming collectively contribute to the inter-decadal variability in TC tracks over the WNP.
Most previous studies focus on the peak season (July–September) and TC track variability in the late season (October–December) remains unclear. In the late season, TCs at the lower latitudes have a greater potential to experience rapid intensification and thus to attain stronger intensity [e.g. Haiyan (2013) and Hagibis (2019)], which cause catastrophic disasters to the Pacific coastal regions. Specifically, in the late season, the ratio of TCs developing into typhoons is about 70%, which is much higher than that during the peak season (Hsu et al., 2014). Moreover, TC track change acts as a main driver of variations in the basin-wide translation speed in the late season (Wang et al., 2020; 2021b). In this regard, it motivates us to examine and understand the climate variability of late-season TC tracks over the WNP.
The paper is organized as follows. Data and method describes the data and methods, and Two dominant modes of late-season track frequency illustrates the two leading modes of late-season TC track frequency. Origins of the two leading modes interprets the mechanisms associated with the two leading modes. Potential utility for the seasonal forecasting of late-season TC track attempts to establish the seasonal forecasting scheme for the late-season TC track. A summary is presented in Conclusion.
Data and Method
TC track information was obtained from the Joint Typhoon Warming Center (JTWC). TCs are defined as those in the datasets with maximum wind speed exceeding the tropical storm intensity (35 knots). Monthly SST (Huang et al., 2017) and outgoing longwave radiation (OLR, Lee et al., 2007) were obtained from the National Oceanic and Atmospheric Administration. Atmospheric variables from the National Centers for Environmental Prediction (NCEP) National Center for Atmospheric Research (NCAR) reanalysis (Kalnay et al., 1996) were used to demonstrate the anomalous large-scale circulation.
TC track is estimated by the occurrence frequency at each 2.5 latitude–longitude grid box (Wu and Wang 2004; Liu and Chan 2008). The conventional empirical orthogonal function (EOF) method was used to extract the dominant mode of the late-season TC track. Large-scale steering flow was defined as the pressure-weighted mean flow between 850 and 300 hPa (Wu and Wang 2004). Statistical significance was assessed using the two-tailed Student’s t-test (Wilks 2006). In this study, we focus on TC activity in the late season (i.e., October–December) over the WNP (0°–40° N, 100° E-180°), and the period of interest covers from 1965 to 2018.
To estimate the overall effects of large-scale conditions on TC genesis, a newly developed dynamic genesis potential index (DGPI, Wang and Murakami 2020) was used. The formulation of the DGPI is defined as follows:
where
Two Dominant Modes of Late-Season Track Frequency
Figure 1 shows two leading EOF modes of late-season TC track frequency over the WNP. The first (second) mode can explain 32.9% (21.1%) of the total variance of late-season TC track frequency. Both modes show zonally distributed anomalies with different variability centers, indicating notable zonal variability in the late-season TC track. The first mode shows prominent positive anomalies occurring to the east of 120°E but weak anomalies in the South China Sea (Figure 1A). For the second mode, marked positive anomalies occur to the west of 140°E with a center located at the South China Sea and weak negative anomalies to the east of 140°E (Figure 1B). Time series of principal components (PCs) of the two modes exhibit considerable interannual and inter-decadal variations (Figure 2). The temporal evolution of PC1 can largely reflect the variability of track frequency over the eastern WNP (0°–40°N, 130°E-180°), with a correlation coefficient of 0.94 during 1965–2018 (Figure 2A). Meanwhile, as shown in Figure 2B, the time series of PC2 is significantly correlated (r = 0.95) with the track frequency over the western WNP (0°–40°N, 100°E-130°E). By using multiple linear regression with these PCs of the two leading modes, we attempt to reproduce the temporal variations of total TC track frequency over the WNP. It is found that more than 85% of the variance of the late season can be reconstructed (Figure 2C), reflecting a close linkage between the two PCs and the late-season track frequency. To this end, we attempt to reveal the possible variability sources for the two leading modes.
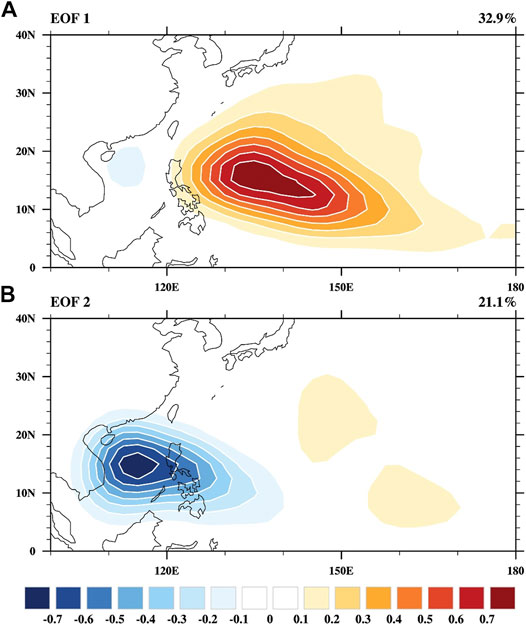
FIGURE 1. The (A) first and (B) second EOF mode of TC track frequency in the late-season during 1965–2018. The percentage of variances explained by the EOF modes are shown on the top-right.
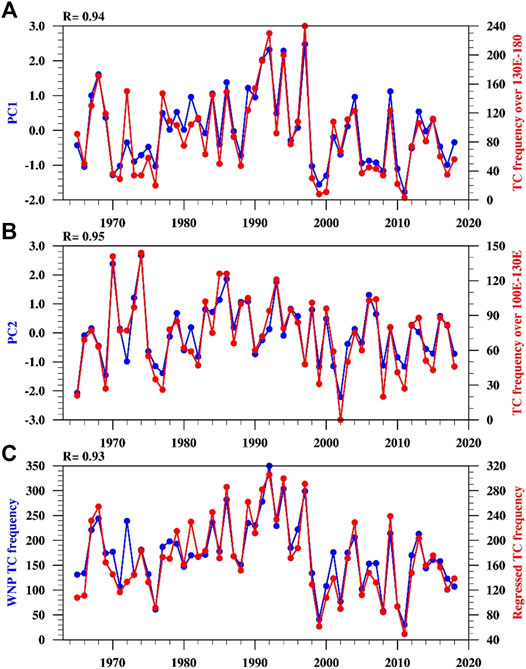
FIGURE 2. Time series of (A) principal component of the first EOF mode (blue line) and TC track frequency over the eastern WNP (0°–40°N, 130°E-180°), (B) principal component of the second EOF mode (blue line), and TC track frequency over the western WNP (0°–40°N, 100°E-130°E), (C) observed (blue line) and simulated (red line) TC track frequency over the WNP (0°–40°N, 100°E-180°) during 1965–2018.
Origins of the Two Leading Modes
In general, climate variability in TC track frequency is largely controlled by TC genesis location and large-scale steering flow (Wu and Wang 2004). Figure 3 shows the regressed TC genesis and large-scale steering flow anomalies against PCs of these two leading modes. The positive phase of the first mode corresponds to an enhanced TC genesis in the eastern WNP but relatively weak negative anomalies of TC genesis to the west of 140°E (Figure 3A). Meanwhile, the westward steering tends to decelerate the climatological eastward steering and thus increase TC track frequency over the eastern WNP. The suppressed TC genesis to the west of 140°E contributes to the negative anomalies in track frequency therein (Figure 1A). For the second mode, the suppressed TC genesis to the west of 150°E and the westward steering to the south of 15°N collectively contribute the negative TC track frequency to the west of 140°E (Figure 3B). In short, the results suggest variability in two leading modes of TC track frequency is ascribed to TC genesis and large-scale steering.
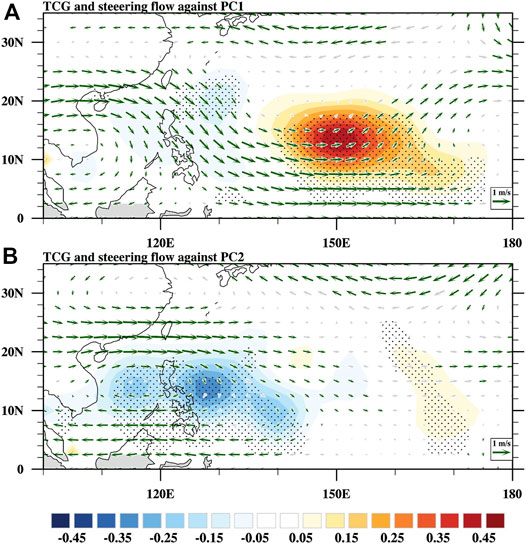
FIGURE 3. Regressed TC genesis frequency (shading) and steering flow (vectors, m s−1) anomalies against the (A) PC1 and (B) PC2 during 1965–2018. Dots (green vectors) denote the anomalous TC genesis (steering flows) that are significant at 90% confidence level.
It has been well realized that large-scale conditions are important for TC genesis (Gray 1968; Emanuel and Nolan 2004; Wang and Murakami 2020). Figure 4 shows the regressed DGPI and 850 hPa wind anomalies against PCs of the two leading modes. For the first mode, a cyclonic circulation occurs to the east of the Philippines, but anti-cyclonic circulation occupies the South China Sea (Figure 4A). Accordingly, the associated anomalies in large-scale parameters such as vorticity and mid-level vertical velocity show opposite anomalies to the east and west of 130°E, which are favorable for TC genesis to the east of 130°E but suppress TC genesis to the west of 130°E (figure not shown). Accordingly, DGPI shows positive (negative) anomalies to the east (west) of 130°E, which generally matches the observed distribution of TC genesis (Figure 3A). For the second mode, an anti-cyclonic circulation extends to about 150°E; the associated anti-cyclonic vorticity is unfavorable for TC genesis (Figure 4B). As a result, the corresponding DGPI shows negative anomalies to the west of 150°E, which is in accordance with the distribution of TC genesis (Figure 3B).
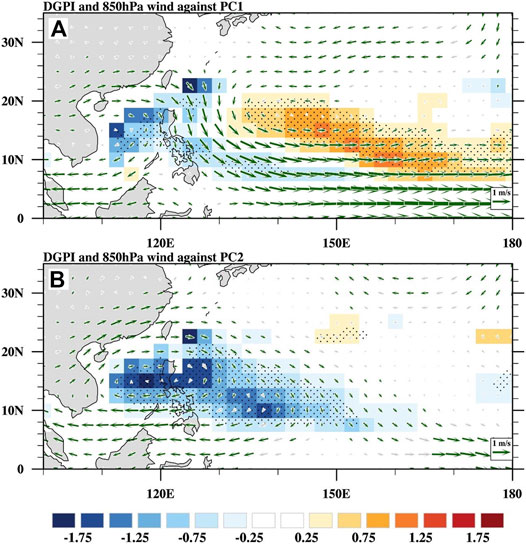
FIGURE 4. Regressed dynamic genesis potential index (shading) and 850 hPa wind (vectors, m s−1) anomalies against the (A) PC1 and (B) PC2 during 1965–2018. Dots (green vectors) denote the anomalous DGPI (steering flows) that are significant at 90% confidence level.
The aforementioned results suggest that large-scale circulations play an important role in the two modes. Namely, the key for the distinct large-scale conditions associated with the two modes lies in their different zonal ranges of the anomalous cyclonic circulation, which is speculated to be linked to the distinct maximum centers of SST anomalies over the equatorial Pacific associated with the two modes (Figure 5). Although the SST anomalies in both modes show an El Niño-like pattern, marked differences emanate in magnitude and zonal extension. For instance, compared with the second mode, the SST warming magnitude of the first mode is much greater. Furthermore, its maximum SST zone extends further westward. Specifically, the significant SST warming anomalies can extend to the west of the dateline and the maximum SST warming can extend to about 170°W (Figure 5A). The SST warming in the equatorial central Pacific acts to increase the convective heating (represented by lower OLR) and emanates a cyclonic circulation extending to the east of 120°E as a Rossby wave response. Moreover, the anomalous northerly to the western flank of the cyclonic circulation tends to cool the underlying SST by strengthening background winds and stabilize the tropical atmosphere by dry advection (Wang et al., 2000; Wu et al., 2017). The cold SST anomaly and reduced instability act to suppress convection, which can further emanate an anti-cyclonic circulation to the west of 120°E. The cyclonic (anti-cyclonic) circulation to the east (west) of 120°E is consistent with the distribution in TC genesis and anomalous large-scale steering flow shown in Figure 3A. In contrast, the maximum center of SST warming associated with the second mode shifts far eastward compared to that of the first mode, and the significant warming signal is confined to the east of the dateline. Accompanied with the eastward migration of SST warming-induced positive convective heating, the associated Rossby wave response (i.e., the cyclonic circulation) is confined to the east of 150°E, which is much more eastward compared with its counterpart for the first mode. Meanwhile, the SST warming induced ascending motion tends to generate an upper-level converge toward the tropical eastern WNP, leading to the suppressed convection in the tropical eastern WNP. Moreover, the anomalous northerly to the western flank of the cyclonic circulation acts to reinforce the suppressed convection in tropical WNP around 150°E by dry advection. Accordingly, the suppressed convective heating emanates an anti-cyclonic circulation to the west of 150°E as a Rossby response (Figure 5B). In addition, SST warming in the tropical western Indian ocean is likely conducive to the anti-cyclonic circulation to the west of 150°E through emanating the atmospheric Kelvin wave (Xie et al., 2009) or modulating zonal overturning circulation (Wang et al., 2021a). The anticyclonic circulation to the west of 150°E is unfavorable for TC genesis therein, which is consistent with the suppressed TC genesis shown in Figure 3B. The result suggests that the first mode is connected to strong ENSO events with an SST extremum center located in the equatorial central Pacific, while the second mode is closely linked to moderate/weak ENSO events with an equatorial eastern Pacific SST extremum center.
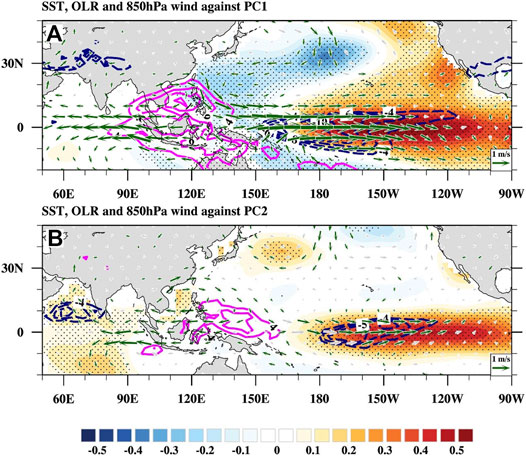
FIGURE 5. Regressed SST (shading, K), OLR (contours, W m−2), and 850 hPa wind (vectors, m s−1) anomalies against the (A) PC1 and (B) PC2 during 1965–2018. Dots (green vectors) denote the anomalous SST (winds) that are significant at 90% confidence level.
Potential Utility for the Seasonal Forecasting of Late-Season TC Track
In this section, we built physical empirical models (PEMs, Wang et al., 2013; Wang et al., 2015) to predict the two modes of the late-season track with a zero-month lead (i.e., starting from September 30th) by using SST predictors and linear regressions. Following Wang et al. (2015), two types of predictors were used in this study. The first type consists of the persistent predictors that suggest the relatively slow evolution of boundary anomalies that can persist into the forecasting season. The second type consists of the tendency signals that denote the evolution tendency of predictors. Persistent signals are defined as the 2-month mean (August–September) before the forecasting season (October–December), and tendency signals are defined as the difference between August and September mean and May–June mean.
Two predictors are used to construct the PEM for the first mode. The first is the August–September mean SST over the equatorial central Pacific (−10°S–10°N, 180°–120°W, Figure 6A). Physically, the August–September mean SST anomalies in the tropical central Pacific can foreshow their value in the late season due to the phase-locking property of ENSO (Rasmusson and Carpenter 1982). Additionally, a tendency predictor was identified over the subtropical North Pacific (20°N–32.5°N, 180°–150°W, Figure 6C), which indicates the development of SST warming in the equatorial central Pacific through the seasonal footprint mechanism (Vimont et al., 2001; Amaya 2019). For the second mode, two predictors are used to construct the PEM. The first is the August–September mean SST over the equatorial eastern Pacific (−10°S–10°N, 150°W–90°W, Figure 6B), which infers the SST anomalies in the late season by utilizing the phase-locking property of ENSO. Moreover, a tendency predictor over the equatorial central WNP (−10°S–10°N, 140°E–165°E, Figure 6D) was selected, which can infer the development of vertical motion in this region and thus the anti-cyclonic circulation to its west. Generally, all these selected predictors are based on the physical processes that govern the large-scale circulations associated with the two modes.
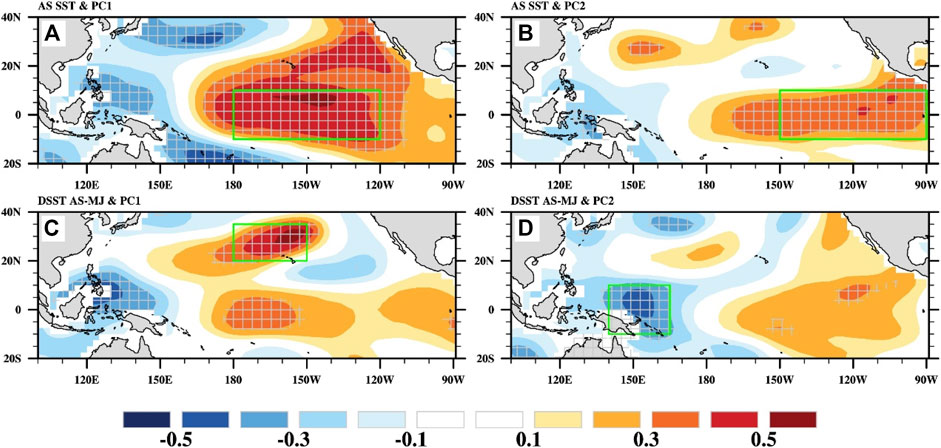
FIGURE 6. Correlation map between PC1 and (A) August–September mean SST and (C) SST tendency from May–June to August–September during 1965–2018. (B) and (D) are the same as (A) and (C) but for PC2. Hatched areas denote regions with correlation coefficients that are significant at the 90% confidence level. The green boxes denote definition areas for the selected predictors.
Although the standard deviation of the predicted (simulated) TC track frequency is less than that of the observed, the PEMs using the identified SST predictors can reasonably reproduce the temporal variability of the two modes of late-season TC track frequency (Figure 7). The prediction (simulation) temporal correlation coefficient skills for the first and second modes are 0.56 and 0.47, respectively. These account for about 30% of the total variance, suggesting that these two modes are potentially predictable. Provided that these two leading modes can largely represent the variability of TC track frequency over the whole WNP in the late season, we further regressed the WNP TC track frequency with the predicted two modes (Figure 7C). The correlation between the regressed TC track frequency and observation is 0.50, which is significant at 95% confidence level. These results suggest a potential utility of our strategy for the seasonal forecasting of TC activity in the late season over the WNP.
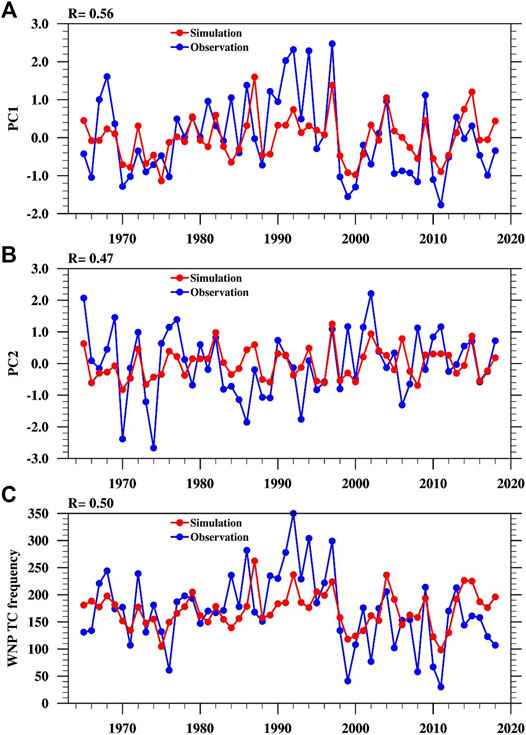
FIGURE 7. Time series of observed (blue line) and simulated (red line) (A) PC1, (B) PC2, and (C) TC track frequency over the WNP during 1965–2018. Correlation coefficients are shown on the top left of panels.
Conclusion
In this study, two leading modes of the late-season TC track frequency are identified with the empirical orthogonal function analysis. The first mode features prominent positive anomalies to the east of the Philippines but weak negative anomalies to the west of the Philippines. From a dynamical viewpoint, the large-scale conditions associated with a cyclonic (anti-cyclonic) circulation to the east (west) of the Philippines act to enhance (suppress) TC genesis and thus contribute to the anomalous TC track frequency distribution. Additionally, the westward large-scale steering associated with the cyclonic circulation to the east of the Philippines tends to prevent westward TC move and contribute to the anomalous TC track frequency as well. For the second mode, it is characterized as notable negative (weak positive) anomalies in the western (eastern) WNP, respectively. Dynamically, a cyclonic (anticyclonic) circulation is confined to the east (west) of 150°E, which is favorable (unfavorable) to TC genesis to the east (west) of 150°E and eventually results in the negative (positive) anomalies of TC track frequency in the western (eastern) WNP.
Further analyses reveal that the circulations associated with two modes are both linked to the concurrent El Niño-Southern Oscillation (ENSO), but with different locations of maximum sea surface temperature (SST). For the first mode, the maximum SST warming can extend to about 170°W. The associated heating can emanate a cyclonic circulation extending to the east of the Philippines. Meanwhile, the anomalous northerly to the western flank of the cyclonic circulation can then generate cyclonic circulation to the west of 120°E through dry advection and local air–sea interaction. In contrast, the maximum center of SST warming and the corresponding increased convective heating associated with the second mode shift far eastward to the equatorial eastern Pacific. Accordingly, the associated Rossby wave response (i.e. the cyclonic circulation) migrates eastward and is confined to the east of 150°E. Meanwhile, the SST warming-induced ascending motion tends to generate an upper-level converge toward the tropical eastern WNP, leading to the suppressed convection in the tropical eastern WNP. Moreover, the anomalous northerly to the western flank of the cyclonic circulation acts to reinforce the suppressed convection in tropical WNP around 150°E by dry advection.
The suppressed heating around 150°E then emanates an anti-cyclonic circulation to the west of 150°E via the Gill-type response. The result suggests that the impacts of ENSO on the late-season TC tracks are sensitive to the location of the maximum SST anomaly.
A set of PEMs is further built to predict the two modes of late-season TC track frequency with the persistent and tendency SST predictors. The PEMs can reasonably reproduce the inter-annual variability of the two modes and the basin-wide total TC track frequency, suggesting that they are potentially predictable. The reasonable predicting skill here suggests that distinguishing the anomaly center of ENSO SST helps improve the seasonal prediction of the late-season TC tracks over the WNP.
Data availability statement
The original contributions presented in the study are included in the article/supplementary material; further inquiries can be directed to the corresponding author.
Author contributions
HY, CW, and XG contributed to the conception and design of the study. HY, CW, and XG performed the analysis and wrote the article. All authors contributed and approved the submitted version.
Funding
This study was jointly supported by the National Natural Science Foundation of China (Grant Nos. 42175003 and 42075031) and the National Key Research and Development Program of China (Grant Nos. 2019YFC1510201). All sources of funding were received for the research being submitted.
Conflict of Interest
The authors declare that the research was conducted in the absence of any commercial or financial relationships that could be construed as a potential conflict of interest.
Publisher’s Note
All claims expressed in this article are solely those of the authors and do not necessarily represent those of their affiliated organizations, or those of the publisher, the editors, and the reviewers. Any product that may be evaluated in this article, or claim that may be made by its manufacturer, is not guaranteed or endorsed by the publisher.
References
Amaya, D. J. (2019). The Pacific Meridional Mode and ENSO: a Review. Curr. Clim. Change Rep. 5, 296–307. doi:10.1007/s40641-019-00142-x
Camargo, S. J., Robertson, A. W., Gaffney, S. J., Smyth, P., and Ghil, M. (2007). Cluster Analysis of Typhoon Tracks. Part II: Large-Scale Circulation and ENSO. J. Clim. 20, 3654–3676. doi:10.1175/jcli4203.1
Chen, G., and Tam, C.-Y. (2010). Different Impacts of Two Kinds of Pacific Ocean Warming on Tropical Cyclone Frequency over the Western North Pacific. Geophys. Res. Lett. 37, L01803. doi:10.1029/2009gl041708
Emanuel, K. A., and Nolan, D. S. (2004). “Tropical Cyclone Activity and the Global Climate System,” in 26th Conf. on Hurricanes and Tropical Meteorology, Miami, FL, May 2–7, 2004 (Boston, Massachusetts, United States: Amer. Meteor. Soc.), 240–241. Preprints.
Gray, W. M. (1968). Global View of the Origin of Tropical Disturbances and Storms. Mon. Wea. Rev. 96, 669–700. doi:10.1175/1520-0493(1968)096<0669:gvotoo>2.0.co;2
Ho, C.-H., Kim, H.-S., Jeong, J.-H., and Son, S.-W. (2009). Influence of Stratospheric Quasi-Biennial Oscillation on Tropical Cyclone Tracks in the Western North Pacific. Geophys. Res. Lett. 36, L06702. doi:10.1029/2009gl037163
Ho, C.-H., Baik, J.-J., Kim, J.-H., Gong, D.-Y., and Sui, C.-H. (2004). Interdecadal Changes in Summertime Typhoon Tracks. J. Clim. 17, 1767–1776. doi:10.1175/1520-0442(2004)017<1767:icistt>2.0.co;2
Hong, C.-C., Li, Y.-H., Li, T., and Lee, M.-Y. (2011). Impacts of central Pacific and Eastern Pacific El Niños on Tropical Cyclone Tracks over the Western North Pacific. Geophys. Res. Lett. 38, L16712. doi:10.1029/2011gl048821
Hsu, P.-C., Chu, P.-S., Murakami, H., and Zhao, X. (2014). An Abrupt Decrease in the Late-Season Typhoon Activity over the Western North Pacific*. J. Clim. 27, 4296–4312. doi:10.1175/jcli-d-13-00417.1
Hu, C., Zhang, C., Yang, S., Chen, D., and He, S. (2018). Perspective on the Northwestward Shift of Autumn Tropical Cyclogenesis Locations over the Western North Pacific from Shifting ENSO. Clim. Dyn. 51, 2455–2465. doi:10.1007/s00382-017-4022-1
Huang, B., Thorne, P. W., Banzon, V. F., Boyer, T., Chepurin, G., Lawrimore, J. H., et al. (2017). Extended Reconstructed Sea Surface Temperature, Version 5 (ERSSTv5): Upgrades, Validations, and Intercomparisons. J. Clim. 30, 8179–8205. doi:10.1175/jcli-d-16-0836.1
Kalnay, E., Kanamitsu, M., Kistler, R., Collins, W., Deaven, D., Gandin, L., et al. (1996). The NCEP/NCAR 40-year Reanalysis Project. Bull. Amer. Meteorol. Soc. 77, 437–471. doi:10.1175/1520-0477(1996)077<0437:tnyrp>2.0.co;2
Kim, H.-K., and Seo, K.-H. (2016). Cluster Analysis of Tropical Cyclone Tracks over the Western North Pacific Using a Self-Organizing Map. J. Clim. 29, 3731–3751. doi:10.1175/jcli-d-15-0380.1
Lee, H.-T., Gruber, A., Ellingson, R. G., and Laszlo, I. (2007). Development of the HIRS Outgoing Longwave Radiation Climate Dataset. J. Atmos. Ocean. Technol. 24, 2029–2047. doi:10.1175/2007jtecha989.1
Li, R. C. Y., and Zhou, W. (2013). Modulation of Western North Pacific Tropical Cyclone Activity by the ISO. Part I: Genesis and Intensity. J. Clim. 26, 2904–2918. doi:10.1175/jcli-d-12-00210.1
Liu, K. S., and Chan, J. C. L. (2008). Interdecadal Variability of Western North Pacific Tropical Cyclone Tracks. J. Clim. 21, 4464–4476. doi:10.1175/2008jcli2207.1
Peduzzi, P., Chatenoux, B., Dao, H., De Bono, A., Herold, C., Kossin, J., et al. (2012). Global Trends in Tropical Cyclone Risk. Nat. Clim Change 2, 289–294. doi:10.1038/nclimate1410
Rasmusson, E. M., and Carpenter, T. H. (1982). Variations in Tropical Sea Surface Temperature and Surface Wind Fields Associated with the Southern Oscillation/El Niño. Mon. Wea. Rev. 110, 354–384. doi:10.1175/1520-0493(1982)110<0354:vitsst>2.0.co;2
Vimont, D. J., Battisti, D. S., and Hirst, A. C. (2001). Footprinting: A Seasonal Connection between the Tropics and Mid-latitudes. Geophys. Res. Lett. 28, 3923–3926. doi:10.1029/2001gl013435
Wang, B., and Chan, J. C. L. (2002). How Strong ENSO Events Affect Tropical Storm Activity over the Western North Pacific*. J. Clim. 15, 1643–1658. doi:10.1175/1520-0442(2002)015<1643:hseeat>2.0.co;2
Wang, B., and Murakami, H. (2020). Dynamic Genesis Potential index for Diagnosing Present-Day and Future Global Tropical Cyclone Genesis. Environ. Res. Lett. 15, 114008. doi:10.1088/1748-9326/abbb01
Wang, B., Wu, R., and Fu, X. (2000). Pacific-East Asian Teleconnection: How Does ENSO Affect East Asian Climate? J. Clim. 13, 1517–1536. doi:10.1175/1520-0442(2000)013<1517:peathd>2.0.co;2
Wang, B., Xiang, B., and Lee, J.-Y. (2013). Subtropical High Predictability Establishes a Promising Way for Monsoon and Tropical Storm Predictions. Proc. Natl. Acad. Sci. 110, 2718–2722. doi:10.1073/pnas.1214626110
Wang, B., Xiang, B., Li, J., Webster, P. J., Rajeevan, M. N., Liu, J., et al. (2015). Rethinking Indian Monsoon Rainfall Prediction in the Context of Recent Global Warming. Nat. Commun. 6, 7154. doi:10.1038/ncomms8154
Wang, C., and Wang, B. (2019). Tropical Cyclone Predictability Shaped by Western Pacific Subtropical High: Integration of Trans-basin Sea Surface Temperature Effects. Clim. Dyn. 53, 2697–2714. doi:10.1007/s00382-019-04651-1
Wang, C., Wu, K., Wu, L., Zhao, H., and Cao, J. (2021a). What Caused the Unprecedented Absence of Western North Pacific Tropical Cyclones in July 2020? Geophys. Res. Lett. 48, e2020GL092282. doi:10.1029/2020gl092282
Wang, C., Wu, L., Lu, J., Liu, Q., Zhao, H., Tian, W., et al. (2020). Interannual Variability of the Basinwide Translation Speed of Tropical Cyclones in the Western North Pacific. J. Clim. 33, 8641–8650. doi:10.1175/jcli-d-19-0995.1
Wang, C., Wu, L., Zhao, H., Liu, Q., and Wang, J. (2021b). An Abrupt Slowdown of Late Season Tropical Cyclone over the Western North Pacific in the Early 1980s. J. Meteorol. Soc. Jpn. Ser. 99 (6), 1413–1422. doi:10.2151/jmsj.2021-068
Wilks, D. S. (2006). Statistical Methods in the Atmospheric Sciences. Cambridge, Massachusetts, United States: Academic Press, 676.
Wu, B., Zhou, T., and Li, T. (2017). Atmospheric Dynamic and Thermodynamic Processes Driving the Western North Pacific Anomalous Anticyclone during El Niño. Part II: Formation Processes. J. Clim. 30, 9637–9650. doi:10.1175/jcli-d-16-0495.1
Wu, L., and Wang, B. (2004). Assessing Impacts of Global Warming on Tropical Cyclone Tracks*. J. Clim. 17, 1686–1698. doi:10.1175/1520-0442(2004)017<1686:aiogwo>2.0.co;2
Wu, L., Wang, B., and Geng, S. (2005). Growing Typhoon Influence on East Asia. Geophys. Res. Lett. 32, L18703. doi:10.1029/2005gl022937
Xie, S.-P., Hu, K., Hafner, J., Tokinaga, H., Du, Y., Huang, G., et al. (2009). Indian Ocean Capacitor Effect on Indo-Western Pacific Climate during the Summer Following El Niño. J. Clim. 22, 730–747. doi:10.1175/2008jcli2544.1
Zhang, Q., Wu, L., and Liu, Q. (2009). Tropical Cyclone Damages in China 1983-2006. Bull. Amer. Meteorol. Soc. 90, 489–496. doi:10.1175/2008bams2631.1
Zhao, H., Klotzbach, P. J., and Chen, S. (2020). Dominant Influence of ENSO-like and Global Sea Surface Temperature Patterns on Changes in Prevailing Boreal Summer Tropical Cyclone Tracks over the Western North Pacific. J. Clim. 33, 9551–9565. doi:10.1175/jcli-d-19-0774.1
Zhao, H., and Wu, L. (2014). Inter-decadal Shift of the Prevailing Tropical Cyclone Tracks over the Western North Pacific and its Mechanism Study. Meteorol. Atmos. Phys. 125, 89–101. doi:10.1007/s00703-014-0322-8
Keywords: seasonal forecast, El Nino/Southern Oscillation, climate variability, tropical cyclone track, Western North Pacific
Citation: Yu H, Wang C and Ge X (2022) Modulation of Pacific Sea Surface Temperatures on the Late-Season Tropical Cyclone Tracks Over the Western North Pacific and its Implication for Seasonal Forecasting. Front. Earth Sci. 10:835001. doi: 10.3389/feart.2022.835001
Received: 14 December 2021; Accepted: 07 January 2022;
Published: 07 February 2022.
Edited by:
Guanghua Chen, Institute of Atmospheric Physics (CAS), ChinaCopyright © 2022 Yu, Wang and Ge. This is an open-access article distributed under the terms of the Creative Commons Attribution License (CC BY). The use, distribution or reproduction in other forums is permitted, provided the original author(s) and the copyright owner(s) are credited and that the original publication in this journal is cited, in accordance with accepted academic practice. No use, distribution or reproduction is permitted which does not comply with these terms.
*Correspondence: Xuyang Ge, eHV5YW5nQG51aXN0LmVkdS5jbg==