 Sebastian Czapiewski
- Institute of Geography, Kazimierz Wielki University, Bydgoszcz, Poland
Rapid development and growing availability of Unmanned Aerial Vehicles (UAV) translates into their more wide-spread application in monitoring of the natural environment. Moreover, advances in computer analysis techniques allow the imaging performed with UAVs to be used in creating Digital Elevation Models (DEM) and Digital Surface Models (DSM). DEMs are often employed in studies on geology, environment, engineering, and architecture. The presented paper discusses the procedures enabling the making of a precise DEM, discusses the aerial imaging data processing technique as well as determines the accuracy of obtained products in comparison with an existing Digital Elevation Model. Based on available literature the author indicates four sets of input parameters applicable in UAV imaging. Data collection missions were performed on two separate days in the area of a small peatland located in the Tuchola Pinewood, Poland. The study aims to address two research issues. Firstly, the author investigates the possibility of creating a DSM based on UAV imaging performed under unfavorable conditions and indicates whether results obtained via this method display sufficient quality to be seen as an alternative to the traditional surveying techniques (LiDAR). Secondly, the article determines the input parameters for a photogrammetric flight that ensure the highest accuracy of a resulting DSM. The analyses show a strong positive correlation between the DSMs prepared based on UAV imaging with data obtained by means of traditional methods (LiDAR). Mean correlation coefficient ranged from 0.45 to 0.75 depending on the type of land use and input parameters selected for a given flight. Furthermore, the analysis revealed that DSMs prepared based on UAV imaging—provided the most suitable input parameters are selected—can be a viable alternative to standard measurements, with the added benefit of low cost and the capacity for repeatable data collection in time. Admittedly, the method in question cannot be utilized in relation to peatlands overgrown with high vegetation (trees, shrubs) as it effectively diminishes the accuracy of obtained DSMs.
Introduction
Studies conducted on a small to medium scale require highly accurate data pertaining to the elevation of terrain. It is an imperative for determining precise location and elevation of objects both at the stage of preparation and conduct of research. Digital Elevation Model (DEM) and Digital Surface Model (DSM) are both noteworthy topographic products and basic reference information applied in many studies on the natural environment (Uysal et al., 2015). Traditional methods of generating DEMs are time consuming and cost-inefficient as they require on-site surveying and expensive measuring equipment (e.g., on-ground and aerial LiDAR scanners). Owing to the development of technology and its increasing availability, Unmanned Aerial Vehicles (UAV) have become a viable option for establishing precise DEMs in relation to relatively vast areas and at very low cost (Moore et al., 1991; Walker and Willgoose, 1999; Thar and Ahmad, 2013; Audronis, 2015; Uysal et al., 2015; Akbari et al., 2016; Martínez-Carricondo et al., 2018; Zmarz et al., 2018; Ajibola et al., 2019; Akturk and Altunel, 2019; Donager et al., 2021; La Salandra et al., 2021; Sankey et al., 2021; Vavulin et al., 2021; Villoslada Peciña et al., 2021). And thus, over the past several years low-altitude photogrammetry (Kędzierski et al., 2014) has become one of the main methods of generating DEMs.
Unmanned Aerial Vehicles are seen as a viable alternative to traditional methods of data collection, particularly in the case of studies in areas that call for high spatial and temporal resolution. Moreover, they constitute an inexpensive alternative to classic manned aircraft photogrammetry (Uysal et al., 2015). Data collection requires only a small, light UAV equipped with a remote-control system and a standard, consumer-grade digital camera. An added value is the capacity to fly a UAV at low altitudes (30–1,000 m a.g.l.—the altitude of a flight pass is measured from the ground at the take-off site and is maintain throughout its duration) as well as the ability to perform flight passes and imaging even in unfavorable weather conditions (Kędzierski et al., 2014), which would otherwise render standard aerial works impossible. UAVs are most notably employed in fields such as: forestry and agriculture, cultural heritage, environmental monitoring, traffic monitoring, 3D reconstructions (Remondino et al., 2012; Uysal et al., 2015).
Most prominently, UAVs can be utilized for data collection in areas with difficult lay of the land that would render the use of traditional methods impossible (Ruzgiene et al., 2015). An increasing number of studies employing UAVs concentrate on the polar regions (Zmarz et al., 2018; Bello et al., 2020; Cárdenas et al., 2020), peatland areas (Lehmann et al., 2016; Räsänen et al., 2019; Räsänen et al., 2020), and inaccessible coastal areas (Scarelli et al., 2017; Wu et al., 2019; Tur et al., 2020; Donnarumma et al., 2021).
No data is ever entirely free of error, and this is also true for DSMs acquired with the use of a UAVs and other geospatial data, even with technological advances in sensors and good skills in data processing (Ajibola et al., 2019). Studies show that the accuracy of DEM varies based on the employed UAV system (Mercuri et al., 2006; Aguilar et al., 2007; Zhao et al., 2011; Harwin and Lucieer, 2012; Luana et al., 2015; Ajibola et al., 2019). However, errors in such DEMs can be considerably mitigated with the use of Ground Control Points (GCP) (Martínez-Carricondo et al., 2018; Akturk and Altunel, 2019), i.e., markers placed on the surface of an analyzed area prior to the flight pass, whose coordinates and elevation above the sea level can be determined using, for instance, GPS RTK or other surveying tools.
Peatlands constitute one of the most prominent natural wetland ecosystems in the world. They cover approx. 2–3% of Earth’s land surface and store from 500 to 700 Gt of carbon (Yu et al., 2010), which is almost the amount accumulated in the atmosphere (750 Gt) (Grace, 2004). Hence, peatlands are believed to play an important role in global circulation of carbon (Page and Baird, 2016; Miettinen et al., 2017; Zhou et al., 2019). Approximately 15% of peatlands in the world are subject to degradation as a result of drainage for agriculture and forestry, expansion of housing areas and transport infrastructure as well as peat extraction (Urák et al., 2017). Adverse impacts of peatland degradation include: greenhouse gas emissions, pollution of surface and ground waters, loss of biodiversity, land subsidence and catastrophic peat fires (Ziegler et al., 2021). The main environmental threat related to oxidization of peat following peatland drainage involves land subsidence (Silins and Rothwell, 1998; Camporese et al., 2004; Camporese et al., 2006; Gebhardt et al., 2010; Leifeld et al., 2011; Zanello et al., 2011; Nagano et al., 2013; Pronger et al., 2014; Fell et al., 2016; Grzywna, 2017; Lipka et al., 2017; van Hardeveld et al., 2017; Nusantara et al., 2018; Evans et al., 2019; Karlson et al., 2019; Khasanah and van Noordwijk, 2019; Ahmad et al., 2020; Khakim et al., 2020; Oleszczuk et al., 2020; Rodriguez et al., 2020, Rodriguez et al., 2021; Anshari et al., 2021; Basuki et al., 2021; Ikkala et al., 2021; Ziegler et al., 2021; Anshari et al., 2022). Water stored in an undisturbed peatland constitutes 300% of its volume (Grzywna, 2017). Therefore, the more water a peatland loses, the greater the decrease in its volume, which in turn causes peat settling, an occurrence consisting in densification and diminishment of organic matter.
This article presents the analysis of results of photogrammetric UAV flights over the surface of a selected peatland. The flight passes were performed using various input settings, including flight elevation, overlap size and camera angles. The paper indicates which methods and settings tend to provide the best results when compared to available data (LiDAR) and research results published by other authors. The choice of peatland as the study area was intentional and arises from the fact that a UAV ensures flexible spatial and temporal resolution, which proves useful in monitoring the preservation state of a peatland and its functioning, particularly in the case of high and intermediate mires.
Study Area and Methods
Study Area
The study was conducted in the area of a small peatland located in northern Poland, within the Tuchola Pinewoods (Figure 1). The study area comprises 3.32 ha and is predominantly utilized for agricultural purposes (farmland and meadows). Its south-western part is forested. The surface area of the peatland (0.8 ha) is overgrown with shrubbery, small trees, and tall grass. The entire study area features relatively high elevation differences, ranging from approx. 157 m a.s.l. in the south-western part to approx. 144 m a.s.l. in the central part. The main morphogenetic unit of the study area are part of the frontal moraines of the Bytów lobe. The climate data from the meteorological station in Chojnice (about 25 km from the study site) obtained for the years 1951–2017 reveal that the warmest month is July with a temperature of 17.1°C and the coldest is January with −2.5°C (Institute of Meteorology and Water Management—Institute of Meteorology and Water Management - National Research Institute, 2019). The average annual temperature of the study site is 7.3°C, and the average annual precipitation ranges between 550 and 600 mm (Łuców et al., 2021). The peatland is located in a drainless area and is fed mainly by rainwater and groundwater and on its surface there are remains of the former melioration (drainage ditches). Currently, the peatland area is wasteland, covered with bushes and trees.
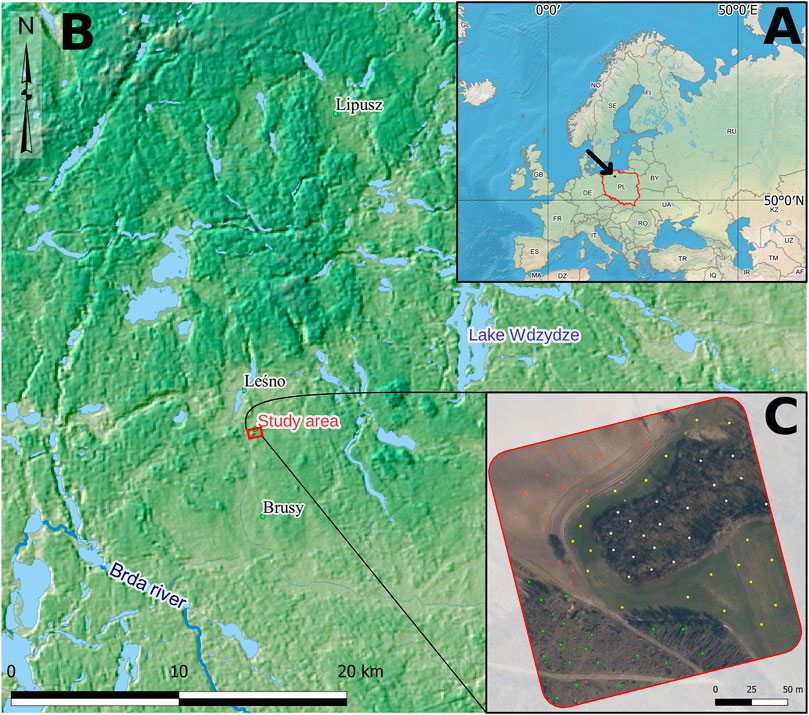
FIGURE 1. Location of the study area [prepared based on: (A)—Poland, (B)—Digital Elevation Model of location, (C)—boundaries of the working area and sampling points (GUGiK, 2020)]; Data, equipment and software.
Data were collected using a multirotor unit (quadrocopter) DJI Mavic Pro equipped with a standard camara operating on CMOS matrix (1/2.3”) and providing image resolution of 12.35 megapixels. The unit is capable of 21–27 min of effective flight (depending on atmospheric conditions). The flight passes were programmed using an automatic mission planner, Pix4Dcapture, which enables autonomous flights within a designated area based on predefined data collection settings. The application imposes certain limitation involving very specific intervals at which photographs are taken during the flight (approx. 2 s apart). These settings cannot be edited. For this reason, the number of photos taken using the same mission planner on different missions differs from one another (Table 1) and depends mainly on the wind speed. Information pertaining to the performed flights are presented in Table 1. All missions encompassed the same area and utilized the double grid mission system, which ensures more accurate DSMs. Furthermore, the application offers the option to suspend and resume the mission as needed, be it due to adverse weather conditions or a necessity to change batteries in the UAV.
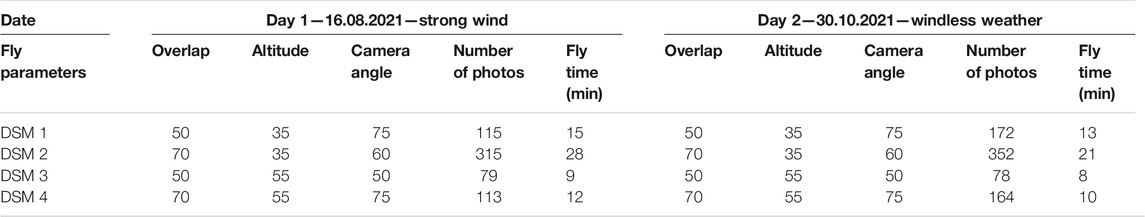
TABLE 1. UAV Input parameters, dates of flights, time and number of photographs taken.
For the purpose of this study the author performed a total of four flight passes on two separate days and using various input parameters. The flights were conducted with reference to the exact same areas, the only difference being GRID density. The flights were performed on day 1—before the harvest, and 2—after the harvest. Moreover, the two dates displayed different weather conditions, and so day 1—coincided with strong wind, and day 2—featured favorable, windless weather. Data collected during the flights served as the basis for eight Digital Surface Models, which were then compared against one DSM prepared based on LiDAR data. Before the mission, in order to ensure higher accuracy, markers for GCP were placed across the entire area, and measurements (coordinates and elevation a.s.l) were taken using GPS RTK (vertical and horizontal accuracy with the margin of error at ± 3 cm). As indicated by Martínez-Carricondo et al. (2018), proper placement of markers across the study area bears positive impact on the quality of obtained DTM. Hence, GCP were evenly distributed following the recommendations of the above-mentioned authors, i.e., both at the edge of the analyzed area and in its central part.
The reference DSM was prepared based on LiDAR data (GUGiK, 2012) obtained from an aerial scanning performed over the study area in 27 April 2012. The selected LiDAR datasheet featured land cover of approx. 8.2 pt/m2, however, for the purpose of this study the point data cloud was reclassified and only data representing: 2—Ground, 3—Low Vegetation, 4—Medium Vegetation were used (∼6.1 pt/m2 after reclassification). The absence of the class encompassing tall trees arises from the fact that in 2018 the area in question was exposed to a violent storm which destroyed the high tree stands. The DSM was prepared in the spatial resolution of 0.5 m, and the scanning data were obtained at the time when farmlands were unused and devoid of vegetations.
Data obtained in the course of UAV flights were converted into a DSM using Pix4Dmapper software (v. 4.6.4.). All application settings were set in accordance with the recommendations provided by the manufacturer (Pix4D, 2011). The application marks Tie Points in the overlapping parts of photographs and uses them to generate Triangle Meshes, which in turn are used for establishing Point Clouds. Subsequently, the inverse distance weighting algorithm is employed to interpolate between points to create a Digital Surface Model and Digital Elevation Model. The resulting DSMs based on UAV data were generated with spatial resolution ranging from ∼0.01 to ∼0.03 m (depending on the flight pass altitude).
The study area has been divided into four types of land use (peatland, meadow, arable land, forested/deforested area), with 20 random points generated for each type using QGIS 3.20 software. Said points were expanded to accommodate 1 m buffer. The points were subsequently attributed mean terrain elevation from each of the nine generated DSMs. As a result we obtained 80 sampling areas. The sampling areas were the same for each DSM. The combined data were used to calculate the Pearson correlation coefficient (Supplementary Tables S1–S4) in accordance with the following formula:
A total of 720 terrain elevations was gathered from DSMs, and the correlation coefficient for each UAV DSM was determined with reference to the LiDAR DSM. All obtained data were also illustrated with correlation charts (Supplementary Figures S1, S2).
Results
The study compares DSMs generated based on UAV flights with DSM data from laser scanning performed in the same area to determine the correlation between data sets, and thus, assess their usefulness. The study aimed to indicate which input parameters correlate best with the results of traditional surveying methods. Table 2 presents correlations of results obtained for the sampling areas with data from the reference model (LiDAR).
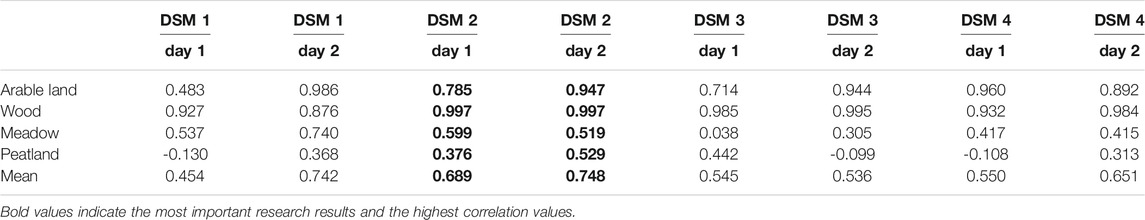
TABLE 2. Correlation matrix of results obtained on two sampling days 16.08.2021 (day 1) and 30.10.2021 (day 2).
The analyses show that both on the first (16.08.2021) and the second date (30.10.2021) of flight passes the best results were obtained when utilizing settings selected for DSM 2 (Table 1, DSM 2—overlap: 70, altitude: 35 m, camera angle: 60°), which constitute the default settings recommended by the developer of Pix4D software. These settings provide good results and ensure the largest number of photographs, albeit require the longest flight duration.
When analyzing individual elements of the basin in terms of land use a conclusion can be drawn that very strong positive correlation occurs in the case of arable land after the harvest (lack of vegetation). In such cases data processing errors caused by vegetation cover are the lowest (Table 2, Supplementary Table S1, Supplementary Figures S1A–H).
Strong positive correlation between the DSM obtained from LiDAR and the DSM from UAV also occurs in the case of the forested part of the study area (Table 2, Supplementary Table S4, Supplementary Figures S1I–P). High concordance of results obtained with two measuring methods arises from the input data from LiDAR used in the making of DMS (lack of high vegetation cover, trees) and deforestation caused by the storm of 2017, which affected the input parameters for the UAV flights.
Surprisingly, low values of positive correlation were obtained in the case of meadows (Table 2, Supplementary Table S2, Supplementary Figures S2A–H). This is most likely due to the fact that on either day of sampling meadows featured different height of grass, which was cut in between the two dates when measurements were taken. This, however, is difficult to verify in the field, more so in the case of LiDAR data.
The lowest yet still positive values of the correlation coefficient were indicated for the peatland area itself (Table 2, Supplementary Table S2, Supplementary Figures S3I–P). This is owing to the presence of medium vegetation cover typical of mires, which tends to considerably affect the results obtained when generating a DSM with the use of photogrammetric data. Similarly to other areas, the best results were had with the input settings of DSM 2 (Table 1), particularly in the absence of interference caused by strong wind. The negative correlation coefficient in peatland areas resulted from DSM development errors occurring in the modeling process. This is due to the fact that the bog is extensively covered with bushes and trees, and the number of photographs taken in the selected method proved to be insufficient (too small overlap in the flight settings).
In general, regardless of the input settings, the second day of data collection yielded better results (the highest positive value of the correlation coefficient between the LiDAR and UAV data). This can be attributed mostly to the adverse impact of wind during the first UAV flights. Thus, it can be concluded that not only vegetation but also weather conditions affect the quality of results obtained in the process of preparing a DSM based on photogrammetric flights.
As far as the influence of flight settings is concerned, the altitude at which photographs are taken seems to be notably impactful. The results obtained at lower flight passes demonstrate higher value of positive correlation with the LiDAR data as well as higher spatial resolution of the resulting imaging (approx. 1 cm pixel size with flight passes at the altitude of 35 m). Unfortunately, low altitude setting translates into extended flight duration, effectively meaning that a smaller area can be imaged at one time. Surprisingly, the other input settings, i.e., overlap and camera angle, were found to have negligible impact on the quality of results.
The analysis of correlation matrices prepared with regard to the results obtained on both dates of flights (Supplementary Tables S1–S4) indicates the highest positive value of correlation coefficient for the data acquired with the input parameters used for DSM 3 (Table 1—overlap: 50, altitude: 55 m, camera angle: 50°), i.e., high flight altitude and relatively low values of overlap and camera angle.
Discussion
Majority of available research on the photogrammetric use of UAV for establishing DEMs and DSMs does not provide the precise input parameters of performed imaging (Martínez-Carricondo et al., 2018; Ajibola et al., 2019; Donager et al., 2021; Sankey et al., 2021; Villoslada Peciña et al., 2021). The information tends to be either incomplete (Uysal et al., 2015; La Salandra et al., 2021) or relate to UAV technology employed in fixed-wing units (Zmarz et al., 2018; Donager et al., 2021; Sankey et al., 2021; Vavulin et al., 2021). Studies utilizing UAV photogrammetry to generate DSM and DEM typically use fixed parameters, i.e., altitude of approx. 50 m a.g.l in the case of multirotor UAVs, overlap at 50–70%, camera angle in the range of 60–80° (Kędzierski et al., 2014; Uysal et al., 2015; Akturk and Altunel, 2019; La Salandra et al., 2021). Bearing that in mind, the presented study set out to determine differences in photogrammetric measurement results that arise from the choice of parameters set prior to the flight.
The presented results suggest that having considered a range of input parameters such as the type of land use and, in particular, the type and state of vegetation in the area—photogrammetric data from UAV flights can be employed in land relief analyses. Akturk and Altunel (2019) reached a similar conclusion and demonstrated that a DSM obtained with an inexpensive drone can provide data with an average elevation error of approx. 0.5 m in areas featuring thick cover of medium and high vegetation. In this study said margin of error for the most overgrown and inaccessible part of the area—e.g., peatland with a dense shrubbery cover—amounted to an average of 0.7 m (from 0.1 to 3 m), provided the most optimal settings were used (DSM 2). In the case of open grounds devoid of high and medium vegetation the values drop to approx. 0.01–0.1 m.
Bearing in mind the most notable disadvantages of DEMs prepared based on photogrammetric data collected with UAV, a plausible solution that enables better accuracy of obtained results consists in filtering out points that indicate areas covered with low vegetation from the point cloud generated in postprocessing (Gruszczyński et al., 2017; Gruszczyński et al., 2019). Gruszczyński et al. (2017) argue that the above-mentioned filtering method can reduce elevation error in DEMs generated based on UAV data by 60–70%. In their later study (Gruszczyński et al., 2019), the authors observed that UAV photogrammetry prove to be more accurate than terrestrial laser scanning when applied to terrain mapping. Unfortunately, establishing a very accurate point cloud based on photogrammetric data from UAV requires a high-class drone (as in the case of Gruszczyński et al., 2017; Gruszczyński et al., 2019). Mid-budget drones, such as DJI Mavic Pro used in this study, do not provide accurate enough data to generate sufficiently detailed point clouds.
The analysis of data presented in this paper allows us to formulate an observation pertaining to the impact of weather conditions on the quality of obtained results. Available publications on UAV photogrammetry typically do not provide information regarding the influence of strong wind on the quality of imaging. A drone equipped with a camera mounted on a gimbal automatically stabilizes its flight path and, as needed, the drone operator can manually adjust the position of the unit during the mission (Audronis, 2015). Thus, it can be concluded that the factor in question does considerably affect the quality of results obtained with multirotor UAVs, however, it may hinder the quality of measurements taken with the use of a wing type UAV (Kędzierski et al., 2014).
In peatland areas, the settling of peat correlates with peat thickness as peatlands dry up and are supplied with water (Gebhardt et al., 2010; Grzywna, 2017). Available literature offers a number of estimates concerning the rate of CO2 release resulting from peat settling, albeit they tend to vary greatly in range: 20 Mg CO2 ha−1 year−1 (Carlson et al., 2015), 58.4–74.5 Mg CO2 ha−1 year−1 (Couwenberg and Hooijer, 2013), 72.7 Mg CO2 ha−1 year−1 (Othman et al., 2011) up to 100 Mg CO2 ha−1 year−1 (Hooijer et al., 2012). Khasanah and van Noordwijk (2018) argue that—in the case of subtropical peatlands—the peat settling rate of 4.7 cm year−1 can generate up to 121 Mg CO2 ha−1 year−1. Bearing this in mind, UAV photogrammetric data used for collecting repeated measurements of peatlands elevation may prove to be a note-worthy method in the context of monitoring of degradation of the objects in question. It can potentially help interested parties keep track of threats related to greenhouse gas emissions from peatlands into the atmosphere. However, it should be emphasized that DSMs acquired from peatlands may display a relatively high degree of error if the surveyed area is overgrown with vegetation.
Conclusion
1) The article discusses the potential of UAVs as an alternative technology of data acquisition for the analyses of land relief over small areas. Compared to traditional manned aerial platforms and on-land measurements, UAVs constitute a cost-efficient method which additionally mitigate the risk related with reaching hard-to-get research stations.
2) UAV systems possess many advantages (low cost, real-time data, high temporal and spatial resolution etc.), which prove useful not only in photogrammetry, but also other disciplines.
3) The presented results clearly advocate the advantages of using a UAV for generating DSMs. The accuracy of results does not deviate from those obtained with the application of standard measurements (LiDAR method), and the time required for data collection and processing is notably smaller. Therefore, photogrammetric data acquired using a UAV on parts of peatlands that are free of medium and high vegetation can be applied in analyses pertaining to changes in terrain elevation (settling and swelling) in peatlands. The method offers good results in relation to active, not heavily degraded peatlands, particularly in the central parts of mire domes with typically low vegetation cover.
4) The main research issue involved determining the accuracy of elevation data obtained in extensively overgrown parts of peatlands. The advantage of traditional data collection methods (LiDAR) consists in the capacity to create a complete point cloud, which allows for the extraction of only ground-level and low-vegetation points, and use these selected points to generate a DEM or DMS.
5) Owing to the rapid development and miniaturization of electronics there is a growing number of new technologies related to UAV and LiDAR on the market. Combination of those technologies, assuming the manufacturing cost decreases, may certainly provide interesting and far more precise DEM and DSM data compared to photogrammetric data.
Data Availability Statement
The raw data supporting the conclusion of this article will be made available by the authors, without undue reservation.
Author Contributions
The author confirms being the sole contributor of this work and has approved it for publication.
Funding
This research was funded by the Project Supporting Maintenance of Research Potential at Kazimierz Wielki University.
Conflict of Interest
The author declares that the research was conducted in the absence of any commercial or financial relationships that could be construed as a potential conflict of interest.
Publisher’s Note
All claims expressed in this article are solely those of the authors and do not necessarily represent those of their affiliated organizations, or those of the publisher, the editors and the reviewers. Any product that may be evaluated in this article, or claim that may be made by its manufacturer, is not guaranteed or endorsed by the publisher.
Acknowledgments
The author would like to thank Szczepański for making the area available for research and to Professor Danuta Szumińska from the Institute of Geography at UKW for her support and substantive comments.
Supplementary Material
The Supplementary Material for this article can be found online at: https://www.frontiersin.org/articles/10.3389/feart.2022.834923/full#supplementary-material
References
Aguilar, F. J., Aguilar, M. A., and Agüera, F. (2007). Accuracy Assessment of Digital Elevation Models Using a Non‐parametric Approach. Int. J. Geographical Inf. Sci. 21, 667–686. doi:10.1080/13658810601079783
Ahmad, S., Liu, H., Günther, A., Couwenberg, J., and Lennartz, B. (2020). Long-term Rewetting of Degraded Peatlands Restores Hydrological Buffer Function. Sci. Total Environ. 749, 141571. doi:10.1016/j.scitotenv.2020.141571
Ajibola, I. I., Mansor, S., Pradhan, B., and Mohd. ShafriShafri, H. Z. (2019). Fusion of UAV-Based DEMs for Vertical Component Accuracy Improvement. Measurement 147, 106795. doi:10.1016/j.measurement.2019.07.023
Akbari, A., Ramli, N. I. B., Ramli, N. I. B., and Kong, N. S. (2016). Application of Public Domain Satellite-Based DEMs in Natural Hazard Modeling. IJESD 7, 140–144. doi:10.7763/IJESD.2016.V7.756
Akturk, E., and Altunel, A. O. (2019). Accuracy Assessment of a Low-Cost UAV Derived Digital Elevation Model (DEM) in a Highly Broken and Vegetated Terrain. Measurement 136, 382–386. doi:10.1016/j.measurement.2018.12.101
Anshari, G. Z., Gusmayanti, E., Afifudin, M., Ruwaimana, M., Hendricks, L., and Gavin, D. G. (2022). Carbon Loss from a Deforested and Drained Tropical Peatland over Four Years as Assessed from Peat Stratigraphy. CATENA 208, 105719. doi:10.1016/j.catena.2021.105719
Anshari, G. Z., Gusmayanti, E., and Novita, N. (2021). The Use of Subsidence to Estimate Carbon Loss from Deforested and Drained Tropical Peatlands in Indonesia. Forests 12, 732. doi:10.3390/f12060732
Audronis, T. (2015). Drony: Wprowadzenie: Genialne Ujęcia Z Lotu Ptaka. Gliwice: Wydawnictwo Helion.
Basuki, I., Budiman, A., Netzer, M., Safitri, R., Maulana, R., Nusirhan, T. S. E., et al. (2021). Dynamic of Groundwater Table, Peat Subsidence and Carbon Emission Impacted from Deforestation in Tropical Peatland, Riau, Indonesia. IOP Conf. Ser. Earth Environ. Sci. 648, 012029. doi:10.1088/1755-1315/648/1/012029
Bello, C., Suarez, W., Cruz, R., and Brondi Rueda, N. F. (2020). Ice Thickness Measurements and Volume Estimates for Znosko Glacier (Antarctica) Using Glabtop Model. Earth Space Sci. Open Arch. 12. doi:10.1002/essoar.10505379.1
Camporese, M., Gambolati, G., Putti, M., and Teatini, P. (2006). “Chapter 23 Peatland Subsidence in the Venice Watershed,” in Developments in Earth Surface Processes Peatlands. Editors I. P. Martini, A. Martínez Cortizas, and W. Chesworth (Elsevier), 529–550. doi:10.1016/S0928-2025(06)09023-7
Camporese, M., Putti, M., Salandin, P., and Teatini, P. (2004). “Modeling Peatland Hydrology and Related Elastic Deformation,” in Developments in Water Science Computational Methods in Water Resources. Editors C. T. Miller, and G. F. Pinder (Elsevier), 1453–1464. doi:10.1016/S0167-5648(04)80157-6
Cárdenas, C., Casassa, G., Aguilar, X., Mojica, D., Johnson, E., and Brondi, F. (2020). From Space to Earth: Physical and Biological Impacts of Glacier Dynamics in the marine System by Means of Remote Sensing at Almirantazgo Bay, Antarctica. ISPRS Ann. Photogramm. Remote Sens. Spat. Inf. Sci. IV-3/W2-2020, 119–123. doi:10.5194/isprs-annals-IV-3-W2-2020-119-2020
Carlson, K. M., Goodman, L. K., and May-Tobin, C. C. (2015). Modeling Relationships between Water Table Depth and Peat Soil Carbon Loss in Southeast Asian Plantations. Environ. Res. Lett. 10, 074006. doi:10.1088/1748-9326/10/7/074006
Couwenberg, J., and Hooijer, A. (2013). Towards Robust Subsidence-Based Soil Carbon Emission Factors for Peat Soils in South-East Asia, with Special Reference to Oil palm Plantations. Mires Peat 12, 1–13.
Donager, J., Sankey, T. T., Sánchez Meador, A. J., Sankey, J. B., and Springer, A. (2021). Integrating Airborne and mobile Lidar Data with UAV Photogrammetry for Rapid Assessment of Changing forest Snow Depth and Cover. Sci. Remote Sensing 4, 100029. doi:10.1016/j.srs.2021.100029
Donnarumma, L., D'Argenio, A., Sandulli, R., Russo, G. F., and Chemello, R. (2021). Unmanned Aerial Vehicle Technology to Assess the State of Threatened Biogenic Formations: The Vermetid Reefs of Mediterranean Intertidal Rocky Coasts. Estuarine, Coastal Shelf Sci. 251, 107228. doi:10.1016/j.ecss.2021.107228
Evans, C. D., Williamson, J. M., Kacaribu, F., Irawan, D., Suardiwerianto, Y., Hidayat, M. F., et al. (2019). Rates and Spatial Variability of Peat Subsidence in Acacia Plantation and forest Landscapes in Sumatra, Indonesia. Geoderma 338, 410–421. doi:10.1016/j.geoderma.2018.12.028
Fell, H., Roßkopf, N., Bauriegel, A., and Zeitz, J. (2016). Estimating Vulnerability of Agriculturally Used Peatlands in north-east Germany to Carbon Loss Based on Multi-Temporal Subsidence Data Analysis. CATENA 137, 61–69. doi:10.1016/j.catena.2015.08.010
Gebhardt, S., Fleige, H., and Horn, R. (2010). Shrinkage Processes of a Drained Riparian Peatland with Subsidence Morphology. J. Soils Sediments 10, 484–493. doi:10.1007/s11368-009-0130-9
Grace, J. (2004). Understanding and Managing the Global Carbon Cycle. J. Ecol. 92, 189–202. doi:10.1111/j.0022-0477.2004.00874.x
Gruszczyński, W., Matwij, W., and Ćwiąkała, P. (2017). Comparison of Low-Altitude UAV Photogrammetry with Terrestrial Laser Scanning as Data-Source Methods for Terrain Covered in Low Vegetation. ISPRS J. Photogrammetry Remote Sensing 126, 168–179. doi:10.1016/j.isprsjprs.2017.02.015
Gruszczyński, W., Puniach, E., Ćwiąkała, P., and Matwij, W. (2019). Application of Convolutional Neural Networks for Low Vegetation Filtering from Data Acquired by UAVs. ISPRS J. Photogrammetry Remote Sensing 158, 1–10. doi:10.1016/j.isprsjprs.2019.09.014
Grzywna, A. (2017). The Degree of Peatland Subsidence Resulting from Drainage of Land. Environ. Earth Sci. 76, 559. doi:10.1007/s12665-017-6869-1
GUGiK (2012). LiDAR Data, Sheet: N-33-84-A-B-4-3-2. Warsaw: Head Office of Geodesy and Cartography (GUGiK).
GUGiK (2020). Ortophotomap, Sheet: N-33-84-A-B-4-3. Warsaw: Head Office of Geodesy and Cartography (GUGiK).
Harwin, S., and Lucieer, A. (2012). An Accuracy Assessment of Georeferenced point Clouds Produced via Multi-View Stereo Techniques Applied to Imagery Acquired via Unmanned Aerial Vehicle. Int. Arch. Photogramm. Remote Sens. Spat. Inf. Sci. XXXIX-B7, 475–480. doi:10.5194/isprsarchives-xxxix-b7-475-2012
Hooijer, A., Page, S., Jauhiainen, J., Lee, W. A., Lu, X. X., Idris, A., et al. (2012). Subsidence and Carbon Loss in Drained Tropical Peatlands. Biogeosciences 9, 1053–1071. doi:10.5194/bg-9-1053-2012
Ikkala, L., Ronkanen, A.-K., Utriainen, O., Kløve, B., and Marttila, H. (2021). Peatland Subsidence Enhances Cultivated lowland Flood Risk. Soil Tillage Res. 212, 105078. doi:10.1016/j.still.2021.105078
Institute of Meteorology and Water Management - National Research Institute (2019). The State Water Holding Polish Waters - wody.gov.pl - Information on spatial data [WWW Document]. Available at: https://meteomodel.pl (Accessed January, 2022).
Karlson, M., Gålfalk, M., Crill, P., Bousquet, P., Saunois, M., and Bastviken, D. (2019). Delineating Northern Peatlands Using Sentinel-1 Time Series and Terrain Indices from Local and Regional Digital Elevation Models. Remote Sensing Environ. 231, 111252. doi:10.1016/j.rse.2019.111252
Kędzierski, M., Fryśkowska, A., and Wierzbicki, D. (2014). Opracowania Fotogrametryczne Z Niskiego Pułapu. Warszawa: Wojskowa Akademia Techniczna.
Khakim, M. Y. N., Bama, A. A., Yustian, I., Poerwono, P., Tsuji, T., and Matsuoka, T. (2020). Peatland Subsidence and Vegetation Cover Degradation as Impacts of the 2015 El Niño Event Revealed by Sentinel-1A SAR Data. Int. J. Appl. Earth Observation Geoinformation 84, 101953. doi:10.1016/j.jag.2019.101953
Khasanah, N. m., and van Noordwijk, M. (2019). Subsidence and Carbon Dioxide Emissions in a Smallholder Peatland Mosaic in Sumatra, Indonesia. Mitig Adapt Strateg. Glob. Change 24, 147–163. doi:10.1007/s11027-018-9803-2
La Salandra, M., Miniello, G., Nicotri, S., Italiano, A., Donvito, G., Maggi, G., et al. (2021). Generating UAV High-Resolution Topographic Data within a FOSS Photogrammetric Workflow Using High-Performance Computing Clusters. Int. J. Appl. Earth Observation Geoinformation 105, 102600. doi:10.1016/j.jag.2021.102600
Lehmann, J., Münchberger, W., Knoth, C., Blodau, C., Nieberding, F., Prinz, T., et al. (2016). High-Resolution Classification of South Patagonian Peat Bog Microforms Reveals Potential Gaps in Up-Scaled CH4 Fluxes by Use of Unmanned Aerial System (UAS) and CIR Imagery. Remote Sensing 8, 173. doi:10.3390/rs8030173
Leifeld, J., Müller, M., and Fuhrer, J. (2011). Peatland Subsidence and Carbon Loss from Drained Temperate Fens. Soil Use Manage 27, 170–176. doi:10.1111/j.1475-2743.2011.00327.x
Lipka, K., Zając, E., Hlotov, V., and Siejka, Z. (2017). Disappearance Rate of a Peatland in Dublany Near Lviv (Ukraine) Drained in 19th century. Mires Peat 19, 1–15. doi:10.19189/MaP.2017.OMB.279
Luana, S., Hou, X., and Wang, Y. (2015). Assessing the Accuracy of SRTM Dem and Aster Gdem Datasets for the Coastal Zone of Shandong Province, Eastern China. Polish Maritime Res. 22, 15–20. doi:10.1515/pomr-2015-0026
Łuców, D., Lamentowicz, M., Kołaczek, P., Łokas, E., Marcisz, K., Obremska, M., et al. (2021). Pine Forest Management and Disturbance in Northern Poland: Combining High-Resolution 100-Year-Old Paleoecological and Remote Sensing Data. Front. Ecol. Evol. 9, 898. doi:10.3389/fevo.2021.747976
Martínez-Carricondo, P., Agüera-Vega, F., Carvajal-Ramírez, F., Mesas-Carrascosa, F.-J., García-Ferrer, A., and Pérez-Porras, F.-J. (2018). Assessment of UAV-Photogrammetric Mapping Accuracy Based on Variation of Ground Control Points. Int. J. Appl. Earth Observation Geoinformation 72, 1–10. doi:10.1016/j.jag.2018.05.015
Mercuri, P. A., Engel, B. A., and Johannsen, C. J. (2006). Evaluation and Accuracy Assessment of High‐resolution IFSAR DEMs in Low‐relief Areas. Int. J. Remote Sensing 27, 2767–2786. doi:10.1080/01431160500491716
Miettinen, J., Hooijer, A., Vernimmen, R., Liew, S. C., and Page, S. E. (2017). From Carbon Sink to Carbon Source: Extensive Peat Oxidation in Insular Southeast Asia since 1990. Environ. Res. Lett. 12, 024014. doi:10.1088/1748-9326/aa5b6f
Moore, I. D., Grayson, R. B., and Ladson, A. R. (1991). Digital Terrain Modelling: A Review of Hydrological, Geomorphological, and Biological Applications. Hydrol. Process. 5, 3–30. doi:10.1002/hyp.3360050103
Nagano, T., Osawa, K., Ishida, T., Sakai, K., Vijarnsorn, P., Jongskul, A., et al. (2013). Subsidence and Soil CO2 Efflux in Tropical Peatland in Southern Thailand under Various Water Table and Management Conditions. Mires Peat 11, 6. Available at: https://www.semanticscholar.org/paper/Subsidence-and-soil-CO2-efflux-in-tropical-peatland-Nagano-Osawa/9a24b84b689b98502b5f1006728a31a4cdf4bc0a (Accessed October 31, 2021).
Nusantara, R. W., Hazriani, R., and Suryadi, U. E. (2018). Water-table Depth and Peat Subsidence Due to Land-Use Change of Peatlands. IOP Conf. Ser. Earth Environ. Sci. 145, 012090. doi:10.1088/1755-1315/145/1/012090
Oleszczuk, R., Zając, E., and Urbański, J. (2020). Verification of Empirical Equations Describing Subsidence Rate of Peatland in Central Poland. Wetlands Ecol. Manage. 28, 495–507. doi:10.1007/s11273-020-09727-y
Othman, H., Mohammed, A. T., Mohamad Darus, F., Harun, M. H., and Zambri, M. P. (2011). Best Management Practices for Oil palm Cultivation on Peat: Ground Water-Table Maintenance in Relation to Peat Subsidence and Estimation of CO2 Emissions at Sessang, Sarawak. J. Oil Palm Res. 23, 1078–1086.
Page, S. E., and Baird, A. J. (2016). Peatlands and Global Change: Response and Resilience. Annu. Rev. Environ. Resour. 41, 35–57. doi:10.1146/annurev-environ-110615-085520
Pix4D (2011). Pix4Dmapper Software Manual. Pix4D Documentation, 1–305. Available at: https://support.pix4d.com/hc/en-us/sections/360003718992-Manual (Accessed December 2, 2021).
Pronger, J., Schipper, L. A., Hill, R. B., Campbell, D. I., and McLeod, M. (2014). Subsidence Rates of Drained Agricultural Peatlands in New Zealand and the Relationship with Time since Drainage. J. Environ. Qual. 43, 1442–1449. doi:10.2134/jeq2013.12.0505
Räsänen, A., Juutinen, S., Kalacska, M., Aurela, M., Heikkinen, P., Mäenpää, K., et al. (2020). Peatland Leaf-Area index and Biomass Estimation with Ultra-high Resolution Remote Sensing. GIScience & Remote Sensing 57, 943–964. doi:10.1080/15481603.2020.1829377
Räsänen, A., Juutinen, S., Tuittila, E. S., Aurela, M., and Virtanen, T. (2019). Comparing Ultra‐high Spatial Resolution Remote‐sensing Methods in Mapping Peatland Vegetation. J. Veg Sci. 30, 1016–1026. doi:10.1111/jvs.12769
Remondino, F., Barazzetti, L., Nex, F., Scaioni, M., and Sarazzi, D. (2012). Uav Photogrammetry for Mapping and 3D Modeling - Current Status and Future Perspectives. Int. Arch. Photogramm. Remote Sens. Spat. Inf. Sci. XXXVIII-1/C22, 25–31. doi:10.5194/isprsarchives-XXXVIII-1-C22-25-2011
Rodriguez, A. F., Gerber, S., and Daroub, S. H. (2020). Modeling Soil Subsidence in a Subtropical Drained Peatland. The Case of the Everglades Agricultural Area. Ecol. Model. 415, 108859. doi:10.1016/j.ecolmodel.2019.108859
Rodriguez, A. F., Gerber, S., Inglett, P. W., Tran, N. T., Long, J. R., and Daroub, S. H. (2021). Soil Carbon Characterization in a Subtropical Drained Peatland. Geoderma 382, 114758. doi:10.1016/j.geoderma.2020.114758
Ruzgienė, B., Berteška, T., Gečyte, S., Jakubauskienė, E., and Aksamitauskas, V. Č. (2015). The Surface Modelling Based on UAV Photogrammetry and Qualitative Estimation. Measurement 73, 619–627. doi:10.1016/j.measurement.2015.04.018
Sankey, J. B., Sankey, T. T., Li, J., Ravi, S., Wang, G., Caster, J., et al. (2021). Quantifying Plant-Soil-Nutrient Dynamics in Rangelands: Fusion of UAV Hyperspectral-LiDAR, UAV Multispectral-Photogrammetry, and Ground-Based LiDAR-Digital Photography in a Shrub-Encroached Desert Grassland. Remote Sensing Environ. 253, 112223. doi:10.1016/j.rse.2020.112223
Scarelli, F. M., Sistilli, F., Fabbri, S., Cantelli, L., Barboza, E. G., and Gabbianelli, G. (2017). Seasonal Dune and beach Monitoring Using Photogrammetry from UAV Surveys to Apply in the ICZM on the Ravenna Coast (Emilia-Romagna, Italy). Remote Sensing Appl. Soc. Environ. 7, 27–39. doi:10.1016/j.rsase.2017.06.003
Silins, U., and Rothwell, R. L. (1998). Forest Peatland Drainage and Subsidence Affect Soil Water Retention and Transport Properties in an Alberta Peatland. Soil Sci. Soc. America J. 62, 1048–1056. doi:10.2136/sssaj1998.03615995006200040028x
Thar, K. N., and Ahmad, A. (2013). An Evaluation on Fixed Wing and Multi-Rotor UAV Images Using Photogrammetric Image Processing. World Acad. Sci. Eng. Technol. 73, 348–352.
Tur, R., Uzunsakal, L., and Danandeh Mehr, A. (2020). “Chapter Eight - Coastline Change Determination Using UAV Technology: A Case Study Along the Konyaaltı Coast, Antalya, Turkey,” in Drones in Smart-Cities. Editor F. Al-Turjman (Elsevier), 123–141. doi:10.1016/B978-0-12-819972-5.00008-2
Urák, I., Hartel, T., Gallé, R., and Balog, A. (2017). Worldwide Peatland Degradations and the Related Carbon Dioxide Emissions: the Importance of Policy Regulations. Environ. Sci. Pol. 69, 57–64. doi:10.1016/j.envsci.2016.12.012
Uysal, M., Toprak, A. S., and Polat, N. (2015). DEM Generation with UAV Photogrammetry and Accuracy Analysis in Sahitler hill. Measurement 73, 539–543. doi:10.1016/j.measurement.2015.06.010
van Hardeveld, H. A., Driessen, P. P. J., Schot, P. P., and Wassen, M. J. (2017). An Integrated Modelling Framework to Assess Long-Term Impacts of Water Management Strategies Steering Soil Subsidence in Peatlands. Environ. Impact Assess. Rev. 66, 66–77. doi:10.1016/j.eiar.2017.06.007
Vavulin, M. V., Chugunov, K. V., Zaitceva, O. V., Vodyasov, E. V., and Pushkarev, A. A. (2021). UAV-based Photogrammetry: Assessing the Application Potential and Effectiveness for Archaeological Monitoring and Surveying in the Research on the 'valley of the Kings' (Tuva, Russia). Digital Appl. Archaeology Cult. Heritage 20, e00172. doi:10.1016/j.daach.2021.e00172
Villoslada Peciña, M., Bergamo, T. F., Ward, R. D., Joyce, C. B., and Sepp, K. (2021). A Novel UAV-Based Approach for Biomass Prediction and Grassland Structure Assessment in Coastal Meadows. Ecol. Indicators 122, 107227. doi:10.1016/j.ecolind.2020.107227
Walker, J. P., and Willgoose, G. R. (1999). On the Effect of Digital Elevation Model Accuracy on Hydrology and Geomorphology. Water Resour. Res. 35, 2259–2268. doi:10.1029/1999WR900034
Wu, Z., Ni, M., Hu, Z., Wang, J., Li, Q., and Wu, G. (2019). Mapping Invasive Plant with UAV-Derived 3D Mesh Model in Mountain Area-A Case Study in Shenzhen Coast, China. Int. J. Appl. Earth Observation Geoinformation 77, 129–139. doi:10.1016/j.jag.2018.12.001
Yu, Z., Loisel, J., Brosseau, D. P., Beilman, D. W., and Hunt, S. J. (2010). Global Peatland Dynamics since the Last Glacial Maximum. Geophys. Res. Lett. 37 (13). doi:10.1029/2010GL043584
Zanello, F., Teatini, P., Putti, M., and Gambolati, G. (2011). Long Term Peatland Subsidence: Experimental Study and Modeling Scenarios in the Venice Coastland. J. Geophys. Res. 116, F04002. doi:10.1029/2011JF002010
Zhao, S., Cheng, W., Zhou, C., Chen, X., Zhang, S., Zhou, Z., et al. (2011). Accuracy Assessment of the ASTER GDEM and SRTM3 DEM: an Example in the Loess Plateau and North China Plain of China. Int. J. Remote Sensing 32, 8081–8093. doi:10.1080/01431161.2010.532176
Zhou, Z., Li, Z., Waldron, S., and Tanaka, A. (2019). InSAR Time Series Analysis of L-Band Data for Understanding Tropical Peatland Degradation and Restoration. Remote Sensing 11, 2592. doi:10.3390/rs11212592
Ziegler, R., Wichtmann, W., Abel, S., Kemp, R., Simard, M., and Joosten, H. (2021). Wet Peatland Utilisation for Climate protection - an International Survey of Paludiculture Innovation. Clean. Eng. Techn. 5, 100305. doi:10.1016/j.clet.2021.100305
Keywords: UAV, DEM, peatland, photogrammetry, accuracy analysis, remote sensing, Tuchola Pinewood
Citation: Czapiewski S (2022) Assessment of the Applicability of UAV for the Creation of Digital Surface Model of a Small Peatland. Front. Earth Sci. 10:834923. doi: 10.3389/feart.2022.834923
Received: 14 December 2021; Accepted: 13 January 2022;
Published: 10 February 2022.
Edited by:
Waldemar Kociuba, Maria Curie-Skłodowska University, PolandReviewed by:
Murat Uysal, Afyon Kocatepe University, TurkeyPaweł Wiśniewski, University of Gdansk, Poland
Copyright © 2022 Czapiewski. This is an open-access article distributed under the terms of the Creative Commons Attribution License (CC BY). The use, distribution or reproduction in other forums is permitted, provided the original author(s) and the copyright owner(s) are credited and that the original publication in this journal is cited, in accordance with accepted academic practice. No use, distribution or reproduction is permitted which does not comply with these terms.
*Correspondence: Sebastian Czapiewski, c2ViYXN0aWFuLmN6YXBpZXdza2lAdWt3LmVkdS5wbA==