 N. Yin
 Q. H. Hu
 H. M. Liu4
- 1Shandong Provincial Key Laboratory of Deep Oil and Gas, China University of Petroleum (East China), Qingdao, China
- 2Laboratory for Marine Mineral Resources, Qingdao National Laboratory for Marine Science and Technology, Qingdao, China
- 3Department of Earth and Environmental Sciences, The University of Texas at Arlington, Arlington, TX, United States
- 4Exploration and Production Research Institute of Shengli Oilfield Company, Dongying, China
- 5Hubei Key Laboratory of Marine Geological Resources, China University of Geosciences, Wuhan, China
Shale samples with carbonate interlayers have attracted more and more attention in shale oil exploration of lacustrine shale in China, and the characterization of pore structure and wettability of these shales are significant to the study of shale-oil enrichment and effective exploitation. In this work, by examining six shale samples with carbonate interlayers of Shahejie Formation in East China, the pore structure and wettability characteristics of shale are characterized by means of thin section petrography; X-ray diffraction mineralogy; total organic carbon (TOC) analyses; scanning electron microscopy (SEM) imaging; air-liquid contact angle for wettability; as well as N2 physisorption, mercury intrusion porosimetry, and nuclear magnetic resonance (NMR) for pore structure. The results show that the main mineral contents are carbonate (with an average of 51.4%) and clay minerals (mainly mixed-layer illite-smectite). The average TOC content is 2.90%, and there is a strong correlation between TOC and dolomite content. In addition, the obvious layered structure is observed by thin section and SEM methods. The pores below 200 nm with ink-bottle shapes are obviously smaller than those of marine shale, and the pore throats are mainly below 50 nm; however, there are also some micrometer-sized cracks. The droplet contact angle measurement shows that the shale is mainly lipophilic, while moderately hydrophilic, at millimeter observational scales. The NMR T2 spectra of water- and oil-saturated samples have an obvious feature of three peak characteristics, as the pore size-associated wettability of these samples can be divided into three stages: water-wet (0.01–1 ms), oil-wet (1–40 ms), and mixed-wet (>40 ms) in terms of relaxation time of the NMR T2 spectrum. The proportion of the second main peak of T2 spectra (P2) for dodecane-saturated samples is directly proportional to the TOC content, and the relationship between P2 and mineral composition is consistent with water-saturated samples.
Introduction
Shale oil is mainly produced from lacustrine facies in East China, and carbonate interlayers are found in many lacustrine shales which have a strong correlation with shale oil (Hao et al., 2014; Hargrave et al., 2014; Kang et al., 2015; Liu et al., 2015; Wang Y. et al., 2016; He et al., 2017). The shale lithofacies contributing to an industrial oil production in Dongying Depression are mainly organic-rich laminated shales, which are regarded as the dominant lithofacies (Song et al., 2015). Therefore, it is urgent to study the geochemical and petrophysical characteristics of shales with carbonate intercalation. However, the current research mainly focuses on the origin and source of carbonates, and some scholars have found that the abundance of carbonate intercalation is positively correlated with oil and total organic carbon (TOC) contents (Lerman et al., 1995; Zhu et al., 2005; Martínek et al., 2006; Hargrave et al., 2014; Li et al., 2014; Liu et al., 2015; Wang et al., 2015). Nevertheless, little attention is paid to the pore structure and wettability of shale with carbonate interlayers, which plays a significant role in fluid distribution and petroleum recovery (Sulucarnain et al., 2012; Wang Y. et al., 2016).
The measurements of pore structure for shale include the fluid immersion method and imaging method, such as high-pressure mercury intrusion porosimetry (MIP), low-temperature gas (N2 and CO2) physisorption (GP), nuclear magnetic resonance (NMR), scanning electron microscopy (SEM), small angle X-ray scattering (SAXS), and small angle neutron scattering (SANS) (Zhao et al., 2017; Sun et al., 2018; Zhang et al., 2020). Due to the predominantly small-size (at nano scales) and yet a wide range (from nanometers to micrometers) of pores in shale, the use of a single measurement listed above with different measurable ranges in both pore and sample sizes is not sufficient to effectively characterize the pore structure of shale. Therefore, coupled methodologies, such as MIP in combination with GP, are employed in order to better reflect the pore structure of shale.
In addition to pore structure, due to the structural and chemical heterogeneities in unconventional reservoirs, the wettability of shale formations is very complex (Pan et al., 2021) At present, the wettability measurements mainly include qualitative, quantitative, and field methods (Zhou et al., 2020). For example, some researchers have presented the wettability studies of shale with NMR T2 distribution analyses (Fleury and Deflandre, 2003; Odusina et al., 2011; Zhang et al., 2014; Korb et al., 2018) and NMR techniques based on the relative water and oil absorption capacities of samples (Arif et al., 2021).
In this study, six shale samples with carbonate interlayers from Shahejie Formation of Dongying Depression in Bohai Bay Basin of East China were selected. Utilizing integrated and complementary methods of thin section, x-ray diffraction (XRD), TOC, N2-GP, MIP, SEM, contact angle, NMR, and imbibition, the morphological characteristics, pore structure, and wettability of shales with carbonate interlayers were examined. In addition, the relationships between NMR responses with respect to oil-water phases and pore types and mineralogical compositions were analyzed.
Samples and Analyses
Six shale samples with substantial carbonates interlayers, consisting of mudstones and shale and carbonate laminae, were collected for this study from Shahejie Formation of Dongying depression in Bohai Bay Basin of East China, which was formed in a deep and semi-deep lakes facies sedimentary environment (Chen et al., 2017), of which Sample 4 contains carbonate veins up to 4 mm thick. Each sample was processed into three different sizes for a wide range of analyses: 1) cylindrical core plugs (2.54 cm in diameter and 3 cm in height) for NMR tests, except for Sample No. 1 which was too small to be plugged; 2) rectangular-shaped cubes with a length of 1 cm for spontaneous fluid imbibition and MIP tests, as well as SEM and contact angle tests on half of the cube (0.5 cm × 1 cm × 1 cm); and 3) granular samples being crushed with mortar and pestle to 35, 100, and 200 mesh sizes for N2-GP, Rock-Eval, and XRD analyses.
Field emission-SEM (FE-SEM) imaging was conducted using Helilios Nanolab 650, which has a magnification of up to 400,000 times and a resolution of down to 0.9 nm. The samples were cut into slices at 0.5 cm × 1 cm × 1 cm and then argon ion-polished with LEICA EM RE102 for 30 min. A thin (10–20 nm) carbon coating was sprayed onto the polished surface to increase the electrical conductivity for better image quality. Subsequently, the high-resolution FE-SEM instrument was used to observe the polished surface for pore morphologies.
Low-pressure GP isotherm tests were performed on crushed samples (35 mesh sizes; 500 μm) by a Micromeritics ASAP 2020 Surface Area and Porosimetry Analyzer. The granular samples were dried in an oven at 60°C for 48 h to remove volatile substances and free water in the connected pore space, and then degassed under high vacuum (<10 mmHg) for 12 h at 110°C. With the relative pressure (P/Po) from 0.001 to 0.998, N2 adsorption and desorption isotherms and pore structure parameters were obtained for the shale samples controlled at a liquid nitrogen temperature of −196.15°C. The pore surface area (m2/g) was obtained using the Brunauer–Emmett–Teller (BET) method (Brunauer et al., 1938), whereas pore volume and pore size distribution were determined by density functional theory (DFT) (Lastoskie et al., 1993). Using the same instrument and DFT data reduction, CO2-GP adsorption analyses with a lower and narrower measurable pore size distribution than N2-GP were performed for relative pressure from 0.001 to 0.998 at a temperature of 0°C controlled by water bath.
The Micromeritics AutoPore IV 9520 Porosimeter instrument was used to obtain a range of petrophysical properties by monitoring mercury volume changes as a function of increasing and decreasing pressures, which is related to pore-throat sizes using modified Washburn equations (Washburn, 1921; Wang S. et al., 2016). In this study, cubic samples (∼1 × 1 × 1 cm3) were oven-dried at 60°C for at least 48 h and cooled to room temperature before the MIP tests. The sample was then placed inside the instrument and evacuated until 50 μm Hg pressure (at 6.7 Pa or 99.993% vacuum) to remove any air or moisture inside the sample (Hu et al., 2017), and then subjected to low- (5–30 psi) and high-pressure tests incrementally up to 60,000 psi (414 MPa) with equilibration times at 10 and 60 s, respectively.
The NMR experiments were performed on 10 cylindrical samples (two each from Samples 2–6) under ambient conditions of 20°C and 32% humidity. The core samples were used without oil washing before the NMR measurements (Yang et al., 2021). Firstly, the samples were dried in a convection oven at 60°C for 72 h. Subsequently, the samples were evacuated for 24 h, and then saturated with distilled water and n-dodecane, respectively, at 16 MPa for 72 h, in a custom-designed pressure-cell apparatus to attain its maximum saturation, the dry-and-saturated samples were then weighed to calculate the porosity by water immersion porosimetry (WIP) method based on the Archimedes principle, which was then subjected to the NMR test for T2 spectral distribution. The NMR measurements were performed using a Niumag MesoMR12-070H-I instrument with a low constant magnetic field of 0.3 T and resonant frequency of 12 MHz. NMR T2 distributions were measured using CPMG sequence and other measurement parameters of waiting time (TW) at 5,000 ms, echo number (NECH) at 12,000, echo interval (TE) at 0.1 ms, and scan times at 128.
In addition, we took Sample 5 out from the dodecane-saturation pressure cell, then immersed the core in the imbibition cells filled with 25% MnCl2 solution which has no NMR signals. Therefore, the NMR apparatus can only detect the signals from dodecane within the shale pores connected to the sample surface. The NMR analyses were conducted at selected time intervals of 0.5, 5, 10, 15, 30, and 45 days for wettability of lacustrine shale.
Results and Discussion
Geological Properties of Shales With Carbonate Interlayers
The basic parameters of the samples are listed in Tables 1, 2. The results of TOC, Rock-Eval pyrolysis, and porosity are presented in Table 1. TOC contents range from 2.28 to 3.24 wt%, with an average of 2.9 wt%. The porosity measured by WIP on cylindrical sample range from 5.16% to 8.12%, with an average of 5.84%.
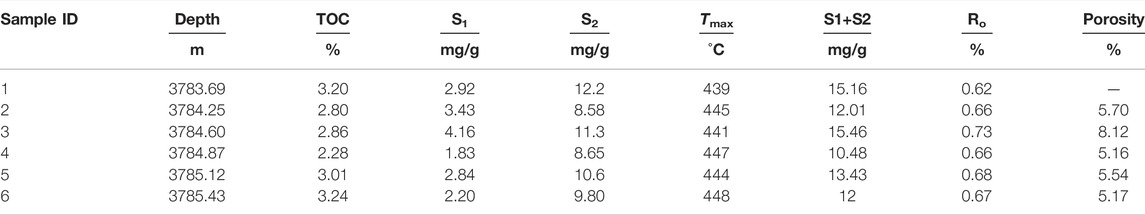
TABLE 1. Sample information and basic properties.
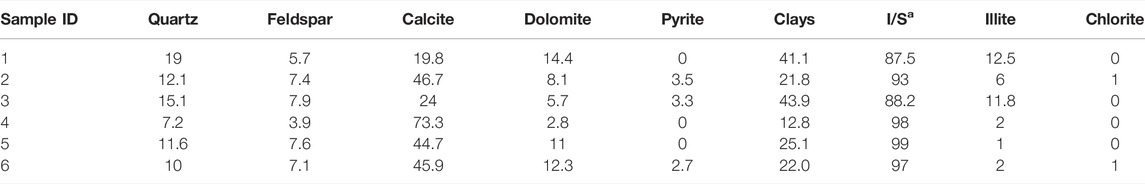
TABLE 2. Mineral composition in weight percentage (%).
The mineralogical compositions are listed in Table 2. These six samples with substantial carbonate interlayers contain the contents of carbonates (29.7–76.1 wt%; mainly calcite and some dolomite) and clays (12.8–41.1 wt%).
Figure 1 shows a positive relationship between dolomite and TOC contents with a correlation coefficient of 0.85, which suggests that the dolomite mineral in Shahejie Formation is partially biogenic in origin (Bertassoli et al., 2016).
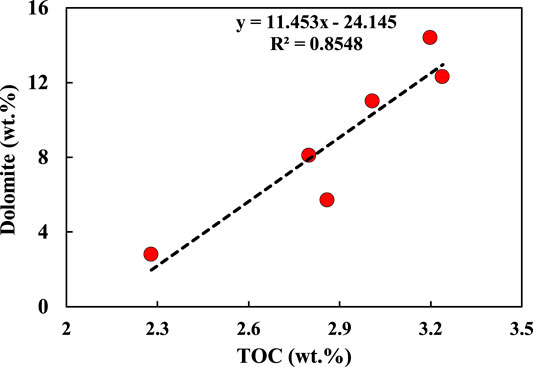
FIGURE 1. Cross-plot of TOC and dolomite contents.
In combination with thin section petrography and SEM images, the samples are observed to exhibit the lithological features at multiple scales from centimeters to micrometers. The carbonate interlayers develop continuously in the transverse direction, varying greatly with the thick layers up to centimeter levels and thin ones less than 1 mm. Carbonate minerals are mainly calcite with a good crystallinity, and most surfaces are clean and bright (as shown in Figures 2A–D).
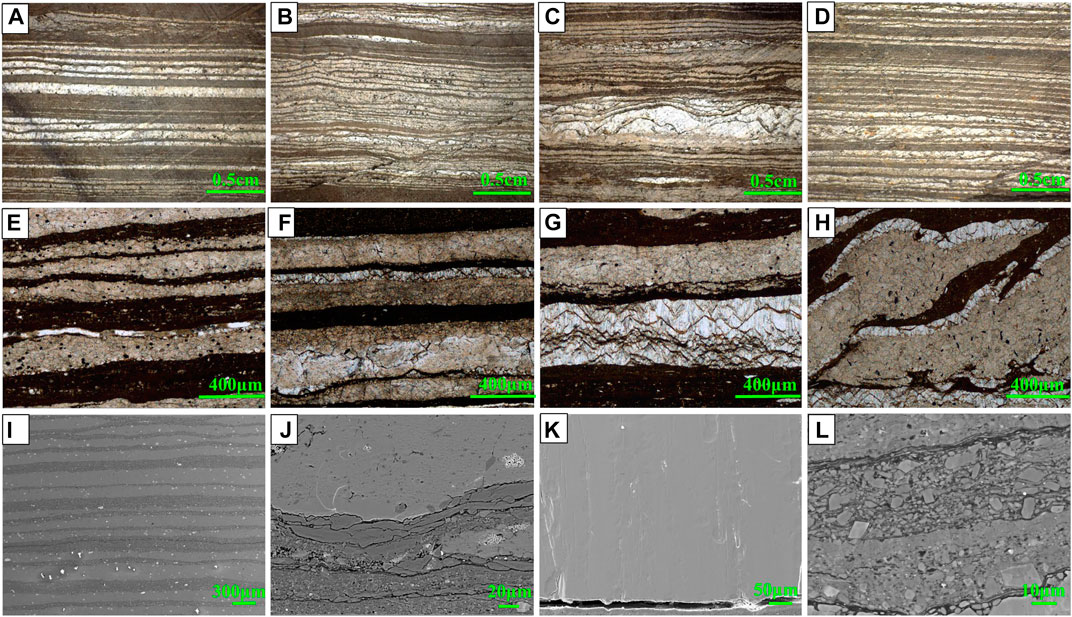
FIGURE 2. Multi-scale carbonate interlayers within the organic-rich shale; (A–D) core photos of interbedded mudstones and shales with crystalline carbonates; (E–H) thin-section petrography under the cross-polarized light, with crystalline carbonate interlayers showing a well-crystalized morphology; (I) SEM image of interbedded mudstone and crystalline carbonate; (J) SEM image showing the boundary between layered mudstone and carbonate; (K) SEM image of well-crystallized carbonates with clean surface and bedding fracture; and (L) SEM image of layered mudstone and banded organic matter.
Interbedded mudstone and shale mainly composed of clay minerals is developed above and below the carbonate interlayers from the thin section petrography (shown in Figures 2E–G), and some interlayers show sharp boundaries against the neighboring shale (Figure 2H). Mostly calcites seem to have simple composition and structure with relatively clean surfaces, while some calcites are relatively dirty with attached clay minerals and residual calcite pores being filled with clay minerals (Figures 2F,G). Obviously, calcite with different crystalline forms can be seen in the same sample (Figures 2E–H).
The surface of most calcite is relatively clean and the internal material components are relatively pure, as shown from SEM images (Figures 2I–K). It can also be observed that well-crystallized calcite particles from the petrography (Figure 2G) have the purest composition under the SEM with nearly no pores (Figure 2K), or only filled with a small amount of clay minerals (Figure 2J). The organic matter developed in the laminated shale is of filamentary or ribbon-like shape (Figures 2I,J), which is often related to the growth of algae (Bai et al., 2018). Calcite interlayers exist in the form of coarse strip (Figures 2I–K) and are dispersed (Figure 2L), which are mainly the products of dissolution and reprecipitation of shale with the thermal evolution of organic matter in the late diagenetic stage (Wang et al., 2005). The bedding fractures formed between interlayers are parallel to the bedding planes (Figure 2K) and wider than 10 μm to potentially serve as the important migration channels for petroleum movement (Wang et al., 2015).
Pore Structure of Shale With Carbonate Interlayers
Table 3 compiles the results from the N2 physisorption isotherm method, including the total pore volume V at the maximum relative pressure, BET surface area A, and average pore size (4V/A). The pore volume of the Shehejie Shale varies from 0.0048 cm3/g to 0.024 cm3/g with an average of 0.0096 cm3/g, and the specific surface areas range from 1.78 to 14.8 m2/g with an average of 8.20 m2/g. The average pore diameter is from 6.08 to 10.2 nm for a total of six samples.
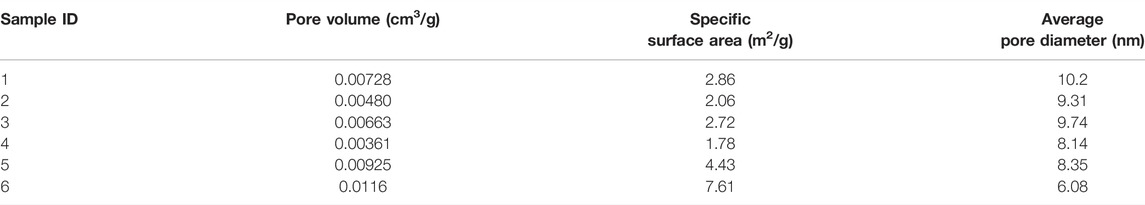
TABLE 3. Low pressure N2-GP results for Shahejie samples.
According to the classification scheme of the International Union of Pure and Applied Chemistry (IUPAC) (Rouquerol et al., 1994), Figure 3A shows that the CO2 physisorption isotherm of Shahejie Shale is type I isotherm, which can be interpreted as a micropore filling under low relative pressures, suggesting that a certain number of micropores (<2 nm in diameter) are present in the Shahejie Shale.
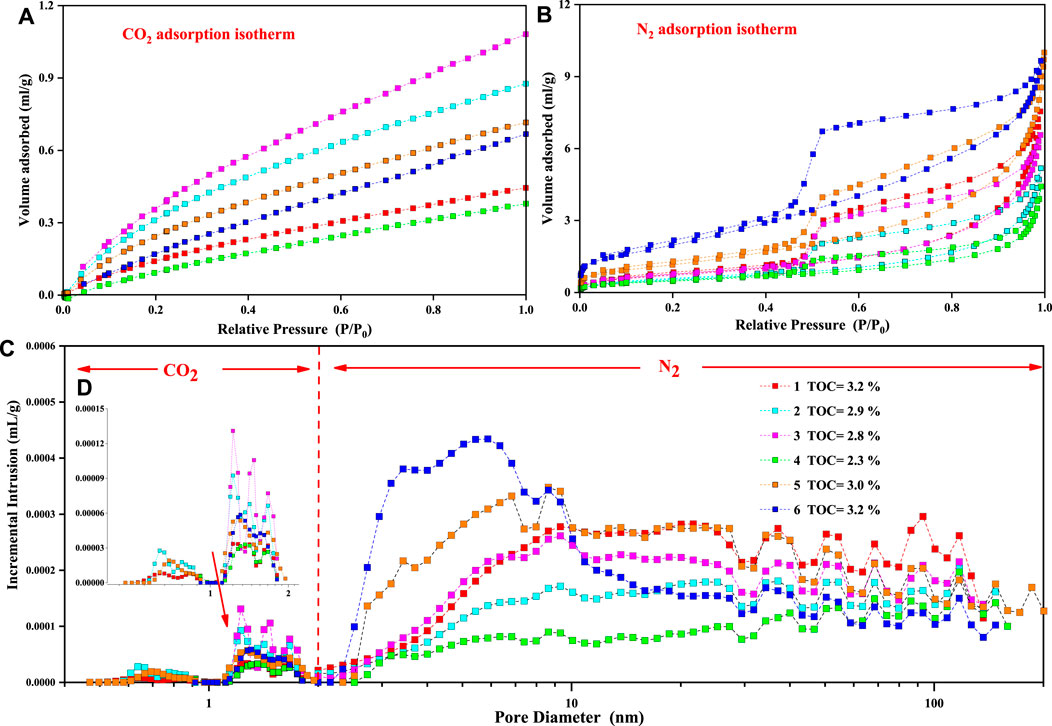
FIGURE 3. (A) CO2 adsorption-desorption isotherms; (B) N2 adsorption-desorption isotherms; (C) pore size distribution calculated by CO2 and N2 isotherms and their measurable ranges.
According to the IUAPC classification, the adsorption curves of N2 isotherm for all of six shale samples are type II isotherm (Figure 3B) (Brunauer et al., 1938), which rise rapidly in the low relative pressure region, then rise slowly (0.05 and 0.95) to form a slightly convex shape. When the maximum relative pressure is about 1.0, there is no obvious saturation of the adsorption, indicating that there are macropores (>50 nm in diameter) in samples. It should be noted that the adsorption volume of samples is less than 6 ml/g which is consistent with the result of Wang et al. (2018) for Shahejie Shale, but only half or less of the corresponding volume of shale samples from marine-sourced Wufeng Formation (Yang et al., 2017), indicating that there are few mesopores (2–50 nm) in the lacustrine Shahejie samples (Figure 3B).
A significant hysteresis loop is observed for the adsorption and desorption branches (Figure 3B), which can reveal the pore structure of shale samples according to the shape of the hysteresis loop (Gregg and Sing, 1982). Based on the IUPAC classification (Sing, 1985), shale Samples 1–4 and 6 are typical of H3 hysteresis loop, which indicates that most samples mainly develop narrow plate- or slit-like pores. However, Sample 5 is indicative of type H2 (Figure 3B), which corresponds to ink-bottle pore shapes with a small number of cylindrical pores. The pore size distribution of Shahejie Shale obtained by the combination of low-pressure N2 and CO2 physisorption isotherm methods range from 1.6 to 180 nm (Figure 3C). Overall, there are two main peaks at about 1.5 nm from CO2-GP and 5 nm from N2-GP techniques.
Pore Throats of Shales With Carbonate Interlayers
MIP tests can reflect the distribution of connected pore throats for shale samples, which plays an important role in the flow of shale oil. Figure 4A shows the plots of cumulative intrusion and extrusion volumes vs. the applied pressure for six Shahejie Shale samples with carbonate interlayers. The maximum pressure of an MIP test is 414 MPa, which corresponds to a pore-throat diameter of 2.8 nm, using a variable contact angle and surface tension of Sen Wang et al. (2016). The intrusion and extrusion curves of MIP tests show obvious hysteresis loops, indicating that a large part of mercury still remains in the larger pore space controlled by smaller pore throats (narrow plate- or slit-like pores) after extrusion (Jiang et al., 2015; Hu et al., 2017). The intrusion volume of mercury at the maximum pressure are between 0.011 and 0.025 ml/g. From the combined plots of incremental intrusion distribution and pore volume percentage distribution from MIP tests (Figures 4B,C), we can see that significant amounts of pore throats are within the range of 2.8–50 nm (Hu et al., 2017). Meanwhile, there are some micrometer-sized pore throats in the samples (Figure 4C), which may be related to the interlayer cracks and microcracks observed directly from SEM images (Figure 3K).
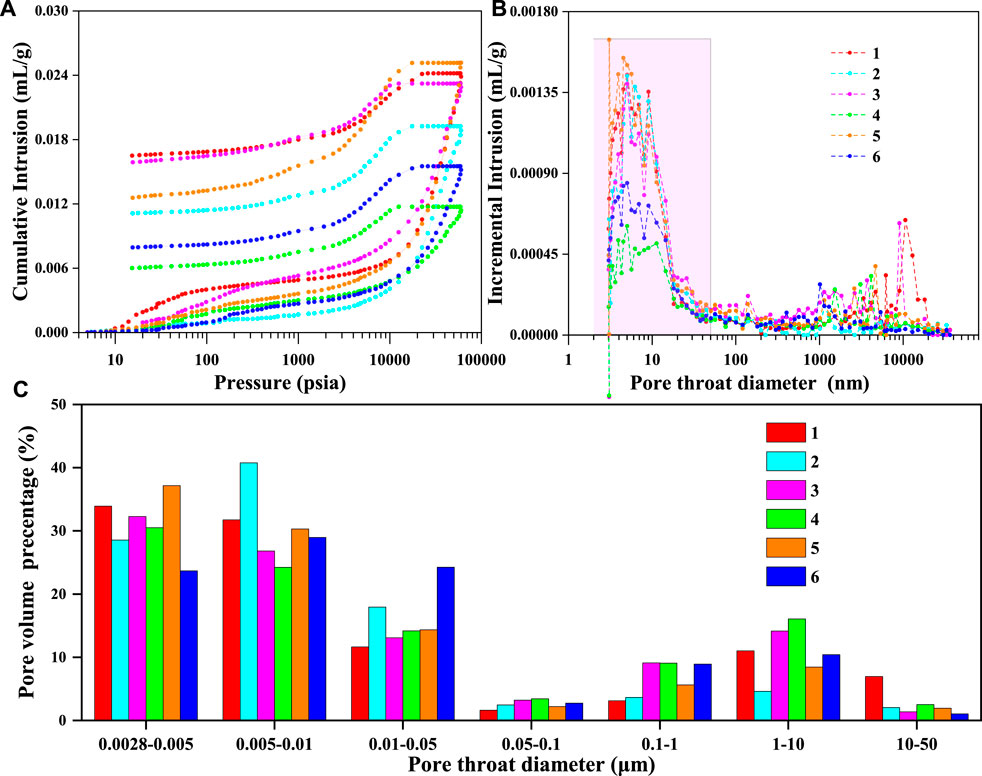
FIGURE 4. (A) Cumulative mercury intrusion and extrusion vs. applied pressure from MIP tests; (B) Incremental intrusion distribution across nanometer-micrometer spectrum; and (C) pore volume percentage as a function of pore-throat size distribution.
The Wettability of Shale With Carbonate Interlayers
Contact Angle
Since the surface roughness has a significant effect on the contact angle measurement (Singh, 2016), a sample preparation step of obtaining a smooth solid surface polished with 220 mesh sandpaper is needed before measurements for the droplet air-liquid contact angle measurements; the measured surface roughness for two similar samples is 2.29 ± 0.08 and 2.08 ± 0.28 with both triplicate measurements. In addition, considering the heterogeneity of shale samples, the vertical bedding plane of shale and carbonate interlayers is used for the measurement. A droplet of 2 μl liquid, either n-dodecane (as an oil-wetting fluid) or deionized water (DIW), was placed onto the surface of two different shale samples to capture the images of the air-liquid-solid interface; the contact angle was calculated by the CAST™ 2.0 software associated with a contact angle meter and interface tensiometer (Model SL200KB, Kino) (Figure 5).
FIGURE 5. Air-liquid contact angle droplet tests: (A) n-dodecane; (B) DIW liquids.
Figure 6 shows the contact angle measurements using two different fluids obtained for the Shahejie Shale with carbonate interlayers. The contact angles of DIW are in the range of 36.0°–69.5°, after the droplet comes in contact with the sample surface. While the n-dodecane wets the sample surface very quickly and shows a much lower contact angle (12.5°–18.6°) at a fraction of a second and then spread to an angle below the detection limit of ∼3°. As can be seen from Figure 6, the shale samples at the millimeter scale of observation show an excellent lipophilicity and relatively weak hydrophilicity which have some differences between the samples, consistent with the results of Hu et al. (2018). Most recently, Ma et al. (2022) presented a liquid-liquid extraction technique to better assess the wettability of shale samples at micrometer scales.
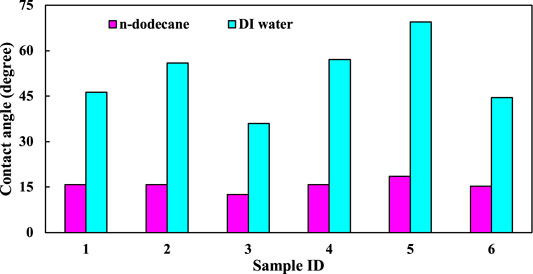
FIGURE 6. Contact angle measurements for n-dodecane (at 0.02 s) and DIW (at 30 s) liquids.
Determination of Wettability Through NMR
NMR T2 spectra can provide substantial information about the physical and fluid properties of samples (Coates et al., 1991; Wang and Li, 2008; Daigle et al., 2014; Lai et al., 2018), and the wettability determines the pore-scale fluid distributions (Pan et al., 2020). To determine the wettability and associated pores of shales with carbonate interlayers, in this study, we compared the saturation state of DIW and dodecane, respectively, and Figure 7 shows the NMR T2 spectra of DIW- and dodecane-saturated states.
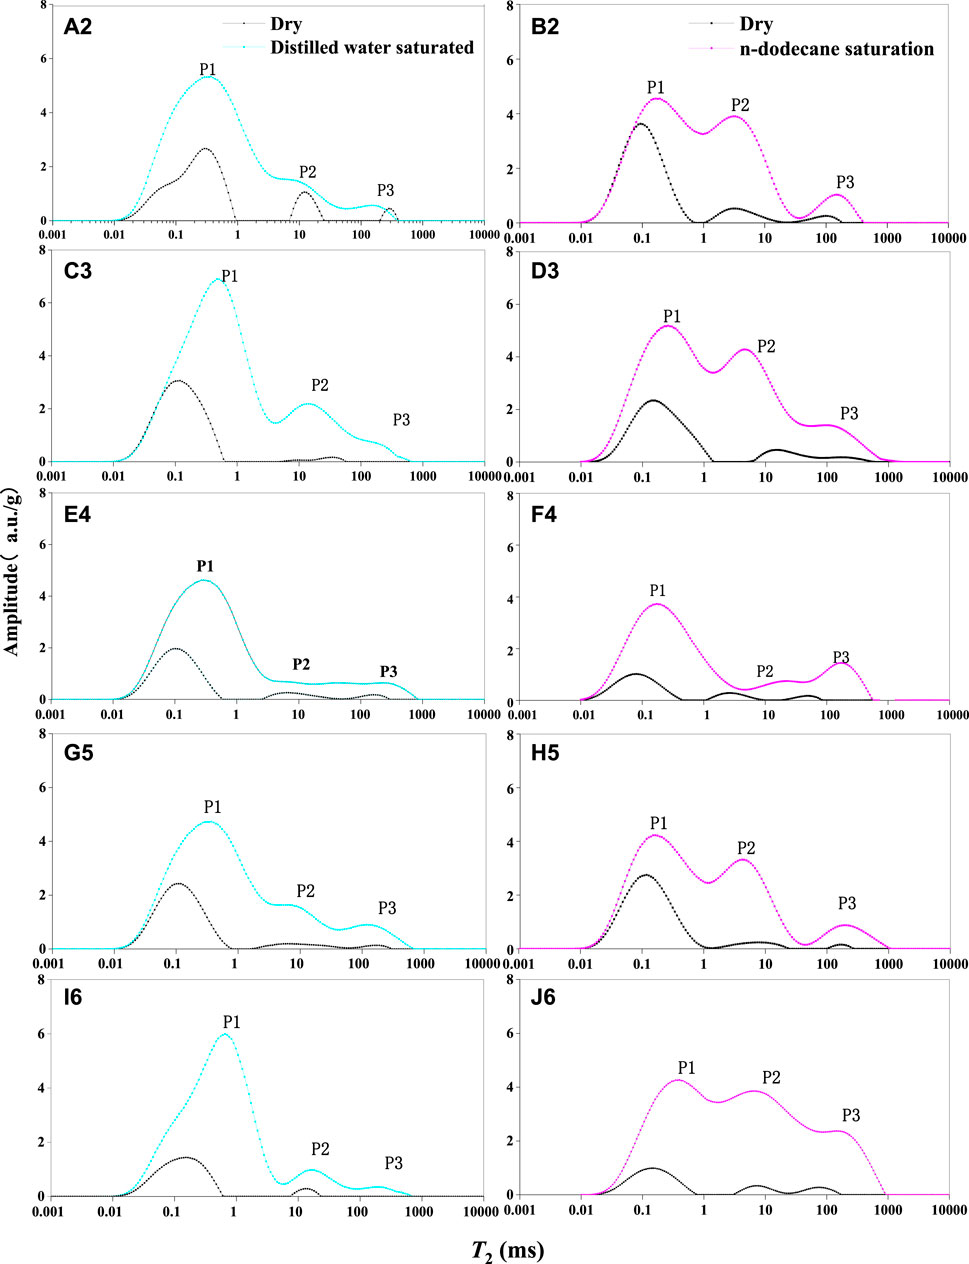
FIGURE 7. T2 spectra for five samples from Shahejie member; a.u.: absolute unit: (A, C, E, G, I) DIW-saturated (left panel); (B, D, F, H, J) Dodecane-saturated (right panel).
The dry state clearly exhibits a predominant peak at ∼0.1 ms, and this is related to the residual liquids not removed at the drying condition of 60°C for 3 days. This T2 time corresponds to the sub-nanometer pores wherein the fluids strongly help via the capillary pressure. A comparison between the T2 spectra of dry and DIW-saturated states shows that the first peak of samples (termed as P1 in this work; Figure 7) increases significantly after water saturation, and the position shifts slightly to the right for a larger T2 time. The T2 spectra for the DIW-saturated samples commonly show three peaks, with the first and dominant peak below 3 ms which can be a combination of clay-bound water and water-filling inside the nano-size pores. In addition, there is also a smaller peak (P3) in the T2 spectra, around and more than 40 ms, which may originate from water inside interlayer cracks and microfractures in these Shahejie Shale samples (Figures 7A,C,E,G,I). As we can see, the P1 is present in all samples, but P2 and P3 in Sample 4 are lumped together as a combined peak (P2 + P3) while this sample has more carbonate veins (Figure 7G). Remarkably, the T2 amplitude of P1 is higher than that of P2, and the T2 distributions of all five samples are similar in T2 pattern and amplitude; this phenomenon confirms that the NMR T2 spectrum is replicable and sensitive to the pore structure evaluation of rock samples (Yao et al., 2010; Zhang et al., 2017).
The T2 spectra of dodecane-saturated states for six samples are also characterized by triple peaks, and the corresponding times of P1, P2, and P3 are distributed in the ranges of 0.01–1 ms, 1–40 ms, and >40 ms, respectively (Figures 7B,D,F,H,J). The T2 amplitude of P1 was slightly lower than that of water-saturated samples, while the opposite is true for P2, suggesting that the pores corresponding to the ranges from 1 ms to 40 ms are oil-wet since the signals of dodecane-saturated states were greater than those of DIW-saturated ones. However, the P2 of Sample 4 exhibit nearly no increase since this sample has more carbonate veins with corresponding larger pore sizes, which also seems to be generally oil-wet from its larger amplitude of P3 in the dodecane-saturated state.
Because the T2 spectrum responds differently to the saturation of water- and oil-phase liquids, the wettability could be examined separately for pores of different sizes (Zhang et al., 2014). A comparison of T2 spectrum for DIW- or dodecane-saturated states indicates that the small pores (at P1 position) are mainly water-wet in the Shahejie Shale samples since an increase of signal amplitude is observed after water saturation. Similarly, it can be concluded that corresponding pores of P2 position is oil-wet since the amplitude of P2 increases significantly after oil saturation. In addition, we observe notable increases in the amplitude beyond 40 ms (P3), with its negligible presence at dry state with neither oil nor water contained, and the contents of oil- or water-saturation within these pores are almost the same, indicating that the micro-fractures of Shahejie Shale are mixed-wet in terms of wettability.
Furthermore, the relationship between shale pore wettability and types has been analyzed by evaluating the change of NMR T2 distribution in combination with FE-SEM images. The pore types of shale can be divided into organic and inorganic pores (Sondergeld et al., 2010; Li et al., 2014; Wang et al., 2014; Zhang et al., 2019). Organic matter-hosted pores of shale are commonly lipophilic, while inorganic pores are hydrophilic owing to the presence of clay minerals (Mitchell et al., 1990).
Organic pores are commonly developed inside or on the edge of organic matter (Wang et al., 2018). The studied samples are in the early oil generation stage (Table 1), and there is a modest presence of nanometer-sized organic pores in these six samples; they mainly include organic matter pores with a good protection by mineral particles (Figure 8A), intergranular organic matter pores within pyrite (Figure 8B), pores in organic matter symbiotic with clay minerals (Figure 8C), and shrinkage cracks at organic matter edge (Figures 8D–F). In addition, fractures could be developed at the edges of organic matter bands and minerals (upper part of Figure 8E), but not at nearby locations (lower part of Figure 8E).
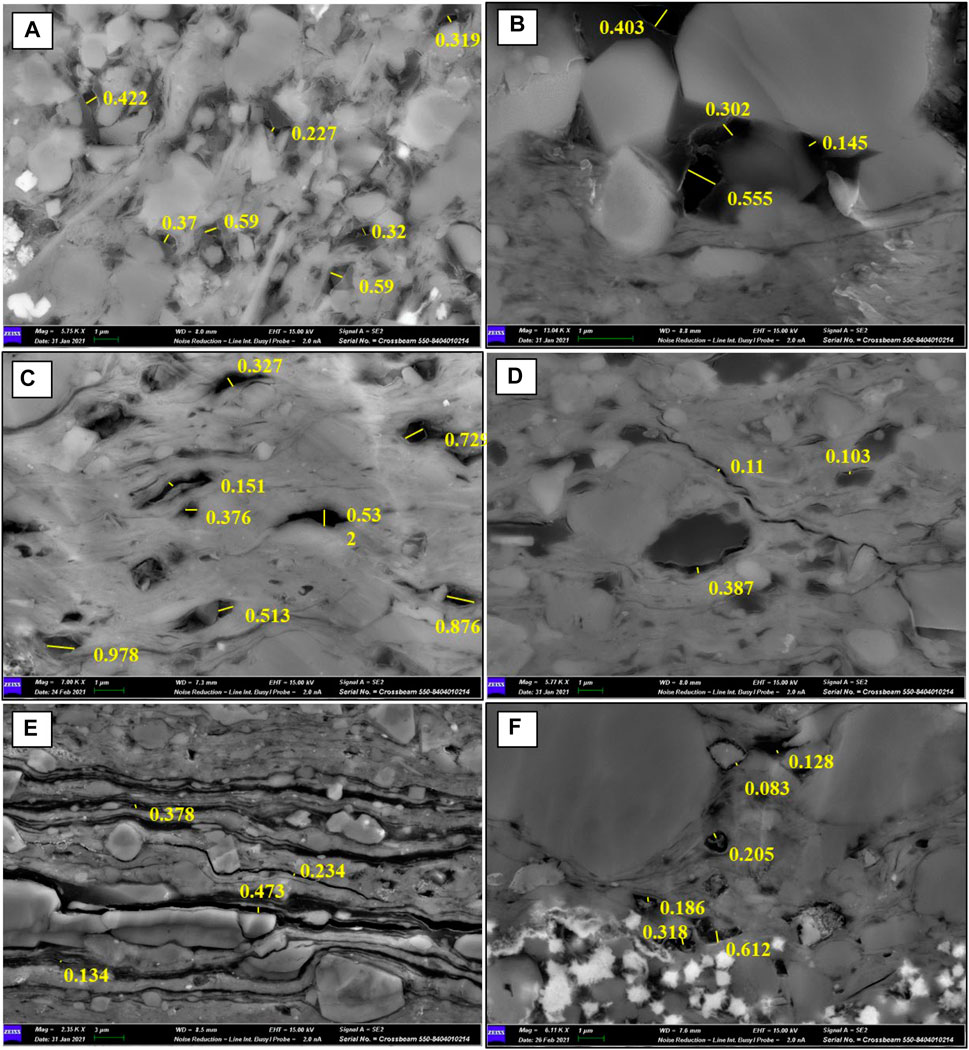
FIGURE 8. Pore morphology and distribution of organic matter in the shales: (A) Sample 1, 3783.69 m; (B) Sample 2, 3784.25 m; (C) Sample 3, 3784.60 m; (D) Sample 4, 3784.87 m; (E) Sample 5, 3785.12 m; (F) Sample 6, 3785.43 m. (The yellow-color numbers are the measured sizes of organic matter-hosted pores with a unit of micrometers).
In this study, the organic matter pores in the shale samples are measured and marked by ImageJ software. Figure 8 shows that these pores are not homogeneously distributed in organic matter. The FE-SEM observations show that the pores associated with organic matter in the Shahejie Shale samples are dominantly at 20 nm−1 μm in size (Figures 8D–F) and mainly belongs to several hundreds of nanometers. In addition, the organic pores are found to be mainly located in the second peak (P2 at 1–40 ms) from the NMR T2 spectra, which is consistent with relatively large (∼100 s nm) organic pores observed in SEM images. Therefore, the relationships between T2 distribution and pore size of various pore types are qualitatively obtained in this study.
Inorganic pores mainly include intergranular pores (InterP) and intragranular pores (IntraP) (Loucks et al., 2012). A large number of intergranular pores are developed in these six Shahejia samples, and they are intergranular pores of clastic minerals (Figure 9A) and intergranular pores of clay minerals with a diameter of 100 nm to several 100 s nm(Figure 9C). Many intragranular pores are also developed, including calcite (Figure 9B) and feldspar dissolution pores (Figure 9F). Micrometer-nanometer scaled microfractures (Figures 9A,B,D,E) are also observed in the samples, mainly as bedding fractures and diagenetic shrinkage fractures. In addition, through a large number of core observations, Jiu et al. (2013) also found that there are structural fractures and overpressure fractures in the Shahejie Shale.
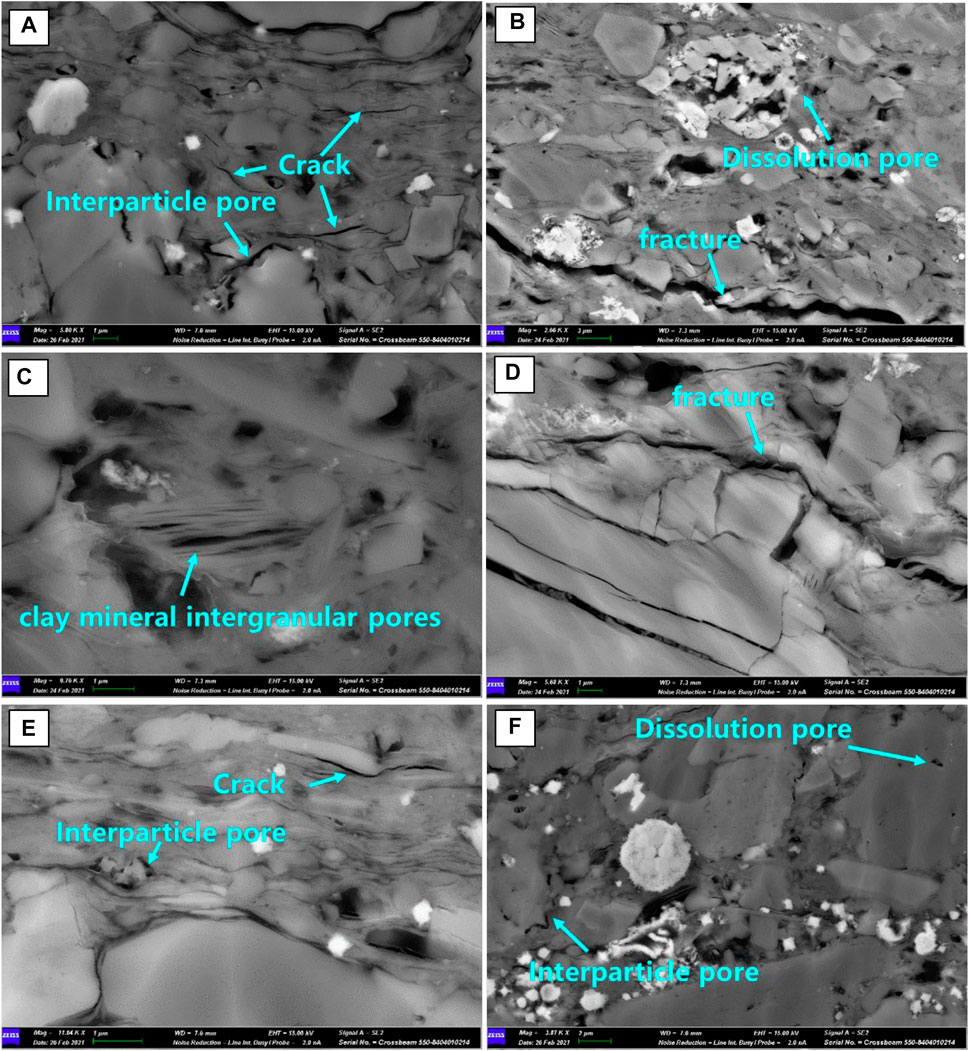
FIGURE 9. Morphology and distribution of various inorganic pores developed in the Shahejie Shale: (A) Sample 2, 3784.25 m; (B) Sample 3, 3784.60 m; (C) Sample 3, 3784.60 m; (D) Sample 5, 3785.12 m; (E) Sample 6, 3785.43 m; (F) Sample 6, 3785.43 m.
The T2 spectrum curves during the process of spontaneous imbibition in MnCl2 solution are shown for Sample 5 in Figure 10. When MnCl2 solution is injected, the amplitudes of the NMR signals representing fluids in the water-wet and mixed-wet pores are expected to change, and the migration of oil in the shale pores is characterized by the alteration of T2 spectrum obtained from the NMR technique during the process of spontaneous imbibition (Liu et al., 2019; Liu and Sheng, 2019), while signals from 100% oil-wet pores should remain unaffected since variable wettability states lead to different capillary trapping capacities (Pan et al., 2021). The experimental results show that the NMR signals of P1 (<1 ms) continue to decrease as the imbibition process proceeds, indicating that MnCl2 solution (with no NMR signals) can enter the small pores by spontaneous imbibition to displace oil. Moreover, the NMR signals of P3 are drastically reduced but those of P2 are almost unchanged. Therefore, the corresponding pores for P2 at 1–40 ms in Shahejie samples are likely oil-wet. The results indicate that the wettability of inorganic pores, organic pores, and micro-fractures corresponding to the peaks of P1 (0.01–1 ms), P2 (1–40 ms), and P3 (>40 ms) in the NMR T2 spectra, were mainly water-wet, oil-wet, and mixed-wet, respectively. This dynamic imbibition tests show the consistent results as the static fluid saturation tests presented early in this section. However, previous studies of Yong Wang et al. (2016) demonstrated that the wetting types of organic pores (0.01–0.4 ms), inorganic pores (0.4–15 ms), and microfractures (>15 ms) for Shahejia shales with carbonate interlayers were oil-wet, water-wet, and mixed-wet, respectively.

FIGURE 10. T2 spectral curves of Sample 5 during the process of spontaneous imbibition.
Influencing Factors of Shale Wettability
In order to characterize the wettability for shales with carbonate interlayers, the amplitude of dry samples was taken as the background to be subtracted, and the proportion of peak area for three peaks were studied in Figure 11. The results show that the proportion of P1 in DIW-saturated samples is significantly higher, while the proportions of P2 and P3 decrease in turn. However, the proportion of P2 in dodecane-saturated samples is the highest, and the proportions of P1 and P3 decrease in tandem except for Sample 4 containing carbonate veins up to 4 mm thick. Overall, these results indicate that the hydrophilic and lipophilic pores of these shale samples with carbonate interlayers were significantly different.
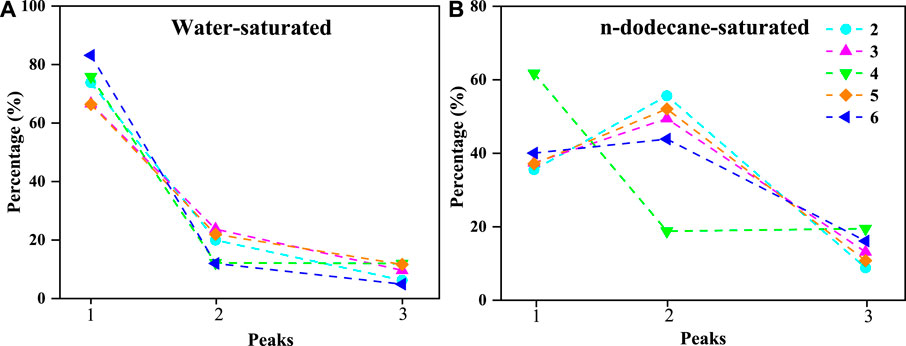
FIGURE 11. Peak area percentage of three peaks (P1, P2, and P3) for (A) DIW- and (B) dodecane-saturated Samples 2–6.
TOC is a good indicator for oil preference and the shale formations with high TOC contents may have many organic pores and be oil-wet (Loucks et al., 2012). The proportion of P2 for dodecane-saturated samples exhibit a positive linear relationship with TOC contents (R2 = 0.597; Figure 12B). In addition, the T2 amplitude of P2 is higher than that of DIW-saturated samples (Figure 10), indicating that the organic matter pores are lipophilic and mainly located in the second peak of T2 spectra. However, the proportions of P1 and P3 for dodecane-saturated samples demonstrate a negative linear relationship with TOC contents (Figures 12A,C). On the other hand, the proportions of P1 and P2 for DIW-saturated samples are not correlated with TOC contents, while only the proportion of P3 is weakly correlated (Figure 12F).
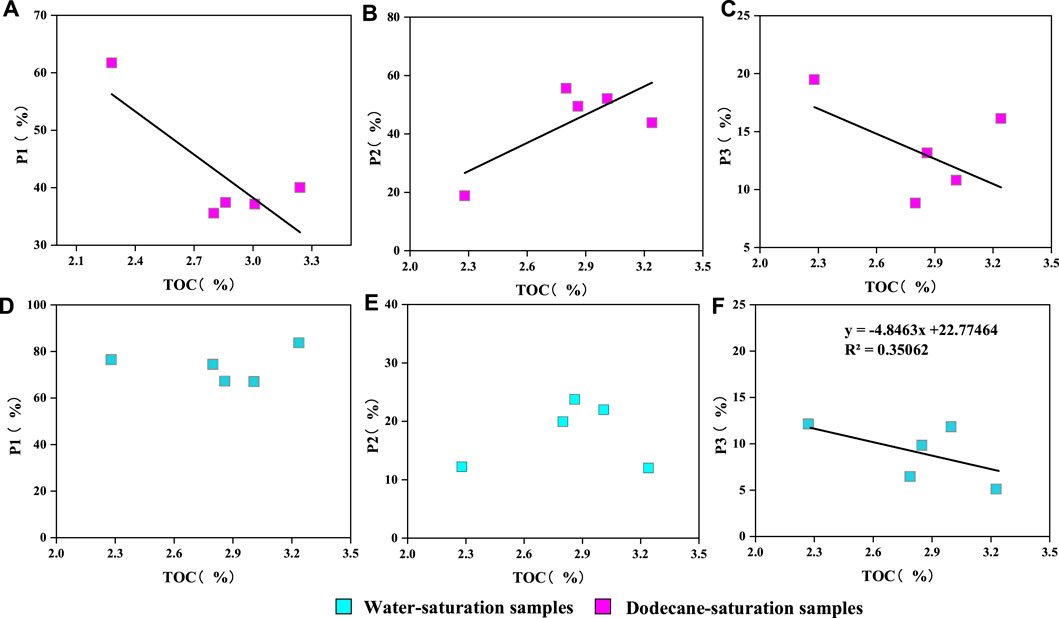
FIGURE 12. A relationship between TOC and proportion of three peaks for (A–C) dodecane-and (D–F) DIW-saturated samples.
To illustrate the influence of the mineralogical composition on wettability, the relationship between the areas of three peaks from NMR for DIW-saturated samples and its mineral composition was also studied (Figure 13). The area of P2 was plotted against the contents of calcite (Figure 13E), while the contents of quartz and clay were positively correlated (Figures 13B,H). The areas of P1 and P2 for dodecane-saturated samples have the same relationship with mineral compositions, which is negatively correlated with calcite (Figures 13A,G), but have a good correspondence with quartz and clay and P3 (representing fractures and macropores) (Figure 2K).
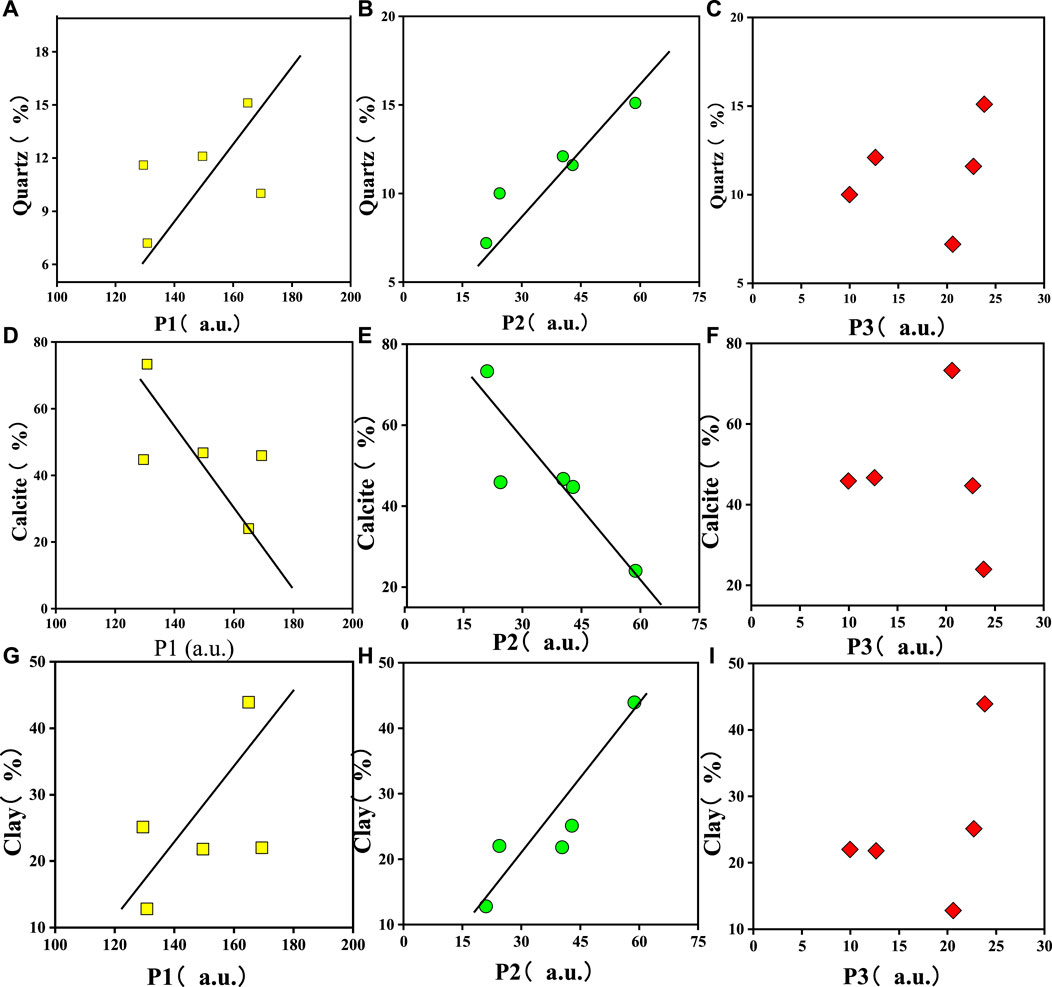
FIGURE 13. Relationship between mineral compositions of quartz (A)–(C), calcite (D)–(F) and clays (G)–(I) and areas of three peaks from NMR tests for dodecane-saturated samples.
For dodecane-saturated samples, P2 exhibits a positive linear relationship with the contents of quartz and clay and a negative linear relationship with calcite content (Figures 14B,E,H). P1 is negatively correlated with clay minerals (Figures 14B,E,H,K), while the area of P3 is independent of mineral composition. On the whole, P3 representing fractures and macropores has no obvious correlation with minerals. The P1 is mainly hydrophilic, which is mainly proportional to quartz and clay minerals and inversely proportional to calcite. While P2 is mainly lipophilic, and the relationship between P2 and mineral composition of dodecane- and water-saturated samples is consistent, which means that though quartz and clay minerals provide a storage space for the sample, these minerals have different contributions to the wettability of shale. An improved understanding about the wettability of different minerals will be one of our future research directions.
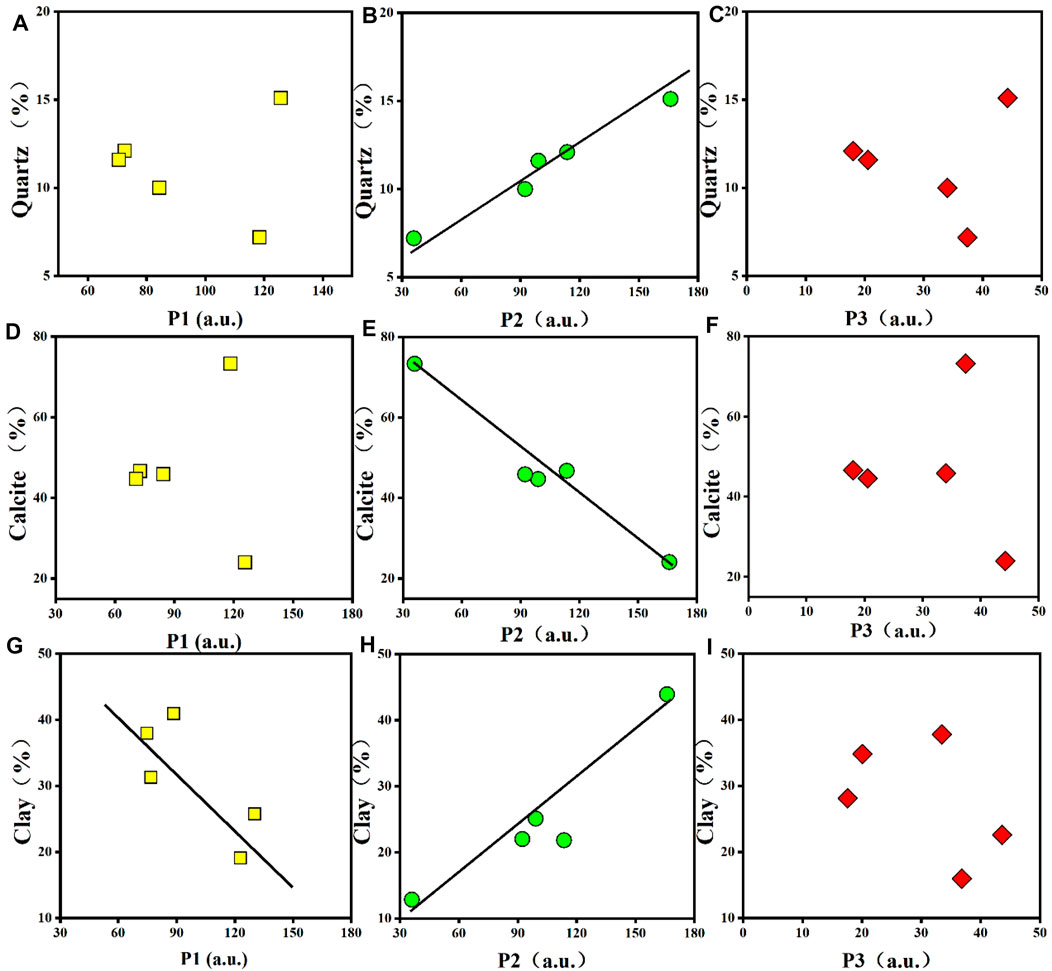
FIGURE 14. Relationship between mineral compositions and areas of three peaks for dodecane-saturated samples.
Conclusion
Six Shahejie shales with carbonate interlayers were illustrated to study the nano-pore structure by combined tests of N2, CO2, MIP, and wettability characteristics by the NMR method with T2 spectrum assisted with static saturation and dynamic imbibition approaches. The NMR T2 spectra of DIW- and dodecane-saturated samples clearly exhibit three-peak characteristics, showing that the internal wettability of the Shahejie samples is mainly divided into three regions: water-wet at 0.01–1 ms, oil-wet at 1–40 ms, and mixed-wet at >40 ms in the NMR T2 spectra.
NMR has been a powerful method for wettability characterization for shale oil reservoirs. More research is needed in order to increase the validity of the interpretations from this work, such as the influence of mineral and carbonate interlayers on pore structure as well as shale oil occurrence and flow. For samples with high organic matter contents and in mature windows, oil washing (as reported in Yang et al., 2021) before and after sample analyses is needed to obtain more accurate information of pore structure and fluid distribution among differently sized pores.
Data Availability Statement
The raw data supporting the conclusion of this article will be made available by the authors, without undue reservation.
Author Contributions
QH and NY designed experiments; XZ and MM carried out experiments; HL and YD analyzed experimental results; NY wrote the manuscript.
Funding
This work was funded by the National Natural Science Foundation of China (Grant No. 41830431) and the Shandong Provincial Major-Type Grant for Research and Development funded by the Department of Science and Technology of Shandong Province (Grant No. 2020ZLYS08).
Conflict of Interest
While authors HL and YD are employed by Shengli Oilfield Company of Sinopec, the remaining authors declare that the research was conducted in the absence of any commercial or financial relationships that could be construed as a potential conflict of interest.
Publisher’s Note
All claims expressed in this article are solely those of the authors and do not necessarily represent those of their affiliated organizations, or those of the publisher, the editors and the reviewers. Any product that may be evaluated in this article, or claim that may be made by its manufacturer, is not guaranteed or endorsed by the publisher.
References
Arif, M., Zhang, Y., and Iglauer, S. (2021). Shale Wettability: Data Sets, Challenges, and Outlook. Energy Fuels 35 (4), 2965–2980. doi:10.1021/acs.energyfuels.0c04120
Bai, C., Yu, B., Liu, H., Xie, Z., Han, S., Zhang, L., et al. (2018). The Genesis and Evolution of Carbonate Minerals in Shale Oil Formations from Dongying Depression, Bohai Bay Basin, China. Int. J. Coal Geology. 189, 8–26. doi:10.1016/j.coal.2018.02.008
Bertassoli, D. J., Sawakuchi, H. O., Almeida, N. S., Castanheira, B., Alem, V. A. T., Camargo, M. G. P., et al. (2016). Biogenic Methane and Carbon Dioxide Generation in Organic-Rich Shales from southeastern Brazil. Int. J. Coal Geology. 162, 1–13. doi:10.1016/j.coal.2016.05.013
Brunauer, S., Emmett, P. H., and Teller, E. (1938). Adsorption of Gases in Multimolecular Layers. J. Am. Chem. Soc. 60 (2), 309–319. doi:10.1021/ja01269a023
Chen, G., Lu, S., Zhang, J., Wang, M., Li, J., Xu, C., et al. (2017). Estimation of Enriched Shale Oil Resource Potential in E2s4L of Damintun Sag in Bohai Bay Basin, China. Energy Fuels 31, 3635–3642. doi:10.1021/acs.energyfuels.6b03201
Coates, G. R., Peveraro, P. C. A., Hardwick, A., and Roberts, D. (1991). “The Magnetic Resonance Imaging Log Characterized by Comparison with Petrophysical Properties and Laboratory Core Data,” in SPE Annual Technical Conference and Exhibition (Dallas, Texas: Society of Petroleum Engineers (SPE). October 6-9, 1991, SPE-22723-MS. doi:10.2118/22723-ms
Daigle, H., Thomas, B., Rowe, H., and Nieto, M. (2014). Nuclear Magnetic Resonance Characterization of Shallow marine Sediments from the Nankai Trough, Integrated Ocean Drilling Program Expedition 333. J. Geophys. Res. Solid Earth 119, 2631–2650. doi:10.1002/2013jb010784
Fleury, M., and Deflandre, F. (2003). Quantitative Evaluation of Porous media Wettability Using NMR Relaxometry. Magn. Reson. Imaging 21 (3–4), 385–387. doi:10.1016/s0730-725x(03)00145-0
Gregg, S. J., and Sing, K. S. W. (1982). Adsorption, Surface Area and Porosity. Manhattan, NY: Academic Press.
Hao, Y., Chen, F., Zhu, J., and Zhang, S. (2014). Reservoir Space of the Es 3 3 -Es 4 1 Shale in Dongying Sag. Int. J. Mining Sci. Techn. 24, 425–431. doi:10.1016/j.ijmst.2014.05.002
Hargrave, J. E., Hicks, M. K., and Scholz, C. A. (2014). Lacustrine carbonates from Lake Turkana, Kenya: A depositional model of carbonates in an extensional basin. Journal of Sedimentary Research 84, 224–237. doi:10.2110/jsr.2014.22
He, J., Ding, W., Jiang, Z., Jiu, K., Li, A., and Sun, Y. (2017). Mineralogical and chemical distribution of the Es3L oil shale in the Jiyang depression, Bohai Bay basin (E China): Implications for paleoenvironmental reconstruction and organic matter accumulation. Mar. Pet. Geology. 81, 196–219. doi:10.1016/j.marpetgeo.2017.01.007
Hu, Q. H., Liu, H. M., Li, M. W., Li, Z., Yang, R., Zhang, Y. X., et al. (2018). Wettability, Pore Connectivity and Fluid-Tracer Migration in Shale Oil Reservoirs of Paleogene Shahejie Formation in Dongying Sag of Bohai Bay Basin, East China. Acta Petrolei Sinica 39 (3), 278–289. (in Chinese with English abstract). doi:10.7623/syxb201803003
Hu, Q., Zhang, Y., Meng, X., Li, Z., Xie, Z., and Li, M. (2017). Characterization of Micro-nano Pore Networks in Shale Oil Reservoirs of Paleogene Shahejie Formation in Dongying Sag of Bohai Bay Basin, East China. Pet. Exploration Develop. 44 (5), 720–730. doi:10.1016/s1876-3804(17)30083-6
Jiang, C., Bryant, S., and Daigle, H. (2015). “A Bundle of Short Conduits Model of the Pore Structure of Gas Shale,” in Paper presented at the Unconventional Resources Technology Conference (San Antonio, TX: American Association of Petroleum Geologists (AAPG), 20–22. paper SPE 178656/URTeC2169349.
Jiu, K., Ding, W., Huang, W., Zhang, Y., Zhao, S., and Hu, L. (2013). Fractures of Lacustrine Shale Reservoirs, the Zhanhua Depression in the Bohai Bay Basin, Eastern China. Mar. Pet. Geology. 48, 113–123. doi:10.1016/j.marpetgeo.2013.08.009
Kang, Z., Zhou, L., Ren, S., Kong, J., and Chen, Y. (2015). Characteristics of Shale of the 7th Member of the Middle Jurassic Dameigou Formation in Northern Qaidam Basin. Earth Sci. Front. 22, 265–276. (In Chinese with English abstract). doi:10.13745/j.esf.2015.04.027
Korb, J.-P., Nicot, B., and Jolivet, I. (2018). Dynamics and Wettability of Petroleum Fluids in Shale Oil Probed by 2D T 1 -T 2 and Fast Field Cycling NMR Relaxation. Microporous Mesoporous Mater. 269, 7–11. doi:10.1016/j.micromeso.2017.05.055
Lai, J., Wang, G., Fan, Z., Zhou, Z., Chen, J., and Wang, S. (2018). Fractal Analysis of Tight Shaly Sandstones Using Nuclear Magnetic Resonance Measurements. AAPG Bull. 102 (2), 175–193. doi:10.1306/0425171609817007
Lastoskie, C., Gubbins, K. E., and Quirke, N. (1993). Pore Size Distribution Analysis of Microporous Carbons: A Density Functional Theory Approach. J. Phys. Chem. 97 (18), 4786–4796. doi:10.1021/j100120a035
Lerman, A., Imboden, D. M., Gat, J., and Chou, L. (1995). Physics and Chemistry of Lakes. Berlin, Germany: Springer-Verlag.
Li, J., Lu, J., and Li, Z. (2014). ‘Four-pore’ Modeling and its Quantitative Logging Description of Shale Gas Reservoir. Oil Gas Geol. 35 (2), 266–271. doi:10.11743/ogg20140214
Liu, B., Lü, Y., Meng, Y., Li, X., Guo, X., Ma, Q., et al. (2015). Petrologic Characteristics and Genetic Model of Lacustrine Lamellar fine-grained Rock and its Significance for Shale Oil Exploration: A Case Study of Permian Lucaogou Formation in Malang Sag, Santanghu Basin, NW China. Pet. Exploration Develop. 42, 656–666. doi:10.1016/s1876-3804(15)30060-4
Liu, J., and Sheng, J. J. (2019). Experimental Investigation of Surfactant Enhanced Spontaneous Imbibition in Chinese Shale Oil Reservoirs Using NMR Tests. J. Ind. Eng. Chem. 72, 414–422. doi:10.1016/j.jiec.2018.12.044
Liu, J., Sheng, J. J., Wang, X., Ge, H., and Yao, E. (2019). Experimental Study of Wettability Alteration and Spontaneous Imbibition in Chinese Shale Oil Reservoirs Using Anionic and Nonionic Surfactants. J. Pet. Sci. Eng. 175, 624–633. doi:10.1016/j.petrol.2019.01.003
Loucks, R. G., Reed, R. M., Ruppel, S. C., and Hammes, U. (2012). Spectrum of Pore Types and Networks in Mudrocks and a Descriptive Classification for Matrix-Related Mudrock Pores. Bulletin 96, 1071–1098. doi:10.1306/08171111061
Ma, B., Hu, Q., Yang, S., Qiao, H., Pu, X., and Han, W. (2022). An Improved Liquid-Liquid Extraction Technique to Determine Shale Wettability. Mar. Pet. Geology. 138, 105538. doi:10.1016/j.marpetgeo.2022.105538
Martínek, K., Blecha, M., Daněk, V., Franců, J., Hladíková, J., and Johnová, R. (2006). Record of Palaeoenvironmental Changes in a Lower Permian Organic-Rich Lacustrine Succession: Integrated Sedimentological and Geochemical Study of the Rudník Member, Krkonoše Piedmont Basin, Czech Republic. Palaeogeogr. Palaeoclimatol. Palaeoecol. 230 (1), 85–128. doi:10.1016/j.palaeo.2005.07.009
Mitchell, A. G., Hazell, L. B., and Webb, K. J. (1990). “Wettability Determination: Pore Surface Analysis,” in Presented in SPE Annual Technical Conference and Exhibition, SPE-20505-MS. Dallas, TX: SPE.
Odusina, E. O., Sondergeld, C. H., and Rai, C. S. (2011). “An NMR Study of Shale Wettability,” in Canadian Unconventional Resources Conference. SPE (Calgary, Alberta, Canada: SPE. SPE-147371-MS.
Pan, B., Clarkson, C. R., Debuhr, C., Younis, A., Song, C., Ghanizadeh, A., et al. (2021). Low-permeability Reservoir Sample Wettability Characterization at Multiple Scales: Pore-, Micro- and Macro-Contact Angles. J. Nat. Gas Sci. Eng. 95, 104229. doi:10.1016/j.jngse.2021.104229
Pan, B., Li, Y. J., Zhang, M. S., Wang, X. P., and Iglauer, S. (2020). Effect of Total Organic Carbon (TOC) Content on Shale Wettability at High Pressure and High Temperature Conditions. J. Petrol. Sci. Eng. 193, 104374. doi:10.1016/j.petrol.2020.107374
Rouquerol, J., AvnirFairbridgeEverett, D. C. W. D. H., Fairbridge, C. W., EverettSing, D. H. J. D. F., Haynes, J. M., Pernicone, N., et al. (1994). Recommendations for the Characterization of Porous Solids (Technical Report). Pure Appl. Chem. 66, 1739–1758. doi:10.1351/pac199466081739
Sing, K. S. (1985). Reporting Physisorption Data for Gas/solid Systems with Special Reference to the Determination of Surface Area and Porosity (Recommendations 1984). Pure Appl. Chem. 57, 603e619. doi:10.1351/pac198557040603
Singh, H. (2016). A Critical Review of Water Uptake by Shales. J. Nat. Gas Sci. Eng. 34, 751–766. doi:10.1016/j.jngse.2016.07.003
Sondergeld, C., Ambrose, R., Rai, C., and Moncrieff, J. (2010). “Micro-structural Studies of Gas Shales,” in Paper presented at SPE Unconventional Gas Conference (Pittsburgh, USA: SPE, 23–25. February, SPE 131771-MS. doi:10.2118/131771-ms
Song, G. Q., Xu, X. Y., and Li, Z. (2015). Factors Controlling Oil Production from Paleogene Shale in Jiyang Depression. Oil Gas Geol. 36 (3), 463–471. doi:10.11743/ogg20150315
Sulucarnain, I. D., Sondergeld, C. H., and Rai, C. S. (2012). “An NMR Study of Shale Wettability and Effective Surface Relaxivity,” in Paper presented at the SPE Canadian Unconventional Resources Conference (Calgary, Alberta, Canada: SPE. SPE162236-MS.
Sun, M., Yu, B., Hu, Q., Yang, R., Zhang, Y., Li, B., et al. (2018). Pore Structure Characterization of Organic-Rich Niutitang Shale from China: Small Angle Neutron Scattering (SANS) Study. Int. J. Coal Geology. 186, 115–125. doi:10.1016/j.coal.2017.12.006
Wang, G. M., Ren, Y. J., Zhong, J. H., Ma, Z., and Jiang, Z. (2005). Genetic Analysis on Lamellar Calcite Veins in Paleogene Black Shale of the Jiyang Depression. Acta Geol. Sinica 6, 834–838. doi:10.3321/j.issn:0001-5717.2005.06.012
Wang, K., and Li, N. (2008). Numerical Simulation of Rock Pore-Throat Structure Effects on NMR T2 Distribution. Appl. Geophys. 5 (2), 86–91. doi:10.1007/s11770-008-0011-9
Wang, M., Guan, Y., and Li, C. M. (2018). Qualitative Description and Full-Pore-Size Quantitative Evaluation of Pores in Lacustrine Shale Reservoir of Shahejie Formation, Jiyang Depression. Oil Gas Geol. 39 (6), 1107–1119. doi:10.11743/ogg.2018.06.02
Wang, M., Wilkins, R. W. T., Song, G., Zhang, L., Xu, X., Li, Z., et al. (2015). Geochemical and Geological Characteristics of the Es3L Lacustrine Shale in the Bonan Sag, Bohai Bay Basin, China. Int. J. Coal Geology. 138, 16–29. doi:10.1016/j.coal.2014.12.007
Wang, S., Javadpour, F., and Feng, Q. (2016). Confinement Correction to Mercury Intrusion Capillary Pressure of Shale Nanopores. Sci. Rep. 6, 20160. doi:10.1038/srep20160
Wang, Y. M., Dong, D. Z., Yang, H., He, L., Wang, S. Q., Huang, J. L., et al. (2014). Quantitative Characterization of Reservoir Space in the Lower Silurian Longmaxi Shale, Southern Sichuan, China. Sci. China Earth Sci. 44 (6), 1348–1356. doi:10.1007/s11430-013-4645-y
Wang, Y., Wang, X., Song, G., Liu, H., Zhu, D., Zhu, D., et al. (2016). Genetic Connection between Mud Shale Lithofacies and Shale Oil Enrichment in Jiyang Depression, Bohai Bay Basin. Petrol. Explor. Dev. 43, 696–704. doi:10.1016/s1876-3804(16)30091-x
Washburn, E. W. (1921). Note on a Method of Determining the Distribution of Pore Sizes in a Porous Material. Proc. Natl. Acad. Sci. 7, 115–116. doi:10.1073/pnas.7.4.115
Yang, R., Hao, F., He, S., He, C., Guo, X., Yi, J., et al. (2017). Experimental Investigations on the Geometry and Connectivity of Pore Space in Organic-Rich Wufeng and Longmaxi Shales. Mar. Pet. Geology. 84 (6), 225–242. doi:10.1016/j.marpetgeo.2017.03.033
Yang, S., QiaoChen, H. B., Cheng, B., and Hu, Q. (2021). Solvent Extraction Efficiency of an Eocene-Aged Organic-Rich Lacustrine Shale. Mar. Pet. Geology. 126, 104941. doi:10.1016/j.marpetgeo.2021.104941
Yao, Y., Liu, D., Che, Y., Tang, D., Tang, S., and Huang, W. (2010). Petrophysical Characterization of Coals by Low-Field Nuclear Magnetic Resonance (NMR). Fuel 89, 1371–1380. doi:10.1016/j.fuel.2009.11.005
Zhang, B. Y., Gomaa, A. M., Sun, H., Qu, Q., and Chen, J. H. (2014). “A Study of Shale Wettability Using NMR Measurements,” in Paper presented at International Symposium of the Society of Core Analysts (Avignon, France: Society of Core Analysts (SCA). SCA2014-015.
Zhang, P., Lu, S., Li, J., Zhang, J., Xue, H., and Chen, C. (2017). Comparisons of SEM, Low-Field NMR, and Mercury Intrusion Capillary Pressure in Characterization of the Pore Size Distribution of Lacustrine Shale: A Case Study on the Dongying Depression, Bohai Bay Basin, China. Energy Fuels 31 (9), 9232–9239. doi:10.1021/acs.energyfuels.7b01625
Zhang, S., Yan, J., Hu, Q., Wang, J., Tian, T., Chao, J., et al. (2019). Integrated NMR and FE-SEM Methods for Pore Structure Characterization of Shahejie Shale from the Dongying Depression, Bohai Bay Basin. Mar. Pet. Geology. 100, 85–94. doi:10.1016/j.marpetgeo.2018.11.003
Zhang, Y. X., Hu, Q. H., Barber, T. J., Bleuel, M. K., Anovitz, L., and Littrell, K. (2020). Quantifying Fluid-Wettable Effective Pore Space in the Utica and Bakken Oil Shale Formations. Geophy. Res. Lett. 47, e2020GL087896. doi:10.1029/2020gl087896
Zhao, J., Jin, Z., Hu, Q., Jin, Z., Barber, T. J., Zhang, Y., et al. (2017). Integrating SANS and Fluid-Invasion Methods to Characterize Pore Structure of Typical American Shale Oil Reservoirs. Sci. Rep. 7, 15413. doi:10.1038/s41598-017-15362-0
Zhou, X., Liu, X. J., and Liu, L. X. (2020). Study on Shale Wettability and Influencing Factors. Resour. Environ. 46 (1), 241–242.
Keywords: pore structure, wettability, shale, carbonate interlayers, Dongying depression
Citation: Yin N, Hu QH, Liu HM, Du YS, Zhu XC and Meng MM (2022) Pore Structure and Wettability of Lacustrine Shale With Carbonate Interlayers in Dongying Depression, Bohai Bay Basin, East China. Front. Earth Sci. 10:834640. doi: 10.3389/feart.2022.834640
Received: 13 December 2021; Accepted: 08 February 2022;
Published: 30 March 2022.
Edited by:
Feng Yang, China University of Geosciences Wuhan, ChinaReviewed by:
Bin Pan, University of Science and Technology Beijing, ChinaYihuai Zhang, Imperial College London, United Kingdom
Copyright © 2022 Yin, Hu, Liu, Du, Zhu and Meng. This is an open-access article distributed under the terms of the Creative Commons Attribution License (CC BY). The use, distribution or reproduction in other forums is permitted, provided the original author(s) and the copyright owner(s) are credited and that the original publication in this journal is cited, in accordance with accepted academic practice. No use, distribution or reproduction is permitted which does not comply with these terms.
*Correspondence: Q. H. Hu, bWF4aHVAdXRhLmVkdQ==