 Haoxin Yao
 Liang Zhao
 Xinyong Shen
 Ziniu Xiao
 Qingquan Li
95% of researchers rate our articles as excellent or good
Learn more about the work of our research integrity team to safeguard the quality of each article we publish.
Find out more
ORIGINAL RESEARCH article
Front. Earth Sci. , 07 March 2022
Sec. Atmospheric Science
Volume 10 - 2022 | https://doi.org/10.3389/feart.2022.834284
This article is part of the Research Topic Changes in Snow, Monsoon and Snow-Monsoon Relationship in the Warming Climate View all 12 articles
With global warming, the probability of summer compound hot and dry extreme (CHDE) days, which are higher risk compared with single-factor extreme events, increases in some regions. However, there have been few studies on the winter precursor signals of such events. In this study, we found that summer CHDEs have generally increased in the last 20 years, with the increases in the middle and lower reaches of the Yangtze River region and Southwest China being more than double those in other regions of China. The dominant mode of summer CHDEs in China is characterized by more hot–dry days in the Yangtze–Huaihe River Basin (YHRB). Importantly, we found that there is an obvious cross-seasonal relationship between the first mode of winter snow cover in the Northern Hemisphere (NH) and summer CHDEs in China. When the mode of winter snow cover in the NH is in a positive phase with a negative-phase Arctic Oscillation (AO), i.e., more snow cover in Europe, Northeast China, and the northern United States, and less snow cover in central Asia and the midlatitudes in winter, more CHDEs in China in the following summer. Compared with the signals from the AO, these signals from winter snow can be better stored and transmitted into summer through the snow, soil and ocean, inducing a northward shift of the upper-level westerly jet and strengthening of South Asia high. Through the strong dynamic forcing of negative vorticity advection with the change of westerly jet, the subsidence movement in the western Pacific subtropical high (WPSH) region is strengthened, resulting in the stable maintenance of the WPSH in the YHRB. Under the synergy of a remote mid- and high-latitude wave train in summer, which also relates closely to winter snow cover, more CHDEs ultimately occur in the YHRB of China.
According to the sixth Assessment Report of the Intergovernmental Panel on Climate Change (IPCC, 2021), the global average temperature in the past 10 years was about 1.1°C higher than that in 1850–1900, and this will result in a general increase in heat waves and an extension of the warm season. It has also been reported that drought will be more severe in some areas in the future, such as East Asia, Western North America, Western and Central Europe and so on (Leonard et al., 2014; Chen et al., 2018; Sippel et al., 2018; Ribeiro et al., 2020). This means that the probability of multivariate compound extreme events is likely to increase. However, single-variable analyses often underestimate the combined effects of multi-variable anomalies, and compound extreme events have become a major challenge for human beings today and in the future (Dosio et al., 2018; Rasmijn et al., 2018). Compound hot and dry extremes (CHDEs) in summer are becoming more frequent under enhanced greenhouse gas forcing at the global scale, and this trend will continue with higher global warming (IPCC, 2021). The increasingly frequent occurrence of CHDEs not only brings great pressure to transportation, urban water supply, and power supply, but also affects people’s daily lives and the safety of property. Therefore, it is not only of scientific significance to study the changes in CHDEs and their early signals, but it also helps to provide a reference for meteorological departments to improve the accuracy of predictions.
Many research results have shown that the occurrence of CHDEs in summer is often associated with local land–atmosphere feedback or remote wave activity/warm advection occurring simultaneously (Haarsma et al., 2015; Duchez et al., 2016; Miralles et al., 2019; Geirinhas et al., 2021). On the one hand, local or regional anticyclonic high-pressure anomalies at mid and upper troposphere have an important influence on the occurrence of CHDEs in summer (e.g., You et al., 2011; Tian et al., 2021). A strengthening and westward extension of the WPSH is conducive to the occurrence of extreme high-temperature weather in summer in southern China (Choi and Kim, 2019). Mid–high-latitude blocking highs associated with previous deceleration of the Atlantic Meridional Overturning Circulation and cold sea temperatures in the Atlantic Ocean have also been pointed out in favor of persistent hot–dry extremes (Haarsma et al., 2015; Duchez et al., 2016). A recent growth in long-lived heatwaves in China was reported because of the joint influence of the South Asia high and the WPSH (Li et al., 2021). On the other hand, remote anomalies of coupled ocean–land–atmosphere systems in distant areas also play an important role. The effects of ENSO, polar vortex, the westerly jets and cross-equatorial flow on hotter and drier summers cannot be ignored (Coumou et al., 2018; Hao et al., 2018; Ting et al., 2018; Lim et al., 2019). Hao et al. (2018) used the results of a logistic regression model to show that El Niño–Southern Oscillation (ENSO) played an important role in the occurrence of CHDEs in the warm season in northern South America, southern Africa, Southeast Asia, and Australia. Lim et al. (2019) found that the promotion of hot and dry extremes in Australia resulted from the downward coupling of a weakened polar vortex to tropospheric levels, where it linked with the low-index polarity of the Southern Annular Mode, an equatorward shift of the midlatitude westerly jet stream, and subsidence and warming in the subtropics. Ting et al. (2018) indicated the possible role of cross-equatorial flows in an extreme high-temperature event in southern China in 2016.
However, there have been few studies on the cross-seasonal precursor signals of compound extreme events. Snow cover and atmosphere–ocean coupled factors are known to possess long persistence and “memory”, and therefore have the potential to be used as the source of predictability of extremes (Saito et al., 2004; Wu et al., 2016; Zhao et al., 2016). Snow can affect both atmospheric temperature and soil moisture, thereby potentially relating to subsequent compound anomaly events of temperature and moisture. Anomalies of soil moisture are often able to last for a long period and induce changes of the thermal condition on the land surface, which causes the lagged responses of the atmosphere. Betts et al. (1994) considered that locally large soil moisture increased the surface latent heat flux, which was beneficial to the occurrence of convective precipitation in summer. Through evapotranspiration, soil moisture can significantly affect surface air temperature and precipitation locally and cause transports of dry or wet air from other regions (Douville, 2002; Seneviratne et al., 2010). Over East Asia, some studies reported that wet spring soil in the Yangtze–Huaihe River Basin (YHRB) can lead to a decrease in summer rainfall in eastern China (e.g., Zhang and Zuo 2011; Meng et al., 2014; Liu et al., 2017a,b). Notable is, anomalies of spring and summer soil moisture could be induced by previous anomalies of snow or snowmelt in winter and spring (Vinnikov and Yeserkepova, 1991; Entin et al., 2000; Zhu and Ding, 2009; Lu et al., 2020), denoting that the signals of snow cover may be earlier. Winter snow cover over the Eurasian continent can not only affect the atmospheric circulation over the Eurasian continent (Saito et al., 2004; Matsumura and Yamazaki, 2012; Halder and Dirmeyer, 2016), but can also cause changes in summer precipitation and temperature over the mid and high latitudes of Eurasian continent (Prabhu et al., 2017; Wang et al., 2019).
Some key regions with a large variability of snow could have impacts on climate in the following seasons. For example, more snow cover over Eurasia in winter or spring leads to a delayed increase in surface temperature in spring, resulting in increased soil moisture in spring and summer (Wu and Kirtman, 2007; Halder and Dirmeyer, 2016; Wang et al., 2019). More Siberian snow cover in autumn increase the probability of a strong Siberian high-pressure ridge and upward atmospheric wave energy flux, resulting in large rises in polar geopotential heights, often followed by severe winter weather (Cohen et al., 2020). Snow cover in northern China and southern Mongolia was pointed out to be a bridge between East Asian winter and summer monsoons, impacting on a decrease in summer rainfall in the subtropical China (Lu et al., 2020). Snow cover and soil moisture anomalies in the Tibetan Plateau (TP) region in winter and spring can affect summertime drought and flooding in the East Asia, even remote regions, by regulating local thermal characteristics, hydrological processes and teleconnection response, thereby regulating the upstream and downstream atmospheric circulation (Chow, et al., 2008; Wu et al., 2016; Qian et al., 2019; Liu et al., 2020). However, if we focus only on one region without considering the synergy between multiple regions, it may lead to inconsistent results. Some studies found that the snow mode with the spatially synchronous changes and reverse changes in different regions could have longer persistent influences than variations of continent-wide or one-region snow cover (e.g., Yim et al., 2010; Zhao et al., 2016). Therefore, the objective of this paper is to comprehensively consider the snow cover in Eurasia and TP, and even the changes of snow cover in the whole northern hemisphere, and to detect whether it has a regular impact on precipitation in China.
Although these studies have found that pre-seasonal signals such as snow cover have important effects on or links with summertime climate anomalies in East Asia, in terms of summer CHDEs in China, the snow signal in the preceding winter has rarely been studied. Accordingly, the objective of the present study was to evaluate the possible relationship between summer CHDEs and preceding-winter snow cover on the interannual timescale. The motivation behind this objective was to help better understand and predict CHDE events.
We used the fifth major global reanalysis (ERA5) produced by the European Centre for Medium-Range Weather Forecasts (https://apps.ecmwf.int/datasets), including snow cover, geopotential height, wind speed, soil moisture, surface temperature, and relative humidity, with a resolution of 1° × 1° from 1981 to 2020 (Hersbach et al., 2020). Daily air temperature and relative humidity data were used to calculated CHDEs and then monthly CHDEs were obtained. Other variables are monthly data. According to the monthly average data, the seasonal average of each meteorological factor was obtained. The monthly index of the Arctic Oscillation (AO) provided by the Climate Prediction Center of the National Oceanic and Atmospheric Administration of the United States was also employed (https://www.cpc.ncep.noaa.gov/products/precip/CWlink/daily_ao_index/ao.shtml).
First, to determine the threshold criterias. The air temperature/relative humidity of the 75th/25th percentile (from small to large) was used as threadholds (Wu et al., 2019). Second, to determine the thresholds for climatological 92 days (from 1 June to 31 August). Samples for calculating threshold.
On one day were 600 days (15 × 40; 40 is number of years; 15 is the sampling window (15 days), corresponding to 7 days on either side of the target date) (Perkins and Alexander, 2013; Deng et al., 2019). By moving the 15-days sampling window forward or backward, we can get consecutive thresholds for climatological 92 days. Third, to calculate CHDEs. The grid was then marked as 1 when the temperature was above the 75% threshold and the relative humidity was below the 25% threshold on one day, which was defined a CHDE day. Finally, it was extended to all grids in China.
Wave activity flux (WAF), proposed by Takaya and Nakamura (1997), was used to indicate the propagation of stationary Rossby waves. The horizontal components of WAF were defined as follows:
where
There are many calculation methods for the monsoon index. Here, the East Asian Winter Monsoon (EAWM) proposed by Shi et al. (1996) is selected, which is defined as the sum of the zonal standardized sea level pressure difference between 110°E and 160°E in 20°–50°N, and the obtained sequence is standardized again. The East Asian summer Monsoon index (EASM) is defined as the differences of 850-hPa zonal wind between the tropical monsoon trough region (10°–20°N and 100°–150°E) and the East Asian subtropical monsoon region (25°–35°N and 100°–150°E) (Zhang et al., 2003). For specific data, please see Supplementary Figure S1.
We performed an empirical orthogonal function (EOF) analysis on the summer CHDEs in China and winter snow cover in the Northern Hemisphere (NH) to derive the spatiotemporal variability. Prior to the analysis, 9-years Lanczos high-pass filter is used to remove the low-frequency interdecadal oscillation and leave the annual oscillation signa. The filtered summer CHDEs, winter snow cover, geopotential height are also used for subsequent correlation analysis. After 9-years Lanczos high-pass filter, the effective degrees-of-freedom of the sample becomes 20 (Pyper and Peterman, 1998). In addition, linear correlation and regression analyses were used to detect the statistical connections between variables. The significance of all the analyses was determined by the standard two-tailed Student’s t-test.
The occurrence of CHDE events requires the temperature and humidity to have a certain degree of opposite change in summer. Figure 1A shows the climatology (average from 1981 to 2020) of humidity and temperature in summer in China. It can be seen that, except over the TP, the temperature in summer is mostly above 18°C. Especially in Northwest, East, and South China, the temperature range is 26–32°C. The highest temperature appears in the Tarim Basin of Xinjiang and Guangdong Province. In summer, the high-value area of humidity in China is in the area south of 35°N, showing a spatial distribution pattern of wet in the south and dry in the north. The highest value of humidity appears in Guangdong Province, which exceeds 93%. Notably, the humidity in Xinjiang Province is very low and the temperature is high, that is, dry and high temperature tend to be coupled, which may be related to the semi-arid and desert climate in this region.
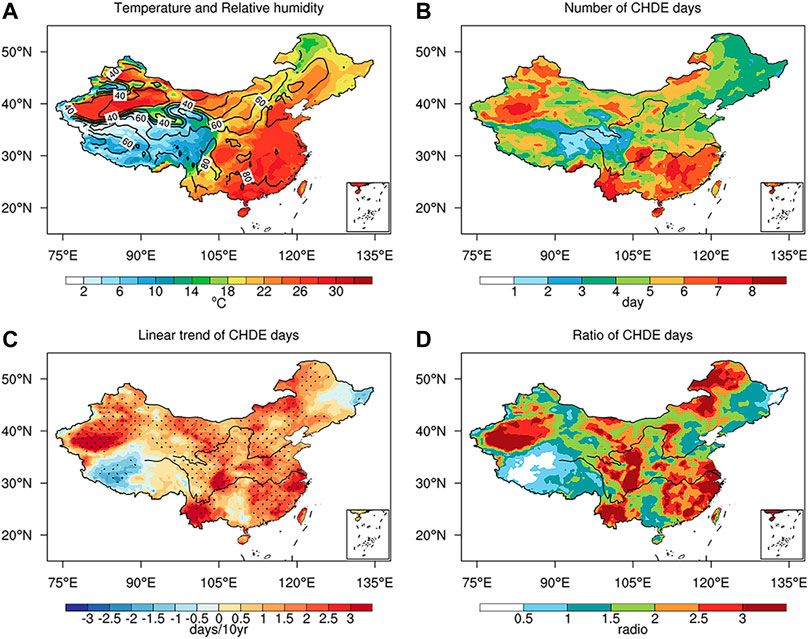
FIGURE 1. (A) Climatology of average daily temperature (unit: °C) and humidity (unit: %) in summer (June to August) in China from 1981 to 2020. (B) Number (unit: day), (C) linear trend (unit: day/10 years), and (D) ratio (latter 20 years compared to previous 20 years) of summer CHDE days. Dotted areas in (C) indicate that the linear trend of CHDEs in these regions exceeds the 95% confidence level.
Figure 1B shows the summer CHDEs calculated according to the threshold of the 75th percentile of temperature (from small to large) and 25th percentile of humidity (from small to large). Most CHDEs occur in South and Northwest China. This distribution is similar to the temperature field in summer, but it is quite different from the distribution of the humidity field (Figure 1A). This means that the frequency of summer CHDEs has a significant positive correlation with the temperature background, but the relationship with the humidity background is more complex. Because of the warm and dry conditions tend to be easily coupled in Northwest China, CHDEs therefore occur frequently. However, Southeast China is also a high-incidence CHDE area, but has a warm and humid background. This suggests that CHDEs in this area based on the percentile thresholds are not caused by the climatological seasonal-mean humidity background field, but instead are related to the subseasonal variation and the coupling between heat and drought.
Figure 1C shows the linear trends of summer CHDEs. In the past 40 years, except over the western TP, the number of CHDEs in most regions of China generally shows an upward trend. The maximum trend of CHDEs exceeds 3 days/10 years, implying a dramatic increase in frequency of CHDE days. The most obvious upward CHDE trend is in South China, Northwest China, and the YHRB. Compared with Figure 1B, there is an obvious increasing trend of CHDEs in North China and the YHRB, but they are not areas with high frequency, which is deserving of close attention. Moreover, the spatial pattern of the trend in the TP region is opposite to the multi-year average state of CHDEs (fewer in the east and more in the west; Figure 1B). It is worth noting that the eastern TP is the birthplace of many important rivers, and the frequency of CHDEs is increasing, which is worthy of high vigilance. Besides, a significant decrease of CHDEs in the western TP is noted, although it needs to be further confirmed due to less observations there, which is consistent with some studies (e.g., Zhang et al., 2017; Sun et al., 2020).
Figure 1D shows the ratio of CHDEs in the last 20 years (2001–2020) to the first 20 years (1981–2000). It can be clearly seen that in many regions of China, the number of CHDE events in the latter 20 years (2001–2020) has more than doubled compared with the previous 20 years (1981–2000). Also, their distribution is similar to that in Figure 1C, indicating that the positive long-term linear trend of CHDEs is mainly due to the interdecadal growth of CHDEs after 2000.
The distribution and evolution of occurrence days of CHDEs per decade are shown in Figure 2. From the results it was found that before the 21st century there were very few CHDEs in summer, most of which were less than 5 days, and the large-value area was mainly concentrated in the western TP. After the turn of the 21st century, however, CHDEs increased rapidly in North and South China. Then, in the most recent 10 years, high incidence of CHDEs is mainly apparent in the YHRB, southwestern China and Xinjiang Province. Furthermore, it is clear that CHDEs in summer during the last decade can last for more than 12 days, which is more than double that in the 1980s.
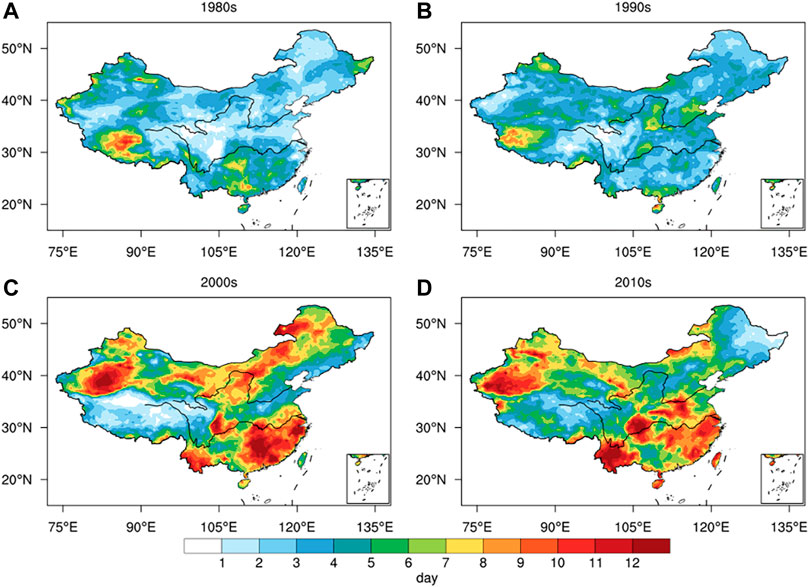
FIGURE 2. The day numbers of summer CHDEs in the (A) 1980s, (B) 1990s, (C) 2000s, and (D) 2010s (units: day).
Next, we investigated the dominant EOF modes of summer CHDEs (after detrending) in China to better understand the spatial and temporal characteristics. As is shown in Supplementary Figure S2, the first EOF mode (EOF1) of summer CHDEs in China is very similar to the linear trends (Figure 1C); both show an increasing trend, and the first principal component (PC1) possesses clear characteristics of decadal change, indicating that this mode is likely to reflect the influence of the global warming signal, 9-years high-pass Lanczos filter (Duchon 1979) was applied to all original variables before analyses, to avoid the potential contamination of interannual relationships by decadal signals. Accordingly, we calculated the ratio of variance of CHDEs after 9-years high-pass filter to the variance of the original data (see Supplementary Figure S3), the result of which was generally more than 80% in most regions of China. That is, the data after 9-years high-pass filter retained most of the signals, especially those on the interannual scale. However, its driving factors and precursor signals were unclear. Therefore, we next investigated the dominant mode of the detrended CHDEs and their factors of influence.
The EOF1 and PC1 of summer CHDEs in China are shown in Figures 3A, C, respectively, accounting for 13.8% of the total variance, which is statistically distinguishable from the remaining higher modes according to the rule of North et al. (1982). This mode shows that the YHRB (the black box in Figure 3A, 110°E ∼ 122°E, 28°N ∼ 34°N) in China is a large positive-phase region, while the western TP and southern South China are primary negative-phase regions. The distributional characteristics are somewhat different from those of the CHDE trend (Figure 1C). For example, the anomalies in Yunnan Province and South China are opposite to those in the Yangtze River Basin, which also suggests that the driving factor affecting the mode may not be global warming.
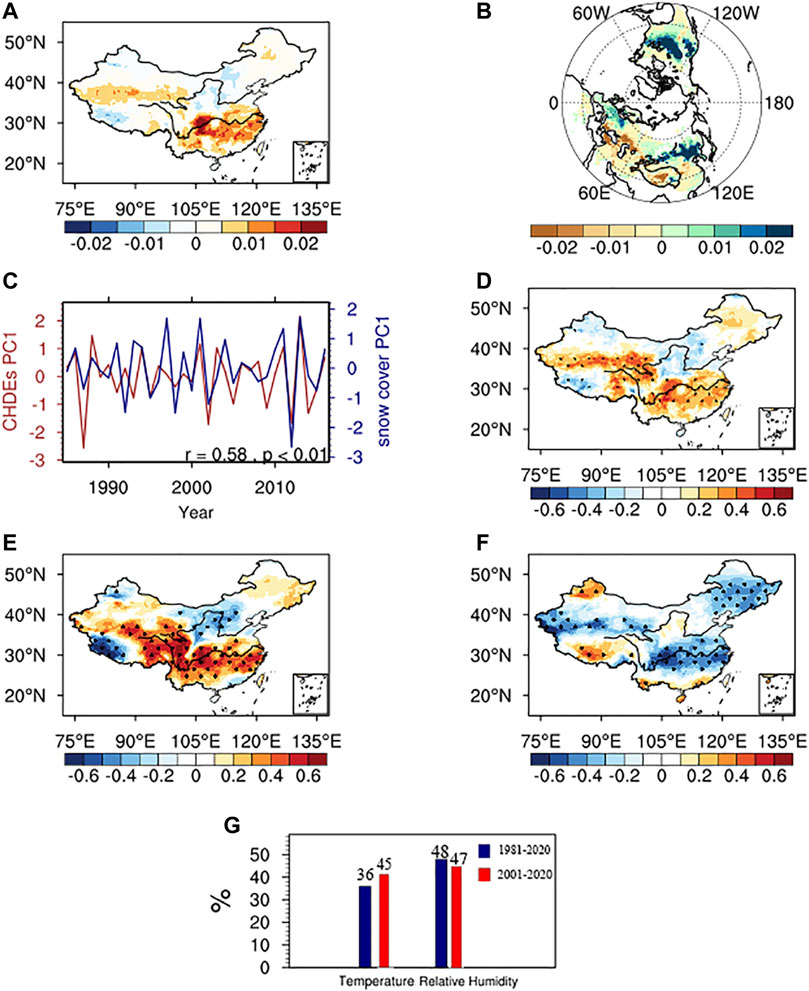
FIGURE 3. (A) The EOF1 of summer CHDEs in China during 1981–2020. (B) The EOF1 of winter snow cover in the NH during 1981–2020. (C) The PC1 of summer CHDEs (red line) and winter snow cover (blue line) in the NH. (D) Correlation coefficients between the PC1 of winter snow cover and summer CHDEs. Black dots indicate values significant at the 95% confidence level. Correlation maps between the PC1 of CHDEs and (E) temperature and (F) humidity fields during 1981–2020. (G) Contribution ratios of temperature and humidity to the CHDEs in the YHRB during 1981–2020 and during 2001–2020 based on a regression of area-averaged variable over the YHRB (marked by a box in A) against the PC1 of CHDEs.
Given that winter snow possesses signal memory, it is one of the key land surface processes affecting climate anomalies (Vinnikov and Yeserkepova, 1991; Entin et al., 2000), and therefore has certain influence on the land surface conditions and atmospheric circulations in spring and summer (Zhao et al., 2016). Whether winter snow cover in the NH is related to summer CHDEs in China—that is, whether the precursor signal can be found in the winter snow cover—is our main concern. Therefore, we performed an EOF analysis to extract the dominant mode of winter snow cover in the NH (after detrending) and examined the possible relationships with following-summer CHDEs in China. The first EOF mode of winter NH snow cover explains 14.7% of the total variance (EOF1, Figure 3B), and its spatial distribution shows that when there is more snow cover in Europe, Northeast China, and North America, there is less snow cover in central Asia and the midlatitudes (including the TP region). The EOF1 of NH snow cover is very similar to that in Zhao et al. (2016), who believed that mode may be closely related to the AO anomaly, and its signal may have seasonal transmission. The PC1 of NH snow cover (Figure 3C) shows that the typical positive-phase years (greater than one standard deviations) are 1997, 2001, 2011, and 2013, often with dry summers in China; and the typical negative-phase years (less than 1 standard deviations) are 1992, 1998, 2002 and 2012, often with wet summers in China (Supplementary Figure S4).
Importantly, the two PC1s of 1snow and CHDEs bear some similarity. It was found that the NH snow cover could explain a significant fraction of the CHDE variance (r = 0.58, p < 0.01; Figure 3C) during the period 1981–2020. Statistically, in years with positive-phase winter snow cover in the NH, the YHRB is prone to CHDEs in summer. The cross-seasonal correlation coefficient between them can reach a high level of significance, indicating that the influence of the first mode of the winter NH snow cover on summer CHDEs is worth noting and studying.
Figure 3D shows the spatial distribution of the correlation coefficient between the PC1 of winter NH snow cover and summer CHDEs, which is similar to the CHDE EOF1 pattern in Figure 3A. The spatial correlation coefficient of Figures 3A,D is 0.93, and they are both high values in the Yangtze River Basin and southern Xinjiang Province. This also suggests that the first mode of summer CHDEs in China is related to the first mode of winter NH snow cover.
We further studied contribution of higher temperature and lower humidity to more summer CHDEs in the YHRB, respectively, in the last 20 years Figures 3E,F show that correlation maps between the PC1 of CHDEs and temperature and humidity fields and Figure 3G is contribution ratios of temperature and humidity to the CHDEs in the YHRB. High correlations in the YHRB region for both temperature and humidity implying the first mode of CHDEs is related to both high temperature and low humidity in the YHRB. For the whole 40 years, temperature/humidity contributed 36%/48% to variation in the PC1 of CHDEs. However, For the last 20 years, temperature/humidity contributed 45%/47% to variation in the PC1 of CHDEs. Contribution from temperature has increased by 9%.
Mechanisms of the relationship between the two dominant modes of winter NH snow cover and summer CHDEs in China.
In order to analyze the mechanism of the relationship between the two dominant modes of winter snow cover and summer CHDEs, we verified whether the winter atmospheric circulation pattern associated with the PC1 of winter snow cover is similar to that of the PC1 of summer CHDEs. Figures 4A,B show the relationships between winter 500-hPa geopotential height (shade) and wind (vector), and the PC1s of winter NH snow cover and summer CHDEs, respectively. When the PC1 of winter NH snow cover is positive, there is a large area of high negative anomalies in Europe, northeastern China, and northeastern America, while positive anomalies exist in the Arctic, Central Asia, and the TP (Figure 4A), which are the characteristics of a negative AO. During a strong negative AO, there is a weak polar vortex over the Arctic region and a strong East Asian trough, denoting frequent cold-air activity. However, there is less snow and higher temperatures over Central Asia and the TP region because of the anomalous high-pressure system (Figures 4C,D). The correlation coefficient (R) between the PC1 of winter NH snow cover and the AO/East Asian summer monsoon is −0.42 (p < 0.01)/0.40 (p < 0.01). The correlation coefficient between the PC1 of summer CHDEs and the AO/East Asian summer monsoon is −0.65 (p < 0.01)/0.39 (p < 0.01) (Table 1). Therefore, the EOF1 of winter NH snow cover and summer CHDEs are both closely related to the AO and the EAWM. Moreover, the distribution in Figure 4B is consistent to that in Figure 4A (the spatial correlation coefficient of Figures 4A,B is 0.88), indicating that the atmospheric circulation in the preceding winter affecting the EOF1 of summer CHDEs is highly consistent with the atmospheric circulation corresponding to the EOF1 of winter NH snow cover, which are both related to the AO and EAWM.
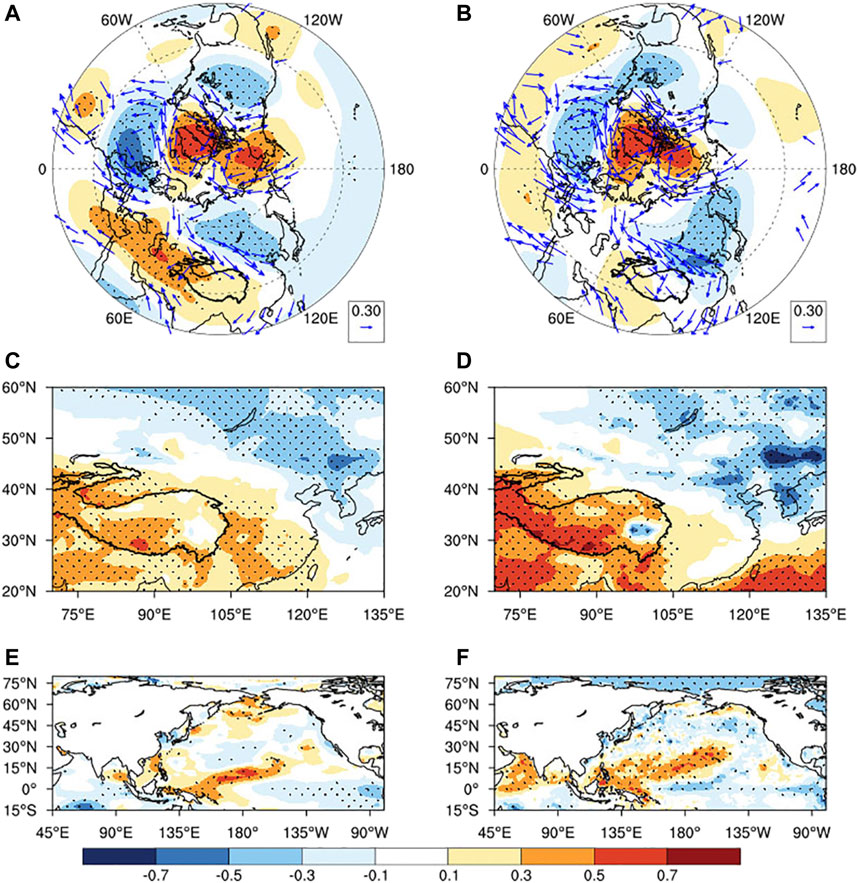
FIGURE 4. (A,C) Correlation coefficients between the PC1 of snow cover and (A) 500-hPa geopotential height (shade) and 500-hPa wind (vector), (C) land surface temperature in winter (B,D). As in (A,C) but for the PC1 of summer CHDEs. Black dots indicate values significant at the 95% confidence level. A positive correlation for zonal or meridional wind component is denoted by an eastward or poleward arrow, respectively.
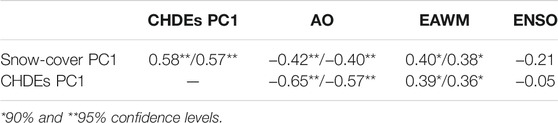
TABLE 1. Correlation coefficients between the PC1s of winter snow cover, summer CHDEs and the AO, EAWM, and ENSO (Niño3.4) indices in winter for 1981–2020. After/represents the correlation coefficient after removing ENSO.
Besides, the correlation coefficient between the PC1s with ENSO is not significant. And after removing ENSO, we recalculated the correlation coefficients and found that they were still significantly indigenous (Table 1). Therefore, we believe that the relationship between snow cover and AO/EAWM at the interannual scale is likely not modulated by ENSO. Therefore, in the preceding winter of more summer CHDEs in China, the atmospheric circulation is mainly characterized by a negative AO. The land surface is mainly characterized by more snow cover in Europe and northern East Asia but less snow cover on the TP.
If winter snow cover can affect the summer climate, it is bound to store and transmit signals in spring. Figures 5A,B show dry (wet) soil in the YHRB (northeastern China) in spring, which may be related to the lack (abundant) of snowfall and rainfall in winter as in Figure 3B. The dry soil in the YHRB causes a decrease in evaporation and latent heat (Figures 5C,D), which can promote rising of land surface temperature in spring and higher temperature (Figures 5E,F). The wet soil in northeastern China causes an increase in latent heat (Figures 5C,D) and delays rising of surface temperature due to cooling effect of the latent heat and evaporation, inducing a lower temperature (Figures 5E,F). In addition, weakening of the cold-source effect in winter and strengthening of the thermal effect (higher surface temperature) in the spring and summer in the TP are likely related to less snow in winter (Goswami et al., 2006; Feng and Hu, 2008; Ding et al., 2009; Shen et al., 2011). These temperature distribution characteristics lead to an intensification of meridional temperature gradient with cold north China and warm south China in spring, which can strengthen the westerlies. This will cause an anticyclonic anomaly and descending motion in the south side of jet axis, further leading to more dry soil. This is a positive feedback effect resulting in gradual amplification in the domain of influence. Obviously, spring soil could store signals of preceding-winter snow cover, which can enhance thermal contrast between land and ocean and change temperature gradient, further affecting the summer atmospheric circulations, e.g., the summer monsoon and subtropical highs (Yim et al., 2010; Lu et al., 2020).
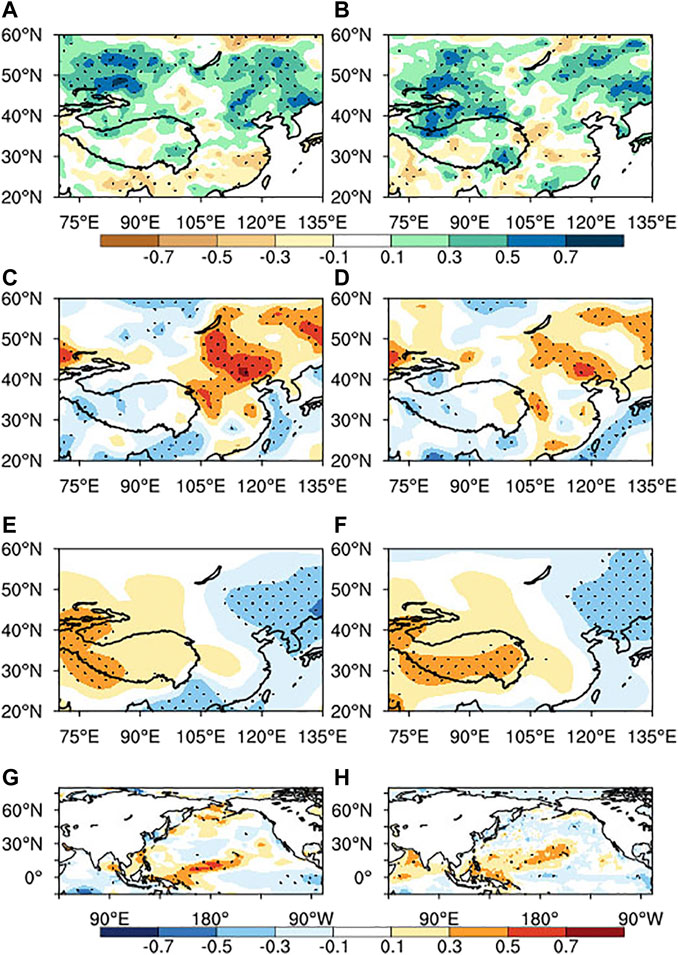
FIGURE 5. (A,C,E) Correlation coefficients between the PC1 of winter NH snow cover and spring (A) soil moisture, (C) latent heat flux and (E) land surface temperature. (B,D,F) As in (A,C,E) but for the PC1 of summer CHDEs. Black dots indicate values significant at the 95% confidence level.
Sincethe eastern part of China is a monsoon region, the EASM is an important factor affecting severe drought and flood disasters in the YHRB of China. When a strong EASM occurs, the tropical monsoon trough is usually strong but the subtropical mei-yu front is weaker and the WPSH is positioned more to the north, resulting in less monsoon precipitation in the YHRB region of China (Zhang et al., 2003). In this case, CHDE events occur easily in the YHRB, which can be statistically verified (Table 2), and the EASM and CHDEs are highly correlated (r = 0.38). Moreover, there is also a significant positive correlation between the EASM and the PC1 of winter NH snow cover (r = 0.36). This suggests that the winter NH snow cover can affect the intensity of the EASM, which is likely related to the previous sea–land thermal contrast and cross-seasonal transmission of the snow signal in soil from winter to summer.
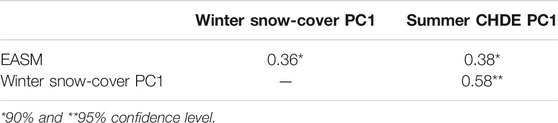
TABLE 2. Correlation coefficients between the EASM index and the PC1s of winter snow cover and summer CHDEs for 1981–2020.
Enhanced land heating due to reductions in snow cover can result in a subsequent anomalously high ridge in the mid–high latitudes (Matsumura and Yamazaki, 2012), causing persistent subsidence and warming. Because the dry (wet) soil leads to stronger (weaker) heating, and the atmospheric temperature rises (decreases). Then an increase of meridional temperature gradient leads to the enhancement of westerly jet, which can cause anticyclonic shear and high-pressure development on the south side of jet axis (Figure 6). Soil moisture in the YHRB around 30°N continued to be dry from spring to summer (Figures 6A,B). In summer, the range of warm and dry areas was further expanded (Figure 6), due to the dry–hot positive feedback effect between land and atmosphere and the thermal difference between sea and land. Due to the enhancement of plateau heat source in spring and the decrease of surface cooling and tropospheric thickness in Northeast China (Figures 5E, F), the upper westerly jet will move northward and strengthen (Figures 6C,D and Figures 7A,B). The westerly jet is northerly than usual, and the zonal circulation is stronger, resulting in the stable WPSH in the northerly position (Figures 8A,B), which easily results in CHDE events in YHRB. The northward movement and strengthening of westerly jet are conducive to the formation of abnormal anticyclonic circulation over the YHRB (Figures 6E,F), bringing negative vorticity advection (Figures 7C,D), resulting in enhanced subsidence over the YHRB and suppressed precipitation (Figures 6E,F), which is conducive to the generation of sunny weather and the promotion of ground temperature. In addition, the strengthening of plateau heat source makes the South Asian high extend eastward (Zhu and Ding, 2009). Through the strong dynamic forcing of upper negative vorticity advection in the right side of exit of the westerly jet, the subsidence movement in the WPSH region is strengthened, resulting in the stable maintenance of the subtropical high and clear and high temperature in YHRB. Therefore, sunny weather and strong solar radiation in the YHRB result in the surface absorbing a lot of energy. The dry adiabatic descent in the high-pressure ridge makes the temperature rise in the YHRB, which is therefore prone to CHDEs.
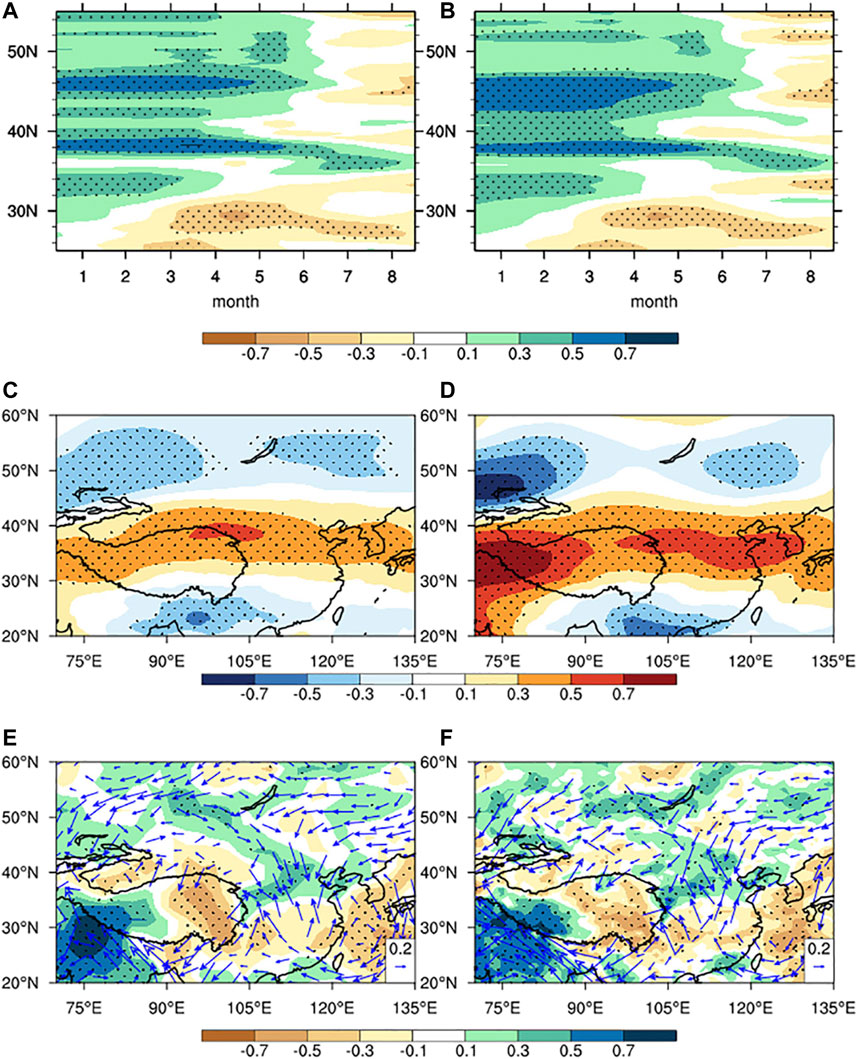
FIGURE 6. (A,C,E) Correlation coefficients between the PC1 of winter NH snow cover and (A) soil moisture with time along 115–120°E, (C) summer 200 hPa zonal wind, and (E) summer total precipitation (shade); 850 hPa wind (vectors). (B,D,F) As in (A,C,E) but for the PC1 of summer CHDEs. Black dots in (A-F) indicate values significant at the 95% confidence level. A positive correlation for zonal or meridional wind component is denoted by an eastward or poleward arrow, respectively.
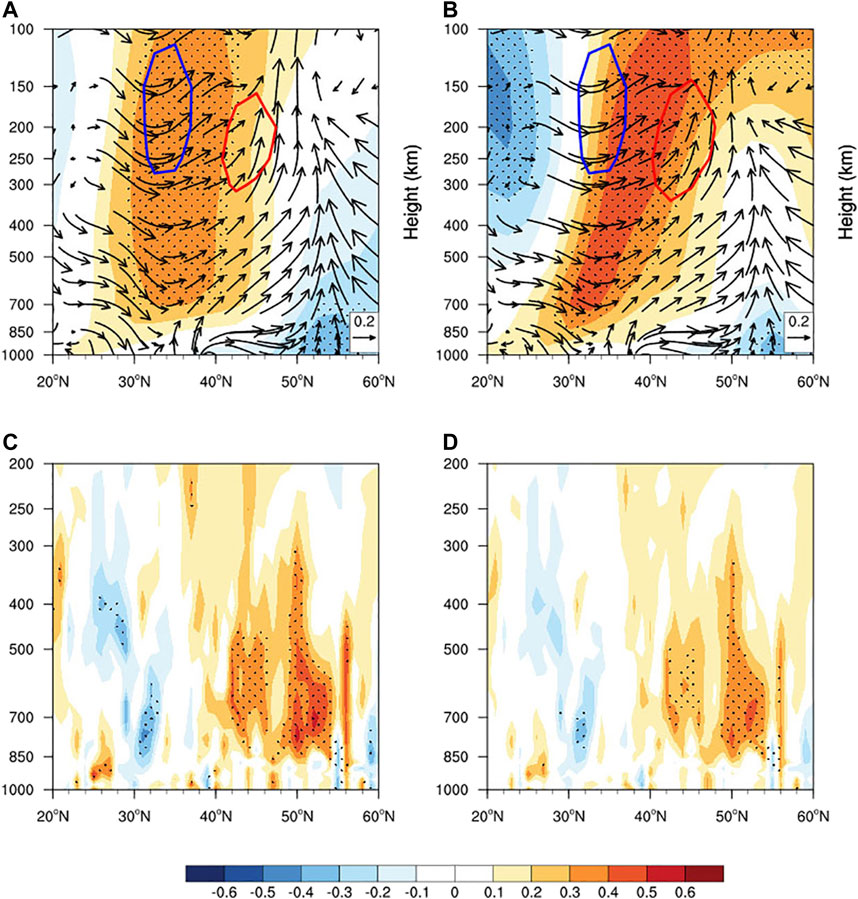
FIGURE 7. (A,C) Correlation coefficients between the PC1 of winter NH snow cover and summer (A) geopotential height (shading) and vertical circulation (vectors), (C) relative vorticity along 115°N. (B,D) As in (A,C) but for the PC1 of summer CHDEs. The red lines in (A,B) represent 30 m/s zonal wind, which are regressed by high-value years of the PC1 of winter NH snow cover and summer CHDEs, and the blue lines are regressed by low-value years. Black dots and black vectors indicate values significant at the 95% confidence level. A positive correlation for meridional or upward wind component is denoted by an poleward or upward arrow, respectively.
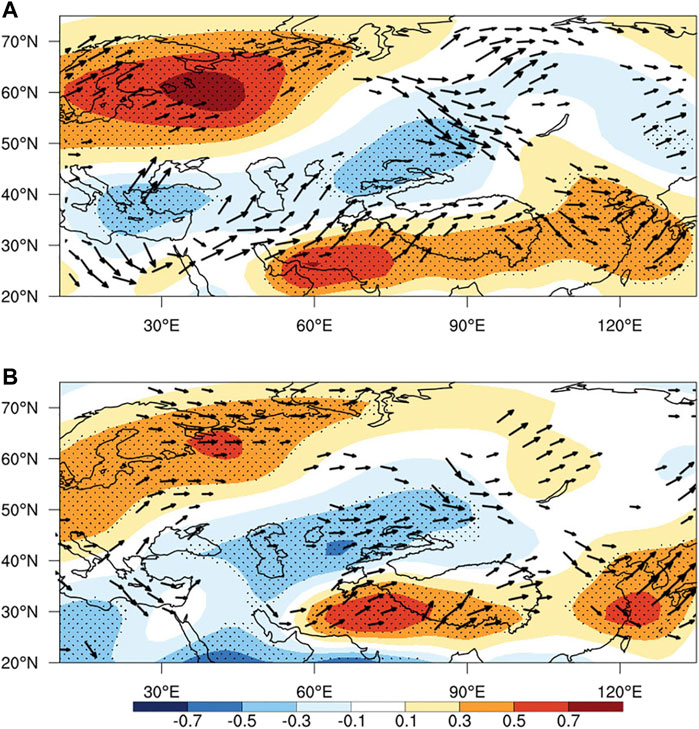
FIGURE 8. Correlation coefficients between 500-hPa geopotential height and WAF in summer and (A) the PC1 of winter snow cover and (B) the PC1 of summer CHDEs. Black dots and black vectors indicate values significant at the 95% confidence level. A positive correlation for zonal or meridional WAF component is denoted by an eastward or poleward arrow, respectively.
In addition to these local thermal factors causing climatic anomalies, many studies have indicated that the occurrence of compound extreme events is often associated with the combined effect of different factors from local and remote regions (Haarsma et al., 2015; Duchez et al., 2016; Miralles et al., 2019; Geirinhas et al., 2021). Figure 8A shows that when the PC1 of the preceding winter snow cover is positive, there is strong WAF propagating to East Asia in the mid and high latitudes of Eurasia, and northern Europe–the southern Barents Sea is the main wave anomaly source. Due to the “+—+” distribution of 500-hPa geopotential height, there is a strong high-pressure anomaly over central and northern East Asia. The features are similar to those in Figure 8B for the PC1 of summer CHDEs. Strong anomalous wave trains in the mid and high latitudes are accompanied by pressure anomalies, resulting in significant high-pressure anomalies in northern East Asia. In addition, it is worth noting that, in the two maps, the geopotential height anomalies in East Asia are zonally extended, indicating that the northward and westward WPSH is likely related to the wave train anomaly.
With global climate change, the risk of compound extreme events is increasing (Ribeiro et al., 2020), which prompted us to study their precursors and early signals. Some studies have shown that the enhancement of surface heating in the mid–high latitudes associated with the Arctic amplification can significantly affect the midlatitude summer circulation and promote anomalous high pressure in the troposphere through weakening of midlatitude storm tracks, northward movement of jets, and amplification of synoptic-scale quasi-stationary waves (Coumou et al., 2018; Ting et al., 2018). The occurrence of this positive geopotential height anomaly in the mid–high latitudes induces dry and hot weather through subsidence and easterly anomalies of continental origin (Zhang et al., 2021). These links can be partially confirmed in our work. For example, when the Arctic amplification characteristics are obvious, often accompanied by a negative AO, the summertime climate systems in East Asia, such as the subtropical high and westerly jet, are positioned northwards, and an upper-troposphere high-pressure ridge develops. In this case, the midlatitudes of China are prone to a hotter and drier climate.
Different from the conclusions in previous research, we found for the first time that there is a significant relationship between the dominant modes of winter snow cover in the NH and the summer CHDEs in the YHRB of China. The EOF1 of snow cover shows that when there is more snow cover in Europe, Northeast China, and North America, there is less snow cover in central Asia and the midlatitudes. The snow characteristics are coupled with a negative AO (Zhao et al., 2016). Besides, it is also likely that summer CHDEs are related to sea surface temperature anomaly characteristics similar to the La Niña pattern (Hao et al., 2018). However, the contributions of sea surface temperature to the relationship between snow cover and CHDEs in the interannual scale and its mechanism need to be further analyzed. The signals in winter are likely stored and transmitted through snow cover, soil, and ocean, which cause circulation responses in spring and summer, including an enhancing of the westerlies, promotion of the development of mid- and high-latitude high systems, weakening the mei-yu front, resulting in less precipitation in the YHRB of China. At the same time, anomalous planetary waves from the south side of the Barents Sea also play a synergistic role, which propagate southeastwards to induce the WPSH to shift northwards and westwards, thereby controlling the YHRB and its northern region and resulting in high temperatures. The anomalous wave trains are closely related to the EOF1 of winter snow cover, which is consistent with other relevant studies (Francis and Vavrus, 2012; Screen and Simmonds, 2013); plus, our study further finds that this wave train is also closely related to summer CHDEs in the YHRB of China. Therefore, the hot and dry climate in the YHRB in summer can be related to the EOF1 of snow cover and the land–ocean–ice–atmosphere system near the Arctic in the preceding winter. Besides, the opposite trend in the western TP, on one hand, is likely associated with changes of westerlies over the TP (Sun et al., 2020). On the other hand, it could be related anomaly of the Indian summer monsoon (Zhang et al., 2017). The characteristics could be shown in correlation distributions of snow PC1 (Figure 6 and Table 2). Enhance of the upper westerlies can lead to anomalous divergence in the south of the upper jet entrance (the western TP), resulting in anomalous ascending favoring the wetting in western TP. Meanwhile, the western TP is usually located in the left of the lower jet (usually related to monsoon), which can intensify ascending and rainfall. And enhance of the upper westerlies also leads to anomalous anticyclonic shear in the south of the westerly jet (the eastern TP and the YHRB), strengthening the high-pressure anomaly and descending.
These precursors in winter—especially the snow signal—may have potential value for the prediction of summer heat and drought anomalies. Furthermore, we conducted an EOF analysis of spring snow cover in the NH and found that the EOF2 of spring snow cover (Supplementary Figure S5) is likely a continuation of the EOF1 of winter snow cover (Figure 3B). They are not only spatially similar, but their PCs are also highly correlated (r = 0.50, p < 0.01). Moreover, both the winter and spring snow modes are significantly related to the EASM and summer CHDEs in China. However, by comparison, the AO, as an atmospheric signal, shows no robust interseasonal transmission (Table 3). Therefore, the modes of winter and spring snow in the NH are more “memorable” than the AO, and have the potential to be used as predictors for hot and dry climate conditions in summer in China.
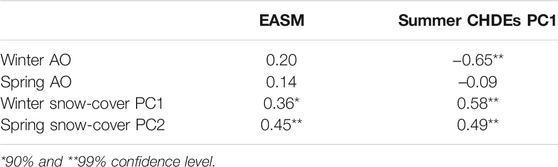
TABLE 3. Correlation coefficients of the PC1 of winter snow cover and the PC2 of spring snow cover with the EASM index and the PC1 of summer CHDEs during 1981–2020.
Similaritybetween Supplementary Figure S5 and Figure 3B implies not only seasonal continuity of snow signals in some key regions but also the spatial synergy. Both of their spatial distributions show that when there was more snow cover in Europe, Northeast China, and North America, there was less snow cover in central Asia and the midlatitudes (including the TP region). Halder and Dirmeyer (2016) found that although the snow-albedo effect is prevalent over western Eurasia, the delayed hydrological effect is strong and persistent over the eastern part. Yim et al. (2010) found the second EOF mode of spring Eurasia is dominated by an east-west dipole structure and this dipole-pattern snow cover has better persistence and is more closely related to the EASM rainfall than that of continent-wide snow cover, which is similar to our conclusion. To identify the importance of the leading mode of snow cover in the northern hemisphere and the synergy among snow variations in multiple key regions, according to the EOF1 of winter snow cover (Figure 3B), we calculated correlation coefficients between three key regions (midwestern Europe: 5°–30°E and 45°–55°N, Northeast China: 110°–135°E and 40°–50°N and northern United States: 85°–115°W and 40°–50°N) of winter snow cover and summer China CHDEs PC1. It was found that although snow in the key regions was all significantly correlated with the summer CHDEs PC1 (correlations are from 0.36 to 0.48; Supplementary Table S1), the correlation coefficient was not as large as that of the PC1 of whole winter northern-hemisphere snow cover (r = 0.58). So the synergistic variations of winter snow cover in the northern hemisphere are likely more important than that of in a single region.
Using percentile event thresholds is a simple and robust way of placing the current temperature/humidity conditions in the context of both climatology and variability at a specific location. Though percentile event thresholds are undeniably a meaningful index, one should be careful with its interpretation. Firstly, one disadvantage is the necessity of a robust probability density function on which to base the percentiles (Ford et al., 2016) and it should be noted that this method do not provide a physical indication of Droughts/Heat waves severity. Secondly, this approach may amplify the response of extreme events to climate change (Klein Tank and Können 2003; Donat et al., 2013; Sillmann et al., 2013). For southern China, 25th percentile (from small to large) is still relative humidity value of about 75%. But if we define 50% relative humidity as an absolute threshold, the CHDE events will be hardly happen in southern China. So both the relative and absolute thresholds have weakness. It deserves to be further studied in the future whether it will be better and more reasonable to add an absolute threshold of humidity when calculate the CHDEs.
The original contributions presented in the study are included in the article/Supplementary Material, further inquiries can be directed to the corresponding authors.
HY: Methodology, Data curation, Writing-Original draft preparation; LZ: Conceptualization, Writing-Reviewing and Editing; XS: Writing-Reviewing and Editing; ZX and QL: Writing-Reviewing and Editing.
This work is supported by the Second Tibetan Plateau Scientific Expedition and Research Program (2019QZKK0208), the National Natural Science Foundation of China (41790471, 42075040, 41975054 and 41930967), the Strategic Priority Research Program of the Chinese Academy of Sciences (XDA20100304, XDA20060501 and XDA23090102), the National Key Research and Development Program of China (2018YFA0606203 and 2019YFC1510400), the Innovative Development Special Project of China Meteorological Administration (CXFZ2022J039) and Guangdong Major Project of Basic and Applied Basic Research (2020B0301030004).
The authors declare that the research was conducted in the absence of any commercial or financial relationships that could be construed as a potential conflict of interest.
All claims expressed in this article are solely those of the authors and do not necessarily represent those of their affiliated organizations, or those of the publisher, the editors and the reviewers. Any product that may be evaluated in this article, or claim that may be made by its manufacturer, is not guaranteed or endorsed by the publisher.
We thank the reviewers and editor for insightful remarks. We would like to thank the European Centre for Medium-Range Weather Forecasts for providing the ERA5 reanalysis data. The authors acknowledged the Climate Prediction Center of the National Oceanic and Atmospheric Administration of the United States for providing AO index data.
The Supplementary Material for this article can be found online at: https://www.frontiersin.org/articles/10.3389/feart.2022.834284/full#supplementary-material
Betts, A. K., Ball, J. H., Beljaars, A. C. M., Miller, M. J., and Viterbo, P. (1994). “Coupling between Land-Surface Boundary-Layer Parameterizations and Rainfall on Local and Regional Scales: Lessons from the Wet Summer of 1993,” in Fifth Symp. On Global Change Studies, 174–181.
Chen, Y., Moufouma-Okia, W., Masson-Delmotte, V., Zhai, P., and Pirani, A. (2018). Recent Progress and Emerging Topics on Weather and Climate Extremes since the Fifth Assessment Report of the Intergovernmental Panel on Climate Change. Annu. Rev. Environ. Resour. 43 (1), 35–59. doi:10.1146/annurev-environ-102017-030052
Choi, W., and Kim, K.-Y. (2019). Summertime Variability of the Western North Pacific Subtropical High and its Synoptic Influences on the East Asian Weather. Sci. Rep. 9, 7865. doi:10.1038/s41598-019-44414-w
Chow, K. C., Chan, J. C. L., Shi, X., Liu, Y., and Ding, Y. (2008). Diurnal Variations of Circulation and Precipitation in the Vicinity of the Tibetan Plateau in Early Summer. Clim. Dyn. 32, 55–73. doi:10.1007/s00382-008-0374-x
Cohen, J., Zhang, X., Francis, J., Jung, T., Kwok, R., Overland, J., et al. (2020). Divergent Consensuses on Arctic Amplification Influence on Midlatitude Severe winter Weather. Nat. Clim. Chang. 10, 20–29. doi:10.1038/s41558-019-0662-y
Coumou, D., Di Capua, G., Vavrus, S., Wang, L., and Wang, S. (2018). The Influence of Arctic Amplification on Mid-latitude Summer Circulationfluence of Arctic Amplification on Mid-latitude Summer Circulation. Nat. Commun. 9, 2959. doi:10.1038/s41467-018-05256-8
Deng, K., Yang, S., Ting, M., Zhao, P., and Wang, Z. (2019). Dominant Modes of China Summer Heat Waves Driven by Global Sea Surface Temperature and Atmospheric Internal Variability. J. Clim. 32 (12), 3761–3775. doi:10.1175/jcli-d-18-0256.1
Ding, Y., Sun, Z., Wang, Z., Zhu, Y., and Song, Y. (2009). Inter-decadal Variation of the Summer Precipitation in China and its Association with Decreasing Asian Summer Monsoon Part Ii: Possible Causes. Int. J. Climatol. 29 (13), 1926–1944. doi:10.1002/joc.1759
Donat, M. G., Alexander, L. V., Yang, H., Durre, I., Vose, R., Dunn, R. J. H., et al. (2013). Updated Analyses of Temperature and Precipitation Extreme Indices since the Beginning of the Twentieth century: The HadEX2 Dataset. J. Geophys. Res. Atmos. 118, 2098–2118. doi:10.1002/jgrd.50150
Dosio, A., Mentaschi, L., Fischer, E. M., and Wyser, K. (2018). Extreme Heat Waves under 1.5 °C and 2 °C Global Warming. Environ. Res. Lett. 13 (5), 054006. doi:10.1088/1748-9326/aab827
Douville, H. (2002). Influence of Soil Moisture on the Asian and African Monsoons. Part II: Interannual Variability. J. Clim. 15 (7), 701–720. doi:10.1175/1520-0442(2002)015<0701:iosmot>2.0.co;2
Duchez, A., Frajka-Williams, E., Josey, S. A., Evans, D. G., Grist, J. P., Marsh, R., et al. (2016). Drivers of Exceptionally Cold North Atlantic Ocean Temperatures and Their Link to the 2015 European Heat Wave. Environ. Res. Lett. 11, 074004. doi:10.1088/1748-9326/11/7/074004
Duchon, C. E. (1979). Lanczos Filtering in One and Two Dimensions. J. Appl. Meteorol. 18 (8), 1016–1022. doi:10.1175/1520-0450(1979)018<1016:lfioat>2.0.co;2
Entin, J. K., Robock, A., Vinnikov, K. Y., Hollinger, S. E., Liu, S., and Namkhai, A. (2000). Temporal and Spatial Scales of Observed Soil Moisture Variations in the Extratropics. J. Geophys. Res. 105, 11865–11877. doi:10.1029/2000jd900051
Feng, S., and Hu, Q. (2008). How the north atlantic Multidecadal Oscillation May Have Influenced the Indian Summer Monsoon during the Past Two Millennia. Geophys. Res. Lett. 35 (1), 548–562. doi:10.1029/2007gl032484
Ford, T. W., Wang, Q., and Quiring, S. M. (2016). The Observation Record Length Necessary to Generate Robust Soil Moisture Percentiles. J. Appl. Meteorol. 55 (10), 2131–2149. doi:10.1175/jamc-d-16-0143.1
Francis, J. A., and Vavrus, S. J. (2012). Evidence Linking Arctic Amplification to Extreme Weather in Mid-latitudes. Environ. Res. Lett. 39 (6). doi:10.1029/2012gl051000
Geirinhas, J. L., Russo, A., Libonati, R., Sousa, P. M., Miralles, D., and Trigo, R. M. (2021). Recent Increasing Frequency of Compound Summer Drought and Heatwaves in Southeast Brazil. Environ. Res. Lett. 16 (3), 034036. doi:10.1088/1748-9326/abe0eb
Goswami, B. N., Madhusoodanan, M. S., Neema, C. P., and Sengupta, D. (2006). A Physical Mechanism for north atlantic Sst Influence on the Indian Summer Monsoon. Geophys. Res. Lett. 33 (2). doi:10.1029/2005gl024803
Haarsma, R. J., Selten, F. M., and Drijfhout, S. S. (2015). Decelerating Atlantic Meridional Overturning Circulation Main Cause of Future West European Summer Atmospheric Circulation Changes. Environ. Res. Lett. 10, 94007. doi:10.1088/1748-9326/10/9/094007
Halder, S., and Dirmeyer, P. A. (2016). Relation of Eurasian Snow Cover and Indian Summer Monsoon Rainfall: Importance of the Delayed Hydrological Effect. J. Clim. 30 (4), 1273–1289. doi:10.1175/JCLI-D-16-0033.1
Hao, Z., Hao, F., Singh, V. P., and Zhang, X. (2018). Quantifying the Relationship between Compound Dry and Hot Events and El Niño-Southern Oscillation (ENSO) at the Global Scale. J. Hydrol. 567 (September), 332–338. doi:10.1016/j.jhydrol.2018.10.022
Klein Tank, A. M. G., and Können, G. P. (2003). Trends in Indices of Daily Temperature and Precipitation Extremes in Europe, 1946-99. J. Clim. 16, 3665–3680. doi:10.1175/1520-0442(2003)016<3665:tiiodt>2.0.co;2
Leonard, M., Westra, S., Phatak, A., Lambert, M., van den Hurk, B., McInnes, K., et al. (2014). A Compound Event Framework for Understanding Extreme Impacts. WIREs Clim. Change 5, 113–128. doi:10.1002/wcc.252
Li, N., Xiao, Z. N., and Zhao, L. (2021). A Recent Increase in Long-Lived Heatwaves in China under the Joint Influence of South Asia and Western North Pacific Subtropical Highs. J. Clim. 34 (17), 7167–7179. doi:10.1175/jcli-d-21-0014.1
Lim, E.-P., Hendon, H. H., Boschat, G., Hudson, D., Thompson, D. W. J., Dowdy, A. J., et al. (2019). Australian Hot and Dry Extremes Induced by Weakenings of the Stratospheric Polar Vortex. Nat. Geosci. 12, 896–901. doi:10.1038/s41561-019-0456-x
Liu, D., Yu, Z., and Mishra, A. K. (2017a). Evaluation of Soil Moisture‐precipitation Feedback at Different Time Scales over Asia. Int. J. Climatol. 37 (9), 3619–3629. doi:10.1002/joc.4943
Liu, L., Zhang, R., and Zuo, Z. (2017b). Effect of spring Precipitation on Summer Precipitation in Eastern China: Role of Soil Moisture. J. Clim. 30 (22), 9183–9194. doi:10.1175/jcli-d-17-0028.1
Liu, S., Wu, Q., Schroeder, S. R., Yao, Y., Zhang, Y., Wu, T., et al. (2020). Near-global Atmospheric Responses to Observed Springtime Tibetan Plateau Snow Anomalies. J. Clim. 33 (5), 1691–1706. doi:10.1175/jcli-d-19-0229.1
Lu, M., Kuang, Z., Yang, S., Li, Z., and Fan, H. (20202020). A Bridging Role of winter Snow over Northern China and Southern mongolia in Linking the East Asian winter and Summer Monsoons. J. Clim. 33.22, 1–50. doi:10.1175/jcli-d-20-0298.1
Matsumura, S., and Yamazaki, K. (2012). Eurasian Subarctic Summer Climate in Response to Anomalous Snow Cover. J. Clim. 25, 1305–1317. doi:10.1175/2011jcli4116.1
Meng, L., Long, D., Quiring, S. M., and Shen, Y. (2014). Statistical Analysis of the Relationship between spring Soil Moisture and Summer Precipitation in East China. Int. J. Climatol. 34 (5), 1511–1523. doi:10.1002/joc.3780
Miralles, D. G., Gentine, P., Seneviratne, S. I., and Teuling, A. J. (2019). Land-atmospheric Feedbacks during Droughts and Heatwaves: State of the Science and Current Challenges. Ann. N. Y Acad. Sci. 1436, 19–35. doi:10.1111/nyas.13912
North, G. R., Bell, T. L., Cahalan, R. F., and Moeng, F. J. (1982). Sampling Errors in the Estimation of Empirical Orthogonal Functions. Mon. Wea. Rev. 110, 699–706. doi:10.1175/1520-0493(1982)110<0699:seiteo>2.0.co;2
Perkins, S. E., and Alexander, L. V. (2013). On the Measurement of Heat Waves. J. Clim. 26, 4500–4517. doi:10.1175/jcli-d-12-00383.1
Prabhu, A., Oh, J., Kim, I., Kripalani, R. H., Mitra, A. K., and Pandithurai, G. (2017). Summer Monsoon Rainfall Variability over north east Regions of india and its Association with Eurasian Snow, atlantic Sea Surface Temperature and Arctic Oscillation. Clim. Dyn. 49 (7-8), 2545–2556. doi:10.1007/s00382-016-3445-4
Pyper, B. J., and Peterman, R. M. (1998). Comparison of Methods to Account for Autocorrelation in Correlation Analyses of Fish Data. Can. J. Fish. Aquat. Sci. 55 (9), 2127–2140. doi:10.1139/f98-104
IPCC (2021). “Summary for Policymakers,” in Climate Change 2021: The Physical Science Basis. Contribution of Working Group I to the Sixth Assessment Report of the Intergovernmental Panel on Climate Change [Masson-Delmotte, V. Editors P. Zhai, A. Pirani, S. L. Connors, C. Péan, S. Berger, N. Caudet al. (Cambridge University Press). In Press.
Qian, Q. F., Jia, X. J., and Wu, R. (2019). Changes in the Impact of the Autumn Tibetan Plateau Snow Cover on the Winter Temperature over North America in the Mid‐1990s. J. Geophys. Res. 124, 19. doi:10.1029/2019jd030245
Rasmijn, L. M., van der Schrier, G., Bintanja, R., Barkmeijer, J., Sterl, A., and Hazeleger, W. (2018). Future Equivalent of 2010 Russian Heatwave Intensified by Weakening Soil Moisture Constraints. Nat. Clim Change 8, 381–385. doi:10.1038/s41558-018-0114-0
Ribeiro, A. F. S., Russo, A., Gouveia, C. M., Páscoa, P., and Zscheischler, J. (2020). Risk of Crop Failure Due to Compound Dry and Hot Extremes Estimated with Nested Copulas. Biogeosciences 17, 4815–4830. doi:10.5194/bg-17-4815-2020
Saito, K., Yasunari, T., and Cohen, J. (2004). Changes in the Sub-decadal Covariability between Northern Hemisphere Snow Cover and the General Circulation of the Atmosphere. Int. J. Climatol. 24 (1), 33–44. doi:10.1002/joc.984
Screen, J. A., and Simmonds, I. (2013). Exploring Links between Arctic Amplification and Mid-latitude Weather. Geophys. Res. Lett. 40 (5), 959–964. doi:10.1002/grl.50174
Seneviratne, S. I., Corti, T., Davin, E. L., Hirschi, M., Jaeger, E. B., Lehner, I., et al. (2010). Investigating Soil Moisture-Climate Interactions in a Changing Climate: a Review. Earth Sci. Rev. 99 (3–4), 125–161. doi:10.1016/j.earscirev.2010.02.004
Shen, C., Wang, Wei‐Chyung., and Zeng, G. (2011). Decadal Variability in Snow Cover over the Tibetan Plateau during the Last Two Centuries. Geophys. Res. Lett. 38 (10). doi:10.1029/2011gl047288
Shi, N., Lu, J. J., and Zhu, Q. G. (1996). East Asian winter/summer Monsoon Intensity Indices with Their Climatic Change in 1873–1989 (In Chinese). J. Nanjing Inst. Meteorol. 19, 168–177.
Sillmann, J., Kharin, V. V., Zhang, X., Zwiers, F. W., and Bronaugh, D. (2013). Climate Extremes Indices in the CMIP5 Multimodel Ensemble: Part 1. Model Evaluation in the Present Climate. J. Geophys. Res. Atmos. 118, 1716–1733. doi:10.1002/jgrd.50203
Sippel, S., Reichstein, M., Ma, X., Mahecha, M. D., Lange, H., Flach, M., et al. (2018). Drought, Heat, and the Carbon Cycle: a Review. Curr. Clim. Change Rep. 4, 266–286. doi:10.1007/s40641-018-0103-4
Sun, J., Yang, K., Guo, W., Wang, Y., He, J., and Lu, H. (2020). Why Has the Inner Tibetan Plateau Become Wetter since the Mid-1990s? J. Clim. 33 (19), 8507–8522. doi:10.1175/jcli-d-19-0471.1
Takaya, K., and Nakamura, H. (1997). A Formulation of a Wave-Activity Flux for Stationary Rossby Waves on a Zonally Varying Basic Flow. Geophys. Res. Lett. 24 (23), 2985–2988. doi:10.1029/97gl03094
Tian, F., Klingaman, N. P., and Dong, B. (2021). The Driving Processes of Concurrent Hot and Dry Extreme Events in China. J. Clim. 34 (5), 1809–1824. doi:10.1175/jcli-d-19-0760.1
Ting, D., Hui, G., and Weijing, L. (2018). Extreme High‐temperature Event in Southern China in 2016 and the Possible Role of Cross‐equatorial Flows. Int. J. Climatol. 38, 3579–3594. doi:10.1002/joc.5518
Vinnikov, K. Y., and Yeserkepova, I. B. (1991). Soil Moisture: Empirical Data and Model Results. J. Clim. 4 (1), 66–79. doi:10.1175/1520-0442(1991)004<0066:smedam>2.0.co;2
Wang, M., Jia, X. J., Ge, J. W., and Qian, Q. F. (2019). Changes in the Relationship between the Interannual Variation of Eurasian Snow Cover and spring SAT over Eastern Eurasia. J. Geophys. Res. Atmos. 124 (2), 468–487. doi:10.1029/2018jd029077
Wu, R., and Kirtman, B. P. (2007). Observed Relationship of Spring and Summer East Asian Rainfall with Winter and Spring Eurasian Snow. J. Clim. 20 (7), 1285–1304. doi:10.1175/jcli4068.1
Wu, X., Hao, Z., Hao, F., and Zhang, X. (2019). Variations of Compound Precipitation and Temperature Extremes in China during 1961-2014. Sci. Total Environ. 663, 731–737. doi:10.1016/j.scitotenv.2019.01.366
Wu, Z., Zhang, P., Chen, H., and Li, Y. (2016). Can the Tibetan Plateau Snow Cover Influence the Interannual Variations of Eurasian Heat Wave Frequency? Clim. Dyn. 46, 3405–3417. doi:10.1007/s00382-015-2775-y
Yim, S.-Y., Jhun, J.-G., Lu, R., and Wang, B. (2010). Two Distinct Patterns of spring Eurasian Snow Cover Anomaly and Their Impacts on the East Asian Summer Monsoon. J. Geophys. Res. 115 (D22), D22113. doi:10.1029/2010jd013996
You, Q., Kang, S., Aguilar, E., Pepin, N., Flügel, W.-A., Yan, Y., et al. (2011). Changes in Daily Climate Extremes in China and Their Connection to the Large Scale Atmospheric Circulation during 1961-2003. Clim. Dyn. 36, 2399–2417. doi:10.1007/s00382-009-0735-0
Zhang, Q., Tao, S., and Chen, L. (2003). The Interannual Variability of East Asian Summer Monsoon Indices and its Association with the Pattern of General Circulation over East Asia (In Chinese). Acta Meteorologica Sinica 56, 199–211.
Zhang, R., and Zuo, Z. (2011). Impact of spring Soil Moisture on Surface Energy Balance and Summer Monsoon Circulation over East Asia and Precipitation in East China. J. Clim. 24 (13), 3309–3322. doi:10.1175/2011jcli4084.1
Zhang, T., Wang, T., Feng, Y., Li, X., and Krinner, G. (2021). An Emerging Impact of Eurasian spring Snow Cover on Summer Rainfall in Eastern China. Environ. Res. Lett. 16 (5), 054012. doi:10.1088/1748-9326/abf688
Zhang, W., Zhou, T., and Zhang, L. (2017). Wetting and Greening Tibetan Plateau in Early Summer in Recent Decades. J. Geophys. Res. Atmos. 122, 5808–5822. doi:10.1002/2017jd026468
Zhao, L., Zhu, Y., Liu, H., Liu, Z., Liu, Y., Li, X., et al. (2016). A Stable Snow-Atmosphere Coupled Mode. Clim. Dyn. 47 (7-8), 2085–2104. doi:10.1007/s00382-015-2952-z
Keywords: snow cover, compound hot and dry extremes, EOF analysis, east asian monsoon, arctic oscillation, subtropical highs
Citation: Yao H, Zhao L, Shen X, Xiao Z and Li Q (2022) Relationship Between Summer Compound Hot and dry Extremes in China and the Snow Cover Pattern in the Preceding Winter. Front. Earth Sci. 10:834284. doi: 10.3389/feart.2022.834284
Received: 13 December 2021; Accepted: 10 February 2022;
Published: 07 March 2022.
Edited by:
Renguang Wu, Zhejiang University, ChinaReviewed by:
Lisuo Hu, Second Institute of Oceanography, ChinaCopyright © 2022 Yao, Zhao, Shen, Xiao and Li. This is an open-access article distributed under the terms of the Creative Commons Attribution License (CC BY). The use, distribution or reproduction in other forums is permitted, provided the original author(s) and the copyright owner(s) are credited and that the original publication in this journal is cited, in accordance with accepted academic practice. No use, distribution or reproduction is permitted which does not comply with these terms.
*Correspondence: Liang Zhao, emhhb2xAbGFzZy5pYXAuYWMuY24=; Xinyong Shen, c2hlbnh5QG51aXN0LmVkdS5jbg==
Disclaimer: All claims expressed in this article are solely those of the authors and do not necessarily represent those of their affiliated organizations, or those of the publisher, the editors and the reviewers. Any product that may be evaluated in this article or claim that may be made by its manufacturer is not guaranteed or endorsed by the publisher.
Research integrity at Frontiers
Learn more about the work of our research integrity team to safeguard the quality of each article we publish.