- 1Dept Earth Ocean and Atmospheric Science, Florida State University, Tallahassee, FL, United States
- 2Marine Science Deptartment, Florida International University, Miami, FL, United States
- 3LASMAP, Ecole Polytech Tunisie, University of Carthage, Tunis, Tunisia
- 4School of Engineering, Florida State University, Tallahassee, FL, United States
In 2004, destruction of a Gulf of Mexico oil platform by Hurricane Ivan initiated a discharge of oil and gas from a water depth of 135 m, where its bundle of well conductors was broken below the seafloor near the toppled wreckage. Discharge continued largely unabated until 2019, when findings partly reported herein prompted installation of a containment device that could trap oil before it entered the water column. In 2018, prior to containment, oil and gas bubbles formed plumes that rose to the surface, which were quantified by acoustic survey, visual inspection, and discrete collections in the water column. Continuous air sampling with a cavity ring-down spectrometer (CRDS) over the release site detected atmospheric methane concentrations as high as 11.7, ∼6 times greater than an ambient baseline of 1.95 ppmv. An inverse plume model, calibrated to tracer-gas release, estimated emission into the atmosphere of 9 g/s. In 2021, the containment system allowed gas to escape into the water at 120 m depth after passing through a separator that diverted oil into storage tanks. The CRDS detected transient peaks of methane as high as 15.9 ppmv ppm while oil was being recovered to a ship from underwater storage tanks. Atmospheric methane concentrations were elevated 1–2 ppmv over baseline when the ship was stationary within the surfacing plumes of gas after oil was removed from the flow. Oil rising to the surface was a greater source of methane to the atmosphere than associated gas bubbles.
Introduction
Methane seepage on outer continental margins supports microbial consortia and symbioses that are the basis of chemosynthetic food webs. Seeps can be identified visually by the presence of pockmarks (Marcon et al., 2014; Mason et al., 2019), authigenic carbonates (Feng et al., 2010), gas hydrate outcroppings—when within the hydrate stability zone—(MacDonald et al., 2003), lush biological communities (Roy et al., 2007), or bubble plumes (Fu et al., 2021). Seeps can be detected acoustically because bubbles are strong reflectors in scanning or swath-mapping sonar (Römer et al., 2012). So, many active seeps have been discovered during geophysical surveys (Skarke et al., 2014). In the Gulf of Mexico and other oil-generating provinces, seeping hydrocarbons often include oil that rises along with the gas and reaches the ocean surface, where it forms oil slicks that can be detected by remote sensing techniques, especially synthetic aperture radar (SAR) (Garcia-Pineda et al., 2010). However, geophysical surveys of the Gulf and elsewhere have also detected many bubble plumes or flares that were not associated with oil slicks and did not extend to the surface (Mitchell et al., 2018) because, presumably, methane bubbles from “dry” or oil-free seeps dissolve within the water column before reaching the surface (Rehder et al., 2002; Rehder et al., 2009).
The fate of marine methane releases is important because, in the U.S. waters alone, Skarke et al. (2014) have identified over 500 gas seeps. Satellite SAR images have identified over 900 persistent oil seeps in the Gulf (MacDonald et al., 2015) and elsewhere (Jatiault et al., 2017), and many of these have been confirmed by submersible sampling (Roberts and Boland, 2010). Moreover, seep occurrences might be increasing in number and magnitude due to ongoing changes in ocean conditions such as continental rebound or climate-related warming and the potential instability of gas hydrates (Westbrook et al., 2009; Altuna et al., 2021). Accidental releases of oil and gas due to marine energy production and pipeline pumping are also a concern (Eckle et al., 2012). A basic question concerns the effect of methane seeps from natural sources or methane leaks from production facilities: Does methane primarily dissolve in seawater, where it will be oxidized to CO2 and its dissociation products (Dickens et al., 1995), or does it also reach the atmosphere where it could contribute to greenhouse forcing (McGinnis et al., 2006; Böttner et al., 2020)? Such impacts might increase in future if ocean warming destabilizes marine gas hydrates or aging energy infrastructure. In this study, we have been able to conduct a natural experiment by measuring the properties of a prolific anthropogenic discharge of methane from 135 m when abundant oil was first present, then largely removed.
Study Area and Previous Reporting
Hurricane Ivan struck the Gulf of Mexico in September 2004, passed to the east of the Taylor Energy oil production platform in the MC20 lease block, and made landfall on 16 September with category 4 strength. This passage generated individual waves estimated to be more than 40 m high in the eye wall (Wang et al., 2005), which probably hit the platform as breaking waves when they contacted the surrounding water depths of 135 m. Remarkably, Ivan then blew across the SE United States into the Atlantic Ocean, curved to the south, then back across Florida, reentered the Gulf, and made its final landfall on 23 September in Louisiana to the west of the platform, which was located in the MC20 lease block at 28°56.3′N and 89°58.2′W, approximately 18 km from the SE tip of the Mississippi River Delta (Figure 1). Discharge of storm surging back into the Gulf triggered a massive mudslide (Nodine et al., 2007) that impacted energy infrastructure across a broad front. Notably, it completed destruction of the MC20 platform, toppling its pilings off their base and pushing it 200 m to the southeast, where its wreckage remained tethered to the connectors that had previously supplied oil and gas to the platform from as many as 28 producing wells.
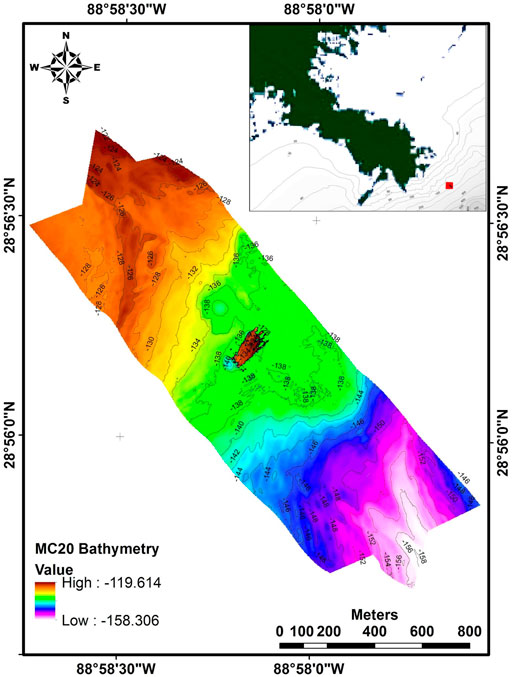
FIGURE 1. Study area is the site of the sunken Taylor Energy platform in the northern Gulf of Mexico in the MC20 lease block (red square) approximately 18 km southeast of the Mississippi River Delta, original Fig. 2.1 (Mason et al., 2019).
All personnel had been evacuated prior to the storm, but subsea cutoff valves, which should have staunched flow up the conductors, either had not been engaged or failed to function properly; as early as 28 September 2004, satellite images showed oil slicks over the wreck site not previously reported. Acoustic surveys in the early months of 2005 detected columnar targets rising from the wreckage. How should such targets be described? Note that authors quantifying acoustic targets in the water column caused by gas bubbles escaping from natural seeps have used the term “flare” to describe these features (Römer et al., 2019), whereas the term “plume” has been used to designate a broad variety of water column features that includes methane bubbles (Sauter et al., 2006), hydrothermal fluids (Elderfield and Schultz, 1996), or hydrocarbons released by industrial accidents such as the Deepwater Horizon oil spill (Socolofsky et al., 2015). Previous publications have used “plume” to describe multiphase columns in MC20 (Mason et al., 2019; Bryant et al., 2020), and that usage will continue herein.
Response efforts in the years following the storm included dredging, wreckage removal, and attempts to plug as many as nine of the platform’s wells. What remained on the site were 8, 145 m platform pilings, the jacket, and their foundation, the template, through which the well conductors formerly passed. Eventually, surveys would confirm the presence of an erosion crater at the northern end of the jacket, from which plumes were consistently emitted (Bryant et al., 2020; O’Reilly, 2020). Although controversial technical and legal issues have attended response operations (Court of Appeals for the Federal Circuit, 2020), oil and gas have been flowing up those conductors and into the Gulf to the present day and the site remains classified as an active oil spill under supervision of the United States Coast Guard (United States Coast Guard, 2019).
The results reported herein were derived from data collected during an expedition on the R/V Brooks McCall in September 2018 and a follow-up sampling expedition on the M/V Brandon Bordelon in November 2021 and January 2022. Sampling in 2018 utilized the ROV Comanche operated by SeaTrepid. Sampling activities addressed bubble plumes escaping from pockmarks near the northernmost end of the jacket and an additional minor plume detected near the template (Figure 1). More extensive results from the 2018 expedition, including a historical review, a detailed description of methodologies, and findings concerning oil discharges, can be found in a published action report by Mason et al. (2019). This article focuses on analyses of the gaseous component of the plumes as observed before and after the installation of a containment system that captured and removed oil from the discharge. Many additional details concerning materials, methods, and findings from the 2018 expedition can be found in the report of Mason et al. (2019), and individual chapters of the report will be cited to direct readers to this information.
Materials and Methods
Acoustic Mapping
During the 2018 expedition, acoustic surveys were conducted from the research vessel and the ROV. Ship-based echosounders were installed on an overboard pole that was oriented vertically during survey operations. Sensors included an HiPAP Model 350 Ultra-Short Baseline transducer (USBL) for tracking the ROV and beacons, a 300 kHz Teledyne RDI Workhorse Acoustic Doppler Current Profiler (ADCP), a 500 kHz Kongsberg Mesotech M3 MBES, and three frequencies of Simrad EK80 SBES transducers operating at 70, 120, and 200 kHz. A Teledyne DMS-25 was installed to account for ship motion. Acoustic mapping surveys were conducted daily to account for changing currents and consequent orientation of hydrocarbon plume in the water column (Supplementary Figure S1A). Initial passes were interpreted to establish the main axis of the plume, and subsequent passes were run parallel to that axis. Mapping of the plumes was conducted with the ROV with the use of Simard EK80 and Kongberg M3 sonars to localize and delineate separate components of the hydrocarbon plume and their sources on the seabed. Details of the calibration and data processing procedures can be found in the work of Taylor and Boswell (2019).
Water Sample Collection and Analysis
Water samples analyzed for methane concentration were collected in Niskin bottles and, to a lesser extent, using methods described in Collection and Imaging of Gas Bubbles. During the 2018 samplings, the bottles were deployed on a rosette and triggered at preset depths. The rosette casts were deployed over the site of the erosion crater while monitoring the acoustic signature of the hydrocarbon plume and attempting to maintain the rosette within the plume. Rosette casts were lowered to a maximum depth of 120 m to avoid entanglement with the platform jacket and midwater gear suspended above the jacket. Additional water samples were obtained from the bubblometer pressure chambers (described below). These samples were sealed at depth and were collected when oil bubbles were observed passing through the device.
During the 2021 samplings, the Niskin bottles were deployed from an ROV and triggered by its manipulator arm. The containment system, which was installed in May 2019, encloses the plume sources under a dome suspended approximately 3 m above the bottom. The contained hydrocarbon plumes are channeled into a patented separator system (Couch, 2010), through which oil is passively diverted into underwater storage tanks, while gas bubbles are continually released into the water at a depth of 123 m. These tanks are periodically emptied in a pump-off procedure that transfers the oil to storage tanks on the M/V Brandon Bordelon. Observations in 2021 and 2022 were cruises of opportunity accommodated by these operations. For the ROV sampling, the bubble plume was readily detected in the ROV scanning sonar, allowing the vehicle to maneuver to where bubbles were visible for water collections. Samples were generally collected in replicate pairs. Water samples were stored in gas-tight vials at 4 C. Methane concentrations were determined with the use of a GC coupled to a flame ionization detector, Shimadzu 8a packed carbosphere column, 140 C oven, and detector at 180 C. Standards were obtained from Restek with accuracy ±5% and precision ±1%.
Collection and Imaging of Gas Bubbles
A custom device called the “bubblometer” was fabricated to collect oil and gas samples in the water column and record digital image samples of the bubble plume for quantification (Figure 2). Its major component was an inverted funnel mounted atop a 30 × 30 cm-wide, 20 cm-high, three-sided visualization chamber, which was open at its bottom and at the side facing the ROV. The funnel was fed into a 300 ml acrylic collection tube that could accumulate water plus oil and gas. Four pressure cylinders, evacuated and sealed at the surface, were plumbed into the collection cylinder and could be filled individually by hydrostatic pressure when their respective valves are opened. Closing these valves then sealed the samples and prevented methane from degassing during ascent. A digital video camera (Deepsea Power and Light model HD Multi Seacam™) with two high-intensity lamps (Deepsea Power and Light Sealite™ 2,300 lumen) was mounted 30 cm from the rear opening of the visualization chamber. The entire device including camera and lamps was fixed to a frame with a hydraulic actuator. This arrangement allowed it to be extended from the front of the ROV so that the bubbles could flow through the bottom of the chamber for imaging or sample collection, or retracted to block the flow. Buoyant oil and gas would pass through the visualization chamber and be funneled into the collection tube. The camera and lamps on the bubblometer allowed observers to monitor bubbles passing through the chamber, while the separate video feed from the ROV allowed them to watch oil and gas displacing seawater at the top of the collection tube and determine when to open a valve and collect a sample.
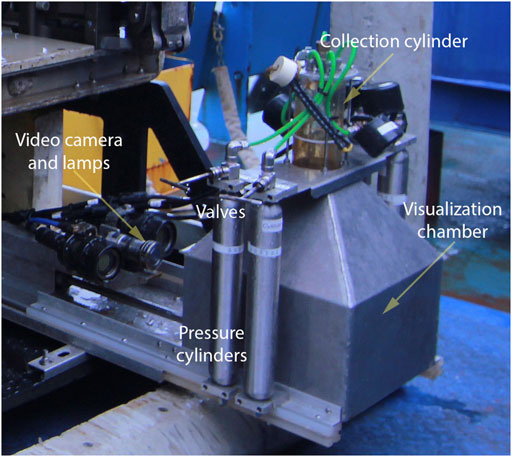
FIGURE 2. Bubblometer on the deck: the bubblometer extended from the front of the ROV where bubbles can flow through the open bottom and funnel into the collection cylinder: Camera and lamps can record the inside of the chamber when the device is extended; bubbles accumulate inside the collection cylinder until valves are opened, original Fig. 4.1 (Mason et al., 2019).
Output from the bubblometer camera was monitored from the ship while the ROV navigated toward the MC20 hydrocarbon plumes. The ROV approached the bubble plumes with its sonar system until bubbles were observed in the camera, and then, thrusters were secured and drifted until a plume had been traversed and bubbles were no longer visible. A digital video was recorded when bubbles were observed passing through the chamber. Sample frames were subsequently captured at 5 s intervals from the recorded video. The camera was mounted at a fixed distance from the chamber, so images had a constant scale, but were cropped to a constant size of 1971 × 1,173 pixels, which showed only the interior of the chamber (Figure 3). In total, 665 individual image samples were collected from the video records during two lowerings of the ROV on 5 and 6 September 2018, respectively.
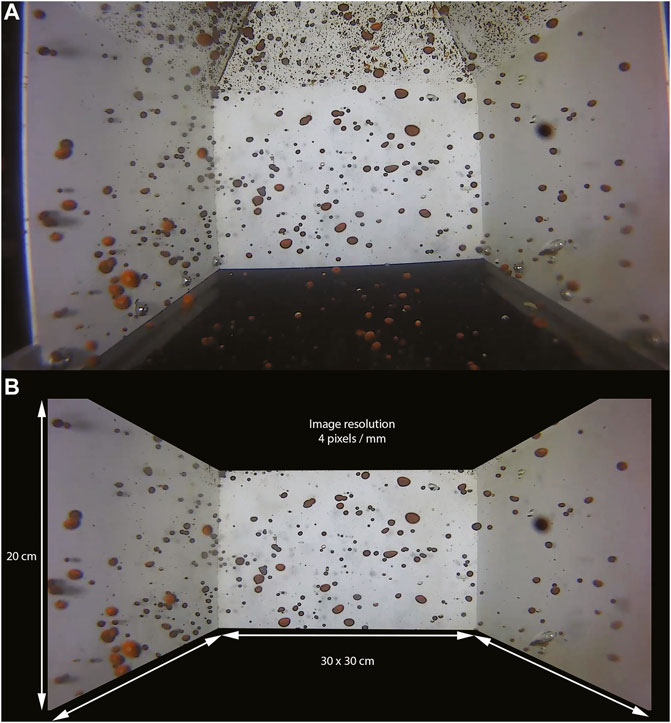
FIGURE 3. Example of the still images recorded with the bubblometer digital video camera: (A upper) unprocessed frame grab; (B lower) the same image after cropping to remove non-quantified portions of the image and rotating to correct camera placement, original Fig. 4.2 (Mason et al., 2019).
Post-containment estimates of bubble size for gas released from the separator were obtained from the video of bubbles passing in front of a panel with scale markings. This material was collected from the MV Brandon Bordelon ROV in January 2022. Frame captures were taken at intervals when visibility permitted, and bubbles were measured in comparison to the scale markings using Image-J.
Gas Analysis
Samples of gas captured in the water column by using the bubblometer and collected into pressure vessels at depth were transferred on the deck to evacuate foil gas bags with a valve containing a septum to allow subsampling. Triplicate, 10 μl aliquots of each gas bag sample were injected via a gas-tight syringe onto a HS-GC/FID (HP 5890) configured with a porous layer open tubular (PLOT) column to separate and quantitate the C1–C5 light hydrocarbon gases. Multiple injections of each gas bag sample were introduced into the GC/IRMS configured with a PLOT column to separate the C1–C5 hydrocarbon gases and determine their carbon isotopic ratios. A reference carbon dioxide standard (−37.5‰ versus PDB) was used to linearize the detector. An external standard containing all of the C1–C5 analytes of interest with known carbon isotopic ratios was used to verify the PDB accuracy +/1 1‰ of the GC/IRMS (Gaskins et al., 2019).
Image Processing for Bubble Quantification
The front of the ROV acted as a baffle that only allowed bubbles to enter the bubblometer chamber, where the camera system recorded images at constant scale and illumination. However, objects in its images appeared larger or smaller depending on their distance from the camera within the chamber. Calibration in a laboratory setting showed that the camera resolved 8 pixels/mm at the front of the chamber closest to the camera, 4 pixels/mm in the center, and 2 pixels/mm at the rear of the chamber, with no discernable distortion due to vertical position at a given distance. The single camera could not reliably determine the distance between it and an object within the chamber. It was assumed that bubble distributions within the chamber were uniformly random and a constant scale of 4 pixels/mm was used to estimate the size of bubbles, which unavoidably meant that there was a two-fold uncertainty in any estimate of bubble diameter and an ∼eight-fold uncertainty in an estimate for the volume of a spherical bubble, while most bubbles were somewhat elliptical in shape, with dimensions that tended to vary as the bubbles moved within the chamber. For these reasons, bubble sizes were estimated for confirmation of general impressions gained by comparing bubbles to adjacent objects of known size and to provide parameters for calibration of the acoustic surveying (MacDonald et al., 2019), but are not used as quantification of bubble volumes in this paper.
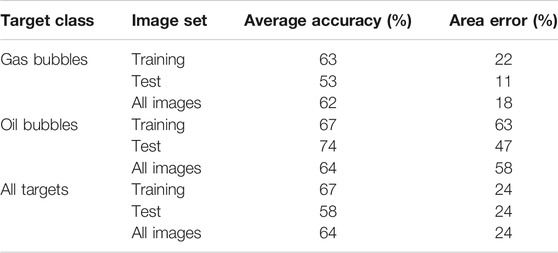
A neural network process called Object Detection was chosen for the detection and classification of the bubbles in the image samples and implemented with use of a Faster Region Convolutional Neural Network (Faster R-CNN) variant. The MATLAB© Computer Vision toolbox was used for performance of Faster R-CNN classification. Both the training set and test set are taken from the ground truth set. The training set uses 70% randomly assigned images, while the remaining 30% goes to the test set. The training process completed automatically by MATLAB generated a detector that can be used on any image, or a set of images, and it identifies, classifies, and measures their targets. Figure 4 shows examples of images processed by the algorithm. The detector was tested on the remaining 30% of the images. It shows an overall accuracy of 60%, which increases to 62% for oil bubbles (Table 1). Most of the error is attributable to false positives due to either overlapping detections or detections that were not considered in the training set.
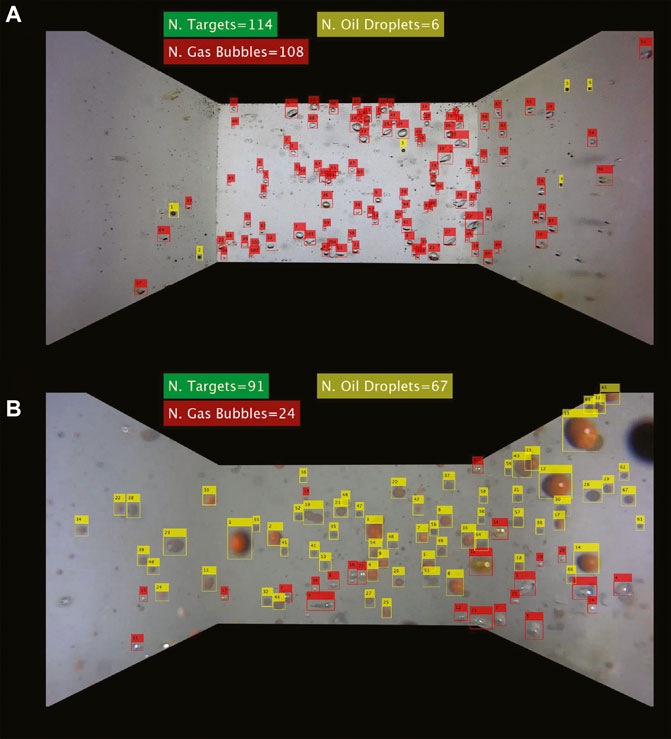
FIGURE 4. Classified bubblometer images: samples of detector results with predominantly gas targets (A upper) and predominantly oil targets (B lower), original Fig. 4.3 (Mason et al., 2019).
Two classes were selected for the targets: gas bubbles with a minor fraction of oil and oil bubbles assumed to be predominantly oil. A total of 68 cropped and prepared images were chosen, and bubbles were manually classified and stored as the ground truth set. Bubbles resolved with less than 8 pixels (nominally 2 mm) of radius were excluded to reduce process noise. Half bubbles, partially occluded bubbles, or bubbles too close to the black boundary were also left out of the training set for similar reasons.
Atmospheric Monitoring
The atmospheric concentration of methane was continuously measured with the use of a cavity ring-down spectrometer (CRDS) Picarro® G2203 Analyzer for CH4/C2H2 that drew air samples (4 Hz) from an intake tube located on the starboard side of the ship, 3 m above the water surface and below the level of the exhaust stacks of the vessel. The instrument was calibrated to gas standard following a three-point procedure (Piccaro, 2011). The length of the intake line introduced a 60 s lag between intake and measurement. Data were recorded during the entire time the vessels R/V Brooks McCall or M/V Brandon Bordelon were on station. Ship tracks for surveys during the 2018 and 2021 campaigns are shown in Supplementary Figure S1. Sample readings were georeferenced in real time using a GPS antenna connected to the computer of the CRDS. Identical instrumentation and collection procedures were used on the 2018 and 2021 expeditions.
Tracer Experiment
During the final day of operations in the 2018 expedition, a tracer release experiment was conducted in order to test whether methane concentrations in the air in the study area could be linked to the persistent hydrocarbon plume that reached the ocean surface near the toppled MC20 oil platform and also to establish the path and dispersion of methane gas in the area. Because the CRDS-Picarro 2,203 has the capability of detecting acetylene gas with a precision in the parts per million range, the tracer experiment also utilized this gas as a reference compound. The acetylene tracer release technique has been widely used in the quantification of fugitive methane in landfills (Mønster et al., 2014; Mønster et al., 2015). To adapt this technique for the open ocean, a floating raft was constructed which held a small acetylene tank. The acetylene tank was connected to a mass flow regulator to produce a constant release of tracer gas into the atmosphere (15 L/min). In addition, a meteorological station installed on the raft collected records of the ambient wind speed and direction, temperature, and humidity in the area during the controlled acetylene release event. The raft was moored, as close as was possible, to the area where the MC20 hydrocarbon plume reached the ocean surface. Once the raft was successfully deployed, the vessel drifted downwind to increase the chances of detecting both atmospheric methane concentrations and the known volume of tracer gas. In practice, the scope of the raft anchor line allowed it to drift away from the bubble surfacing area.
Inverse Plume Modeling
Inverse plume modeling combined with atmospheric methane concentrations is used to estimate methane emission rate from the hydrocarbon plume into the atmosphere. The employed approach originally presented in landfill applications (Kormi et al., 2017; Kormi et al., 2018; Ali et al., 2020) tackles the problem of determining a contaminant source emission rate for a given set of measurements. The Gaussian plume model is coupled with an optimization-based identification method, to estimate fugitive methane emissions. Methane concentration is used to infer emissions though dispersion modeling and optimization. This is achieved through tracing dispersed methane back to potential emission sources. In the subsequent sections, we briefly summarize this optimization-based approach (Silva et al., 2019) and refer the reader to the work of Kormi et al. (2017) and Kormi et al. (2018) for a more thoroughly detailed presentation of the method.
Input parameters of the methane emission estimation method include methane concentration measurements and locations along with meteorological conditions, the most important being wind speed and direction and temperature. An implemented code is used to generate multiple configurations of source positions and emission rates. Each sample configuration is evaluated through calculating the corresponding methane concentrations at each measurement point. This is carried out through the backward application of an atmospheric dispersion model. As such, source identification can be treated as an inverse optimization task where the objective is to obtain the configuration of sources (locations and emission rates) that best fits the measured concentrations. The performance of a source configuration is further evaluated through the difference between measured and predicted methane concentrations. To predict methane concentrations at locations where effective measurements are performed, an atmospheric dispersion model is needed. In the proposed method, modeling of methane dispersion is carried out using Gaussian dispersion Eq. 1. This equation models the dispersion of a non-reactive gaseous pollutant (here, methane) from an elevated point source. Eq. 1 predicts the steady-state concentration (C) in μg/m3 at a point (x, y, z) located downwind from the source.
In Eq. 1 “Q” is the emission rate (μg/s), “σy” and “σz” (m) are the horizontal and vertical spread parameters that are functions of wind distance “x,” respectively, and atmospheric stability is a measure of the resistance of the atmosphere to vertical air motion. Continuing, “u” is the average wind speed at stack height (m/s), “y” is the crosswind distance from the source to the receptor (m), “z” is the vertical distance above the ground (m), and “H” is the effective stack height (physical stack height plus plume rise) expressed in m.
The Gaussian dispersion equation uses a relatively simple calculation requiring only two dispersion parameters (σy and σz) to identify the variation of gas concentrations away from the diffusion source. These dispersion coefficients, σy and σz, are functions of wind speed, cloud cover, and surface heating by the Sun. Generally, the evaluation of the diffusion coefficients is based on atmospheric stability class. In the employed method, Pasquill–Gifford stability classes are used, and dispersion coefficients are calculated using the Briggs model (Briggs, 1965).
The optimization task is tackled using genetic algorithm routines in MATLAB. As a stochastic search method, including genetic algorithm optimization can efficiently explore complex and large solution space without getting trapped in low-quality minima. Although there is no guarantee of reaching a global optimum, near-optimal solutions are usually obtained.
Results
Surface Echosounder Surveys
A total of eight surface echosounder surveys were conducted between 1 and 7 September 2018. At least, one survey was conducted each day, except for 4 September, due to evacuation of the MC20 site during severe weather associated with Tropical Storm Gordon (composite displays of all survey results can be seen in Chapter 3 of the work of Mason et al. (2019)). Survey tracklines varied in number and orientation, depending on the orientation and extent of the hydrocarbon plume and the daily operating plan coordinated among research investigators (Supplementary Figure S1A). Along-track and cross-track observations of the plume in the SBES and MBES revealed two or more sub-plumes emanating from a seabed position within an erosional pit at the northwest corner of the platform jacket. Visually differentiating the components of the plume in the acoustic echograms depended on the trajectory of the plume in the water column and the orientation of the survey trackelines. The components of the plume showed differential rise rates consistent with faster rising gas bubbles separated from slower-rising oil bubbles. On some occasions, relatively low noise on the 200 kHz channel permitted detection of components of the plume with backscatter intensity relatively higher than backscatter intensity in the 120 kHz for portions of the plume, consistent with the expected backscatter intensity patterns of liquid-filled spheres of oil, i.e., oil bubbles. Similarly, the high-frequency 500 kHz M3 multibeam surveys provided further evidence of separate components of the plume consistent with separate oil and gas components in the plume.
Figure 5 shows the components of the echogram and multibeam survey results for operations on the evening of 5 September 2018, close in time to visual plume observations reported in Gas Bubbles in the Water Column. For this survey, the vessel tracked along current, starting north of the jacket and continuing along for approximately 1,000 m to the southwest (Figure 5A). A single ping from the multibeam swath shows the jacket and a cross section of the plume (Figure 5B). It is noticed how the plume appears truncated where the beam bisects it in midwater. The trackline composite shows the entire length of the plume originating near the base of the jacket and deflecting approximately 300 m SW before reaching the surface (Figure 5C).
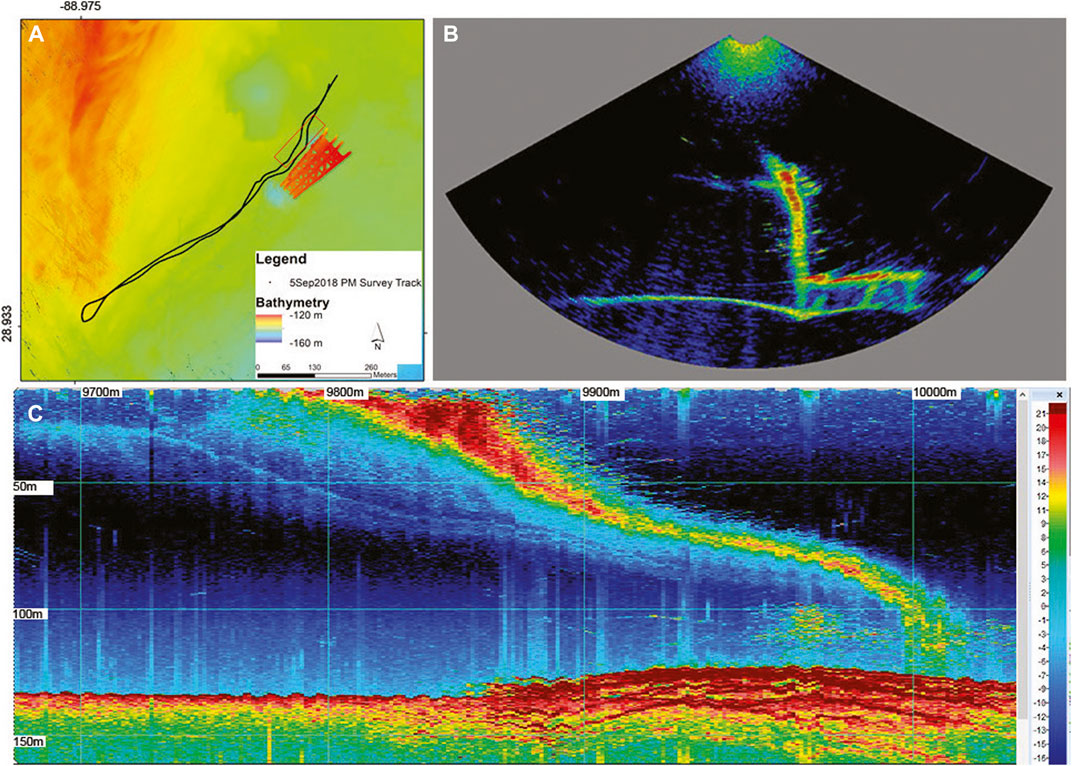
FIGURE 5. Map and sample echograms from the survey conducted on the evening of 5 September. (A upper left) Map of the echosounder survey; bathymetry is represented by the colored ramp, and the red box represents the approximate area shown in the maximum intensity echogram. (B upper right) A single ping from the multibeam swath. (C lower) Multibeam echogram shown as maximum intensity across the beam swath and compressed along the track to show the trajectory and extent relative to the jacket. Two plume components are visible in the lower echogram, original Fig. 3.9 (Mason et al., 2019).
Figure 6 shows the 3D interpreted components of the plume observed on 2 September 2018, when currents deflected the plume to the southwest. High-backscatter components appeared to diverge upwards from relatively lower-backscatter components, which were rising more slowly, consistent with lower buoyancy of oil bubbles compared with gas bubbles. A possible second divergence occurred within the high backscatter plume as it approaches the surface, suggesting the ongoing fractionation of gas and oil components occurring closer to the surface. Drone surveillance of the ship parked within the plumes as they surfaced showed the separation of gas-dominated and oil-dominated components of the plume along the length of the vessel. An additional, much fainter, plume target was observed on 2 September 2018 about 200 m NW of the erosion crater over the location of the platform’s original foundation and well template (Supplementary Figure S1C).
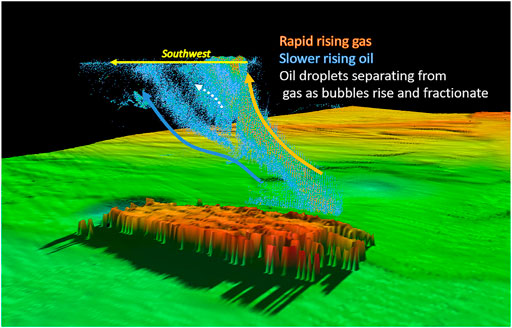
FIGURE 6. Three-dimensional model of the oil and gas plume on 2 September 2018: Relative backscatter intensity from the M3 multibeam is scaled as blue–orange: low–high. Arrows define the components of the plume. See text for explanation, original Fig. 3.16 (Mason et al., 2019).
ROV Sonar Surveys
The ROV collected clear images of the plume components and as they vented within a ∼10 m-wide and ∼2 m-deep erosion pit at the base of the platform jacket (Figure 7). Closer examination with the M3 sonar revealed four or five subcomponents of the plume: a pair of smaller plumes to the southwest of the erosional pit and two separate larger plumes to the north. A fifth feature was less defined between the pair of smaller plumes and the southernmost of the two larger plumes. The characteristics of the backscatter intensity suggested the smaller pair was composed of oil, whereas the ones with higher backscatter intensity were composed of gas.
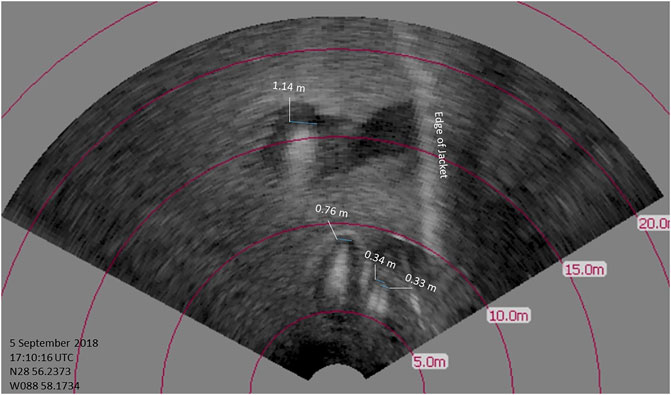
FIGURE 7. Imaging sonar perspective of erosion crater and plume sources from the ROV: MC20 jacket in the background and multiple plumes observed in the foreground, original Fig. 3.21 (Mason et al., 2019).
Gas Bubbles in the Water Column
A total of 5,881 gas bubbles and 6,258 oil bubbles were counted and measured based on image samples collected by using the bubblometer. Combining the depth of the vehicle as image collections were made with its navigation track meant that each image sample, and the number of bubbles detected in that sample, could be mapped in three dimensions (Figure 8). Bubble counts and densities were used to fit a cross section that segments the high-bubble-density core of the plume, shown as the red, blue, and yellow polygons in Figures 8B–D. The volume of this “core” plume region is the height of each depth region multiplied by the core cross section. The results showed that bubble abundance was variable among image samples, while the apparent density of bubbles observed was different within different depth ranges; that is, image samples within the erosion crater (>135 m), between the seafloor and the upper extent of the platform (135–125 m) and in the water column above the jacket (<125 m), tended to show different bubble abundances (Table 2). The number of bubbles per sample could be extrapolated to estimate the abundance of bubbles per m3 according to the volume of the bubblometer’s imaging chamber (0.018 m3).
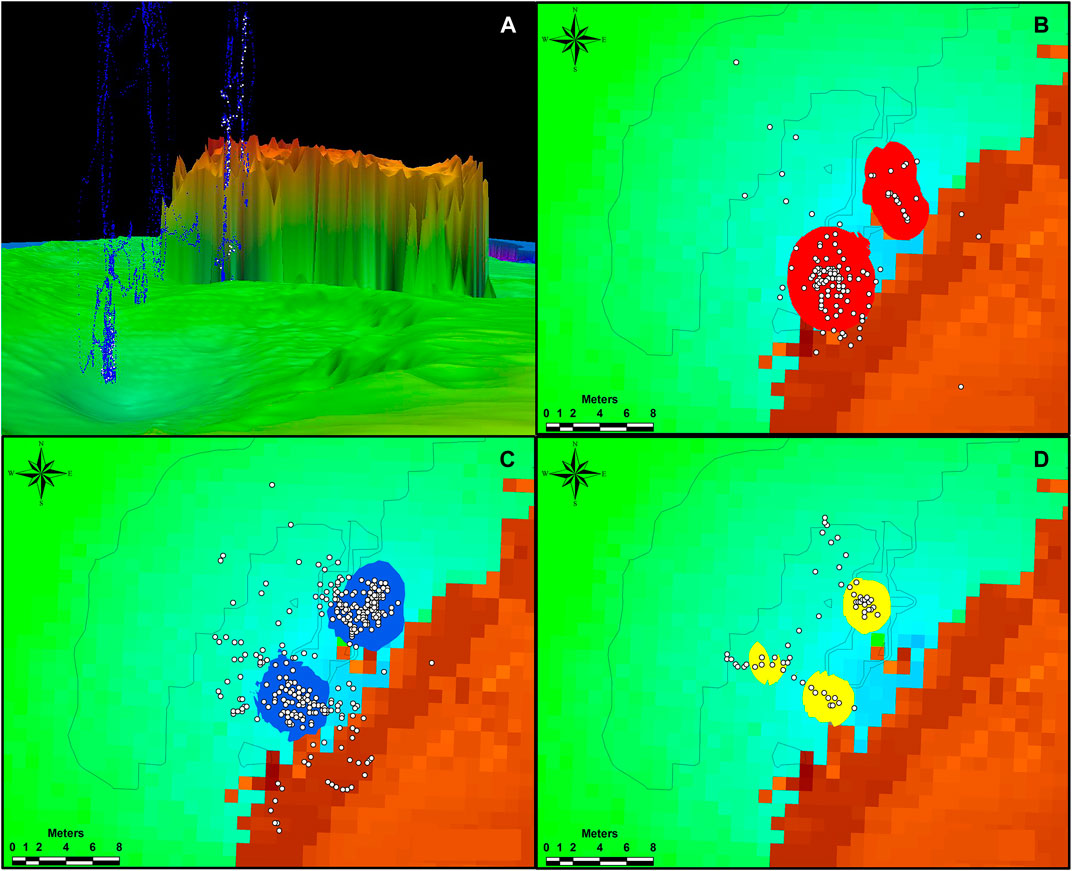
FIGURE 8. Locations of image samples from the plume: (A upper left) vertical plot, blue points show the ROV locations during sampling and white points show where video image samples were taken; outline of the well jacket is approximately 10 m above the seabed (green); (B upper right) samples from the plume in the crater with the outline of the kernel polygon for this interval; (C lower left) samples from the plume in the benthic layer with the outline of the kernel polygon for this interval; and (D lower right) samples from the plume in midwater with the outline of the kernel polygon. Brown color represents the location of the collapsed well jacket, original Fig. 4.11 (Mason et al., 2019).
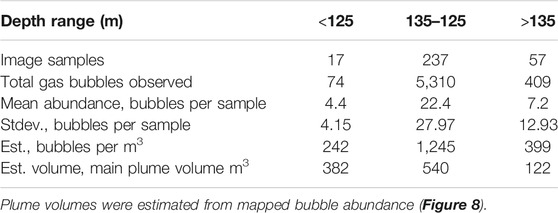
TABLE 2. Summary of gas bubble abundances observed in image samples from the bubblometer in three depth ranges of hydrocarbon plume, as counted by the R-CNN algorithm.
Bubble size and size frequency distributions were estimated for the observations prior to and after installation of the containment system. The pre-containment mean bubble diameter was 8.1 mm (n = 5,881: median 7.2 mm, stdev 3.16) for bubbles observed at water depths from >135 to 120 m; the post-containment mean bubble diameter was 7.4 mm (n = 585: median 6.7 mm, stdev 3.13) for bubbles observed at 120 m. Size frequency distributions were similar for the two datasets (Supplementary Figure S2). There were small differences. The 2018 distribution had several folds more of the 2.5 mm bubbles, and peaked at 7.5 mm, while the 2022 distribution peaked at 5 mm. This type of differences may not always be negligible in terms of bubble dissolution (see the work of McGinnis et al. (2006), for example).
The pre-containment collections were slightly skewed toward bubbles of large diameter (>20 mm) compared with post-containment observations. Bubble measurement procedures for the post-containment observations were based on ROV video under marginal water clarity. Both sets of measurements were approximate due to scaling uncertainty.
Bubble gas analysis
Analysis of the gas samples collected in midwater with the use of the pressure chamber showed that the gas bubbles comprised predominantly methane with a mixture of higher hydrocarbons consistent with thermogenic gases typical of the Gulf of Mexico (Table 3). Additional details regarding hydrocarbon analysis from MC20 can be found in the work of Gaskins et al. (2019).

TABLE 3. Results of gas analysis for samples collected from the mid-water column (approximately 125 m) into pressure vessels on the bubblometer.
4.5 Water Column Methane Concentrations
The concentration of methane in all water samples, including the 2018 and 2021 Niskin samples and the 2018 bubblometer water samples, spans in five orders of magnitude (Figure 9), from an expected background level of 0.003 µM CH4, for seawater equilibrated with ambient air, to extreme values of >60 µM CH4 measured in water samples from the bubblometer pressure cylinders and associated most closely with the copious flux of oil. Generally, the 2018 Niskin samples, the collection of which was targeted using the acoustic signal of the plume rather than visual observation of bubbles in the water column, showed methane levels that were slightly elevated versus expected background, consistent with the influence of the plume. The 2021 Niskin samples were collected using the ROV video feed to verify the presence of bubbles. The reader should recall that these bubbles had passed through a passive separator that removed oil and allowed gas to pass through unimpeded. Reference samples, collected >30 m from the bubble release point, with no bubbles visible, showed background concentrations of methane. The highest methane concentrations in the 2021 collections (∼1 µM CH4) were observed in samples collected among copious visible bubbles at depths of 123 m directly above the release point and 82 m amid copious visible bubbles. Overall, Niskin samples from the bubble plume taken at >30 m depth in 2021 (n = 20: mean = 0.550 µM CH4, stdev = 0.680) were significantly greater (p < 0.005) than the comparable samples from 2018 (n = 34: mean = 0.014 µM CH4, stdev = 0.0157). Extreme methane concentrations in the bubblometer water collections from 2018 reflect collection into a pressure cylinder that includes a head volume of gas and liquid oil.
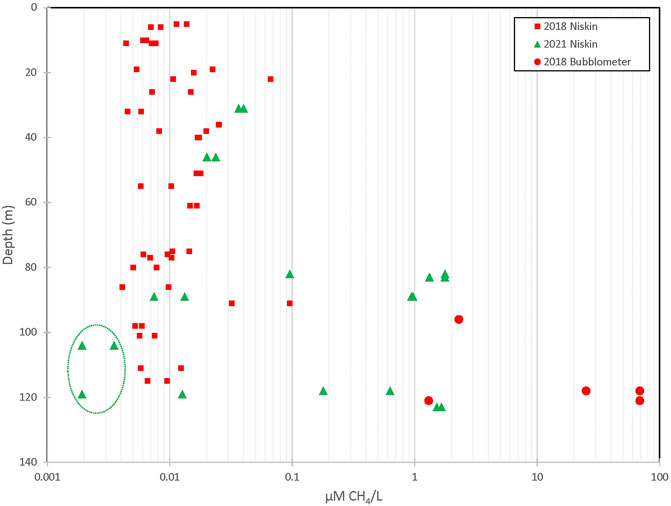
FIGURE 9. Methane concentrations in the water column: samples from 2018 (red squares) were collected with Niskin bottles deployed within the oil and gas plume profile and with the pressurized cylinders sealed at depth by using the bubblometer (red circles). Samples from 2021 (green triangles) were collected by Niskin bottles deployed from an ROV in the oil-free gas plume with bubble presence verified by a real-time video; background reference samples were collected at a location ∼35 m from the bubbles source (dashed circle).
Atmospheric Methane Measurements
The cavity ring-down spectrometer (CRDS) was in near-continuous operation recording at 4 Hz the atmospheric concentrations of methane (ppmv) at 3 m above the ocean surface in the vicinity of the Taylor platform site in MC20 for 1–7 September 2018, except for about 36 h when the ship had to vacate during the passage of Tropical Storm Gordon. The CRDS also operated continuously during 13–17 November 2021, except for a 1 h restart of the instrument during 15 November, also at 3 m above the ocean surface. These measurements are summarized in Table 4. Note that the CRDS recorded a slightly elevated average methane concentration in 2021 compared to 2018. The 2021 summary data are presented with and without the interval when oil was being pumped into transfer tanks on the ship deck. The major difference between the two CRDS surveys was the broad distribution of peak methane concentrations in 2018. Figure 10 shows the comparative plots of mean atmospheric methane concentrations observed over the MC20 site; Figure 10A shows the results for 2018 and Figure 10B, for 2021—excluding the period when oil was being pumped up to the ship. Note that, during 2018, acoustic surveys and other operations meant that the ship’s track covered a much broader area at the MC20 site, while in 2021, broader area surveys were more curtailed and the ship was mostly positioned directly over the platform wreckage (Supplementary Figure S1).

TABLE 4. Summary statistics for atmospheric methane concentrations (ppmv) recorded from the cavity ring-down spectrometer in September 2018 and during the 2021 cruise of opportunity.
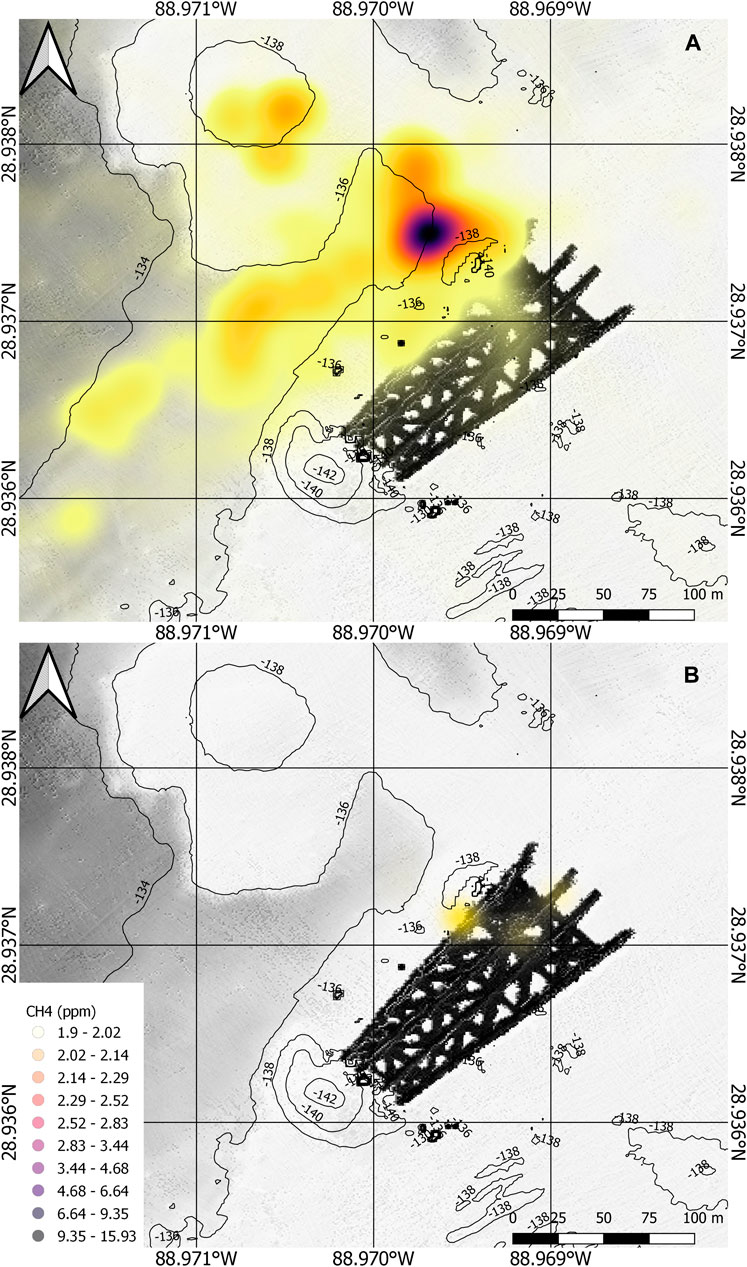
FIGURE 10. Heat maps of methane concentrations: CRDS readings recorded 9 m above sea surface over the MC 20 site. (A upper) 2018, before oil containment; (B lower) 2021, after oil containment.
Results were strongly dependent on the circumstances of hydrocarbon release at the seafloor and operations of the vessels. During 2018, gas and oil rose unimpeded to the surface, with water column currents largely slack or moderate (<0.3 m/s). In April 2019, authorities installed the containment system that diverted oil from the hydrocarbon plume into storage tanks. Oil recovery rates from these storage tanks subsequently showed that oil being released into the water column and rising to the surface would have exceeded 4.5 m3/d during 2018 (O'Reilly, 2020). Oil was continuously observed over the site during 2018 and produced the large surface oil slicks typical of this spill (Daneshgar Asl et al., 2015). During 2021, in contrast, there was little visible oil that rose to the surface. However, large amounts of oil were pumped up from the underwater storage tanks to the ship and into transport tanks that vented to the air. The pump-off period lasted 12 h and was followed by an exercise to moor a CTD so that it was suspended over the erosion crater and under the containment. Figure 11 shows the annotated timelines of CRDS observations over the MC20 sites during 2018 and 2021.
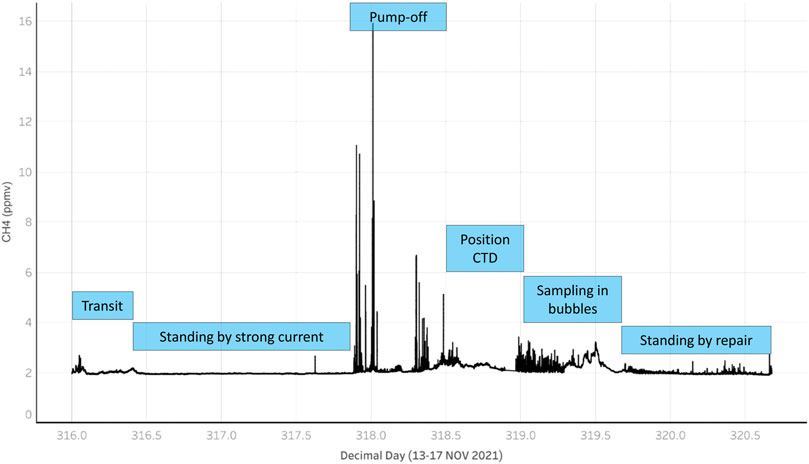
FIGURE 11. Annotated timeline of CRDS measurements during the 2021 cruise of opportunity: major methane peaks confined to periods when oil was pumped into storage tanks or released due to operations under the containment dome. Minor methane peaks observed with the ship stationary over the bubble stream.
Tracer Experiment and Plume Modeling
During the acetylene tracer experiment conducted in 2018 and the routine CRDS measurements, background acetylene concentrations fluctuated between 0 and 0.9 parts per billion (ppb). During the tracer experiment, when acetylene was being released from the raft tethered over the wreck site at a controlled rate of 15 L/min (0.29 g/s at STP), three major spikes on the CRDS for acetylene were detected with values that exceeded 200 ppb of acetylene in the air. The highest concentration of the acetylene tracer gas was detected only a few meters away from the raft deployment in the “bubbling zone” (1,024.2 ppb), and after that, two more spikes on the tracer gas were detected downwind (11.16 knots, ESE) at approximately 310 and 430 m away from the deployment site, respectively. Because the vessel R/V Brooks McCall was drifting downwind during the tracer study raft deployment, there were at least three opportunities where the tracer spikes almost perfectly matched the relatively high measurements of methane in the air, further confirming that the source of additional methane in the air was sourced from the “bubbling zone” where the hydrocarbon plume was actively reaching the ocean surface (Supplementary Figure S3).
Tracer gas (acetylene) air concentration measurements were also employed to calibrate/validate the inverse plume measurements method that is proposed to estimate methane emission rate estimates. Acetylene measurements are used as an input for the method in order to test its ability to predict the actual emission rate of the tracer gas (15 L/min). Wind direction and speed, along with a set 4,175 data points (acetylene concentrations and measurement locations), were used as inputs for the identification method. The average acetylene emission rate predicted by the method was equal to 0.26 g/s which approximately corresponded to the actual emission rate of 15 L/min (0.29 g/s at STP). The results obtained with the tracer (acetylene) gas release, in a controlled manner, show that the inverse plume modeling method can be used to estimate methane emission rates under marine conditions.
The inverse plume modeling combined with atmospheric methane concentrations was used to estimate transfer from the hydrocarbon plume into the atmosphere. These estimates provide an average methane emission rate equal to 9 g/s with a standard deviation of 1.1. This corresponds to a discharge equivalent to 0.8 t CH4/d. However, it is important to note that this estimation method is prone to variability in wind direction and speed.
Discussion of Results
The fate of hydrocarbon gas released from the seabed is an important research question because seeps are common in the coastal ocean and methane is a potent greenhouse gas. Moreover, recent history shows that oil and gas spills originating from the seafloor can be a significant environmental hazard. Natural gas seeps can be challenging to study because they are often cryptic and ephemeral. These results of this study offer insights into this process and the means for investigating it; however, circumstances of the release we studied constrain these insights in significant ways. The release rate of methane and higher hydrocarbon gases in MC20 was one component of long-running oil spill that discharged in excess of 4.5 m3/d (https://couvillionmc20response.com/). This spill, although presently mitigated by the containment system, will continue until the wells can be permanently plugged with cement through difficult and costly engineering. The platform and its wells were aged at the time (2004) when a hurricane and mudslide destroyed the structure and initiated the spill. This aged condition is shared by hundreds of other production platforms and a vast network of pipelines along the northern margin of the Gulf of Mexico in an era when intense hurricanes are expected to become more prevalent (Knutson et al., 2020) and potential for slope instability under storm conditions is increasingly recognized (Fan et al., 2020). It is to be hoped that this accidental experiment will not be repeated.
Findings made during the 2018 research expedition led to installation of the containment system that mitigated the release of oil. However, it is concerning that nearly 15 years elapsed between the onset of the spill and collection of data that definitively demonstrated the magnitude of the problem. Acoustic surveys in 2018 did reveal the source and water column characteristics of the hydrocarbon plume in MC20, in particular, how currents influenced the path of the plume and the separation of oil and gas components (Figures 5, 6). However, although previous acoustic survey had also detected persistent hydrocarbon plumes emanating from the platform wreckage, the volume of oil they contained and the geochemical source of gas in the plume were disputed (O’Reilly, 2020). The dispositive observations that led to containment were a direct visual confirmation of copious oil in the plume and collection of gas for chemical analysis. The gas was shown to be a reservoir-sourced mixture of thermogenic hydrocarbons, rather than biogenic methane possibly sourced from microbial degradation of organic material (Table 3). The method used to collect gas mid-water and store it under pressure requires straightforward engineering that could be adapted for greater water depths.
The visualization chamber of the bubblometer provided replicated samples for determining the density of gas bubbles, with the application of a machine-learning algorithm that counted individual targets. Integrating these results with the 3D location of the ROV showed that the density of bubbles in the plume was affected by where in the water column it was sampled (Table 2). In the two erosion craters, the ROV sonar survey showed that bubbles were released from several individual vents (Figure 7). Similar venting has been reported from natural seeps (De Beukelaer et al., 2003; Johansen et al., 2014; Sahling et al., 2016; Johansen et al., 2020; Meurer et al., 2021). Under such circumstances, bubble density would be locally variable. Above the crater, but in the lee of the platform wreckage, the individual bubble streams from the vents merged into larger plumes that nonetheless reflected the discrete origins from the two craters. The density of bubbles was the greatest between the seafloor and the top of the platform wreckage, possibly because of turbulence caused by the structure. Bubble density decreased abruptly above the level of the wreckage, where moderate currents and mixing in the water column dispersed the plume (Figure 8 and Table 2). The origin, dispersion, and separation of oil and gas components of the plume detected by visual means were consistent with its acoustic signatures (Figures 5, 6).
Bubble size is an important consideration in the rise speed of bubbles, the rate of mass transfer from the ascending bubbles into seawater, and potential for gas transfer to atmosphere. Installation of the containment system diverts the gas bubbles through a separator before they are released to the water column (Couch, 2010), while the pre-containment releases were through seafloor sediment. Average bubble diameter was 9% smaller for the
Water samples collected by Niskin bottles and from the bubblometer pressure chambers showed a five order of magnitude range of methane concentrations (Figure 9). Water column methane concentrations in the bubble plumes were elevated above seawater ambient (for 100–120 m depth) in 2018 and more elevated in the visually targeted 2021 collections. Previous results suggest that methane, being undersaturated in seawater, should rapidly be exchanged for nitrogen and oxygen as methane bubbles rise in the water column (McGinnis et al., 2006; Rehder et al., 2009). The best available measurements of bubble size (Supplementary Figure S2) are comparable to “larger” bubble diameters (8.5 mm) modelled by McGinnis et al. (2006) for pure methane rising from 90 m (McGinnis et al., 2006, Figure 11). Those results predicted >95% of original methane mass due to dissolution over this transit. Average methane concentrations in 2021 were significantly greater (p < 0.005) by nearly two orders of magnitude compared with Niskin samples from 2018 (Figure 9). Bubblometer samples were collected and returned to the surface at near in situ pressure in the collection cylinders and then decanted into sample vials with minimum degassing; they reflected the greater saturation of methane in seawater at ∼100 m depth. It was not possible to replicate exactly the collections and observations made in 2018 prior to installation of the containment system with observations of gas released from the separator apparatus, but measurements indicate generally higher concentrations when oil was separated from the gas. Previous studies at oil seeps (Leifer and MacDonald, 2003) have speculated that oil coatings in bubbles could retard this process. This being the case, one would expect water in a bubble plume to have lower concentration of methane if the bubbles were oil coated, as was the case in 2018, than they would if the bubbles were effectively oil free. Therefore, the differences in water column methane concentrations between the 2018 (oily) and 2021 (unoiled) Niskin samples are consistent with reduced gas exchanged in oil-coated bubbles. However, one should consider the fact that the 2021 samples were visually targeted and the 2018 samples were not included while evaluating this result.
The most pronounced difference between observations in 2018 and 2021 was the detection of atmospheric methane concentrations (Figure 10). When methane above background levels was detected in both years, detection took the form of transient peaks that rose to maxima over a matter of seconds and then declined (Figure 11 and Supplementary Figure S3). During the 2018 expedition, peaks that were as much as five-fold greater than background (∼10 ppmv) were detected with high frequency, particularly when the vessel was loitering over the plume source. During the 2021 cruise of opportunity, major methane peaks were only detected when oil was being pumped into the transfer tanks on the deck or reaching the ocean surface due to operations under the containment dome (Figure 11). However, moderate methane detections (∼3.5 ppmv) continued while the ship was parked directly over the bubble stream for collection of the Niskin samples, so transfer of methane to the reservoir was substantially reduced. What caused this change?
The gas content of oil is of concern for safe management of the product on offshore platforms, particularly for volatile oils, but is of lesser operational interest for the so-called black oil, which supports gas to oil ratios of <300:1. Daily production from the Taylor platform prior to its destruction comprised 190 m3 oil and 1.7 × 10⁸ m3 gas (Bryant et al., 2020), but oil production was well past peak levels and likely comprised black oil. General material-balance equations indicate that black oil should retain a GOR of ∼15:1 after transit to the surface, but the GOR would decline toward zero as the oil degassed over time (McCain, 1991). This would explain the methane peaks observed while oil stored in the containment system was venting from storage tanks on the ship during 2021. These results indicate that methane transfer to the atmosphere was most pronounced when oil was a major component of the hydrocarbon plume that reached the surface, but it also occurred at a reduced level when oil was removed from the plume. Detection of major methane peaks during the 2021 oil pump-off period suggests that the oil itself may be as or more important a vector for transferring methane to the atmosphere compared with oil-coated bubbles. Although this was a vigorous plume of methane, its footprint on the surface was small. Detection of methane from marine seeps may be highly dependent on positioning the detector directly over the surfacing bubbles.
The tracer experiment during the 2018 cruise demonstrates that eddy-diffusion methods used to estimate methane fluxes can be applied in marine settings under favorable circumstances. We assume that the bubble-surfacing location was reasonably constant during the ∼2.5 h experiment; however, the raft that deployed the tracer release did move on its anchor line with shifting wind direction. The most useful measurements occurred when the methane source, tracer source, and detector were aligned (Supplementary Figure S2). The experiment could readily be replicated for submarine sources at depths of ∼100 m and would be improved by positioning the raft with tracer release more directly in the bubble-surfacing location.
Methane emissions from oceanic sources are challenging to measure directly, and it is informative to compare these results, made under relatively controlled conditions at moderate depth, with observations from methane seeps and leaks across a range of water depths in the Gulf of Mexico. A methane and oil seep at the Chapopote asphalt volcano in 3,400 m produced multiple acoustic bubble flares and 30 μM/L methane concentrations at depth; the flares and methane concentrations dissipated before reaching the surface, while associate oil formed persistent slicks (Römer et al., 2019). Researchers who used a submersible to visually track bubbles rising from the 540 m seep at Bush Hill measured near-surface methane concentrations up to 1,000 time saturation with atmospheric concentration (Solomon et al., 2009); however, oil contamination of the submersible may have affected results (personal observation). Hu et al. (2012), who collected pumped water samples from the surface interface, failed to confirm this result at Bush Hill and a second ∼1,000 m seep. Meurer et al. (2021), sampling with MET sensors deployed on gliders over Bush Hill, measured methane concentrations of up to 0.4 μM/L, well below the observations of Solomon et al. (2009). Notably, results from the work of Yvon-Lewis et al. (2011), using techniques to similar to those used by Hu et al. (2012) and Ryerson et al. (2011), using airborne measurements, suggested that oil reaching the surface (∼3,000 m3/d) from the Deepwater Horizon oil spill, which leaked from 4,500 m depth, was a negligible source of methane to air.
While the aforementioned studies measured concentrations to infer source magnitude, other studies have attempted to integrate emission or dissolution processes across seep areas to estimate fluxes. At GC600, a 1,100 m seep in the Gulf of Mexico marked by prolific oil slicks (Garcia-Pineda et al., 2009), Johansen et al. (2020) integrated sub-bottom profiles with mapping and surveillance of bubble venting and other seep features to estimate a flux of ∼4 × 10⁶ mol/y from a seep area of ∼0.5 km2. However, this budget was for methane released to the water and did not quantify the gas and oil reaching the surface over the site. In a study from the Comea seep in the Timor Sea at water depth (84 m), Brunskill et al. (2011), captured seep bubbles from the water column to measure directly their methane content. They found concentrations of ∼0.7 μM/L in the water associated with “bubble streams,” findings quite similar to present results. Integrating across a carbonate hard ground that was the source of the bubbles, they estimated a flux to the atmosphere of 0.13–1.3 t CH4/d from a seep area of 0.7 km2. In terrestrial landfills, where the measurement challenges for estimating methane flux are quite different from those at marine seeps and leaks, results are quite dependent on soil cover over landfill material (O'Brien, 2014). Investigating areas with fine clay cover, the author reported a flux of 2.1 t CH4/d from a landfill area of 0.37 km2.
Converting these estimates to commonly used flux units yields 0.19–1.9 and 5.7 g CH4/m2/d for the Comea seep and a well-covered landfill, respectively. The discharge we report for the 2018 observations was 0.8 t CH4/d. At MC20, gas was emitted from a seafloor erosion crater ∼10 m in diameter. This source produced a flux to the atmosphere from ocean surface of ∼10,000 g CH4/m2/d. Why is there such a huge discrepancy? A natural marine seep and a municipal landfill are actually not that dissimilar. Both generate methane from buried organic material in a dispersed bioreactor. The stable isotope ratios for the methane components of the gas samples were also consistent with a mixed thermogenic and biogenic source and with an origin within the reservoirs produced by the oil platform prior to its destruction. Emissions at MC20 are well leaks that funnel thermogenic gas and oil from multiple reservoirs (Stout and Litman, in press), primarily through pipes that are largely intact reaching to a single point on the seabed. However, the MC20 site also includes a secondary, much smaller bubble source from the well template (Supplementary Figure S1C), which was possibly detected as an anomaly in the atmosphere methane concentrations recorded by the CRDS (Figure 10A). Brunskill et al. (2011) found measurable atmospheric methane associated with plugged and abandoned wells in the North Sea and suggested that “drilling induced fractures” around well boreholes are persistent seep conduits. They conclude that plugged and abandoned wells might be a source of methane to the water column, but not significant for greenhouse processes. Similar investigations of the northern Gulf of Mexico energy infrastructure across the continental shelf are indicated. A greater concern, however, is the vulnerability of the aging array of wells and pipelines to slope instability and hurricane impacts (Nodine et al., 2007). This is particularly true in view of how difficult it has been to stop the leaking wells at MC20. In balance, the literature indicates that bubbles emitted from deep (>500 m) marine sources principally contribute methane to the ocean, not the air, whereas this study and similar investigations (Brunskill et al., 2011; Böttner et al., 2020) show that methane can reach the atmosphere from sources ∼100 m deep. Oil emitted by seeps or leaks is an additional source that should be considered in light of the abundant oil seeps in the Gulf of Mexico (MacDonald et al., 2015), the Congo Basin (Jatiault et al., 2017), and elsewhere.
Data Availability Statement
The raw data supporting the conclusions of this article will be made available by the authors, without undue reservation.
Author Contributions
MS and CO provided 2018 data collection at sea, geospatial modeling, and contributions to text. CO measured bubble sizes in 2022. CR provided custom R-CNN bubble counting algorithm and contributions to text. NA and TA provided inverse plume modeling and contributions to text. IM provided 2018 and 2021 data collection at sea and wrote the paper.
Funding
The 2018 survey was jointly funded by the U.S. Department of the Interior, Bureau of Safety and Environmental Enforcement, and the U.S. Department of Commerce, National Oceanic and Atmospheric Administration, through Interagency Agreement E18PG00016 and TDI-Brooks International. The 2021 data collection was made possible by the support to IM from the Environmental Enforcement Section, Environment and Natural Resources Division, United States Department of Justice. Additional support to MS and CO was extended from ExxonMobil Upstream Research Co., Gulf of Mexico Seeps Study.
Conflict of Interest
The authors declare that the research was conducted in the absence of any commercial or financial relationships that could be construed as a potential conflict of interest.
The handling Editor declared a past co-authorship with one of the authors IM.
Publisher’s Note
All claims expressed in this article are solely those of the authors and do not necessarily represent those of their affiliated organizations, or those of the publisher, the editors, and the reviewers. Any product that may be evaluated in this article, or claim that may be made by its manufacturer, is not guaranteed or endorsed by the publisher.
Acknowledgments
The authors gratefully acknowledge the 2018 expedition team and crew of R/V Brooks McCall and, especially, A. Mason and C. Taylor from the NOAA for their essential contributions to the 2018 expedition and the acoustic survey results presented in this paper. B. Bernard and M. Gaskins of TDI-Brooks International provided logistic support and hydrocarbon gas analysis. J. Chanton provided analysis and insights regarding methane concentrations in water samples. W. Meurer and L. Zhao of ExxonMobil provided insights regarding gas: oil transport processes and application of the McCain (1991) model. IM thanks D. Hoffman and the Couvillion engineering team for generous assistance during the 2021 and 2022 operations on M/V Brandon Bordelon.
Supplementary Material
The Supplementary Material for this article can be found online at: https://www.frontiersin.org/articles/10.3389/feart.2022.833661/full#supplementary-material
References
Bel Hadj Ali, N., Abichou, T., and Green, R. (2020). Comparing Estimates of Fugitive Landfill Methane Emissions Using Inverse Plume Modeling Obtained with Surface Emission Monitoring (SEM), Drone Emission Monitoring (DEM), and Downwind Plume Emission Monitoring (DWPEM). J. Air Waste Manag. Assoc. 70 (4), 410–424. doi:10.1080/10962247.2020.1728423
Böttner, C., Haeckel, M., Schmidt, M., Berndt, C., Vielstädte, L., and Kutsch, J. A. (2020). Greenhouse Gas Emissions from marine Decommissioned Hydrocarbon wells: Leakage Detection, Monitoring and Mitigation Strategies. Int. J. Greenhouse Gas Control. 100. doi:10.1016/j.ijggc.2020.103119
Brunskill, G. J., Burns, K. A., and Zagorskis, I. (2011). Natural Flux of Greenhouse Methane from the Timor Sea to the Atmosphere. J. Geophys. Research-Biogeosciences 116. doi:10.1029/2010jg001444
Bryant, W. L., Camilli, R., Fisher, G. B., Overton, E. B., Reddy, C. M., Reible, D., et al. (2020). Harnessing a Decade of Data to Inform Future Decisions: Insights into the Ongoing Hydrocarbon Release at Taylor Energy's Mississippi Canyon Block 20 (MC20) Site. Mar. Pollut. Bull. 155. doi:10.1016/j.marpolbul.2020.111056
Couch, W. (2010). System and Method for Underwater Oil and Gas Separator. United States patent Appl. US 20100038324A1.
Court of Appeals for the Federal Circuit, (2020). "Taylor Energy Company LLC V. United States, 19-1983 (Fed. Cir. 2020)". (
Daneshgar Asl, S., Amos, J. F., Woods, P., Garcia-Pineda, O., and MacDonald, I. R. (2015). Chronic, Anthropogenic Hydrocarbon Discharges in the Gulf of Mexico. Deep Sea Res. Part Topical Stud. Oceanography 129, 187–195. doi:10.1016/j.dsr2.2014.12.006
De Beukelaer, S. M., MacDonald, I. R., Guinnasso, N. L., and Murray, J. A. (2003). Distinct Side-Scan Sonar, RADARSAT SAR, and Acoustic Profiler Signatures of Gas and Oil Seeps on the Gulf of Mexico Slope. Geo-Marine Lett. 23 (3-4), 177–186. doi:10.1007/s00367-003-0139-9
Dickens, G. R., Oneil, J. R., Rea, D. K., and Owen, R. M. (1995). Dissociation of Oceanic Methane Hydrate as a Cause of the Carbon-Isotope Excursion at the End of the Paleocene. Paleoceanography 10 (6), 965–971. doi:10.1029/95pa02087
Eckle, P., Burgherr, P., and Michax, E. (2012). Risk of Large Oil Spills: A Statistical Analysis in the Aftermath of Deepwater Horizon. Environ. Sci. Tech. 46 (23), 13002–13008. doi:10.1021/es3029523
El bani Altuna, N., Rasmussen, T. L., Ezat, M. M., Vadakkepuliyambatta, S., Groeneveld, J., and Greaves, M. (2021). Deglacial Bottom Water Warming Intensified Arctic Methane Seepage in the NW Barents Sea. Commun. Earth Environ. 2 (1), 9. doi:10.1038/s43247-021-00264-x
Elderfield, H., and Schultz, A. (1996). Mid-ocean ridge Hydrothermal Fluxes and the Chemical Composition of the Ocean. Annu. Rev. Earth Planet. Sci. 24, 191–224. doi:10.1146/annurev.earth.24.1.191
Fan, W. Y., McGuire, J. J., and Shearer, P. M. (2020). Abundant Spontaneous and Dynamically Triggered Submarine Landslides in the Gulf of Mexico. Geophysical Research Letters 47(12). doi:10.1029/2020gl087213
Feng, D., Chen, D., Peckmann, J., and Bohrmann, G. (2010). Authigenic Carbonates from Methane Seeps of the Northern Congo Fan: Microbial Formation Mechanism. Mar. Pet. Geology. 27 (4), 748–756. doi:10.1016/j.marpetgeo.2009.08.006
Fu, X., Waite, W. F., and Ruppel, C. D. (2021). Hydrate Formation on Marine Seep Bubbles and the Implications for Water Column Methane Dissolution. J. Geophys. Res. Oceans 126 (9), e2021JC017363. doi:10.1029/2021JC017363
Garcia-Pineda, O., MacDonald, I., Zimmer, B., Shedd, B., and Roberts, H. (2010). Remote-sensing Evaluation of Geophysical Anomaly Sites in the Outer continental Slope, Northern Gulf of Mexico. Deep-Sea Res. Part II-Topical Stud. Oceanography 57 (21-23), 1859–1869. doi:10.1016/j.dsr2.2010.05.005
Garcia-Pineda, O., Zimmer, B., Howard, M., Pichel, W., Li, X., and MacDonald, I. R. (2009). Using SAR Images to Delineate Ocean Oil Slicks with a Texture Classifying Neural Network Algorithm (TCNNA). Can. J. Remote Sensing 35 (5), 411–421. doi:10.5589/m09-035
Gaskins, M., Bernard, B., and Brooks, J. M. (2019). “Chapter 6: Chemical Analysis of Gas Samples Collected from the MC20 Leak in the Northern Gulf of Mexico,” in An Integrated Assessment of Oil and Gas Release into the Marine Environment at the Former Taylor Energy MC20 Site( (USA: NOAA National Ocean Service, National Centers for Coastal Ocean Science), 71–78.
Hu, L., Yvon-Lewis, S. A., Kessler, J. D., and MacDonald, I. R. (2012). Methane Fluxes to the Atmosphere from deepwater Hydrocarbon Seeps in the Northern Gulf of Mexico. J. Geophys. Research-Oceans 117. doi:10.1029/2011jc007208
Jatiault, R., Dhont, D., Loncke, L., and Dubucq, D. (2017). Monitoring of Natural Oil Seepage in the Lower Congo Basin Using SAR Observations. Remote Sensing Environ. 191, 258–272. doi:10.1016/j.rse.2017.01.031
Johansen, C., Macelloni, L., Natter, M., Silva, M., Woosley, M., Woolsey, A., et al. (2020). Hydrocarbon Migration Pathway and Methane Budget for a Gulf of Mexico Natural Seep Site: Green Canyon 600. Earth Planet. Sci. Lett. 545. doi:10.1016/j.epsl.2020.116411
Johansen, C., Todd, A. C., Dewar, W., Shedd, W., and MacDonald, I. R. (2014).Quantifying the Volume and Frequency of Bubble Release from Hydrocarbon Seeps in the Gulf of Mexico: GC600 (Poster Presentation)", in: Gulf of Mexico Oil Spill & Ecosystem Science Conference).
Knutson, T., Camargo, S. J., Chan, J. C. L., Emanuel, K., Ho, C. H., Kossin, J., et al. (2020). Tropical Cyclones and Climate Change Assessment: Part II: Projected Response to Anthropogenic Warming. Bull. Am. Meteorol. Soc. 101 (3), E303–E322. doi:10.1175/bams-d-18-0194.1
Kormi, T., Ali, N. B. H., Abichou, T., and Green, R. (2017). Estimation of Landfill Methane Emissions Using Stochastic Search Methods. Atmos. Pollut. Res. 8 (4), 597–605. doi:10.1016/j.apr.2016.12.020
Kormi, T., Mhadhebi, S., Ali, N. B. H., Abichou, T., and Green, R. (2018). Estimation of Fugitive Landfill Methane Emissions Using Surface Emission Monitoring and Genetic Algorithms Optimization. Waste Manag. 72, 313–328. doi:10.1016/j.wasman.2016.11.024
Leifer, I., and MacDonald, I. (2003). Dynamics of the Gas Flux from Shallow Gas Hydrate Deposits: Interaction between Oily Hydrate Bubbles and the Oceanic Environment. Earth Planet. Sci. Lett. 210 (3-4), 411–424. doi:10.1016/s0012-821x(03)00173-0
MacDonald, I. R., Garcia-Pineda, O., Beet, A., Daneshgar Asl, S., Feng, L., Graettinger, G., et al. (2015). Natural and Unnatural Oil Slicks in the Gulf of Mexico. J. Geophys. Res. Oceans 120 (12), 8364–8380. doi:10.1002/2015jc011062
MacDonald, I. R., O’Reilly, C., Roa, C., and Silva, M. (2019). “Chapter 4: Quantitative Imaging of Oil and Gas Bubbles Discharged at MC20," in,” in An Integrated Assessment of Oil and Gas Release into the Marine Environment at the Former Taylor Energy MC20 Site, 43–58.
MacDonald, I. R., Sager, W. W., and Peccini, M. B. (2003). Association of Gas Hydrate and Chemosynthetic Fauna in Mounded Bathymetry at Mid-slope Hydrocarbon Seeps: Northern Gulf of Mexico. Mar. Geology. 198, 133–158. doi:10.1016/s0025-3227(03)00098-7
Marcon, Y., Sahling, H., Allais, A. G., Bohrmann, G., and Olu, K. (2014). Distribution and Temporal Variation of Mega-Fauna at the Regab Pockmark (Northern Congo Fan), Based on a Comparison of Videomosaics and Geographic Information Systems Analyses. Mar. Ecology-an Evol. Perspective 35 (1), 77–95. doi:10.1111/maec.12056
Mason, A. L., Taylor, J. C., and MacDonald, I. R. (2019). An Integrated Assessment of Oil and Gas Release into the Marine Environment at the Former Taylor Energy MC20 Site.: NOAA National Ocean Service, National Centers for Coastal Ocean Science.
McCain, J. D. (1991). Reservoir-Fluid Property Correlations-State of the Art. SPE Res. Eng. 6 (2), 266–272. doi:10.2118/18571-PA
McGinnis, D. F., Greinert, J., Artemov, Y., Beaubien, S. E., and Wuest, A. (2006). Fate of Rising Methane Bubbles in Stratified Waters: How Much Methane Reaches the Atmosphere? Journal of Geophysical Research-Oceans doi:10.1029/2005jc003183
Meurer, W. P., Blum, J., and Shipman, G. (2021). Volumetric Mapping of Methane Concentrations at the Bush Hill Hydrocarbon Seep, Gulf of Mexico. Front. Earth Sci. 9. doi:10.3389/feart.2021.604930
Mitchell, G. A., Orange, D. L., Gharib, J. J., and Kennedy, P. (2018). Improved Detection and Mapping of deepwater Hydrocarbon Seeps: Optimizing Multibeam Echosounder Seafloor Backscatter Acquisition and Processing Techniques. Mar. Geophys. Res. 39 (1-2), 323–347. doi:10.1007/s11001-018-9345-8
Nodine, M. C., Jeong, Y. C., Wright, S. G., and Gilbert, R. B. (2007). Mudslides during Hurricane Ivan and an Assessment of the Potential for Future Mudslides in the Gulf of Mexico. Minerals Manag. Serv. Offshore Tech. Res. Cent 552, 177.
O'Brien, J. (2014). "Practical Methods for Measuring Landfill Methane Emissions", in: Solid Waste Association of North America. (Retrieved 24 Jan 2022: MSW Management).
O'Reilly, C. (2020). The Taylor Energy Oil Spill: Implications for Marine Oil Spill Science and Policy. Master of Science. Florida State University.
Piccaro (2011). Picarro G2301-M Analyzer User’s Guide Rev. C 2/11/11. https://www.picarro.com/support/library/documents/g2301_analyzer_datasheet.
Rehder, G., Brewer, P. W., Peltzer, E. T., and Friederich, G. (2002). Enhanced Lifetime of Methane Bubble Streams within the Deep Ocean. Geophysical Research Letters 29(15). doi:10.1029/2001gl013966
Rehder, G., Leifer, I., Brewer, P. G., Friederich, G., and Peltzer, E. T. (2009). Controls on Methane Bubble Dissolution inside and outside the Hydrate Stability Field from Open Ocean Field Experiments and Numerical Modeling. Mar. Chem. 114 (1-2), 19–30. doi:10.1016/j.marchem.2009.03.004
Roberts, H., and Boland, G. (2010). Gulf of Mexico Cold Seeps: Preface. Deep Sea Res. Part Topical Stud. Oceanography 57 (21-23), 1835–1837. doi:10.1016/j.dsr2.2010.05.001
Römer, M., Hsu, C.-W., Loher, M., MacDonald, I. R., dos Santos Ferreira, C., Pape, T., et al. (2019). Amount and Fate of Gas and Oil Discharged at 3400 M Water Depth from a Natural Seep Site in the Southern Gulf of Mexico. Front. Mar. Sci. 6. doi:10.3389/fmars.2019.00700
Römer, M., Sahling, H., Pape, T., Bohrmann, G., and Spiess, V. (2012). Quantification of Gas Bubble Emissions from Submarine Hydrocarbon Seeps at the Makran continental Margin (Offshore Pakistan). J. Geophys. Research-Oceans 117, 19. doi:10.1029/2011jc007424
Roy, K. O. L., Caprais, J. C., Fifis, A., Fabri, M. C., Galeron, J., Budzinsky, H., et al. (2007). Cold-seep Assemblages on a Giant Pockmark off West Africa: Spatial Patterns and Environmental Control. Mar. Ecology-an Evol. Perspective 28 (1), 115–130. doi:10.1111/j.1439-0485.2006.00145.x
Ryerson, T. B., Aikin, K. C., Angevine, W. M., Atlas, E. L., Blake, D. R., Brock, C. A., et al. (2011). Atmospheric Emissions from the Deepwater Horizon Spill Constrain Air-Water Partitioning, Hydrocarbon Fate, and Leak Rate. Geophys. Res. Lett., 38. doi:10.1029/2011gl046726
Sahling, H., Borowski, C., Escobar-Briones, E., Gaytan-Caballero, A., Hsu, C. W., Loher, M., et al. (2016). Massive Asphalt Deposits, Oil Seepage, and Gas Venting Support Abundant Chemosynthetic Communities at the Campeche Knolls, Southern Gulf of Mexico. Biogeosciences 13 (15), 4491–4512. doi:10.5194/bg-13-4491-2016
Sauter, E. J., Muyakshin, S. I., Charlou, J. L., Schluter, M., Boetius, A., Jerosch, K., et al. (2006). Methane Discharge from a Deep-Sea Submarine Mud Volcano into the Upper Water Column by Gas Hydrate-Coated Methane Bubbles. Earth Planet. Sci. Lett. 243 (3-4), 354–365. doi:10.1016/j.epsl.2006.01.041
Silva, M., Bel Hadj Ali, N., Abichou, T., and MacDonald, I. R. (2019). “Chapter 5. Atmospheric Methane (CH4) Concentrations at the MC20 Site in the Northern Gulf of Mexico,” in An Integrated Assessment of Oil and Gas Release into the Marine Environment at the Former Taylor Energy MC20 Site, 59–70.
Skarke, A., Ruppel, C., Kodis, M., Brothers, D., and Lobecker, E. (2014). Widespread Methane Leakage from the Sea Floor on the Northern US Atlantic Margin. Nat. Geosci. 7 (9), 657–661. doi:10.1038/ngeo2232
Socolofsky, S. A., Adams, E. E., Boufadel, M. C., Aman, Z. M., Johansen, , et al. (2015). Intercomparison of Oil Spill Prediction Models for Accidental Blowout Scenarios with and without Subsea Chemical Dispersant Injection. Mar. Pollut. Bull. 96 (1–2), 110–126. doi:10.1016/j.marpolbul.2015.05.039
Solomon, E. A., Kastner, M., MacDonald, I. R., and Leifer, I. (2009). Considerable Methane Fluxes to the Atmosphere from Hydrocarbon Seeps in the Gulf of Mexico. Nat. Geosci. 2 (8), 561–565. doi:10.1038/ngeo574
Stout, S. A., and Litman, E. R. (in press). Quantification of Synthetic-Based Drilling Mud Olefins in Crude Oil and Oiled Sediment by Liquid Column Silver Nitrate and Gas Chromatography. Environ. Forensics.
Taylor, J. C., and Boswell, K. (2019). “Chapter 3. Surface and ROV Acoustic Mapping of the MC20 Oil and Gas Leak in the Northern Gulf of Mexico,” in inAn Integrated Assessment of Oil and Gas Release into the Marine Environment at the Former Taylor Energy MC20 Site, 19–42.
United States Coast Guard (2019). Oil Pollution Act Liability Limits in 2019. https://www.uscg.mil/Portals/0/NPFC/docs/PDFs/Reports/2020-02-25-Oil-Pollution-Act-Liability-Limits-in-2019.pdf.
Wang, D. W., Mitchell, D. A., Teague, W. J., Jarosz, E., and Hulbert, M. S. (2005). Extreme Waves under Hurricane Ivan. Science 309 (5736), 896. doi:10.1126/science.1112509
Westbrook, G. K., Thatcher, K. E., Rohling, E. J., Piotrowski, A. M., Pälike, H., Osborne, A. H., et al. (2009). Escape of Methane Gas from the Seabed along the West Spitsbergen continental Margin. Geophys. Res. Lett. 36 (15), L15608. doi:10.1029/2009gl039191
Keywords: marine methane flux, atmospheric methane concentration, oil spill, gas seep, gas plume, methane bubble, oily bubble
Citation: Silva M, Roa C, Ali NBH, O’Reilly C, Abichou T and MacDonald IR (2022) Fate of Methane Released From a Destroyed Oil Platform in the Gulf of Mexico. Front. Earth Sci. 10:833661. doi: 10.3389/feart.2022.833661
Received: 11 December 2021; Accepted: 14 February 2022;
Published: 15 March 2022.
Edited by:
Miriam Römer, University of Bremen, GermanyReviewed by:
Jonas Gros, Helmholtz Association of German Research Centres (HZ), GermanyLaura Lapham, University of Maryland Center for Environmental Science (UMCES), United States
Copyright © 2022 Silva, Roa, Ali, O’Reilly, Abichou and MacDonald. This is an open-access article distributed under the terms of the Creative Commons Attribution License (CC BY). The use, distribution or reproduction in other forums is permitted, provided the original author(s) and the copyright owner(s) are credited and that the original publication in this journal is cited, in accordance with accepted academic practice. No use, distribution or reproduction is permitted which does not comply with these terms.
*Correspondence: Ian R. MacDonald, aW1hY2RvbmFsZEBmc3UuZWR1
 Mauricio Silva
 Camilo Roa
 Nizar Bel Haj Ali
 Carrie O’Reilly1
 Ian R. MacDonald