 ZhengZhao Jia
 ZiLing Song2
 JuYu Jiang
- 1College of Mining, Liaoning Technical University, Fuxin, China
- 2College of Environment, Liaoning Technical University, Fuxin, China
- 3College of Mining, Inner Mongolia University of Technology, Hohhot, China
In an open-pit mine in Xinjiang, part of the stripped area is covered by burnt rock. Due to the low strength and fragility of burnt rock, dust is more easily generated during blasting. Taking the mining area as the research background, the mechanical property parameters of burnt rock were tested, and the blasting parameter design of on-site operation was understood. The blasting numerical simulation of burnt rock step was carried out by using a numerical simulation software (LS-DYNA). From the angle of stress on rock, the stress cloud and stress curve of numerical simulation are analyzed, and it is concluded that the fundamental reason for the large dust production in blasting operation is that the burnt rock is crushed excessively after the action of explosion wave, and the explosive energy is too large, which is converted into kinetic energy to drive the dust to escape. In order to improve the utilization rate of explosives and reduce the output of blasting dust, the original blasting parameters were optimized as 8-m hole spacing, 6.5-m row spacing, 0.21-kg/m³ unit explosive consumption, 1-m interval charge, and 55-ms short-delay blasting through numerical simulation and orthogonal experiment. In the mining area, the measures of dustproof and dust reduction by blasting protection blanket and dust absorption cotton are adopted. Combined with the optimized blasting parameters, the field test proves that the dust removal efficiency is up to 82.4%.
1 Introduction
In recent years, open-pit mines have developed rapidly with advantages such as high production efficiency, low input cost, and good safety. However, with the development of open-pit mines toward green, elaborate, and intelligentization, environmental pollution has become the biggest disadvantage of open-pit mines (Gao and Liu, 2010; Xie, 2014; Song et al., 2016; Song, 2020). In an open-pit mine, the dust in the pit is not easy to disperse due to the influence of natural conditions and geographical environment, which negatively impacts the operation efficiency, health, and safety of the workers (Gen, 2010; Bai et al., 2013; Gao, 2013).
Continuous and semi-continuous mining technologies are often used in the development of an open-pit mine. From drilling, blasting, mining, and loading, transportation to discharge, constitute an orderly and interrelated production overall. Dust is produced in all links during operation, but the link with the largest dust production is the blasting operation before mining (Yan and Xue, 2004). According to the field measurements performed in this study, the instantaneous dust concentration during blasting must be as high as 4,000 mg/m3, exceeding the maximum allowable concentration of mine dust (10 mg/m3) (Kissell., 2003; Barnewold and Lottermoser, 2020). The stress that explosion imposes on rock is far greater than the ultimate tensile strength of rock due to the low hardness and poor stability of burnt rock, resulting in excessive crushing of rock, which in turn produces a large amount of dust in the blasting process.
Numerical simulation is a method that can effectively replace field and laboratory blasting experiments. Numerical simulation has high accuracy, lower costs, covers a wide experimental range, and poses no risks compared with field experiments. Many studies investigated the application of numerical simulation in blasting engineering and achieved excellent results. Minchinton and Nagarajan developed MBM (mechanistic blasting model) simulation software combining finite element and block discrete element in ICI, which is applied to the analysis of blasting-induced rock damage, fracture and crushing process, blasting fragmentation, and throwing process (Minchinton and Lynch, 1997; Nagarajan et al., 2015). Taylor and Preece developed the DMC (Distinct Motion Code) as well as the analysis of the formation process of the explosion heap, which is a discrete element simulation software for modeling the open-pit mine blasting effect (Preece, 1990; Preece and Knudsen, 1991; Esen and Nagarajan, 2015; Preece et al., 2015). The main functions of this software include simulating the throwing and stacking process, predicting the shape of the blasting heap and the effect of pre-rock separation blasting, among others (Battison et al., 2015; Goswami et al., 2015). The most simple and direct method to evaluate and optimize blasting effect is to measure the size of rock fragmentation after blasting. Majid evaluated and measured all influential parameters in blast fragmentation. For this purpose, experimenting upon intact rock samples and measuring P-wave velocity (Vp) in 1,771 m of seismic profiles in Choghart, Chadormalu, and Sechahun mines are done. Finally, the influence of mentioned parameters on blast fragmentation was investigated (Akbari et al., 2015; Leng et al., 2020; Sobolev et al., 2020).
Currently, the backpropagation (BP) neural network is the most commonly used method for blasting parameter optimization (Xie and Lu, 2008; Han et al., 2019; Liang, 2019; Zhou et al., 2021). Most of the studies on the current blasting technologies take the degree of rock fragmentation as the evaluation index of the blasting effect. The degree of rock fragmentation can be controlled by changing blasting parameters. Rock blasting is mainly studied by numerical simulation (Huang et al., 2017a; Huang et al., 2017b; Huang et al., 2021a; Huang et al., 2021b). Paramonov discusses the influence of explosive charge diameter and type of explosive substance on the generation of fine dust. Sample calculation of dust and gas pollution according to the proposed procedure is given with consideration of gas dynamic processes in blasthole charging pocket, blasting and drilling parameters, properties of explosive substances and rock massif, including results of commercial approbation in open-pit mines of building materials (Paramonov and Kovalevskyi, 2017; Zhou et al., 2021). Huang used the gas–solid two-phase flow theory and explosion mechanics theory to conduct real-time simulation of blasting dust pollution in an open-pit mine through numerical simulation and field test of the Fluent software. Based on the law of dust pollution, this paper provides a basis for the design of reasonable parameters of dustproof net and related parameters of remote mist emitter (Huang et al., 2019a; Zhang et al., 2021a). Based on the blasting theory and empirical formula, the parameters of presplitting blasting such as the hole diameter, hole spacing, charge decoupling coefficient, and line charge density were determined, and field tests of conventional pre-splitting blasting and presplitting blasting with precise delay and hole-by-hole initiation were carried out on the west slope of Buzhaoba (Mussa et al., 2017; Mussa et al., 2018; Ma et al., 2021).
In addition, in terms of rock fragmentation modeling of bench blasting, many experts have also done corresponding research. Alireza developed the ANFIS and RBF methods for modeling of sizing of rock fragmentation due to bench blasting by estimation of 80% passing size (K80) of Golgohar iron mine of Sirjan, Iran (Karami and Afiuni-Zadeh, 2012; Karami and Afiuni-Zadeh, 2013, Wang et al, 2021a; Zhang et al., 2021b). Some experts and scholars use numerical simulation or laboratory experiments to analyze and summarize dust migration rules and provide theoretical basis for dust control (Bhandari et al., 2004; Huang et al., 2019b; Jia et al., 2021). Santosh turbulent kinetic energy (TKE) and velocity vector path of dust–air mixture and dust-free air were simulated to understand their effects on coal dust dispersion (Ray et al., 2020; Sobolev et al., 2020). For the dust control methods in the blasting process of open-pit mines, many experts have put forward novel and efficient dust suppression methods. Wang proposes a new dust reduction method based on water infusion blasting in open-pit mines, such as water seal blasting method, blasting water fog method and so on (Welideniya, 2005; Wang et al., 2021b). Wang raising blasting dust is often controlled by using certain physical and chemical methods, but the study of blasting dust control by means of numerical simulation is lacking (Raj, 2015; Abdollahisharif et al., 2016; Shaocheng et al., 2017).
Therefore, this study uses LS-DYNA numerical simulation software to simulate the rock blasting with rock crushing degree as the evaluation index of producing dust capacity, degree of rock crushing, and the indicator of producing dust capacity, based on the blasting parameters (drill space, row spacing, explosive consumption, charge constitution, short-delay blasting). The results are used to optimize and control the degree of rock crushing, and reduce the amount of producing dust.
2 Mechanism And Lithology Test Of Blasting Dust
2.1 Analysis of Dust Generation Mechanism in Blasting Process
There are many hypotheses on the mechanism of rock breakage in blasting, such as the theory of explosion gas expansion pressure destruction, the theory of reflected tension stress wave destruction, and the theory of reflection tension stress wave and explosion gas pressure interaction. Bench blasting in an open-pit mine is an internal blasting mechanism.
2.1.1 The Internal Blasting Action of an Explosive
The use of explosives in mining engineering results in coal rock destruction, loosening, vibration, compression, or throwing phenomena (Hagan, 1980; Kononenko and Khomenko, 2021). When the cartridge explodes in an infinite medium, the explosive is transformed into the explosive product of gas state through a chemical reaction instantly. Due to the expansion effect, the volume increases 100 or even thousands of times, and the static pressure does not decline below 15,000 MPa. At the same time, shock waves with temperatures as high as 1,500°C –4,500°C and speed as high as thousands of meters per second are generated. In this short time, stress waves formed by detonation spread from the center of the charge package, namely, the explosion center, to the surrounding areas, including the crushing zone, fracture zone, and vibration zone, formed around the explosion source.
2.1.2 Mechanism of Blasting Rock Breaking and Dust Producing
When the charge explodes, it produces a high peak pulse pressure on the surrounding rock and a strong shock wave in the area immediately adjacent to the charge. Under the action of ultra-high pressure of shock wave, the rock structure is seriously damaged and crushed into fine particles, thus, forming the crushing circle, which is the main source of the dust in blasting operations. Although the radius of the action circle is very small, plastic deformation or shear failure occurs because the medium is strongly crushed, and the energy consumption is very large (Fourney, 2016).
2.1.3 Dust Produced by Blasting Action
In mine blasting, the enormous explosive forces generated by the sudden expansion of high-temperature and high-pressure gas formed after explosive detonation imposes pressure and shear force on the borehole wall and the ore rock within its action radius (Bhandari,2013; Murr et al., 2015). The rock in the compression ring, is crushed, compressed, and broken in an instant due to the action of the largest forces in this area, where the highest degree of powdering is observed. Although the explosive force is absorbed and weakened in the center of destruction or throwing zone of the rocks, there still remains enough force to destroy the hard ore-bearing rock as well as the relay in the ore-bearing rock and throw it out. The pulverized rock fills the blast zone with high velocity and escapes to nearby areas as a result of the blast wave.
2.2 Special Rock—Fire Rock
2.2.1 Lithology Introduction
Fire rock is a special type of rock mass formed by spontaneous combustion of coal seam and the “metamorphism” of surrounding rock. Fire rock is typically developed in Jurassic coal measure strata. The intense solar radiation, high sunshine intensity, low rainfall, dry climate, and other natural phenomena, loosen the surrounding rock structure, increase the permeability, decrease the strength, and increase the dust content in the rock stratum. The dust concentration in the blasting process is higher than that in the conventional rock bench blasting. The properties of rock strata change after being affected by the fire. The fire rock can be divided into a lava-like zone, burnt rock zone, and baked rock zone.
(1) Lava-like (Figure 1A) zone: The combustion of thick–extra thick coal seam releases huge heat, which changes the structure of surrounding rock, forming a slag like “lava.” The molten rock mixes with the collapsed rock, creating a hybrid type of rock known as “migmatite.” The color is purple-gray, manganese-gray, purple, and also observed in other colors. The rock structure is not clear, cracks and pores are particularly developed, the surface is rough, the texture is firm and brittle with sharp edges and corners.
(2) Burnt rock (Figure 1B) zone: Spontaneous combustion of coal seam changes the structure of surrounding rock slightly. The degree of rock combustion is inferior in comparison with the “lava-like” zone. Generally, the color is light red, brick red, manganese gray, and gray (iron-free rock) mudstone. Siltstone bedding is clear and sandstone bedding is not clear. The structure changes slightly, and the texture is firm brittle with cracks. Mudstone and siltstone are similar to clay, and claystone is generally like a porcelain plate.
(3) Baked rock (Figure 1C) zone: The surrounding rock is far from the spontaneous combustion coal seam, and the rock is only baked, generally colored as light red and light brick red. The rock bedding is clear, the structure does not change, and hardness increases slightly with relatively more cracks found. The rock mass is rarely collapsed, and normal surrounding rocks undergo a phase transition.
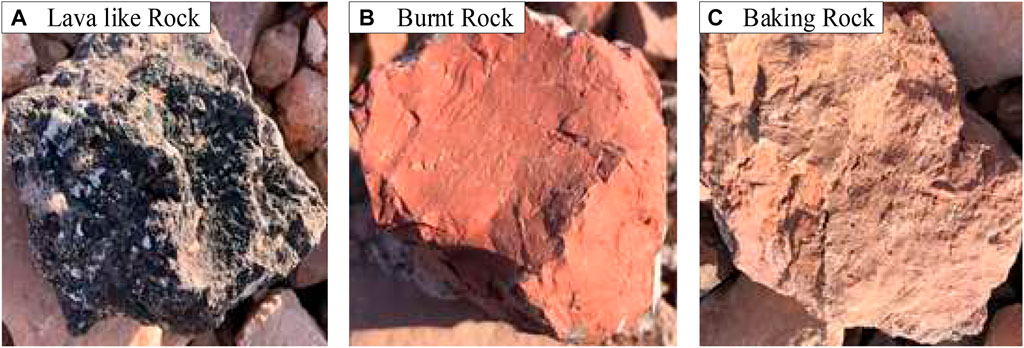
FIGURE 1. Rock types. (A) Lava-like rock. (B) Burnt rock. (C) Baking rock.
2.2.2 Lithology Test
The rock mass fissures of burnt rock are well developed, and their physical and mechanical properties are significantly different from the original rock. These rocks have high water absorption, poor frost resistance, and disintegration resistance. Under the action of the atmospheric environment with large temperature differences, freezing–thawing alternation, and groundwater, the burnt rocks rapidly disintegrate and flake, leading to the destruction of the rock mass. Therefore, the physical and mechanical properties of lava sample rock, burnt rock, and burnt rock in burnt zone were investigated in the laboratory. For each parameter shown in Table 1, the average values of three types of rocks are taken as material parameters or blasting simulation.
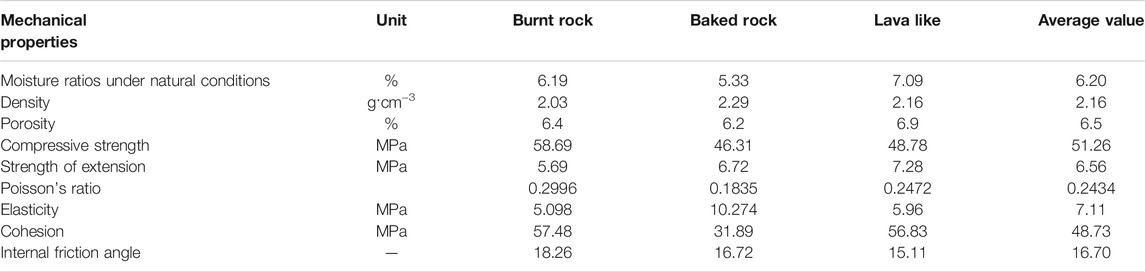
TABLE 1. Summary of rock property tests.
3 Numerical Simulation Study
Because of the special lithology of burnt rock, the effect of conventional blasting parameters is weak, so it is necessary to optimize the blasting operation. According to Griffith’s strength theory, rock breaks when the stress is greater than the ultimate tensile strength of rock. Thus, the stress cloud and stress curve are used to assess the failure of the bench rock (Welideniya, 2005).
3.1 LS-DYNA Numerical Simulation Software
The Altair HyperMesh (14.0) software has a good interface with the LS-DYNA (R11.1) software, so it was used to conduct modeling, mesh division, and keyword definition, and LS-DYNA solver was used to complete the modeling, meshing, and running the numerical simulation. LS-Prepost (R11.1) and HyperView (14.0) are used for post-processing the results and to obtain the stress cloud map and stress curve in d3plot file after the completion of the simulation. The modeling and simulation workflows are shown in Figure 2.
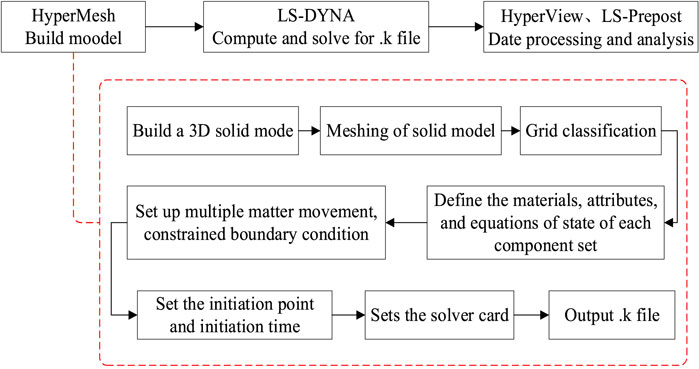
FIGURE 2. Procedure of blasting simulation.
3.2 Build the Model
3.2.1 Modeling and Grid Partitioning
3D modeling of burnt rock was carried out (Figure 3A) according to geological data of an open-pit mine in Xinjiang. The model is 42 m long, 13.5 m wide at the top, and 17.1 m wide at the bottom, 10.5 m height (H) of the bench (including 0.5 m super depth), and the slope angle (α) of the bench is 70°.
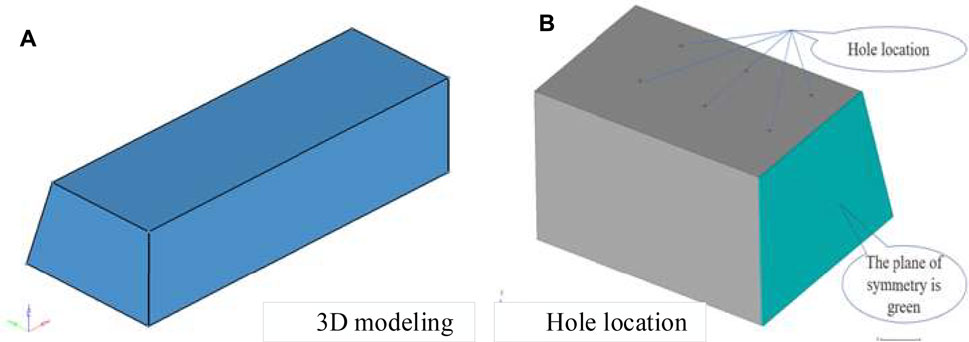
FIGURE 3. Model design. (A) 3D modeling. (B) Hole location.
The section drawing of the blasting model contains two rows of holes; each row has six holes, chassis resistance line (Wd) is 6.1 m, hole spacing 1) is 6 m, row spacing 2) is 5 m, hole diameter 4) is 150 mm, hole depth (L) is 10.5 m, and charge height (H1) is 6.5 m. The bench blasting model has a filling length (H2) of 4 m and explosive unit consumption (q) of 0.23 kg/m3. The firing method is simultaneous detonating.
The geometry was cut at the middle of the model (plane of symmetry) and symmetry constraint was applied on the plane. The remaining half of the geometry was used for simulation; in this way, the accuracy of the simulation is improved, and the computation efficiency increases. Figure 3B shows the symmetric constraints of the blasting model and the grid patterns divided.
Mesh division has a great influence on the calculation process. Too large mesh is easy to reduce the calculation accuracy. Too small mesh leads to too much mesh to make the calculation time too long and greatly reduce the calculation efficiency. Since the blast hole diameter is small, and the rock model is relatively large, if the mesh is divided according to the mesh at the blast hole to ensure uniformity, the number of mesh may be more. However, if all the grids are divided according to the mesh at the rock, it may be difficult to divide the blast hole. Therefore, we use a part of the transition region of the mesh at the blast hole to slowly expand the mesh to the mesh size of the rock, which ensures the accuracy and makes the mesh number appropriate. The mesh size at the hole is 2.5 cm × 2.5 cm × 10 cm, and the mesh size at the rock is 25 cm × 25 cm × 10 cm. The mesh size at the intermediate transition is larger than that at the hole and smaller than that at the final rock.
3.2.2 Materials for the Numerical Simulation Model
(1) Rock material
According to the physical and mechanical tests of fire rock, the tensile strength limit, compressive strength limit, and shear modulus of burnt rock are small, so the conglomerate is a plastic follow-up model in the simulation process (*MAT_PLSETIC_KINEMATIC). The rock parameters set include density of 2,169 kg/m³, elasticity of 7.11 × 10⁶ Pa, Poisson’s ratio of 0.2434, strength of extension of 6.56 × 10⁶ Pa, and compressive strength of 5.126 × 10⁷ Pa.
(2) Explosive material
The high-performance explosive material model (* MAT _ HIGH _ EXPLOSIVE _ BURN) in LS-DYNA material library was used to describe the physical and chemical properties of explosives. After the initiation of high-performance explosives, the transfer behavior of detonation products will lead to changes in the internal pressure and volume of the explosive unit. The JWL state equation was introduced to measure the relationship between the internal physical quantities of the system after detonation. This equation can accurately describe the process of the expansion drive of detonation products.
where P is the detonation pressure (GPa), A, B, R1, R2, and ω are the characteristic parameters of explosives, V is the volume change, and E0 is the initial internal energy (Gpa). The explosive density is 1,100 kg/m³, velocity is 4,500 m/s, and pressure is 5.6 GPa.
(3) Spacer material
Air was used as spacer material and is described by the Gruneisen equation of state:
where P is the gas pressure, C0∼C6 are the material characteristic parameters, and μ is the dynamic viscosity coefficient;
(4) Tamping plug materials

TABLE 2. Air material parameters.
The hole is filled with mortar, and the keyword is MAT_SOIL_AND_FOAM. The specific parameters of mortar are shown in Table 3.

TABLE 3. Tamping plug material parameters.
3.3 Initial Blasting Scheme Simulation
Excessive crushing of rock in blasting operation is one of the sources of blasting dust, so the purpose of this study is to avoid excessive crushing of rock and reduce the amount of blasting dust while ensuring reasonable destruction of bench rock is achieved.
In order to analyze the stress state of rock bench in blasting simulation, three representative monitoring points were selected from the model. A measuring point −H2451369, is located at the bottom of the bench slope; B measuring point H1469530 is located at the midpoint of two adjacent gun holes; and C Measuring point −H1426887 is at the outermost edge of the bench upper panel (see Figure 4).
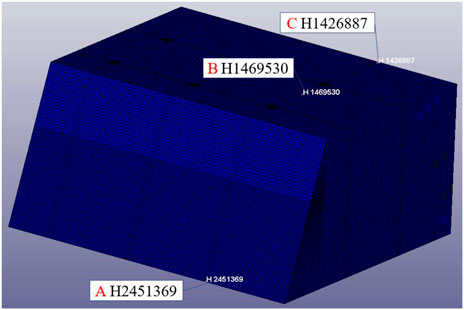
FIGURE 4. Layout of monitoring points.
3.3.1 Blasting Stress Propagation of Rock Bench
It can be seen in Figure 5 that at 0.0035 s after the explosion, the stress wave was first transmitted to some rocks on the bench slope. When the time reaches 0.005 s, the stress wave continues transmission and affects the rock in the upper wall of the bench. At this point, the stress of some rocks on the bench slope is much greater than the ultimate tensile strength of rock, while the stress of rocks on the upper wall of the bench is less than the ultimate tensile strength of rock, indicating that the rock on the bench slope first begins to be destroyed, resulting in a rapid increase in the concentration of blasting dust. When the time reaches 0.01 s, the stress of the rock on the whole bench surface exceeds the ultimate tensile strength of the rock, and the rock is seriously damaged. From 0.01 to 0.055 s, the stress wave continues the destruction. From 0.055 to 0.1 s, the stress on the rock gradually decreases. When the stress is less than the ultimate tensile strength of the rock, the rock on the bench surface is no longer damaged.
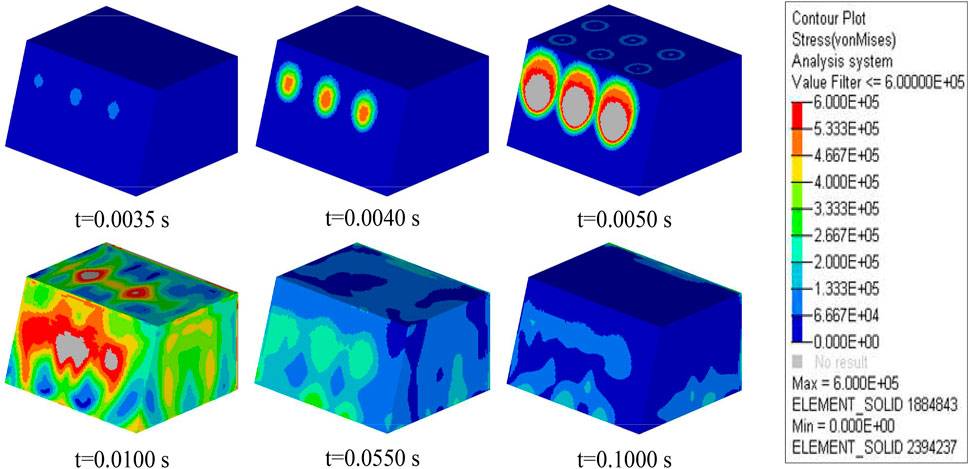
FIGURE 5. Cloud diagram of initial stress distribution at the specified time steps.
3.3.2 Analysis of Simulation Results
Post-processing software LS-PREPOST was used for analysis, by which the stress curves of monitoring points A, B, and C were obtained (Figure 6). In the stress graph, a positive stress curve indicates a state of tensile stress, and a negative stress curve indicates a state of compressive stress.
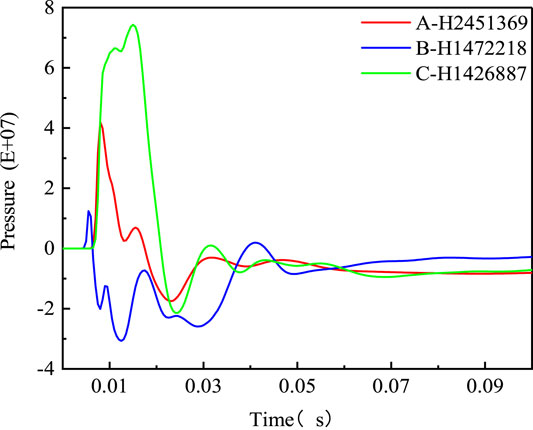
FIGURE 6. Stress diagram of the monitoring points.
The explosion can be transmitted from the gun hole to the monitoring point A (red curve) for a period, which causes the rock at the monitoring point to be subjected to stress. The stress soon exceeds the limit of the tensile strength of the rock and continues to increase to the peak value, resulting in excessive crushing of the rock. Since the bench slope is set with no reflection boundary in the simulation, the stress is transmitted to measurement point A without reflection. In addition, there are multiple free surfaces because there are multiple holes in the bench, causing the stress curve to oscillate repeatedly. The conclusion is consistent with that obtained from the stress cloud map.
3.4 Numerical Simulation of Short-Delay Blasting
3.4.1 Blasting Stress Propagation of Rock Bench
The stress cloud map shows that the explosion process in the first 0.0055 s is similar to the conventional blasting process, where the stress on the rock at the bench slope is far greater than the ultimate tensile strength of the rock (Figure 7). At 0.056 s, the blast energy of the first row of holes gradually spreads to the surface of the bench, where the back half of the rock bench is broken. At 0.065 s, the explosion can spread to the bench slope, and the crushing degree of bench rock is more significant through the superposition of blasting stresses. Compared with the simultaneous initiation, the micro-differential initiation triggers secondary damage to the rock, improves the blasting quality, improves the blasting effect, and reduces dust production.
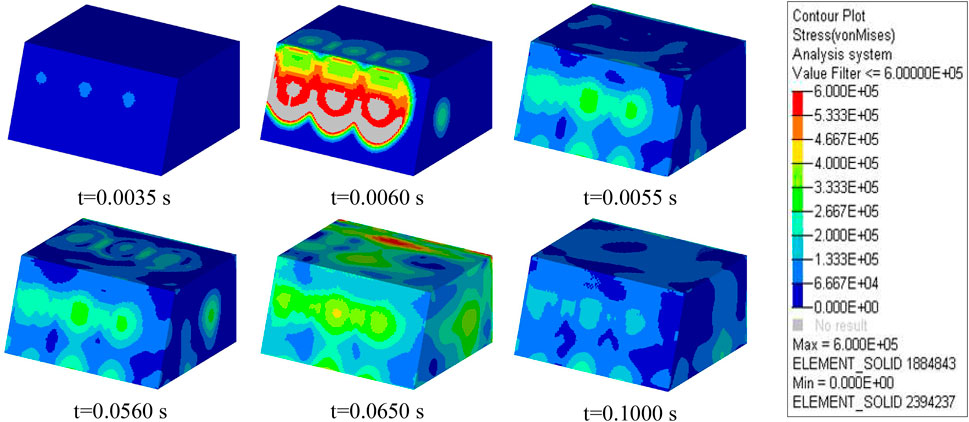
FIGURE 7. Cloud diagram of short-delay blasting stress distribution.
3.4.2 Analysis of Simulation Results
As can be seen from the stress curve illustrated in Figure 8, when the short-delay blasting is adopted, the stress peaks at two monitoring points A and C are both higher than the tensile strength of rock, and the degree of rock crushing increases after two explosions. The stress at B monitoring site is small, but the stress action time is long. Although this situation is beneficial to rock crushing, it is still necessary to adjust the single explosive consumption and pore network parameters, otherwise, the rock crushing degree will remain high, which will directly affect the amount of blasting dust.
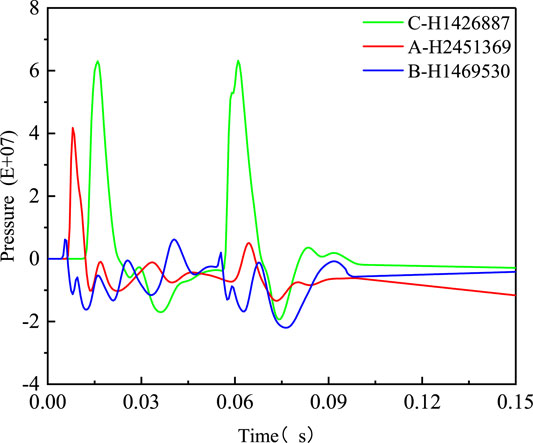
FIGURE 8. Stress diagram of the monitoring points.
3.5 Numerical Simulation of Spaced Loading
3.5.1 Blasting Tress Propagation of Rock Bench
It can be seen from Figure 9 that at 0.0035 s, stress wave is transmitted to some rocks on the bench slope and the upper wall of the bench, such that the rocks in that zone are subjected to stress at the same time, and the stress is near the tensile strength limit of the rock. At 0.01 s after the explosion, the whole surface of the bench is affected by the detonation wave, and the stress of all the rocks on the surface of the bench reaches the ultimate tensile strength of the rock. During the period of 0.01– 0.039 s, the rock on the surface of the whole bench is continuously damaged by stress waves, resulting in excessive rock crushing. From 0.039 s to the end of blasting, the stress on the rock surface is less than the ultimate tensile strength of the rock, and the rock on the bench surface is no longer damaged. When the continuous charging structure is adopted, the stress wave is transmitted to the segment of the rock on the bench slope first, and then to the rock segment on the bench upper wall. However, when the spacing charging structure is changed, the explosion energy will be transmitted to the rock on the bench slope and the rock on the bench upper wall at the same time, leading to the evident change in stress distribution. The simulation proves that the interval charging structure can reduce the duration at which the whole bench surface is subjected to stress levels exceeding the ultimate tensile strength of rock.
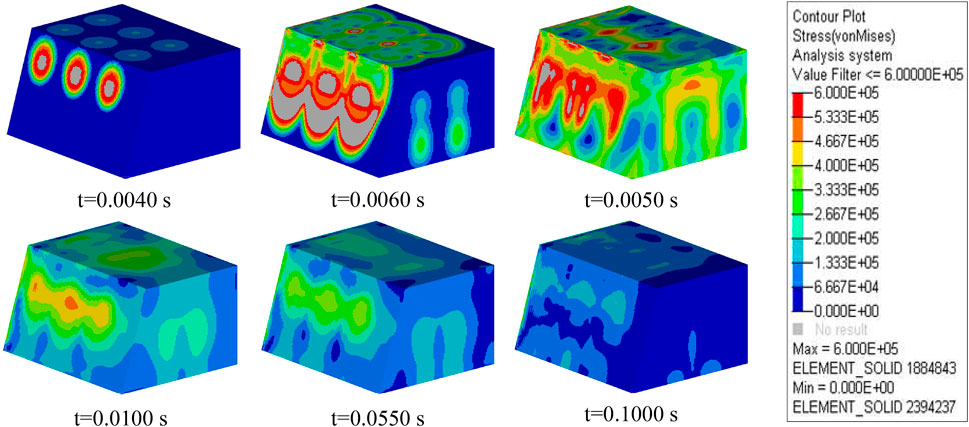
FIGURE 9. Cloud diagram of spaced loading blasting stress distribution.
3.5.2 Analysis of Simulation Results
It can be seen from the stress curves depicted in Figure 10 that the stress received by the three monitoring points is significantly reduced compared with that in the continuous charging structure. However, in the case of the original blasting parameters, the stress peaks are far greater than the tensile strength of the rock, resulting in the increase in dust production after the excessive crushing of the rock. Therefore, it is still necessary to optimize the blasting hole network parameters. Due to the simple air spacing, the second strain wave is formed and the action time of the stress wave is prolonged, so the rock stress changes drastically, especially between two rows of holes. It shows that by prolonging the action time of stress wave, interval charge can reduce the peak stress of explosion shock wave, improve the blasting effect, and reduce the excessive crushing of rock.
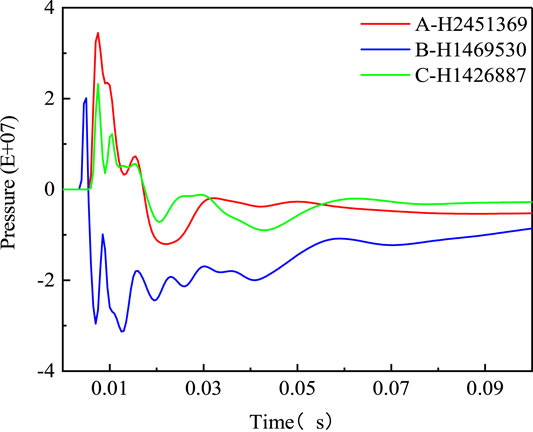
FIGURE 10. Stress diagram at the monitoring points.
The abovementioned discussions imply that it is not reasonable to adopt conventional blasting parameters and methods in burning rock areas. In order to improve the blasting effect, the amount of explosive dust in the burning area should be reduced and the dust production from the source should be controlled, the hole network parameters should be optimized, and the method of detonation and charge constitution should be modified.
4 Optimization of Blasting Parameters
4.1 Orthogonal Experiment to Optimize Blasting Parameters
4.1.1 Experimental Purpose
Through numerical simulation analysis, it is concluded that the charging structure and initiation mode strongly affect dust production. In addition, the parameters of the blasting hole network and the unit consumption of explosives significantly influence the blasting operation. Thus, the influencing factors should be considered comprehensively. Therefore, the optimal combination of various factors was obtained by orthogonal experiment, and the goal of reducing dust production was ultimately achieved in this way.
4.1.2 Calculate the Factor Level Table
(1) Hole spacing
After a large number of mine blasting tests, the concept of hole density coefficient m is put forward, and the hole distance can be calculated according to the following formula:
where Wd is the bottom burden.
Generally, increasing m value will improve the blasting effect. The value of m ranges from 0.9 to 1.3, the selection range of hole spacing is 5.9–8.6 m. Therefore, three levels are selected, namely, 6, 7, and 8 m.
(2) Row spacing
The row spacing formula is as follows:
The selection range of row spacing B is 3.9–6.6 m, so three levels are selected, namely, 6, 6.5, and 7 m, respectively.
(3) Short-delay blasting
The time needed to form a new free surface is used to determine the micro-difference interval between rows, which can be calculated by the following formula:
In the bench blasting operation of open pit mine, K is generally within the value range of 8–15 ms/m. When the rock hardness is high, K takes a large value, and when the rock hardness is low, K takes a small value. According to the calculation, the selection range of the micro-difference time between rows is 40–75 ms. Due to the large number of designed experiments, the appropriate value of this variable is directly set as 55 ms, no longer at the design level.
(4) Explosive consumption
The current unit explosive consumption of the open-pit mine is 0.23 kg/m3. On the basis of known data, three levels were selected for optimization, which were 0.21, 0.23, and 0.25 kg/m3.
(5) Spaced loading
In the blasting operation of open-pit mine, when the blasting structure of the hole adopts two stages of charging, the distance between charging is generally 1–2 m, and the amount of explosive used under the hole is 17%–35% of the total charging amount. When the rock’s Pratt coefficient is large, the maximum charge value is taken. When the general coefficient value of burnt rock is small, the small value of charge quantity under the hole is 25%. Due to the restriction relationship between the spacing distance of charging and the packing length, when the spacing charging structure is adopted, the maximum spacing length is 1 m. Now, the spacing distance is set at three levels of 0, 0.5, and 1 m. The factor level table is set as shown in Table 4.

TABLE 4. Factor level table.
According to orthogonal table L27 (313), the design results of the blasting experiment scheme are shown in Table 5.
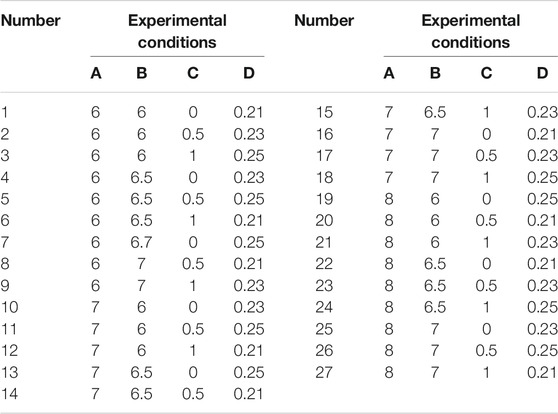
TABLE 5. Experimental scheme design.
According to Table 5, a 3D model was established, and numerical simulation was carried out. In the numerical simulation results, the stress peaks of rock at three monitoring points were calculated for each scheme. The statistical results are shown in Table 6.

TABLE 6. Rock stress value.
4.1.3 Scheme and Results
The tensile stress at each measuring point of each scheme was subtracted from the tensile strength of rock, and the calculation results were calculated and summed in absolute value. The values obtained by each scheme are summarized in Table 7.
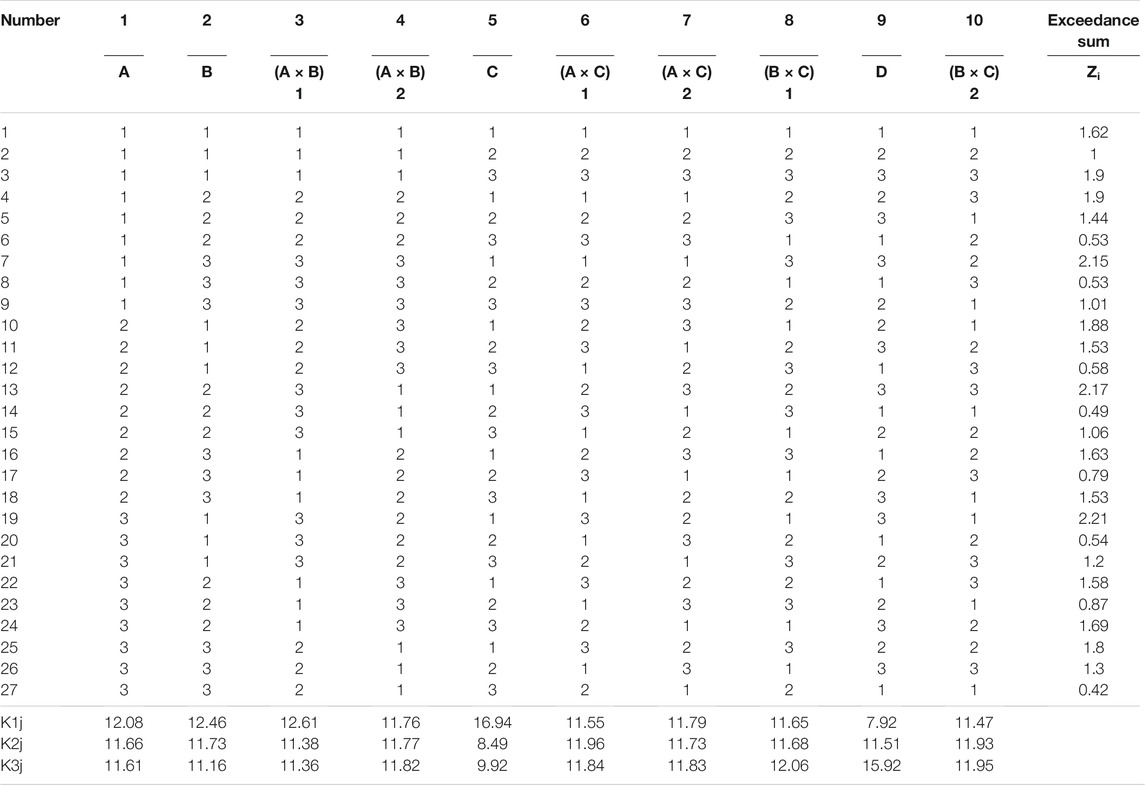
TABLE 7. Rock stress value.
4.1.4 Determination of the Optimal Scheme
The smaller the stress that exceeds the ultimate tensile strength of the rock, the smaller is the dust concentration during the blasting operation. Therefore, the optimal scheme is the one combined with the minimum K value of each factor. Therefore, the minimum combination scheme of K is A3B3C2D1.
An optimal scheme A3B3C3D1 and A3B3C2D1 are selected from the scheme table for comparison. By comparing their numerical simulation results (Table 8), it is concluded that the force of A3B3C3D1 over the tensile strength of rock is small on the slope of the bench, and the force over the limit of the tensile strength of rock is large on the wall of the bench. Finally, the optimal scheme is determined as A3B3C3D1, and the optimized blasting parameters are shown in Table 9.
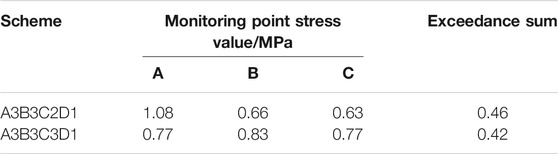
TABLE 8. Contrast of tensile strength.

TABLE 9. After optimization, blasting parameters.
4.2 Analysis of Blasting Effect After Optimization
Numerical simulation was performed using the optimized blasting parameters. A group of representative stress distribution clouds with significant stress changes are captured.
4.2.1 Blasting Stress Propagation of Rock Bench
It can be seen from Figure 11 that the explosion process is the same as in previous cases. However, the time of the explosion stress acting on the rock is different. After adopting the optimized scheme, it is found that the limit stress time of bench rock is 0.0255 s, which is far less than the limit stress time of 0.039 s before optimization. Therefore, the optimized scheme can significantly improve the stress distribution of rock.
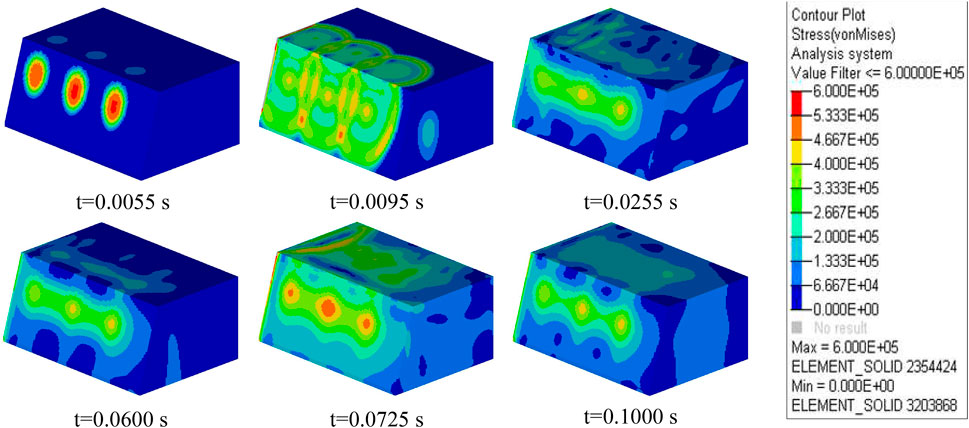
FIGURE 11. Stress diagram.
4.2.2 Analysis of Simulation Results
From Figure 12, it can be seen that the stress values of the three monitoring points decreased significantly after the optimization of blasting parameters. The stress wave acts in rock for a long time. Under the repeated action of stress, the fracture of the outermost rock can be guaranteed, the utilization rate of explosives is improved, and the single consumption of explosives is reduced as well. In other words, the degree of pulverization of burnt rock is controlled, the output of dust is reduced, and the cost of blasting operation is also minimized.
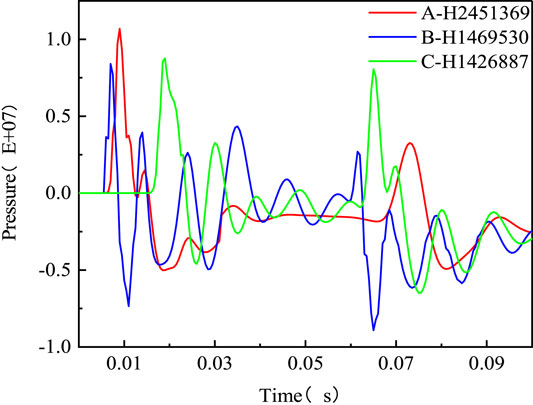
FIGURE 12. Stress curve after optimization at monitoring points.
5 Blasting Dust Suppression Measures
The dust suppression method during blasting is one of the important means of controlling the dust quantity. Commonly used dust control measures include water injection in advance, water sealing blasting, and blasting dust protection layer technology in the blasting area. Most of the dust-suppression measures are difficult in the implementation process due to the unique lithology of fire rock. Therefore, the method of covering the blast area with dust absorbent cotton and a protective blanket was selected to control and reduce the dust production.
5.1 Dust Prevention and Reduction Measures
The essence of covering dust suppression measure is “filtering” dust particles. Blasting protection blanket + vacuuming cotton (Figure 13) is laid above the blast area, through which explosive gas flows out of the gap of the protective blanket. Dust absorbent cotton filters the dust in the gas, reduces the concentration of dust escape, and inhibits the generation of dust at the source of blasting.
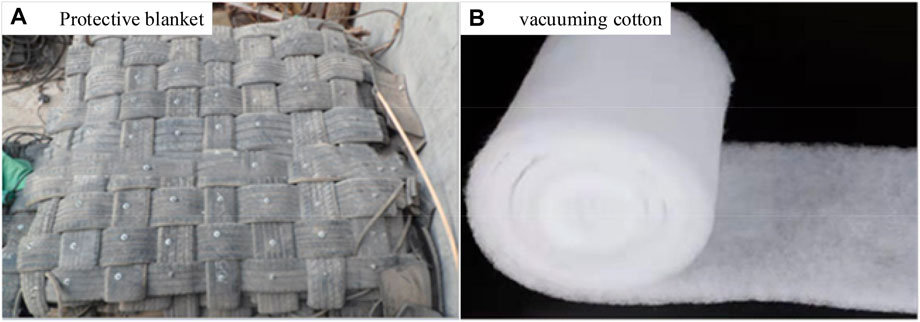
FIGURE 13. Blasting dust suppression material. (A) Protective blanket. (B) Vacuuming cotton.
The protective blanket can fix the dust-absorbing cotton and resist the flying stone, which can reduce the dust and improve the blasting safety factor. The material comes from waste tires, waste transport belts, etc., and is made of several warp strips and weft strips. In order to facilitate laying, a lifting ring or hook can be added to the edge of the protective blanket. Protective blankets can be recycled to reduce blasting costs and protect the environment. Vacuuming cotton is a filter material, mainly composed of PET (polyester fiber) and PP (polypropylene fiber), belonging to disposable items.
5.2 Field Industrial Test
5.2.1 Field Blasting Test
In order to verify the rationality of the optimized blasting parameters and the actual effect of the blasting dust suppression scheme, an industrial blasting test was carried out in a burning area of an open-pit coal mine in Xinjiang. The test area and the test comparison area are arranged on the same bench. The direct reading dust sampler is placed 30 m upwind of the blasting area to test the blasting concentration (see Figure 14 for the layout position).
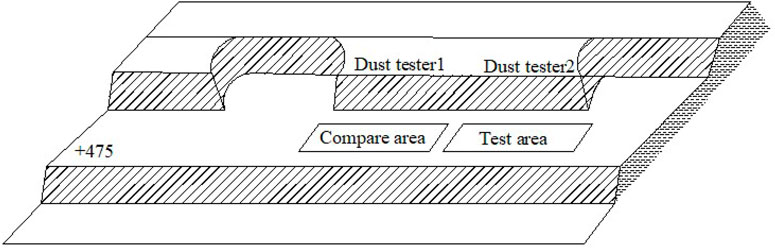
FIGURE 14. Layout of test area and comparison area.
The original blasting scheme was adopted in the comparison area, the optimized blasting parameters were adopted in the test area, and the dust absorbent cotton and protective blanket were added in the test area. The hole was covered with a layer of vacuum-absorbing cotton and the blasting protection blanket (See Figure 15 for the material layout).
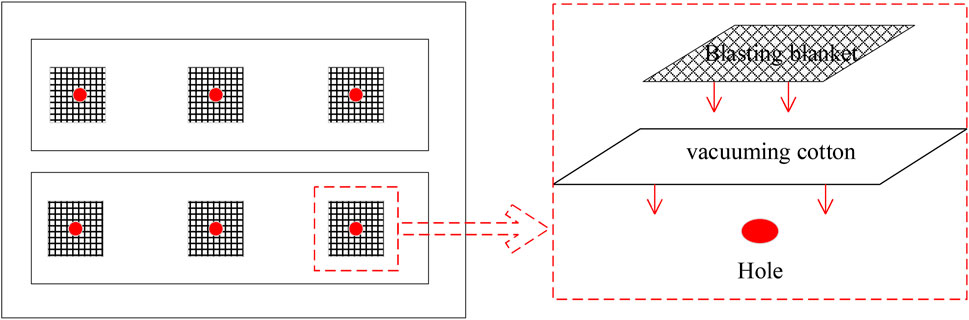
FIGURE 15. Site test layout diagram.
5.2.2 Effect Analysis
The diffusion of dust can be observed clearly from the viewing spots shown in Figures 16, 17. By comparison of the blasting dust diffusion depicted in these figures, it is found that there is no dust escaping from the bench hanging plate in the test area, and only a small amount of dust escapes from the bench slope with a low concentration. In addition, the rock fragmentation of the bench is more uniform, which meets the requirements of loose blasting. Therefore, the reliability and accuracy of the blasting parameters are verified by the field test.
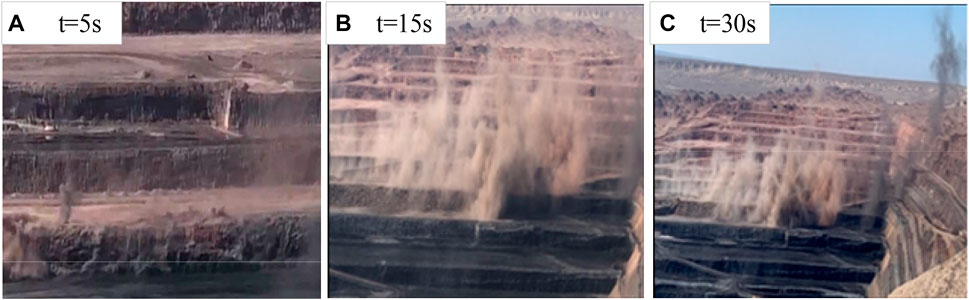
FIGURE 16. Contrast area blasting dust diffusion diagram. (A) t = 5 s. (B) t = 15 s. (C) t = 30 s.
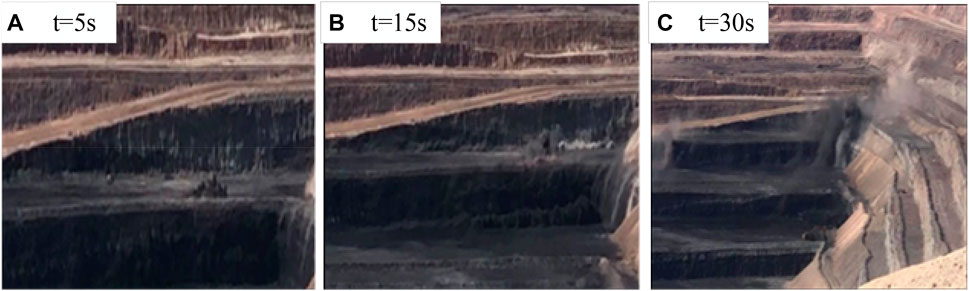
FIGURE 17. Dustproof and dust reduction effect of blasting in the test area. (A) t = 5 s. (B) t = 15 s. (C) t = 30 s.
The dust concentration measured by the dust sampler in the blasting site is 727.6 mg/m3 in the test area and 3,017 mg/m3 in the comparison area. The dust concentration in the test area is far less than the measured dust concentration of 4,221 mg/m3 before optimization, and the dust removal efficiency can reach 82.4%.
After blasting, the positions of the protective blanket and the vacuuming cotton did not change (Figure 18) and are relatively intact. The interspaces of the vacuuming cotton are filled with dust. It can be seen that vacuuming cotton plays a significant role in suppressing the blasting dust. Vacuuming cotton loses its refiltration function, while intact protective blankets can be reused.
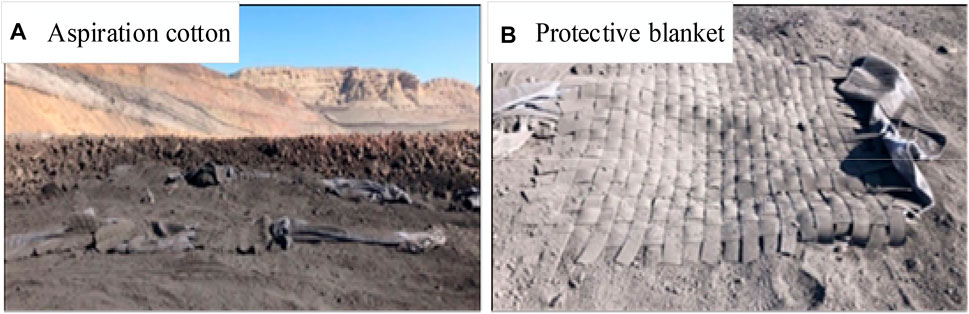
FIGURE 18. Site map of test area after blasting. (A) Aspiration cotton. (B) Protective blanket.
After the field test, according to the test results, the laying technology of protective blanket and dustproof cotton is improved. The gap of the protective blanket is increased to 3 cm × 3 cm, the width of the woven tape is 3–4 cm, and the weight is about 10 kg after improvement. Vacuuming cotton covers the whole blasting area, and protective blankets are laid over the hole. In this way, not only does it reduce the overflow of the disc dust in the blasting process but also decreases the weight and quantity of the protective blanket, making it easier for operators to lay out the protective blanket.
6 Conclusion
(1) The key factors affecting the bench blasting effect in the burning area are explosive consumption, charge constitution, detonation way, and hole mesh parameters. The rock bench in the burning area of open-pit mine has special rock properties and low mechanical strength. In the process of blasting, the rock is seriously damaged by the explosion energy, and the crushing degree is too high. The excess explosive energy drives the fine dust particles to move outward, resulting in a large amount of dust production.
(2) The optimal blasting scheme is determined as 8-m drill space, 6.5-m row spacing, 0.21-kg/m³ explosive consumption, 1-m interval length, and 55-ms short-delay blasting after orthogonal experiment optimization.
(3) Field test verification in the mining area adopt the optimized blasting scheme and adopt the dust suppression mode wherein the upper layer of the explosion area is covered with vacuum cotton and blasting blanket. The test results show that this method has an obvious dust suppression effect, where the dust removal efficiency reaches 82.4% (Welideniya, 2005; Xie and Lu, 2008; Zhou et al., 2021; Huang et al., 2021b).
Data Availability Statement
The original contributions presented in the study are included in the article/Supplementary Material. Further inquiries can be directed to the corresponding author.
Author Contributions
All authors listed have made a substantial, direct, and intellectual contribution to the work and approved it for publication.
Funding
This project was supported by the National Natural Science Foundation of China. Integrated technology of ecological environment restoration and mining in open pit coal mine based on green degree, Project Grant Nos. 51474119, National Natural Science Foundation of China.
Conflict of Interest
The authors declare that the research was conducted in the absence of any commercial or financial relationships that could be construed as a potential conflict of interest.
Publisher’s Note
All claims expressed in this article are solely those of the authors and do not necessarily represent those of their affiliated organizations, or those of the publisher, the editors, and the reviewers. Any product that may be evaluated in this article, or claim that may be made by its manufacturer, is not guaranteed nor endorsed by the publisher.
References
Abdollahisharif, J., Bakhtavar, E., and Nourizadeh, H. (2016). Green Biocompatible Approach to Reduce the Toxic Gases and Dust Caused by the Blasting in Surface Mining. Environ. Earth Sci. 75 (3), 191. doi:10.1007/s12665-015-4947-9
Akbari, M., Lashkaripour, G., Yarahamdi Bafghi, A., and Ghafoori, M. (2015). Blastability Evaluation for Rock Mass Fragmentation in Iran central Iron Ore Mines. Int. J. Mining Sci. Tech. 25 (Issue 1), 59–66. doi:10.1016/j.ijmst.2014.11.008
Bai, R., Bai, Y., Wang, Z., Wang, X., and Liu, G. (2013). Discussion on Dust Prevention and Control in Open-Pit Mine [J]. Opencast Mining Tech. 82 (04), 76–77. doi:10.13235/j.cnki.ltcm.2013.04.033
Barnewold, L., and Lottermoser, B. G. (2020). Identification of Digital Technologies and Digitalisation Trends in the Mining Industry. Int. J. Mining Sci. Tech. 30 (Issue 6), 747–757. doi:10.1016/j.ijmst.2020.07.003
Battison, R., Esen, S., Duggan, R., Henley, K., and Dare-Bryan, P. (2015). “Reducing Crest Loss at Barrick Cowal Gold Mine[C],” in Proceedings of the 11th International Symposium on Rock Fragmentation by Blasting, Sydney, NSW, August 2015, 24–26.
Bhandari, S., Bhandari, A., and Arya, S. (2004). “Dust Resulting from Blasting in Surface Mines and its Control[C],” in Proceedings of explosive conference, 25–34.
Bhandari, S. (2013). “Fines and Dust Generation and Control in Rock Fragmentation by Blasting[J],” in Proceedings of Rock Fragmentation by Blasting. Editors B. Singh, and B. Sinha (Taylor & Francis), 511–520.
Esen, S., and Nagarajan, M. (2015). “Muck Pile Shaping for Draglines and Dozers at Surface Coalmines[C],” in Proceedings of 11th international symposium on rock fragmentation, Carlton Victoria, August 2015 (Australian: The Austialasian Institute of Mining and Metallurgy).
Fourney, W. L. (2016). Mechanisms of Rock Fragmentation by blasting[J]. London: Comprehensive rock engineering, 39–68.
Gao, L. (2013). Discuss the Construction of the Wisdom mine[J]. Jiangxi, China: Copper Engineering, 43–46.
Gao, Y., and Liu, D. Z. (2010). Discussion on Developing Trend of China Engineering Blasting Trade[J]. Eng. Blasting 16 (4), 1–4.
Goswami, T., Martin, E., Rothery, M., and Genge, D. (2015). “A Holistic Approach to Managing Blast Outcomes [C],” in Proceedings of 11th international symposium on rock fragmentation, Carlton Victoria (Wuhan: The Austialasian Institute of Mining and Metallurgy).
Hagan, T. N. (1980). “Rock Breakage by Explosives,” in Gasdynamics of Explosions and Reactive Systems (Pergamon), 329–340. doi:10.1016/b978-0-08-025442-5.50034-2
Han, W., Liang, S., and Shi, Y. (2019). Optimization of Blasting Parameters Based on Neural Network [J]. Coal Tech. 38 (09), 14–17. doi:10.13301/j.cnki.ct.2019.09.005
Huang, F., Huang, J., Jiang, S., and Zhou, C. (2017a). Landslide Displacement Prediction Based on Multivariate Chaotic Model and Extreme Learning Machine. Eng. Geology. 218, 173–186. doi:10.1016/j.enggeo.2017.01.016
Huang, F., Yin, K., Huang, J., Gui, L., and Wang, P. (2017b). Landslide Susceptibility Mapping Based on Self-Organizing-Map Network and Extreme Learning Machine. Eng. Geology. 223, 11–22. doi:10.1016/j.enggeo.2017.04.013
Huang, Z., Ge, S., Jing, D., and Yang, L. (2019a). Numerical Simulation of Blasting Dust Pollution in Open-Pit Mines[J]. Appl. Ecol. Environ. Res. 17 (5), 10313–10333. doi:10.15666/aeer/1705_1031310333
Huang, Z., Ge, S., Jing, D., and Yang, L. (2019b). The Influence of Dust Dispersion on the Law of Blasting Dust Emission Based on Microscope[J]. Acta Microscopica 28 (6), 1728–1738.
Huang, F., Yan, J., Fan, X., Yao, C., Huang, J., Chen, W., et al. (2021a). Uncertainty Pattern in Landslide Susceptibility Prediction Modelling: Effects of Different Landslide Boundaries and Spatial Shape Expressions [J]. Geosci. Front. 13, 101317. doi:10.1016/j.gsf.2021.101317
Huang, F., Tao, S., Chang, Z., Huang, J. S., Fan, X. M., Jiang, S-H., et al. (2021b). Efficient and Automatic Extraction of Slope Units Based on Multi-Scale Segmentation Method for Landslide Assessments[J]. Landslides 18, 1–17. doi:10.1007/s10346-021-01756-9
Jia, Z., Song, Z., Zhao, X., Fan, J., and Jiang, J. (2021). Dust Transport Law and Dust Suppression Technology Based on Gas-Solid Two-phase Flow[J]. Arabian J. Geosciences 14 (17), 1–15. doi:10.1007/s12517-021-08121-z
Karami, A., and Afiuni-Zadeh, S. (2012). Sizing of Rock Fragmentation Modeling Due to Bench Blasting Using Adaptive Neuro-Fuzzy Inference System and Radial Basis Function. Int. J. Mining Sci. Tech. 22 (Issue 4), 459–463. doi:10.1016/j.ijmst.2012.06.001
Karami, A., and Afiuni-Zadeh, S. (2013). Sizing of Rock Fragmentation Modeling Due to Bench Blasting Using Adaptive Neuro-Fuzzy Inference System (ANFIS). Int. J. Mining Sci. Tech. 23 (Issue 6), 809–813. doi:10.1016/j.ijmst.2013.10.005
Kissell, F. N. (2003). Handbook for Dust Control in mining[M]. Pittsburgh: US Department of Health and Human Services, Public Health Service, Centers for Disease Control and Prevention, National Institute for Occupational Safety and Health, Pittsburgh Research Laboratory.
Kononenko, M., and Khomenko, O. (2021). New Theory for the Rock Mass Destruction by Blasting. Min. Miner. Depos. 15 (2), 111–123. doi:10.33271/mining15.02.111
Leng, Z., Fan, Y., Gao, Q., and Hu, Y. (2020). Evaluation and Optimization of Blasting Approaches to Reducing Oversize Boulders and Toes in Open-Pit Mine. Int. J. Mining Sci. Tech. 30 (Issue 3), 373–380. doi:10.1016/j.ijmst.2020.03.010
Liang, S. (2019). Study on Optimization of Blasting Parameters of Open-Pit Mine Based on BP Neural Network [D]. Inner Mongolia: Inner Mongolia University of Science and Technology.
Ma, J., Li, X. L., Wang, J. G., Tao, Z., Zuo, T., Li, Q., et al. (2021). Experimental Study on Vibration Reduction Technology of Hole-By-Hole Presplitting Blasting. Geofluids 2021, 1–10. doi:10.1155/2021/5403969
Minchinton, A., and Lynch, P. M. (1997). Fragmentation and Heave Modelling Using a Coupled Discrete Element Gas Flow Code. Fragblast 1 (1), 41–57. doi:10.1080/13855149709408389
Murr, D., Workman, L., Eloranta, J., et al. (2015). “Blasting Influence on Comminution[C],” in SAG Conference, 1–21.
Mussa, M. H., Mutalib, A. A., Hamid, R., Naidu, S. R., Radzi, N. A. M., and Abedini, M. (2017). Assessment of Damage to an Underground Box Tunnel by a Surface Explosion. Tunnelling Underground Space Tech. 66, 64–76. doi:10.1016/j.tust.2017.04.001
Mussa, M., Mutalib, A., Hamid, R., and Raman, S. (2018). Blast Damage Assessment of Symmetrical Box-Shaped Underground Tunnel According to Peak Particle Velocity (PPV) and Single Degree of Freedom (SDOF) Criteria. Symmetry 10 (5), 158. doi:10.3390/sym10050158
Nagarajan, M., Green, A., Brown, P., and Dare-Bryan, P. (2015). “Managing Coal Loss Using Blast Models and Field Measurement[C],” in Proceedings of 11th international symposium on rock fragmentation, Carlton Victoria, August 2015 (Austialasian: The Austialasian Institute of Mining and Metallurgy).
Paramonov, G. P., and Kovalevskyi, V. N. (2017). On Dust and Gas Generation upon Multiple Blasts in Open-Pit Mines[J]. J. Ind. Pollut. Control. 33 (1), 767–774.
Preece, D. S., and Knudsen, S. D. (1991). Coupled Rock Motion and Gas Flow Modeling in Blasting [R] Sandia National Labs. Albuquerque, NM(United States).
Preece, D. S. (1990). Rock Motion Simulation and Prediction of Porosity Distribution for a Two-Void-Level Retort [R]. Albuquerque, NM(USA): Sandia National Labs.
Preece, D. S., Tawadrous, A., Silling, S. A., and Wheeler, B. (2015). “Modelling Full-Scale Blast Heave with Three-Dimensional Distinct Elements and Parallel Processing[C],” in Proceedings of 11th international symposium on rock fragmentation, Carlton Victoria (Austialasian: The Austialasian Institute of Mining and Metallurgy).
Raj, K. V. (2015). Three Dimensional Computational Fluid Dynamics Models of Pollutant Transport in a Deep Open Pit Mine under Arctic Air Inversion and Mitigation Measures. Fairbanks, Alaska: Department of Mining and Geological Engineering University of Alaska Fairbanks.
Ray, S. K., Mohalik, N. K., Khan, A. M., Mishra, D., Varma, N. K., Pandey, J. K., et al. (2020). CFD Modeling to Study the Effect of Particle Size on Dispersion in 20l Explosion Chamber: An Overview. Int. J. Mining Sci. Tech. 30 (Issue 3), 321–327. doi:10.1016/j.ijmst.2020.04.005
Shaocheng, G., Zhihui, H., Deji, J., Xi, C., and Fangwei, H. (2017). The Law of Blasting Dust in Open Pit and the Optimization of Water Gun Mud Ratio. J. Liaoning Tech. Univ. (Natural Sci. Edition) 36 (3).
Sobolev, V., Bilan, N., Dychkovskyi, R., Caseres Cabana, E., and Smolinski, A. (2020). Reasons for Breaking of Chemical Bonds of Gas Molecules during Movement of Explosion Products in Cracks Formed in Rock Mass. Int. J. Mining Sci. Tech. 30 (2), 265–269. doi:10.1016/j.ijmst.2020.01.002
Song, Z., Fan, J., Qi, W., Yang, X., Wang, J., and Ji, Y. (2016). Study on green Mining Technology and Evaluation index System of Open-Pit Coal Mine [J]. Acta Coal Sinica 41 (S2), 350–358.
Song, Z. (2020). Implementing green Mining to Promote the Sustainable Development of Open-Pit Coal Mine [J]. China Coal 46 (03), 40–46. doi:10.19880/j.cnki.ccm.2020.03.005
Wang, J., Zuo, T., Li, X., Tao, Z., and Ma, J. (2021a). Study on the Fractal Characteristics of the Pomegranate Biotite Schist under Impact Loading[J]. Geofluids 2021, 1–8. doi:10.1155/2021/1570160
Wang, Z.-M., Zhou, W., Jiskani, I. M., Ding, X.-H., Liu, Z.-C., Qiao, Y.-Z., et al. (2021b). Dust Reduction Method Based on Water Infusion Blasting in Open-Pit Mines: a Step toward green Mining. Energy Sourc. A: Recovery, Utilization, Environ. Effects, 1–15. doi:10.1080/15567036.2021.1903118
Xie, X., and Lu, W. (2008). 3P (Precise, Punctilious and Perfect) Blasting[J]. Eng. Blasting (3), 1–7.
Xie, X. (2014). Precision Blasting, Current Status and its Prospective[J]. Strateg. Study CAE 16 (11), 14–19.
Yan, S-L., and Xue, L. (2004). Progress and Tendency of the Dust-Control for Demolition Blasting [J]. Eng. Blasting 3, 014.
Zhang, Y.-g., Qiu, J., Zhang, Y., and Wei, Y. (2021a). The Adoption of ELM to the Prediction of Soil Liquefaction Based on CPT. Nat. Hazards 107 (1), 539–549. doi:10.1007/s11069-021-04594-z
Zhang, Y.-g., Tang, J., He, Z.-y., Tan, J., and Li, C. (2021b). A Novel Displacement Prediction Method Using Gated Recurrent Unit Model with Time Series Analysis in the Erdaohe Landslide. Nat. Hazards 105 (1), 783–813. doi:10.1007/s11069-020-04337-6
Keywords: open-pit mine, blasting dust, blasting parameter optimization, short-delay blasting, charge constitution, dust suppression measures
Citation: Jia Z, Song Z, Fan J, Jiang J and Guo S (2022) Numerical Simulation Study on Dust Suppression Mechanism of Burning Rock Blasting in Open-Pit Mine. Front. Earth Sci. 10:832650. doi: 10.3389/feart.2022.832650
Received: 10 December 2021; Accepted: 18 January 2022;
Published: 02 March 2022.
Edited by:
Faming Huang, Nanchang University, ChinaReviewed by:
Mohamed Mussa, University of Warith Al-Anbiyaa, IraqArunachalam Vasanthanathan, Mepco Schlenk Engineering College, India
Copyright © 2022 Jia, Song, Fan, Jiang and Guo. This is an open-access article distributed under the terms of the Creative Commons Attribution License (CC BY). The use, distribution or reproduction in other forums is permitted, provided the original author(s) and the copyright owner(s) are credited and that the original publication in this journal is cited, in accordance with accepted academic practice. No use, distribution or reproduction is permitted which does not comply with these terms.
*Correspondence: JunFu Fan, anVuZnVmYW5AMTYzLmNvbQ==