 Johann Müller
 Yadong Sun1*
 Fen Yang
 Michael Joachimski
94% of researchers rate our articles as excellent or good
Learn more about the work of our research integrity team to safeguard the quality of each article we publish.
Find out more
ORIGINAL RESEARCH article
Front. Earth Sci., 09 March 2022
Sec. Biogeoscience
Volume 10 - 2022 | https://doi.org/10.3389/feart.2022.832308
This article is part of the Research TopicHow Large Igneous Provinces (LIPs) During the Triassic Shaped Modern-Day EcosystemsView all 15 articles
The ultimate cause(s) of the end-Permian mass extinction (∼252 Ma ago) has been disputed. A complex interplay of various effects, rather than a single, universal killing mechanism, were most likely involved. Climate warming as consequence of greenhouse gas emissions by contemporaneous Siberian Traps volcanism is widely accepted as an initial trigger. Synergetic effects of global warming include increasing stratification of the oceans, inefficient water column mixing, and eventually low marine primary productivity culminating in a series of consequences for higher trophic levels. To explore this scenario in the context of the end-Permian mass extinction, we investigated sedimentary total organic carbon, phosphorus speciation as well as nickel concentrations in two low-latitude Tethyan carbonate sections spanning the Permian-Triassic transition. Total organic carbon, reactive phosphorus and nickel concentrations all decrease in the latest Permian and are low during the Early Triassic, pointing to a decline in primary productivity within the Tethyan realm. We suggest that the productivity collapse started in the upper C. yini conodont Zone, approximately 30 ka prior to the main marine extinction interval. Reduced primary productivity would have resulted in food shortage and thus may serve as explanation for pre-mass extinction perturbations among marine heterotrophic organisms.
Anthropogenic global warming is expected to decline marine primary productivity with severe consequences for global ecosystems as well as for mankind (Mora et al., 2013). This is because climate warming likely slows down the meridional overturning circulation, decreases wind-driven coastal and equatorial upwelling intensity but increases thermal stratification thereby inhibiting the mixing of shallow and deep waters (Behrenfeld et al., 2006). Bulk primary production in today’s oceans is mainly confined to equatorial and shelf areas where upwelling systems replenish nutrients to the euphotic zone (Boyd et al., 2014). In general, there is a complex interplay between water column mixing, oxygen saturation of sea water, nutrient levels in the euphotic zone, primary productivity, and organic carbon export to deep waters and the sediment. For example, 1) upwelling systems replenish phosphorus (P) to the euphotic zone 2) organic matter remineralization consumes oxygen and 3) seafloor hypoxia favors P recycling from sediments (Figure 1; e.g., Ingall et al., 1993). Under normal climatic conditions, this eutrophication feedback mechanism is able to maintain high levels of productivity in coastal shelf areas, e.g., in the euphotic zone along the modern Peruvian margin (Burnett et al., 1982). However, if vertical mixing weakens due to warming, the nutrient P will be trapped in deeper waters where it cannot be utilized by phytoplankton (Behrenfeld et al., 2006), ultimately leading to a food shortage for higher trophic levels.
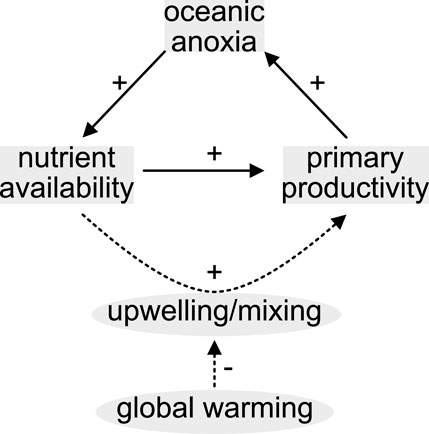
FIGURE 1. Positive feedback mechanism promoting high primary productivity. Global warming may impede the feedback from operating efficiently by weakening the mixing module.
To better understand the marine nutrient cycling in the context of ongoing global warming, it is of prime importance to investigate intervals of potent warming in the geological past. Among the so called “big five” mass extinctions, the end-Permian mass extinction stands out being regarded as the most devastating in the Phanerozoic (Newell, 1967; Raup and Sepkoski, 1982; Bambach et al., 2004; Stanley, 2016; Bond and Grasby, 2017). Several coinciding ecological changes were inferred from the geological record using different sedimentological, paleontological, and geochemical methods and many controversial hypotheses exist concerning their causal relationships with no consensus having been reached hitherto. For example, stable oxygen isotope studies of conodont apatite indicate that the Earth has experienced significant and relatively rapid global warming during the latest Permian (e.g., Joachimski et al., 2012; Sun et al., 2012; Schobben et al., 2014; Chen et al., 2020; Joachimski et al., 2020). Low latitude sea surface temperatures increased by ∼10°C within ∼40 ka from the latest Changhsingian into the Induan. The contemporaneity of Siberian Traps volcanism suggests that volcanogenic greenhouse gas emissions raised atmospheric pCO2 to high levels (Svensen et al., 2009; Burgess et al., 2017). Additionally, the injection of isotopically light, volcanogenic carbon to the atmosphere potentially generated the prominent negative carbon isotope excursion at the Permian-Triassic (P-T) boundary (Korte et al., 2010; Korte and Kozur, 2010; Shen et al., 2012). Intense ocean anoxia during the crisis interval was recognized early based on the widespread occurrence of sedimentary facies typical for deposition under hypoxic conditions (Wignall and Hallam, 1992; Wignall and Twitchett, 1996; Isozaki, 1997). This was confirmed by various proxies such as framboidal pyrite analysis, trace metal concentrations, stable sulfur and uranium isotopes and iron speciation further refining the record of P-T ocean anoxia (e.g., Riccardi et al., 2006; Grasby et al., 2013; Clarkson et al., 2016; Lau et al., 2016; Wignall et al., 2020). In contrast to the previously proposed P-T superanoxia, the current understanding is that of a spatially and temporally heterogenous anoxic event that initiated ∼70 ka prior to the main marine extinction level (Zhang et al., 2018).
While climate warming and ocean anoxia are reasonably well-established for the end-Permian mass extinction, marine primary productivity levels at the time remain intensively debated. Studies arguing for a boost in marine primary productivity through enhanced continental input of nutrients (i.e., eutrophication; e.g., Algeo and Twitchett, 2010; Schobben et al., 2020) are opposed to studies pointing towards a productivity collapse due to strong ocean stratification and/or weak upwelling with inefficient nutrient shuttling to the euphotic zone (i.e., oligotrophication; e.g., Schoepfer et al., 2012; Grasby et al., 2016; Sun et al., 2021). Other authors point out that a loss of nitrate under anoxic conditions more likely resulted in an ammonium ocean during the end-Permian mass extinction and P was possibly not the limiting nutrient at the time (Sun et al., 2019; Grasby et al., 2020). The oligotrophication scenario is in better accordance with modelling results for the near future and changes we have already observed in the recent past (e.g., Bopp et al., 2013; Roxy et al., 2016). Furthermore, Earth system modelling for the P-T interval predicts a decline in net primary productivity (−40% globally) especially in low latitudes and a large P reservoir in the deep water column (Supplementary Figure S4 in Penn et al., 2018).
In order to document marine P cycling and associated changes of primary productivity in the Tethys Ocean during the critical P-T boundary interval, we investigated sedimentary P distributions, total organic carbon (TOC) and nickel (Ni) concentrations in two carbonate successions from South China and Armenia (Figure 2). A sequential P extraction method was applied to reconstruct bioavailable, reactive P (Preact). C/P molar ratios are used to evaluate early diagenetic P transfer processes (sink switching) as well as the degree of P burial versus benthic P release (i.e., the P burial efficiency). The geochemical records from both studied sections suggest a decrease in primary productivity in the Tethyan region starting well before the end-Permian mass extinction.
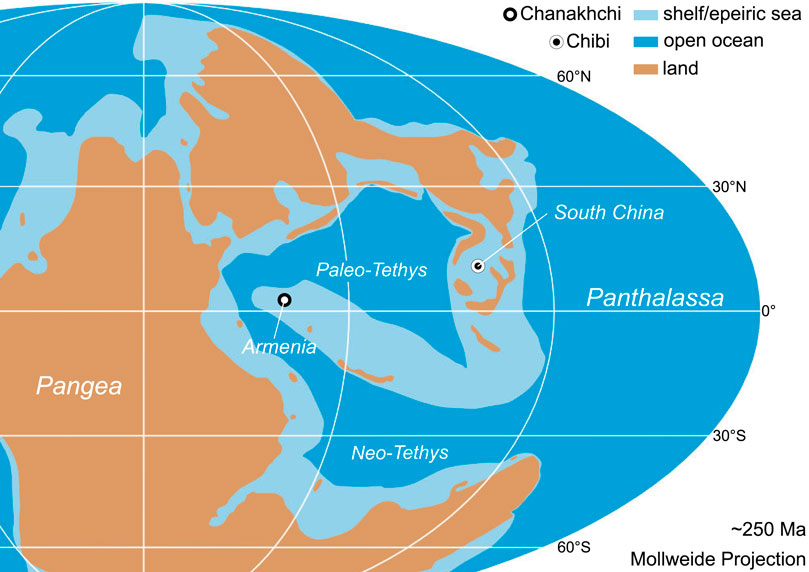
FIGURE 2. Changhsingian paleogeographic reconstruction after Kocsis and Scotese (2021) with locations of studied sections.
Studied P-T boundary successions were deposited across the Paleotethys ocean at tropical latitudes between 0 and 20°N (Kocsis and Scotese, 2021; Figure 2). The studied Chibi Section (29.7515 N, 113.9519 E) is located in South China about 100 km south of the city of Wuhan (Hubei Province). The study area is part of the South China Block which was situated in tropical latitudes at the eastern margin of the Paleotethys Ocean during the Lopingian. At that time, the South China Block was characterized by a vast carbonate platform (Yangtze Platform) passing into a deeper basin with siliceous carbonate and chert deposition further north. During the Wuchiapingian, the Chibi section was located on a shallow water platform, but as consequence of a relative sea level rise, the depositional setting changed to a deeper slope setting in the latest Changhsingian. The continuous sedimentary succession is represented by the Lopingian Wujiaping and Dalong Formations as well as the Early Triassic Daye Formation. With the depositional environment deepening during the Changhsingian, dark gray to black siliceous carbonates and cherts with sponge spicules and radiolarian tests (Dalong Formation) were deposited. The P-T transition is characterized by a volcanic ash bed followed by thinly bedded, in part dolomitic light gray carbonates and marls of the Early Triassic (Daye Formation). While some latest Permian and Early Triassic beds are rich in gastropods and show signs of bioturbation, most carbonates are laminated and lack fossils (Figure 3).
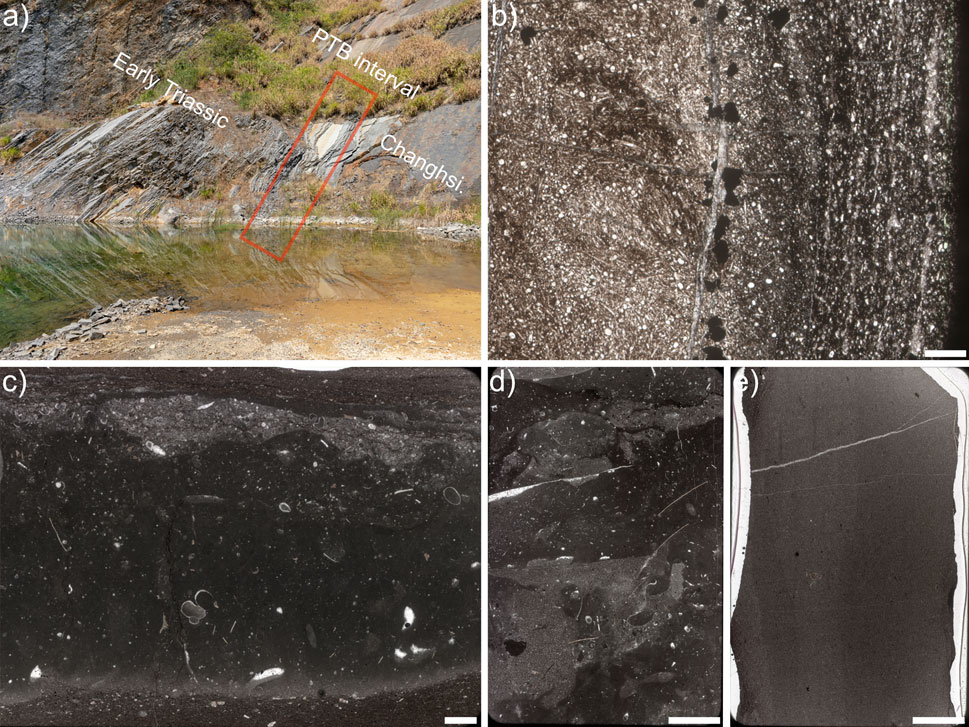
FIGURE 3. Chibi section and microfacies of Changhsingian and Early Triassic carbonates. (A) Chibi section, (B) Changhsingian spiculite (sample Y12; scale is 5 mm), (C,D) basal Early Triassic bioturbated limestone rich in gastropods with prominent burrows (sample Z10 and Z11; scale is 2 and 5 mm, respectively), (E) Griesbachian laminated limestone (sample Z33; scale is 5 mm).
The Chanakhchi (former Sovetashen) section (39.8412 N, 45.0491 E) is located in Central Armenia close to the village of Zangakatun about 60 km southeast of the capital Yerevan. The area is part of the South Armenian Block belonging to the Anatolide-Tauride South Armenian microplate, which rifted northward from North Gondwana in the late Paleozoic (Meijers et al., 2015). During the P-T transition, the Cimmerian terranes were located at tropical latitudes and separated the opening Neo-Tethys to the south from the closing Paleo-Tethys to the north. The Changhsingian is characterized by irregularly bedded to nodular gray to reddish limestones (Paratirolites Beds) followed by thin reddish marls with thin lenticular limestone beds (“Boundary Clay”) of the Akhura Formation. The latest Permian and basal Early Triassic are characterized by microbialites interfingering with reddish to gray micritic limestones. These are overlain by the Karabaglyar Formation, a monotonous succession of platy, non-bioturbated and partially laminated limestones of Griesbachian to Dienerian age. The prominent Early Triassic sponge microbial buildups suggest a platform environment between fair-weather and storm wave base during the earliest Triassic (Baud et al., 2007; Friesenbichler et al., 2018; Foster et al., 2020).
The sampling of the Chibi section started at the boundary between the Lopingian Wujiaping and Dalong Formations and reaches up a few meters into the Early Triassic Daye Formation (∼14 m; Figure 3). Only fresh and unweathered hand specimens were collected bed by bed. One part of the samples was sent for thin section preparation while the other part was powdered for geochemical analyses. For the latter, weathered or altered surfaces as well as parts of the samples comprising diagenetic features like calcite veins were removed with a rock saw. After this, samples were crushed with a jaw crusher and ground to powder using an agate disc mill. Finally, powders were sieved passing through 125 μm and stored in polypropylene beakers.
Armenian samples were selected from an existing sample set taken in the Chanakhchi section during earlier field campaigns in 2011 and 2013 (Joachimski et al., 2020). The sampled interval covers the Lopingian Akhura Formation and the lower member of the Early Triassic Karabaglyar Formation (∼44 m). Because samples were taken at a very high resolution, around 300 specimens were available. For this study 66 samples were selected in even intervals. Samples were put in a polypropylene sleeve and then crushed with a hammer. From the resulting rock chips fresh and unaltered rock pieces were picked manually. Selected rock chips were powdered with an agate ball mill. To ensure that no coarse grains remained within the powder, samples were sieved through 125 μm and stored in polypropylene beakers.
Carbonate powders of samples from the Chibi section were reacted with phosphoric acid at 70°C using a Gasbench II connected to a ThermoFisher Delta V Plus isotope ratio mass spectrometer (IRMS) at the GZN Erlangen. Reproducibility and accuracy were monitored by replicate analysis of in-house standards calibrated against NBS19 (1.95‰) and LSVEC (−46.6‰). Reproducibility for δ13C was ±0.03‰ (1σ; n = 18). All values are reported in per mil ‰ using the standard delta notation (δ13C) relative to Vienna—Pee Dee Belemnite (V-PDB).
For the determination of TOC contents, carbonate was removed by treating bulk rock powders with hydrochloric acid. About 5 g of each powdered sample were weighed into 250 ml glass beakers and approximately 200 ml of 10% HCl was added while carefully stirring with a glass rod. The beakers were then covered with a watch glass and placed on a hotplate at 50°C for a minimum of 12 h. The procedure was repeated in case there was still reaction observable after this time. Insoluble and carbonate free residues were repeatedly washed with deionized H2O until the supernatant had a pH between 6 and 7. The insoluble residues were then transferred into pre-weighed evaporating dishes which were then placed into an oven at 50°C until they were dry and weights were constant. At last, the dry residues were homogenized with an agate pestle and mortar and stored in glass vials.
The organic carbon concentration of the insoluble residues was measured with a ThermoFisher Flash 2000 elemental analyzer connected to a Delta V Plus IRMS at the GZN Erlangen. Precision determined from replicate analyses of laboratory standards OAS (1.61% C) and Jon1 (0.44% C) was ±0.09% (1σ, n = 23) and ±0.05% (1σ, n = 5), respectively.
The TOC content of the original sample (TOCsample) in % was calculated by multiplying the organic carbon concentration of the insoluble residues (OCres) in % with the ratio between the weight of the insoluble residues (mres) and the original samples (msample):
In order to determine the concentration of bio-available or reactive P (Preact), we used the sequential phosphorus extraction method (SEDEX) developed by Ruttenberg (1992). The SEDEX technique enables to extract loosely adsorbed phosphorus (Pex), P bound to Fe-oxyhydroxides (PFe), authigenic apatite-P (Pauth), detrital apatite-P (Pdet), and P bound to organic matter (Porg) by treating sample powders with reagents of increasing “aggressivity” in five steps (Figure 4). To avoid contamination only p.a. grade reagents and ultrapure (UP) H2O (Merk MilliQ) were used. Additionally, all used glassware was cleaned in a 10% HCl bath for a minimum of 24 h and then rinsed three times with UP H2O.
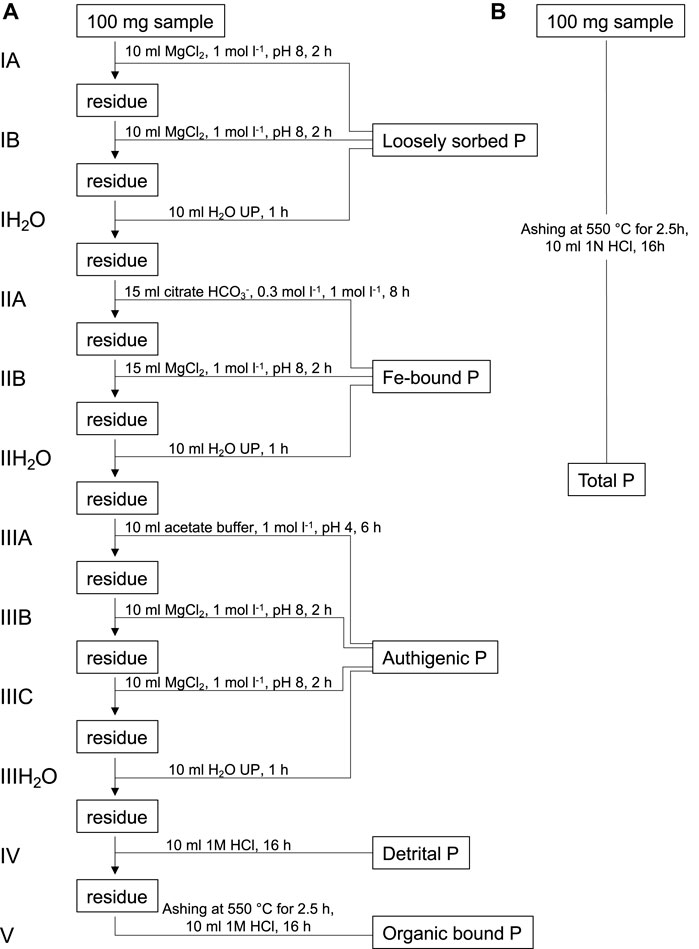
FIGURE 4. (A) Sequential phosphorus extraction scheme used based on the original SEDEX method developed by Ruttenberg (1992). (B) Method for the extraction of total P (Aspila et al., 1976).
First, sample splits of about 100 mg were weighed into clean 50 ml polypropylene centrifuge tubes. To extract the Pex fraction, the samples were treated with 10 ml MgCl2 solution (1 mol L−1, pH 8) twice for 2 h followed by a rinsing step with 10 ml UP H2O for 1 h. After this, 15 ml of a citrate-bicarbonate solution (0.3 mol L−1, 1 mol L−1, pH 7.6) and 0.375 g sodium dithionite were added and centrifuge tubes were shaken for 8 h to extract PFe. Subsequently the residues were rinsed with 15 ml MgCl2 solution for 2 h and with 10 ml UP H2O for 1 h. This was followed by the extraction of Pauth using 10 ml of a sodium acetate buffer solution (1 mol L−1, pH 4) for 6 h. Next, samples were rinsed with 10 ml MgCl2 for 2 h and 10 ml UP H2O for 1 h. After this, Pdet was extracted from the residue by treating the residue with 1 M HCl for 16 h. Finally, the residues were transferred from the centrifuge tubes into glass vials and evaporated at 80°C in an oven. Once dry, 0.4 ml MgNO3 solution (50% w v−1) was added and the vials were placed in a furnace at 550°C for 2.5 h. Eventually, the ashed residues were treated with 10 ml 1 M HCl for another 16 h to extract Porg. To determine total P (Ptot) 0.4 ml MgNO3 solution (50% w v−1) was added to 100 mg sample splits in glass vials. Vials were placed in a furnace and samples were ashed for 2.5 h at 550°C. Residues were then treated with 1 M HCl for 16 h to extract Ptot (Aspila et al., 1976). It should be noted here that the P-fractions of the different steps are operationally defined and do not necessarily represent chemically discriminable entities.
To ensure that samples were in contact with the reagents throughout the procedure the powders must be kept suspended. This was accomplished by placing the centrifuge tubes onto a shaker table at a suitable speed. After each step the tubes were centrifuged at 4,000*g for 10 min and the supernatant solutions were decantated and filtered through 0.45 μm nylon syringe filters into clean 20 ml polyethylene bottles. The supernatants were then acidified with concentrated HCl and stored in a fridge until analysis.
Concentrations of phosphate in the solutions generated by the SEDEX method (steps I, III, IV and V) were determined with the photometric ascorbic acid method developed by Murphy and Riley (1962). This method is based on the formation of a blue colored molybdate complex with the intensity of the blue color being proportional to the phosphate concentration in the solution.
For this, 100 μL of a mixing reagent (4.5 N sulfuric acid, 0.001 mol L−1 antimony potassium tartrate, 0.01 mol L−1 ammonium heptamolybdate) and 100 μL of an ascorbic acid solution (0.4 mol L−1) were added to 3 ml of the diluted sample solution. Blue color was allowed to develop for 30 min and absorbance values were measured with a Hach & Lange, DR 2800 spectrophotometer at 880 nm in 1 cm disposable PS cells. Because of the reducing property of dithionite and the interfering organic ligands from the sodium citrate in the solution generated in step II (PFe), it is not possible to measure the phosphate concentrations using the ascorbic acid method (Ruttenberg, 1992). Instead PFe was obtained by subtraction (see below).
To calculate the phosphate concentrations from the measured absorbance values a standard calibration curve was established. Because interferences caused by the different reagents used in the SEDEX procedure may influence the measurement, matrix matched standard solutions were prepared from a phosphate stock solution (1,000 mg L−1 PO43−). Linear regression analysis was performed by relating the concentration of phosphate in the standard solutions to the measured absorbance value. The resulting equation was used to calculate the concentrations in the sample solutions (fit better than R2 = 0.99 in all cases). Sample solutions were diluted with 0.1 M HCl or H2O UP to be bracketed by the concentrations of the respective standard solutions. Finally, the concentrations of the different phosphate fractions in the sample powders (csample in mg g−1) were obtained from the concentration of the respective solutions (csol in mg L−1), the volume of the solutions (Vsol in L) and the sample weights (msample in g) by following equation:
To perform a background correction and to check for potential contamination during the SEDEX procedure two procedural blanks were included in each run of twelve samples. Average absorbance of the blank solutions was subtracted from the absorbance values of the samples prior to calculating concentrations. In order to estimate precision of the whole method an internal standard was processed and measured along every twelve samples (Table 1). Reproducibility for the concentration of Preact was ±0.06 mg g−1 (n = 8; RSD = 6%).
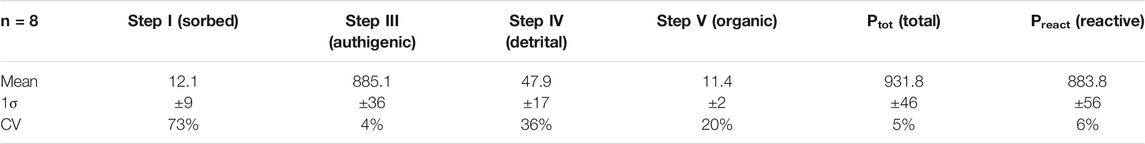
TABLE 1. Mean P concentrations in ppm of the different P species in replicate analyses of internal standard X1 (n = 8). 1σ - standard deviation, CV - coefficient of variation.
Bulk major and trace element concentrations were measured via ICP-AES and ICP-MS on bulk rock powders after lithium borate fusion and four acid digestion at ALS Global Ltd. Analytical precision was better than 10% (RSD). For the presentation of the Ni data, we used Niexcess which is the concentration of bulk Ni minus terrigenous Ni. This was done because Ni in bulk rock samples should be comprised of a terrigenous and an authigenic fraction. Enrichment factors (EF = (Ni/Alsample)/(Ni/AlPAAS)) were not calculated because our samples were mainly carbonates and cherts and because the PAAS reference for EF calculation is a shale. Niexcess values were calculated as
where (Ni/Al)PAAS is the Ni to Al ratio of average Post-Archean Australian shale (Ni/AlPAAS = 5.49 × 10⁻⁴; Taylor and McLennan, 1985). In principle, the calculation of excess contents assumes that the Ni content of the terrigenous input was close to PAAS and that there was no variation in Ni/Al over the studied time interval. Values <0 are interpreted to reflect no authigenic Ni enrichment.
Assuming that all P species, except for Pdet, were bioavailable before sedimentation, the concentration of Preact was calculated by subtracting the concentration of Pdet from the concentration of Ptot:
PFe was determined by subtracting all P fractions determined via the ascorbic acid method (steps I, III, IV and V) from Ptot:
C/P molar ratios were calculated as follows:
where M(C) and M(P) are the molar masses of carbon and phosphorus, respectively.
Changhsingian δ13Ccarb values in the Chibi section vary between 1.2 and 2.5‰ (avg. = 1.85‰, 1σ = ±0.45‰, n = 6; Figure 5A; Supplementary Table S1) until they start to increase at 5.83 m below the P-T boundary to values between 2.2 and 3.6‰ (avg. = 2.97‰, 1σ = ±0.55‰, n = 11). Values start to decrease sharply by almost 3‰ at 1.2 m below the P-T boundary (upper C. yini conodont Zone) to a minimum value of 0.1‰ at 0.63 m above the P-T boundary (I. isarcica Zone). This negative shift is followed by a gradual increase in δ13Ccarb in the Early Triassic with the stratigraphically highest sample showing a value of 1.1‰. For a discussion of the Chanakhchi carbon isotope record the reader is referred to Joachimski et al. (2020).
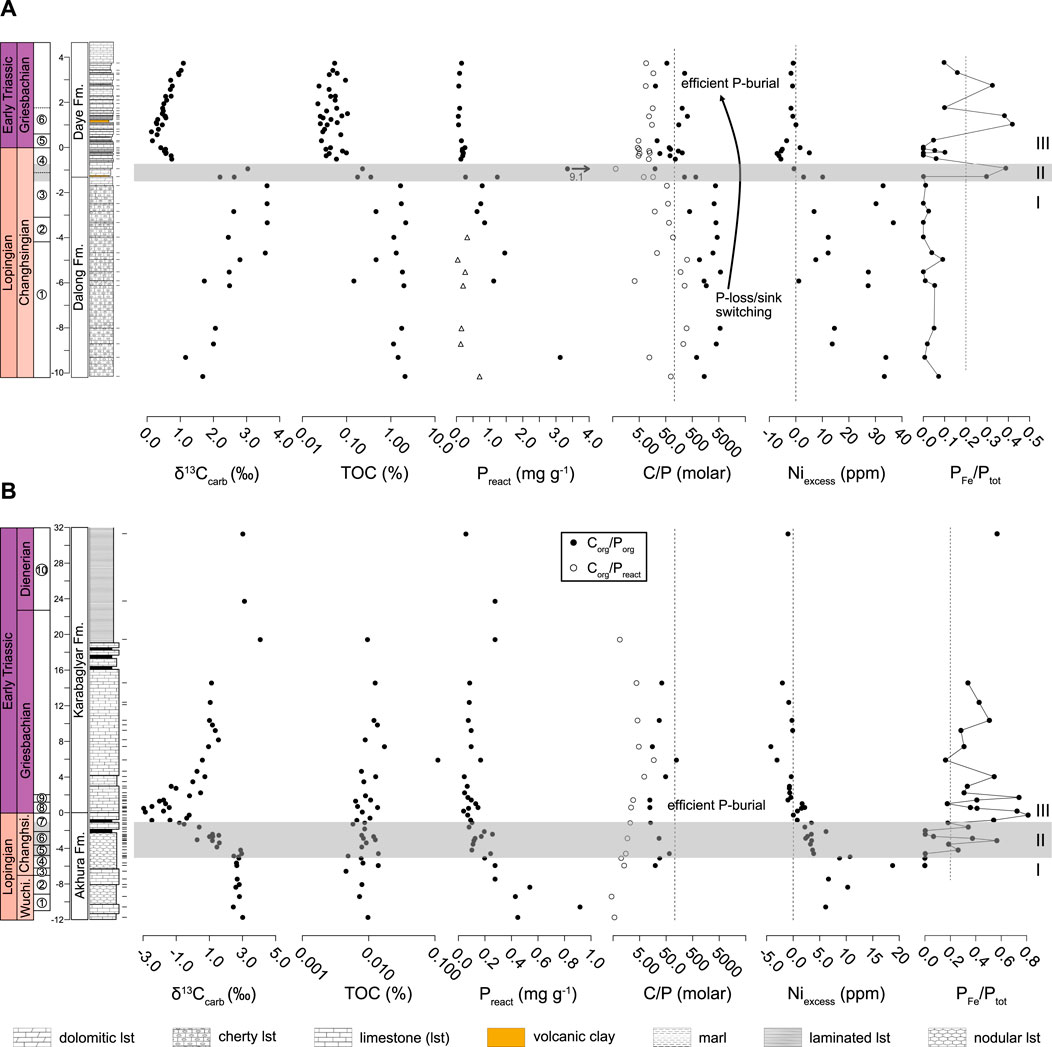
FIGURE 5. δ13Ccarb, TOC, Preact, C/P molar ratio, Niexcess and PFe/Ptot for (A) Chibi and (B) Chanakhchi. Vertical dashed lines in C/P plots indicate average C/P of marine organic matter of 106 (Redfield et al., 1963). Grey bars represent transitional phase II defined by intermediate Niexcess separating phase I and III. Conodont zonation and carbon isotopes for Chanakhchi from Joachimski et al. (2020). Conodont Zones at Chibi: 1 - C. subcarinata, 2 - C. changxingensis, 3 - C. yini, 4 - H. praeparvus, 5 - H. parvus, 6 - I isarcica. Conodont Zones at Chanakhchi: 1 - C. transcaucasia, 2 - C. orientalis, 3 - C. subcarinata, 4 - C. bachmanni, 5 - C. nodosa, 6 - C. zhangi to C. hauschkei, 7 - H. praeparvus, 8 - H. parvus, 9 - I. isarcica, 10 - N. dieneri. Vertical dashed lines in PFe/Ptot plot marks the defined 20% threshold. Triangles in the Preact plot for the Chibi section are samples affected by strong P loss indicated by high C/Preact.
In the lower part of the Chibi section, TOC values range from 0.15 to 2.17% (avg. = 1.39%, 1σ = ±0.64%, n = 14; Figure 5A; Supplementary Table S1). After this, they start to decrease 1.4 m below the P-T boundary (upper C. yini Zone) with average contents of 0.05% (1σ = ±0.02%, n = 32) measured from 0.6 m below the P-T boundary to the Early Triassic. Samples from the Chanakhchi section show average TOC contents of 0.01% (1σ = ±0.016%, n = 42) with only minor, statistically insignificant variation throughout the studied interval (Figure 5B; Supplementary Table S2). In general, such extremely low TOC contents should be treated with caution. Potentially, small flaws during sample preparation using the above-described method could result in artificially low values. Hence the TOC record from Chanakhchi is not interpreted in terms of relative changes because they are obviously below reproducibility of the data.
Niexcess values in the Chibi section are between 1.1 and 36.7 ppm (avg. = 18.9 ppm, 1σ = ±12.4 ppm, n = 16; Figure 5A; Supplementary Table S1) in the lower part of the studied section (Changhsingian) and decrease to <0 at 1.2 m below the P-T boundary (C. yini to H. praeparvus Zone). Upsection Niexcess increases slightly and values stabilize close to 0. High and variable Niexcess values between 6.1 and 18.7 ppm (avg. = 10.2 ppm, 1σ = ±4.6 ppm, n = 6) are observed in the Chanakhchi section in the C. transcaucasia to C. bachmanni Zone (Figure 5B; Supplementary Table S2). Niexcess starts to decrease 4.7 m below the P-T boundary and reaches values <0 in the uppermost H. praeparvus Zone. Upwards Niexcess stays below 0 with two samples (Ch217 and Ch207) showing very negative values between the I. isarcica and N. dieneri zones.
Preact in the latest Changhsingian of the Chibi section is highly variable with values between 0.04 and 1.46 mg g−1 (Figure 5A; Supplementary Table S1). Two exceptionally high values of 3.13 and 9.14 mg g−1 are observed at 9.4 and 1 m below the P-T boundary, respectively (samples Y14 and Z2). Preact contents decrease at 0.8 m below the P-T boundary (H. praeparvus Zone) and vary between 0.06 and 0.26 mg g−1 (avg. = 0.14 mg g−1, 1σ = ±0.06 mg g−1; n = 14) in the uppermost Changhsingian and Griesbachian. Preact in the Chanakhchi section also exhibits a downward trend towards the P-T boundary, albeit the decrease in Preact appears more gradual than in the Chibi section (Figure 5B; Supplementary Table S2). The highest value of 0.92 mg g−1 is observed 10.6 m below the P-T boundary in the C. transcaucasia Zone (sample Ch37). Above this level, values decline gradually and vary around an average of 0.11 mg g−1 (1σ = ±0.06 mg g−1, n = 36) in the H. praeparvus Zone and the Early Triassic. Hence, both sections show a significant decrease in Preact from the Lopingian into the Early Triassic.
In both sections, the proportion of PFe relative to Ptot, expressed as the ratio PFe/Ptot, is elevated in specific time intervals (Figure 5). We used a PFe/Ptot ratio >0.2 to characterize intervals where PFe represents an important P fraction. This estimate is based on modern, global P burial flux calculations showing that PFe contributes ∼20% to the total reactive P flux to the sediment (Ruttenberg, 1993). In the Chibi section, PFe/Ptot ratios >0.2 are observed in the C. yini to H. praeparvus Zones (1.4–1 m below the P-T boundary) and in the I. isarcica Zone (0.9–2.7 m above the P-T boundary). At Chanakhchi, PFe/Ptot > 0.2 are registered in the C. nodosa and C. zhangi Zones (4.1 and 2.9 m below the P-T boundary) and in an interval starting 1.6 m below the P-T boundary, from the H. praeparvus to the N. dieneri Zone (avg. = 0.42, 1σ = ±0.19, n = 22). In the latter interval, three samples show PFe/Ptot < 0.2. In all other samples, PFe is a minor fraction of Ptot with PFe/Ptot < 0.2.
At Chibi, C/Porg ratios range from 254 to 5,780 (avg. = 2,576, 1σ = ±1861, n = 16) in the Changhsingian and start to decrease at 1.2 m below the P-T boundary (C. yini to H. praeparvus Zone; Figure 5A; Supplementary Table S1). Values in the uppermost Changhsingian and Griesbachian fluctuate between 20 and 328 (avg. = 119, 1σ = ±96, n = 15). C/Preact ratios are lower than the C/Porg ratios. C/Preact values are between 3 and 318 (avg. = 108, 1σ = ±112, n = 16) and decrease in parallel with C/Porg to low values between 1 and 17 (avg. = 9, 1σ = ±5, n = 15). At Chanakhchi, C/P ratios show no significant change but C/Porg values of 12–122 (avg. = 39, 1σ = ±31, n = 14) are higher than C/Preact values between 0 and 17 (avg. = 4, 1σ = ±4, n = 19) throughout the studied interval (Figure 5B; Supplementary Table S2).
For the discussion of the dataset, three temporal intervals are defined based on the stratigraphic variation in Niexcess. Phase I (C. transcaucasia to lower C. yini Zone) is characterized by high TOC in the Chibi section and generally high Niexcess values in both sections. Phase II (upper C. yini to lower H. praeparvus Zone) represents a transitional interval with decreasing, intermediate Niexcess values, while during phase III (upper H. praeparvus to N. dieneri Zone), low TOC and low Niexcess values are observed in both sections (see Tables 2, 3).

TABLE 2. Average geochemical values for phase I (C. transcaucasia to lower C. yini) and III (upper H. praeparvus to N. dieneri) in the Chibi section and inferred P burial efficiency and primary productivity states. Samples with negative Niexcess are interpreted to reflect no enrichment.

TABLE 3. Average geochemical values for phase I (C. transcaucasia to lower C. yini) and III (upper H. praeparvus to N. dieneri) in the Chanakhchi section and inferred P burial efficiency and primary productivity states.
TOC as a paleoproductivity proxy has major shortcomings since the TOC contents might be biased due to remineralization of organic matter in the water column, anaerobic decomposition of organic matter during diagenesis, and the dilution effect (e.g., Schoepfer et al., 2015). Thus, only a fraction of organic matter exported from surface waters sinks to the seafloor and is preserved in sediments. Niexcess is used as another productivity proxy as it shows a nutrient-like distribution in the water column and, in case of anoxic conditions, is less prone to co-precipitation with sulfides compared to Cu, Cd, or Zn (Piper and Calvert, 2009). Furthermore, stable Ni isotope data suggests that the distribution of Ni in the water column is not affected by redox cycling (Yang et al., 2021). Recent studies showed that Ni and TOC are positively correlated in modern, superficial sediments regardless of redox conditions making Ni a robust and reliable productivity proxy (Böning et al., 2015; Steiner et al., 2017). For example, Steiner et al. (2017) were able to link anthropogenic nutrient fluxes and associated productivity changes to sedimentary Ni concentrations in oxic sediments of the Gulf of Aqaba.
Niexcess shows decreasing concentrations from phase I to phase III in both study sections (Figure 5). Niexcess is positively correlated with TOC in the Chibi section (R2 = 0.88, p < 0.001; Figure 6) suggesting that Ni was mainly shuttled to the sediment by sinking organic matter. The slope of the linear regression is 16.8 and thus higher than for modern core top sediments (∼6–9; Böning et al., 2015) suggesting preferential preservation of Ni over TOC during sinking, burial, and diagenesis. Furthermore, this correlation indicates that the preservation factor of organic matter remained invariant over the studied interval in case of the Chibi section. In contrast, samples from the Chanakhchi section point towards lower preservation of organic matter in phase I, since we observe no change in TOC (∼0.01%) but a decrease in Niexcess from phase I to III. The decrease in Niexcess in both sections is interpreted as the result of declining primary productivity in the Tethys Ocean starting in the C. yini Zone. For the following discussion Niexcess values from Chanakhchi serve as a surrogate for the primary TOC content of the sediment, i.e., Chanakhchi samples with high Niexcess are interpreted to reflect a high organic matter sinking flux and vice versa.
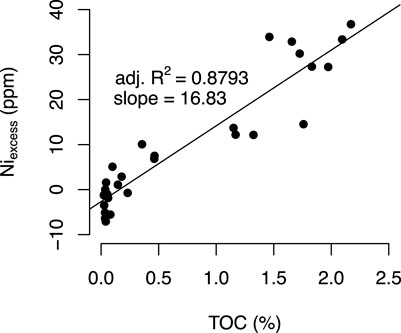
FIGURE 6. Niexcess versus TOC for the samples from Chibi section. Correlation suggests association of Ni with sedimentary organic matter, regression slope of ∼16.8 indicates preferential preservation of Ni over organic matter.
In this study we use Ni contents as a proxy for the sinking flux of organic matter because Ni is an essential nutrient for photosynthesizing organisms. However, an alternative source of Ni could be through the deposition of Ni-rich aerosols released to the atmosphere during Siberian Traps volcanism (Le Vaillant et al., 2017). Indeed, peaks in Ni contents coinciding with the negative shift in δ13C were reported for several P-T sections (Rothman et al., 2014; Rampino et al., 2017; Li et al., 2021). Furthermore, Li et al. (2021) found that Ni-rich beds of the Buchanan Lake section exhibit extremely light Ni stable isotopic compositions corroborating a volcanogenic signature (δ60Ni down to −1.09‰). In contrast the Ni-records from Chibi and Chanakhchi are not showing such a relationship, i.e., Ni contents are already low when the negative excursion in δ13C starts (Figure 5). Hence, we argue that the Lopingian high Niexcess values of this study are unrelated to P-T volcanism and reflect high organic matter sinking fluxes.
In the case of anoxic conditions and Fe-oxide reduction, P bound to Fe-oxides will be released to the water column or porewaters and potentially reprecipitated as authigenic P-minerals (sink switching; Paytan and McLaughlin, 2007). The increase in PFe/Ptot from phase I to II (Figure 5) coincides with the observed decrease in Niexcess in both sections. At Chibi, TOC decreases with rising PFe/Ptot. Hence the data show an inverse relationship and two cases can be differentiated. Samples from Chanakhchi with low PFe/Ptot show high Niexcess while high PFe/Ptot appears together with low Niexcess and TOC. At Chibi the same relationship is observed for PFe/Ptot and Niexcess and additionally samples with low PFe/Ptot show high TOC contents.
This pattern has been observed as well in modern sediments from the California continental margin where sediments are deposited in low O2 bottom waters and P is either released or sequestered with Fe-oxides depending on the amount of organic matter remineralization (McManus et al., 1997). P is sequestered into the sediment when little organic matter is available for decomposition and vice versa. McManus et al. (1997) attribute this to the presence of a ferric layer within the upper part of the sediments providing sites for P adsorption. The ferric layer only develops if O2 consumption through organic matter remineralization is not too high and the depth of O2 penetration is intermediate.
Relatively high TOC and/or Niexcess values in combination with minor or absent PFe contents in phase I samples indicate the release of PFe during the reductive dissolution of Fe-oxides in a sediment where free oxygen was effectively consumed by organic matter degradation which shifted sediment redox conditions below the zone of Fe3+ reduction (further supported by high C/Preact at Chibi). In contrast, O2 consumption through organic matter remineralization was likely minor in phases II and III as signaled by low sedimentary TOC and/or Niexcess. Redox conditions not below the zone of nitrate or Mn4+ reduction would have favored the formation of ferric layers which served as an efficient P sink (further supported by low C/Preact). This can explain the preservation of high PFe proportions in the phase III samples.
Both sections show a significant decrease in average Preact concentrations from phase I to phase III (Figure 5; Tables 2, 3). This decrease can be explained either by benthic P regeneration causing a decrease in the P burial efficiency and therefore low P contents in sediments (Ingall and Jahnke, 1994) or a lower primary productivity since, besides Fe-oxyhydroxide, organic matter is the main shuttle of reactive P to the sediment (Paytan and McLaughlin, 2007).
Studies on modern, subrecent and deep time sediments have shown that P is preferentially released from the sediment to the water column under anoxic conditions (e.g., Van Cappellen and Ingall, 1994; Filippelli et al., 2003; Mort et al., 2007; Fantasia et al., 2018; Schobben et al., 2020). While the release of PFe is in the form of reductive dissolution of Fe-oxides, the enhanced release of Porg seems to be microbially mediated; i.e., the bacterial sequestration of P into stable polyphosphates is less efficient under anoxic conditions because only some P-accumulating bacteria are able to utilize nitrate as an electron acceptor for this process (Kerrn-Jespersen and Henze, 1993). In the case where dissolved P is transferred to the euphotic zone e.g., by diffusion, mixing of the water column or upwelling, it can be utilized by phytoplankton. In such case, P may increase primary productivity, expand the oxygen-minimum zone, and reinforce the sinking flux of organic carbon in a positive feedback loop (Van Cappellen and Ingall, 1994; Mort et al., 2007). The efficiency of water column mixing depends on the wind intensity, the depth of the thermocline, and the degree of thermal stratification (Kämpf and Chapman, 2016). Substantial warming from the latest Permian into the Early Triassic (e.g., Joachimski et al., 2012; Joachimski et al., 2020) likely resulted in decreased wind stress, a deeper thermocline, and enhanced stratification of the water column (e.g., Hotinski et al., 2001; Kidder and Worsley, 2004). Hence, we argue that the vertical P-shuttle was likely less efficient during the latest Permian to Early Triassic, leading to P-trapping in a large deep water P-reservoir (Penn et al., 2018).
Preact concentrations are comparably variable (0.04–1.46 mg g−1) during phase I in the Chibi section (Figure 5A). Filippelli et al. (2003) explained varying Preact concentrations in late Miocene sapropels as a consequence of precessional wind systems resulting in alternating water column stratification (low productivity, low particulate organic matter (POM)-shuttle, low net P-burial, high P-release, low Preact, P accumulation in deep water) and intense upwelling (high productivity, high POM-shuttle, high net P-burial, low P-release, P recycled to euphotic zone). This scenario is likely an analogue for phase I at Chibi. Accordingly, low Preact values would correspond to intervals with low productivity and P accumulation whereas higher Preact values would correspond to intervals with high productivity where deep-water P was effectively replenished to the euphotic zone through water column mixing. In phase III, Preact is low (avg. = 0.14 mg g−1) and less variable, again, pointing to enhanced water column stratification in the tropical Tethyan realm.
The molar ratio of organic carbon versus Porg and Preact (C/Porg and C/Preact) is used as an additional proxy to reconstruct benthic P-regeneration, the transfer of P into authigenic phases and hence the burial efficiency of P. While sinking organic matter has a stoichiometrical C/P ratio of 106 (Redfield et al., 1963), after sedimentation under anoxic conditions, P might be preferentially released increasing the C/P ratio of refractory organic matter to >106 (Ingall et al., 1993). Released P can either be transferred to the upper water column where it can be re-used by primary production or precipitated as authigenic phosphate in the sediment (Paytan and McLaughlin, 2007). The latter mechanism is able to decrease C/Preact ratios to <106 since authigenic phosphate contributes to the Preact pool.
C/Porg ratios from the Chibi section are consistently >106 in phase I, indicating P loss during the deposition and burial of organic matter (Figure 5A). Intervals with C/Porg > 106 and C/Preact < 106 are characterized by sink switching processes, i.e., the transfer of Porg and PFe to authigenic carbonate fluorapatite. C/Porg and C/Preact > 106 can be attributed to intervals with strong P loss to the water column continuously depleting refractory organic matter with respect to P. Preact values below stoichiometrically possible concentrations of sinking organic matter are generated by this process in samples showing relatively high C/Preact ratios. Hence efficient P-recycling likely sustained high primary productivity levels in phase I. C/Porg ratios ≤106 in phase III suggest that efficient burial of Porg with benthic P-regeneration was likely inhibited. Low Preact concentrations together with C/Preact < 106 in phase III document a reduced organic matter shuttle. The high proportion of PFe in phase III can explain C/Preact < 106 because the PFe sink is decoupled from carbon cycling (see P Scavenging From the Water Column; McManus et al., 1997; Paytan and McLaughlin, 2007).
In Chanakhchi C/Porg is <106 and C/Preact is <106 throughout the sampled interval (Figure 5B). Like in Chibi, the latter is explained by the relatively high proportion of PFe. C/Porg < 106 indicates that there was neither an active sink switch nor P loss to the water column, thus burial efficiency was high at any given time. As previously noted, sample preparation as well as organic matter remineralization might have affected C/P ratios by lowering TOC contents. However, if TOC contents were 10 times higher the calculation of C/P ratios would still give values indicative of efficient P burial.
A conceptual model was developed to explain changes in marine P cycling in the Tethys across the P-T boundary (Figure 7). Primary productivity was comparably high during the Lopingian (phase I), started to decline in the upper C. yini conodont Zone (phase II) and was at lower levels during the final Changhsingian and subsequent Early Triassic (phase III; Jiang et al., 2007; Chen et al., 2015). This interpretation is based on the observation that TOC and Niexcess (at Chanakhchi only Niexcess) contents decrease significantly across the transitional phase II and the assumption that the two proxies behave proportional to the organic matter sinking flux and thus primary productivity.
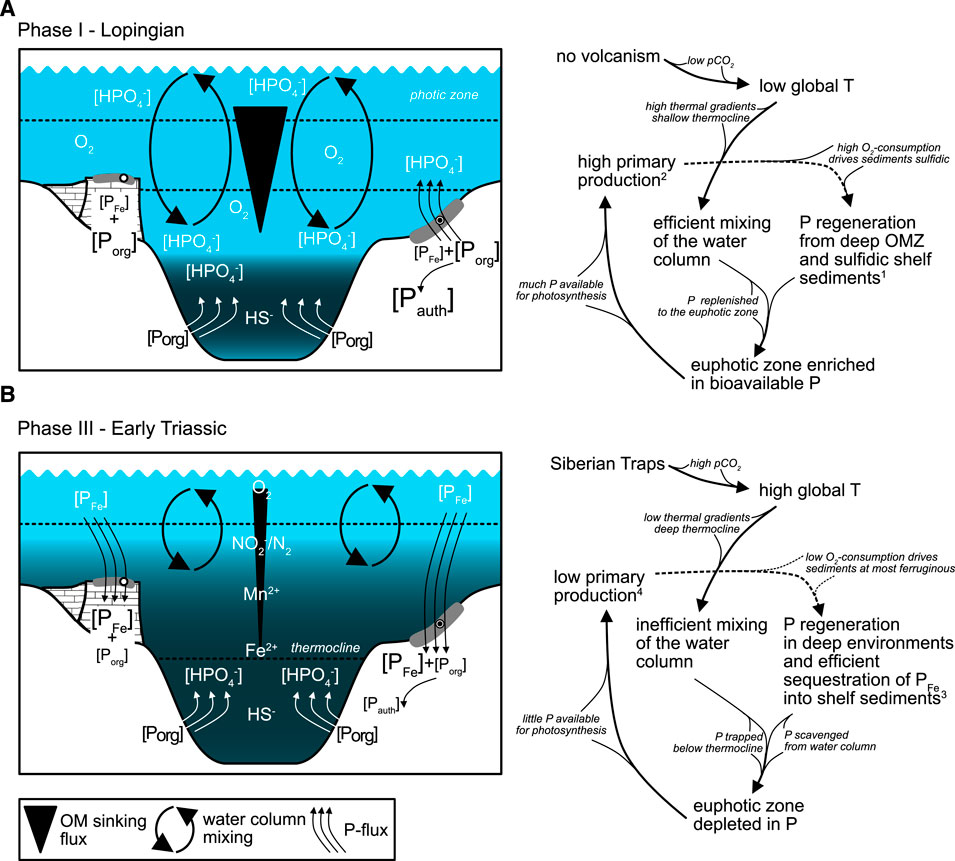
FIGURE 7. Model for P cycling illustrating inferred decrease in primary productivity in the latest Permian. (A) Phase I - Lopingian: efficient mixing of the water column and nutrient recycling sustaining primary productivity. (B) Phase III - Early Triassic: redox stratified water column with inefficient nutrient recycling and low levels of primary production. Superscripts refer to geochemical evidence: 1) C/Porg > 106 and low PFe/Ptot; 2) high TOC, Preact, and Niexcess; 3) C/Porg ≈ 106, C/Preact < 106, and high PFe/Ptot; 4) low TOC, Preact, and Niexcess.
High productivity in the tropical Tethys Ocean during the Lopingian is indicated by high Preact concentrations in both sections. P burial efficiency was low at Chibi but high at Chanakhchi as suggested from C/P ratios. This suggests that at Chibi a large part of the sedimentary P delivered by sinking organic matter and Fe-oxides was lost to the water column or transferred to authigenic P phases under O2 deficient conditions driven by organic matter remineralization. Because mixing of surface and bottom waters was likely more efficient during the cooler climatic conditions of the Permian, recycled P was replenished to the euphotic zone, fueling photosynthesis and sustaining productivity on equatorial shelfs. This eventually led to the observed enrichment of authigenic P. However, low C/P ratios at Chanakhchi indicate that sedimentary P was not recycled but buried efficiently in shallow platform environments.
Low Preact concentrations together with low C/Porg ratios indicate efficient P burial, corroborating the latest Permian to Early Triassic low productivity scenario for the tropical Tethys. Although there was no P loss from the sediment, concentrations of Preact are low at both sites. Under the exceptional warmth of the Early Triassic, vertical mixing in the water column was probably inhibited when a deep thermocline was developed (Kidder and Worsley, 2004; Grasby et al., 2016; Grasby et al., 2020). Hence, although it is possible that P-regeneration occurred in other euxinic deeper water settings, P still would have been trapped in bottom waters.
PFe became a relatively important P sink in the latest Permian to Early Triassic (phase III). P trapping in bottom waters combined with Fe-oxide associated scavenging of bioavailable P from the water column and efficient burial in shelf and platform sediments possibly caused P depletion in the euphotic zone of the Tethys Ocean. A prerequisite for such scenario is that bottom waters and sediment redox conditions did not exceed the ferruginous zone. This is plausible since there was probably no significant O2 consumption via organic matter remineralization to shift redox conditions into the sulfidic zone (TOC is low; anoxia is controlled by stratification). Furthermore, this interpretation is consistent with modeling and geochemical studies pointing towards less severe O2 depletion in the upper water column of the tropical oceans (Clarkson et al., 2016; Penn et al., 2018). These conditions might have been similar to pre-Cryogenian oceans when pervasive ferruginous conditions resulted in enhanced scavenging of P from surface waters and low P burial on continental margins in the form of authigenic phosphates (Reinhard et al., 2017). Accordingly, we argue that, during the latest Permian to Early Triassic (phase III), the water column in the low-latitude Tethys was characterized by warm oligotrophic surface waters with nutrient trapping occurring in deeper anoxic waters (Grasby et al., 2016). P shuttling to the sediment diminished with the decrease in marine primary productivity (Algeo et al., 2013).
According to this model, an eutrophication scenario in the Tethys Ocean is untenable. Schobben et al. (2020) argued for a boost in primary productivity followed by eutrophication as a consequence of enhanced nutrient input and P recycling. The dataset, spanning the extinction interval to the Early Triassic, was acquired in a mid-latitude setting at the northern margin of Pangea (Deltadalen and Festningen, Spitsbergen). On the other hand, stable nitrogen isotopes from the same region (Festningen; Grasby et al., 2020) and from virtually all P-T boundary sections exhibit a significant decrease in δ15N across the extinction interval, indicating a shift to dominance of diazotrophic metabolism and a substantial decrease in the oceanic nutrient-N inventory, leading to oligotrophic oceans (e.g., Schoepfer, 2013; Sun et al., 2019). This discrepancy in interpretations is due to either the application of different proxies, or simply to the fact that there are contrasts between distal and proximal sites in respect to nutrient influx. However, a collapse of primary productivity is documented not only in northern low- and mid-latitudes, but also in the southern mid-latitude oceans (Sun et al., 2021). In general, regional differences in the effect of global warming on marine primary productivity are to be expected, given that climate models predictions for the modern ocean are spatially heterogenous (e.g., Mora et al., 2013).
In both sections, the transitional phase II starts slightly earlier than the onset of the negative carbon isotope excursion and ends before the δ13Ccarb curves reach their minima in the H. parvus Zone (Figure 5). Thus, in both sections, the decline in primary productivity coincides with the major part of the negative shift in δ13Ccarb. Using the radiometric ages from the Meishan GSSP section, conodont biozonation and assuming constant sedimentation rate, it can be estimated that primary productivity started to decrease approximately 30 ka before the main extinction interval (Jiang et al., 2007; Burgess et al., 2014; Chen et al., 2015). Since marine primary producers constitute the base of marine food webs, their decline likely imposed negative effects on higher trophic levels.
Body size reduction and biodiversity losses among marine heterotrophic organisms have been reported for the pre-extinction interval. For example, brachiopods from South China show miniaturization starting in the C. yini Zone and community turnover occurred prior to the onset of the main phase of marine extinction (Zhang et al., 2016). Besides higher water temperatures or lower oxygen levels, declining primary productivity serves as an explanation for miniaturization since reduced body size can be an adaptation to a decrease in food supply (e.g., Yasuda et al., 2016). Sponge spicules exhibit a significant decline in abundance, size and morphological diversity in an interval corresponding to the upper C. yini conodont Zone (Liu et al., 2013). Radiolarians suffered significant diversity loss before the extinction with ∼53% of species and ∼22% of genera going extinct in the C. yini Zone (Meishan Bed 24d; Feng et al., 2007). A first extinction pulse among Albaillella observed in pelagic sections from Japan can be correlated with the aforementioned event (Wenchen et al., 2004). In the western Tethys, ammonoids from Iran exhibit an extinction pulse as well as declining morphological complexity and body size (pedomorphosis) in the Paratirolites kittli ammonoid Zone which is equivalent to the C. yini conodont Zone (Kiessling et al., 2018). However, the authors erroneously claimed that this deterioration started 700 ka before the extinction not taking into account radiometric ages from the Meishan section indicating that the onset of the C. yini Zone is significantly younger (Burgess et al., 2014).
Hence, the decrease in primary productivity in the tropical Tethys can be temporally correlated with the prelude of the extinction. However, at least in some regions, oxygen availability in the water column decreased at the same time (e.g., Clarkson et al., 2016). Hence, the expansion of oxygen minimum zones is an equally valid explanation. In general, anoxia directly stresses marine organisms by narrowing suitable habitats for sensitive species. Considering an inverse relationship between marine primary productivity and anoxia under warming climatic conditions it turns out that both are inextricably connected (Keeling et al., 2010). This is because mixing of oxygenated and nutrient-poor surface waters with deoxygenated and nutrient-rich deeper waters is diminished when water column stratification becomes stronger.
Downward trends in sedimentary productivity proxies (TOC, Niexcess, and Preact) from two Tethyan successions suggest a reduction of the organic matter sinking flux due to a decrease of marine primary productivity from the Lopingian to the Early Triassic. This commenced in the upper C. yini conodont Zone 30 ka before the main marine extinction level. C/P ratios indicate a switch from efficient P-recycling during the Lopingian normal productivity interval to efficient P-burial during the low productivity interval with Fe-oxides becoming a major P sink in the Early Triassic.
The decrease in primary productivity in the equatorial Tethyan realm can be explained by the concomitant effects of global warming across the P-T boundary, in particular enhanced stratification of the water column and a deepened thermocline leading to a state of inefficient P recycling. Hence, the latest Permian and Early Triassic Tethys was characterized by nutrient-poor surface waters while deep waters were probably enriched in P released from pelagic euxinic sediments. Potentially, the described developments reflect the onset of the Early Triassic Phosphorite gap, i.e., the lacking deposition of P-rich marine sediments for almost 5 Ma due to nutrient stress (Trappe, 1994). While this was demonstrated for the western, northern and eastern margins of Pangea (Schoepfer, 2013; Grasby et al., 2016; Grasby et al., 2020; Sun et al., 2021) our results suggest a similar oligotrophication scenario for the tropical Tethys Ocean.
The resulting food shortage may explain coincident extinction pulses, reductions in body size and pedomorphosis among heterotrophic organisms particularly in the tropical Tethys before and during the end-Permian mass extinction interval as well as during the protracted recovery phase.
The original contributions presented in the study are included in the article/Supplementary Material, further inquiries can be directed to the corresponding authors.
JM designed the study, generated, and analyzed the datasets and wrote the manuscript. YS designed the study and revised the manuscript. FY and AF generated and analyzed data. MJ designed the study, revised the manuscript, and is the project administration.
The National Natural Science Foundation of China (grant no. 41821001) supported this study. This is a contribution to German Research Foundation (DFG) Research Unit TERSANE (FOR 2332: Temperature-related stressors as a unifying principle in ancient extinctions; Project Jo 219/16-1).
The authors declare that the research was conducted in the absence of any commercial or financial relationships that could be construed as a potential conflict of interest.
All claims expressed in this article are solely those of the authors and do not necessarily represent those of their affiliated organizations, or those of the publisher, the editors and the reviewers. Any product that may be evaluated in this article, or claim that may be made by its manufacturer, is not guaranteed or endorsed by the publisher.
We acknowledge logistic support and advice during fieldwork in South China by Prof. Y.B. Wang (CUG Wuhan) who sadly passed away in early 2021 before this study was accomplished. We thank Thierry Adatte (University of Lausanne/Switzerland) for kindly granting access to the phosphorus lab at UNIL and Daniele Lutz (FAU Erlangen-Nürnberg) for measuring carbon isotopes and organic carbon contents. Tan Wang and Yujun Bao (CUG Wuhan) are acknowledged for great help with collecting samples from the Chibi section. Johannes Barth, Christian Hanke, and Robert van Geldern (FAU Erlangen-Nürnberg) are thanked for analytical support. Furthermore, we thank two reviewers for their constructive comments.
The Supplementary Material for this article can be found online at: https://www.frontiersin.org/articles/10.3389/feart.2022.832308/full#supplementary-material
Algeo, T. J., and Twitchett, R. J. (2010). Anomalous Early Triassic Sediment Fluxes Due to Elevated Weathering Rates and Their Biological Consequences. Geology 38, 1023–1026. doi:10.1130/G31203.1
Algeo, T. J., Henderson, C. M., Tong, J., Feng, Q., Yin, H., and Tyson, R. V. (2013). Plankton and Productivity during the Permian-Triassic Boundary Crisis: An Analysis of Organic Carbon Fluxes. Glob. Planet. Change 105, 52–67. doi:10.1016/j.gloplacha.2012.02.008
Aspila, K. I., Agemian, H., and Chau, A. S. Y. (1976). A Semi-automated Method for the Determination of Inorganic, Organic and Total Phosphate in Sediments. Analyst 101, 187–197. doi:10.1039/an9760100187
Bambach, R. K., Knoll, A. H., and Wang, S. C. (2004). Origination, Extinction, and Mass Depletions of marine Diversity. Paleobiology 30, 522–542. doi:10.1666/0094-8373(2004)030<0522:oeamdo>2.0.co;2
Baud, A., Richoz, S., and Pruss, S. (2007). The Lower Triassic Anachronistic Carbonate Facies in Space and Time. Glob. Planet. Change 55, 81–89. doi:10.1016/j.gloplacha.2006.06.008
Behrenfeld, M. J., O’Malley, R. T., Siegel, D. A., McClain, C. R., Sarmiento, J. L., Feldman, G. C., et al. (2006). Climate-Driven Trends in Contemporary Ocean Productivity. Nature 444, 752–755. doi:10.1038/nature05317
Böning, P., Shaw, T., Pahnke, K., and Brumsack, H.-J. (2015). Nickel as Indicator of Fresh Organic Matter in Upwelling Sediments. Geochim. Cosmochim. Acta 162, 99–108. doi:10.1016/j.gca.2015.04.027
Bond, D. P. G., and Grasby, S. E. (2017). On the Causes of Mass Extinctions. Palaeogeogr. Palaeoclimatol. Palaeoecol. 478, 3–29. doi:10.1016/j.palaeo.2016.11.005
Bopp, L., Resplandy, L., Orr, J. C., Doney, S. C., Dunne, J. P., Gehlen, M., et al. (2013). Multiple Stressors of Ocean Ecosystems in the 21st century: Projections with CMIP5 Models. Biogeosciences 444, 6225–6245. doi:10.5194/bg-10-6225-2013
Boyd, P. W., Sundby, S., and Pörtner, H.-O. (2014). “Cross-Chapter Box on Net Primary Production in the Ocean,” in Climate Change 2014: Impacts, Adaptation, and Vulnerability. Part A: Global and Sectoral Aspects. Contribution of Working Group II to the Fifth Assessment Report of the Intergovernmental Panel of Climate Change (Cambridge University Press), 133–136.
Burgess, S. D., Bowring, S., and Shen, S.-z. (2014). High-precision Timeline for Earth's Most Severe Extinction. Proc. Natl. Acad. Sci. USA 111, 3316–3321. doi:10.1073/pnas.1317692111
Burgess, S. D., Muirhead, J. D., and Bowring, S. A. (2017). Initial Pulse of Siberian Traps Sills as the Trigger of the End-Permian Mass Extinction. Nat. Commun. 8, 164. doi:10.1038/s41467-017-00083-9
Burnett, W. C., Beers, M. J., and Roe, K. K. (1982). Growth Rates of Phosphate Nodules from the Continental Margin off Peru. Science 215, 1616–1618. doi:10.1126/science.215.4540.1616
Chen, Z.-Q., Yang, H., Luo, M., Benton, M. J., Kaiho, K., Zhao, L., et al. (2015). Complete Biotic and Sedimentary Records of the Permian-Triassic Transition from Meishan Section, South China: Ecologically Assessing Mass Extinction and its Aftermath. Earth-Science Rev. 149, 67–107. doi:10.1016/j.earscirev.2014.10.005
Chen, J., Shen, S.-z., Zhang, Y.-c., Angiolini, L., Gorgij, M. N., Crippa, G., et al. (2020). Abrupt Warming in the Latest Permian Detected Using High-Resolution In Situ Oxygen Isotopes of Conodont Apatite from Abadeh, central Iran. Palaeogeogr. Palaeoclimatol. Palaeoecol. 560, 109973. doi:10.1016/j.palaeo.2020.109973
Clarkson, M. O., Wood, R. A., Poulton, S. W., Richoz, S., Newton, R. J., Kasemann, S. A., et al. (2016). Dynamic Anoxic Ferruginous Conditions during the End-Permian Mass Extinction and Recovery. Nat. Commun. 7, 12236. doi:10.1038/ncomms12236
Fantasia, A., Föllmi, K. B., Adatte, T., Spangenberg, J. E., and Montero-Serrano, J.-C. (2018). The Early Toarcian Oceanic Anoxic Event: Paleoenvironmental and Paleoclimatic Change across the Alpine Tethys (Switzerland). Glob. Planet. Change 162, 53–68. doi:10.1016/j.gloplacha.2018.01.008
Feng, Q., He, W., Gu, S., Meng, Y., Jin, Y., and Zhang, F. (2007). Radiolarian Evolution during the Latest Permian in South China. Glob. Planet. Change 55, 177–192. doi:10.1016/j.gloplacha.2006.06.012
Filippelli, G. M., Sierro, F. J., Flores, J. A., Vázquez, A., Utrilla, R., Pérez-Folgado, M., et al. (2003). A Sediment-Nutrient-Oxygen Feedback Responsible for Productivity Variations in Late Miocene Sapropel Sequences of the Western Mediterranean. Palaeogeogr. Palaeoclimatol. Palaeoecol. 190, 335–348. doi:10.1016/S0031-0182(02)00613-2
Foster, W. J., Heindel, K., Richoz, S., Gliwa, J., Lehrmann, D. J., Baud, A., et al. (2020). Suppressed Competitive Exclusion Enabled the Proliferation of Permian/Triassic Boundary Microbialites. Depositional Rec. 6, 62–74. doi:10.1002/dep2.97
Friesenbichler, E., Richoz, S., Baud, A., Krystyn, L., Sahakyan, L., Vardanyan, S., et al. (2018). Sponge-microbial Build-Ups from the Lowermost Triassic Chanakhchi Section in Southern Armenia: Microfacies and Stable Carbon Isotopes. Palaeogeogr. Palaeoclimatol. Palaeoecol. 490, 653–672. doi:10.1016/j.palaeo.2017.11.056
Grasby, S. E., Beauchamp, B., Embry, A., and Sanei, H. (2013). Recurrent Early Triassic Ocean Anoxia. Geology 41, 175–178. doi:10.1130/g33599.1
Grasby, S. E., Beauchamp, B., and Knies, J. (2016). Early Triassic Productivity Crises Delayed Recovery from World's Worst Mass Extinction. Geology 44, 779–782. doi:10.1130/G38141.1
Grasby, S. E., Knies, J., Beauchamp, B., Bond, D. P. G., Wignall, P., and Sun, Y. (2020). Global Warming Leads to Early Triassic Nutrient Stress across Northern Pangea. Geol. Soc. Am. Bull. 132, 943–954. doi:10.1130/b32036.1
Hotinski, R. M., Bice, K. L., Kump, L. R., Najjar, R. G., and Arthur, M. A. (2001). Ocean Stagnation and End-Permian Anoxia. Geology 29, 7. doi:10.1130/0091-7613(2001)029<0007:osaepa>2.0.co;2
Ingall, E., and Jahnke, R. (1994). Evidence for Enhanced Phosphorus Regeneration from marine Sediments Overlain by Oxygen Depleted Waters. Geochim. Cosmochim. Acta 58, 2571–2575. doi:10.1016/0016-7037(94)90033-7
Ingall, E. D., Bustin, R. M., and Van Cappellen, P. (1993). Influence of Water Column Anoxia on the Burial and Preservation of Carbon and Phosphorus in marine Shales. Geochim. Cosmochim. Acta 57, 303–316. doi:10.1016/0016-7037(93)90433-W
Isozaki, Y. (1997). Permo-Triassic Boundary Superanoxia and Stratified Superocean: Records from Lost Deep Sea. Science 276, 235–238. doi:10.1126/science.276.5310.235
Jiang, H., Lai, X., Luo, G., Aldridge, R., Zhang, K., and Wignall, P. (2007). Restudy of Conodont Zonation and Evolution across the P/T Boundary at Meishan Section, Changxing, Zhejiang, China. Glob. Planet. Change 55, 39–55. doi:10.1016/j.gloplacha.2006.06.007
Joachimski, M. M., Lai, X., Shen, S., Jiang, H., Luo, G., Chen, B., et al. (2012). Climate Warming in the Latest Permian and the Permian-Triassic Mass Extinction. Geology 40, 195–198. doi:10.1130/G32707.1
Joachimski, M. M., Alekseev, A. S., Grigoryan, A., and Gatovsky, Y. A. (2020). Siberian Trap Volcanism, Global Warming and the Permian-Triassic Mass Extinction: New Insights from Armenian Permian-Triassic Sections. Geol. Soc. Am. Bull. 132, 427–443. doi:10.1130/B35108.1
Kämpf, J., and Chapman, P. (2016). Upwelling Systems of the World. Cham: Springer International Publishing. doi:10.1007/978-3-319-42524-5
Keeling, R. F., Körtzinger, A., and Gruber, N. (2010). Ocean Deoxygenation in a Warming World. Annu. Rev. Mar. Sci. 2, 199–229. doi:10.1146/annurev.marine.010908.163855
Kerrn-Jespersen, J. P., and Henze, M. (1993). Biological Phosphorus Uptake under Anoxic and Aerobic Conditions. Water Res. 27, 617–624. doi:10.1016/0043-1354(93)90171-D
Kidder, D. L., and Worsley, T. R. (2004). Causes and Consequences of Extreme Permo-Triassic Warming to Globally Equable Climate and Relation to the Permo-Triassic Extinction and Recovery. Palaeogeogr. Palaeoclimatol. Palaeoecol. 203, 207–237. doi:10.1016/S0031-0182(03)00667-9
Kiessling, W., Schobben, M., Ghaderi, A., Hairapetian, V., Leda, L., and Korn, D. (2018). Pre-mass Extinction Decline of Latest Permian Ammonoids. Geology 46, 283–286. doi:10.1130/G39866.1
Kocsis, Á. T., and Scotese, C. R. (2021). Mapping Paleocoastlines and continental Flooding during the Phanerozoic. Earth-Science Rev. 213, 103463. doi:10.1016/j.earscirev.2020.103463
Korte, C., and Kozur, H. W. (2010). Carbon-isotope Stratigraphy across the Permian-Triassic Boundary: A Review. J. Asian Earth Sci. 39, 215–235. doi:10.1016/j.jseaes.2010.01.005
Korte, C., Pande, P., Kalia, P., Kozur, H. W., Joachimski, M. M., and Oberhänsli, H. (2010). Massive Volcanism at the Permian-Triassic Boundary and its Impact on the Isotopic Composition of the Ocean and Atmosphere. J. Asian Earth Sci. 37, 293–311. doi:10.1016/j.jseaes.2009.08.012
Lau, K. V., Maher, K., Altiner, D., Kelley, B. M., Kump, L. R., Lehrmann, D. J., et al. (2016). Marine Anoxia and Delayed Earth System Recovery after the End-Permian Extinction. Proc. Natl. Acad. Sci. USA 113, 2360–2365. doi:10.1073/pnas.1515080113
Le Vaillant, M., Barnes, S. J., Mungall, J. E., and Mungall, E. L. (2017). Role of Degassing of the Noril'sk Nickel Deposits in the Permian-Triassic Mass Extinction Event. Proc. Natl. Acad. Sci. USA 114, 2485–2490. doi:10.1073/pnas.1611086114
Li, M., Grasby, S. E., Wang, S.-J., Zhang, X., Wasylenki, L. E., Xu, Y., et al. (2021). Nickel Isotopes Link Siberian Traps Aerosol Particles to the End-Permian Mass Extinction. Nat. Commun. 12, 2024. doi:10.1038/s41467-021-22066-7
Liu, G., Feng, Q., Shen, J., Yu, J., He, W., and Algeo, T. J. (2014). Decline of Siliceous Sponges and Spicule Miniaturization Induced by Marine Productivity Collapse and Expanding Anoxia during the Permian-Triassic Crisis in South China. PALAIOS 28, 664–679. doi:10.2110/palo.2013.p13-035r
McManus, J., Berelson, W. M., Coale, K. H., Johnson, K. S., and Kilgore, T. E. (1997). Phosphorus Regeneration in continental Margin Sediments. Geochim. Cosmochim. Acta 61, 2891–2907. doi:10.1016/S0016-7037(97)00138-5
Meijers, M. J. M., Smith, B., Kirscher, U., Mensink, M., Sosson, M., Rolland, Y., et al. (2015). A Paleolatitude Reconstruction of the South Armenian Block (Lesser Caucasus) for the Late Cretaceous: Constraints on the Tethyan Realm. Tectonophysics 644-645, 197–219. doi:10.1016/j.tecto.2015.01.012
Mora, C., Wei, C. L., Rollo, A., Amaro, T., Baco, A. R., Billett, D., et al. (2013). Biotic and Human Vulnerability to Projected Changes in Ocean Biogeochemistry over the 21st Century. PLOS Biol. 11, e1001682. doi:10.1371/journal.pbio.1001682
Mort, H. P., Adatte, T., Föllmi, K. B., Keller, G., Steinmann, P., Matera, V., et al. (2007). Phosphorus and the Roles of Productivity and Nutrient Recycling during Oceanic Anoxic Event 2. Geol 35, 483. doi:10.1130/G23475A.1
Murphy, J., and Riley, J. P. (1962). A Modified Single Solution Method for the Determination of Phosphate in Natural Waters. Analytica Chim. Acta 27, 31–36. doi:10.1016/S0003-2670(00)88444-5
Newell, N. D. (1967). "Revolutions in the History of Life," in Geological Society of America Special Paper. Boulder 89, 63–91. doi:10.1130/SPE89-p63
Paytan, A., and McLaughlin, K. (2007). The Oceanic Phosphorus Cycle. Chem. Rev. 107, 563–576. doi:10.1021/cr0503613
Penn, J. L., Deutsch, C., Payne, J. L., and Sperling, E. A. (2018). Temperature-dependent Hypoxia Explains Biogeography and Severity of End-Permian marine Mass Extinction. Science 362, eaat1327. doi:10.1126/science.aat1327
Piper, D. Z., and Calvert, S. E. (2009). A marine Biogeochemical Perspective on Black Shale Deposition. Earth-Science Rev. 95, 63–96. doi:10.1016/j.earscirev.2009.03.001
Rampino, M. R., Rodriguez, S., Baransky, E., and Cai, Y. (2017). Global Nickel Anomaly Links Siberian Traps Eruptions and the Latest Permian Mass Extinction. Sci. Rep. 7, 12416. doi:10.1038/s41598-017-12759-9
Raup, D. M., and Sepkoski, J. J. (1982). Mass Extinctions in the Marine Fossil Record. Science 215, 1501–1503. doi:10.1126/science.215.4539.1501
Redfield, A. C., Ketchum, B. H., and Richards, F. A. (1963). The Influence of Organisms on the Composition of Seawater. The sea 2, 26–77.
Reinhard, C. T., Planavsky, N. J., Gill, B. C., Ozaki, K., Robbins, L. J., Lyons, T. W., et al. (2017). Evolution of the Global Phosphorus Cycle. Nature 541, 386–389. doi:10.1038/nature20772
Riccardi, A. L., Arthur, M. A., and Kump, L. R. (2006). Sulfur Isotopic Evidence for Chemocline Upward Excursions during the End-Permian Mass Extinction. Geochim. Cosmochim. Acta 70, 5740–5752. doi:10.1016/j.gca.2006.08.005
Rothman, D. H., Fournier, G. P., French, K. L., Alm, E. J., Boyle, E. A., Cao, C., et al. (2014). Methanogenic Burst in the End-Permian Carbon Cycle. Proc. Natl. Acad. Sci. 111, 5462–5467. doi:10.1073/pnas.1318106111
Roxy, M. K., Modi, A., Murtugudde, R., Valsala, V., Panickal, S., Prasanna Kumar, S., et al. (2016). A Reduction in marine Primary Productivity Driven by Rapid Warming over the Tropical Indian Ocean. Geophys. Res. Lett. 43, 826–833. doi:10.1002/2015GL066979
Ruttenberg, K. C. (1992). Development of a Sequential Extraction Method for Different Forms of Phosphorus in marine Sediments. Limnol. Oceanogr. 37, 1460–1482. doi:10.4319/lo.1992.37.7.1460
Ruttenberg, K. C. (1993). Reassessment of the Oceanic Residence Time of Phosphorus. Chem. Geology. 107, 405–409. doi:10.1016/0009-2541(93)90220-D
Schobben, M., Joachimski, M. M., Korn, D., Leda, L., and Korte, C. (2014). Palaeotethys Seawater Temperature Rise and an Intensified Hydrological Cycle Following the End-Permian Mass Extinction. Gondwana Res. 26, 675–683. doi:10.1016/j.gr.2013.07.019
Schobben, M., Foster, W. J., Sleveland, A. R. N., Zuchuat, V., Svensen, H. H., Planke, S., et al. (2020). A Nutrient Control on marine Anoxia during the End-Permian Mass Extinction. Nat. Geosci. 13, 640–646. doi:10.1038/s41561-020-0622-1
Schoepfer, S. D., Henderson, C. M., Garrison, G. H., and Ward, P. D. (2012). Cessation of a Productive Coastal Upwelling System in the Panthalassic Ocean at the Permian-Triassic Boundary. Palaeogeogr. Palaeoclimatol. Palaeoecol. 313-314, 181–188. doi:10.1016/j.palaeo.2011.10.019
Schoepfer, S. D., Shen, J., Wei, H., Tyson, R. V., Ingall, E., and Algeo, T. J. (2015). Total Organic Carbon, Organic Phosphorus, and Biogenic Barium Fluxes as Proxies for Paleomarine Productivity. Earth-Sci. Rev. 149, 23–52. doi:10.1016/j.earscirev.2014.08.017
Schoepfer, S. D. (2013). Termination of a Continent-Margin Upwelling System at the Permian–Triassic Boundary (Opal Creek, Alberta, Canada). Glob. Planet. Change 15, 21–35. doi:10.1016/j.gloplacha.2012.07.005
Shen, J., Algeo, T. J., Hu, Q., Zhang, N., Zhou, L., Xia, W., et al. (2012). Negative C-Isotope Excursions at the Permian-Triassic Boundary Linked to Volcanism. Geology 40, 963–966. doi:10.1130/G33329.1
Stanley, S. M. (2016). Estimates of the Magnitudes of Major marine Mass Extinctions in Earth History. Proc. Natl. Acad. Sci. USA 113, E6325–E6334. doi:10.1073/pnas.1613094113
Steiner, Z., Lazar, B., Torfstein, A., and Erez, J. (2017). Testing the Utility of Geochemical Proxies for Paleoproductivity in Oxic Sedimentary marine Settings of the Gulf of Aqaba, Red Sea. Chem. Geol. 473, 40–49. doi:10.1016/j.chemgeo.2017.10.012
Sun, Y., Joachimski, M. M., Wignall, P. B., Yan, C., Chen, Y., Jiang, H., et al. (2012). Lethally Hot Temperatures during the Early Triassic Greenhouse. Science 338, 366–370. doi:10.1126/science.1224126
Sun, Y. D., Zulla, M. J., Joachimski, M. M., Bond, D. P. G., Wignall, P. B., Zhang, Z. T., et al. (2019). Ammonium Ocean Following the End-Permian Mass Extinction. Earth Planet. Sci. Lett. 518, 211–222. doi:10.1016/j.epsl.2019.04.036
Sun, Y. D., Richoz, S., Krystyn, L., Grasby, S. E., Chen, Y. L., Banerjee, D., et al. (2021). Integrated Bio-Chemostratigraphy of Lower and Middle Triassic marine Successions at Spiti in the Indian Himalaya: Implications for the Early Triassic Nutrient Crisis. Glob. Planet. Change 196, 103363. doi:10.1016/j.gloplacha.2020.103363
Svensen, H., Planke, S., Polozov, A. G., Schmidbauer, N., Corfu, F., Podladchikov, Y. Y., et al. (2009). Siberian Gas Venting and the End-Permian Environmental Crisis. Earth Planet. Sci. Lett. 277, 490–500. doi:10.1016/j.epsl.2008.11.015
Taylor, S. R., and McLennan, S. M. (1985). The Continental Crust: Its Composition and Evolution. 1st ed. Oxford: Blackwell Scientific Publications.
Trappe, J. (1994). Pangean Phosphorites - Ordinary Phosphorite Genesis in an Extraordinary World? Editors Embry, A. F., Beauchamp, B., and Glass, D. J. (Pangea: Global Environments and Resources. Canadian Society of Petroleum Geologists), 469–478.
Van Cappellen, P., and Ingall, E. D. (1994). Benthic Phosphorus Regeneration, Net Primary Production, and Ocean Anoxia: A Model of the Coupled marine Biogeochemical Cycles of Carbon and Phosphorus. Paleoceanography 9, 677–692. doi:10.1029/94PA01455
Wenchen, X., Ning, Z., Guoqing, W., and Kakuwa, Y. (2004). Pelagic Radiolarian and Conodont Biozonation in the Permo-Triassic Boundary Interval and Correlation to the Meishan GSSP. Micropaleontology 50, 27–44. doi:10.1661/0026-2803(2004)050[0027:pracbi]2.0.co;2
Wignall, P. B., and Hallam, A. (1992). Anoxia as a Cause of the Permian/Triassic Mass Extinction: Facies Evidence from Northern Italy and the Western United States. Palaeogeogr. Palaeoclimatol. Palaeoecol. 93, 21–46. doi:10.1016/0031-0182(92)90182-5
Wignall, P. B., and Twitchett, R. J. (1996). Oceanic Anoxia and the End Permian Mass Extinction. Science 272, 1155–1158. doi:10.1126/science.272.5265.1155
Wignall, P. B., Bond, D. P. G., Grasby, S. E., Pruss, S. B., and Peakall, J. (2020). Controls on the Formation of Microbially Induced Sedimentary Structures and Biotic Recovery in the Lower Triassic of Arctic Canada. GSA Bull. 132, 918–930. doi:10.1130/B35229.1
Yang, S.-C., Kelly, R. L., Bian, X., Conway, T. M., Huang, K.-F., Ho, T.-Y., et al. (2021). Lack of Redox Cycling for Nickel in the Water Column of the Eastern Tropical North Pacific Oxygen Deficient Zone: Insight from Dissolved and Particulate Nickel Isotopes. Geochim. Cosmochim. Acta 309, 235–250. doi:10.1016/j.gca.2021.07.004
Yasuda, N., Miyamoto, N., Fujiwara, Y., Yamamoto, T., and Yusa, Y. (2016). Effects of Food Availability on Growth and Reproduction of the Deep-Sea Pedunculate Barnacle Heteralepas Canci. Deep Sea Res. Oceanogr. Res. Pap. 108, 53–57. doi:10.1016/j.dsr.2015.12.008
Zhang, Y., Shi, G. R., He, W.-h., Wu, H.-t., Lei, Y., Zhang, K.-x., et al. (2016). Significant Pre-Mass Extinction Animal Body-Size Changes: Evidences from the Permian-Triassic Boundary Brachiopod Faunas of South China. Palaeogeogr. Palaeoclimatol. Palaeoecol. 448, 85–95. doi:10.1016/j.palaeo.2015.11.020
Keywords: phosphorus cycle, primary productivity, nutrients, food shortage, Permian-Triassic, end-Permian mass extinction, phosphorus speciation
Citation: Müller J, Sun Y, Yang F, Fantasia A and Joachimski M (2022) Phosphorus Cycle and Primary Productivity Changes in the Tethys Ocean During the Permian-Triassic Transition: Starving Marine Ecosystems. Front. Earth Sci. 10:832308. doi: 10.3389/feart.2022.832308
Received: 09 December 2021; Accepted: 10 February 2022;
Published: 09 March 2022.
Edited by:
Sara Callegaro, University of Oslo, NorwayReviewed by:
Stephen Grasby, Geological Survey of Canada, CanadaCopyright © 2022 Müller, Sun, Yang, Fantasia and Joachimski. This is an open-access article distributed under the terms of the Creative Commons Attribution License (CC BY). The use, distribution or reproduction in other forums is permitted, provided the original author(s) and the copyright owner(s) are credited and that the original publication in this journal is cited, in accordance with accepted academic practice. No use, distribution or reproduction is permitted which does not comply with these terms.
*Correspondence: Johann Müller, am9oYW5uLmptLm11ZWxsZXJAZmF1LmRl; Yadong Sun, eWFkb25nLnN1bkBmYXUuZGU=
Disclaimer: All claims expressed in this article are solely those of the authors and do not necessarily represent those of their affiliated organizations, or those of the publisher, the editors and the reviewers. Any product that may be evaluated in this article or claim that may be made by its manufacturer is not guaranteed or endorsed by the publisher.
Research integrity at Frontiers
Learn more about the work of our research integrity team to safeguard the quality of each article we publish.