 Jianmao Guo1,2*
 Zhanhao Zhang
- 1College of Applied Meteorology, Nanjing University of Information Science and Technology, Nanjing, China
- 2Jiangsu Key Laboratory of Agricultural Meteorology, Nanjing, China
Light use efficiency (LUE) is a critical variable for modeling gross primary production (GPP) of vegetation. The photochemical reflectance index (PRI) is based on reflectance at 531 and 570 nm, which has great potential in predicting the light use efficiency (LUE) and makes LUE related to plant optical characteristics. Despite the great achievement in understanding the correlation of PRI and LUE on forests, the application of PRI in estimating LUE on crops has almost been ignored. The present study reported the ability of multi-angle PRI to track eddy covariance (EC)-based LUE in a rice field in East China. We found that PRI can estimate LUE in sunny days (R2 = 0.4; p < 0.05). The correlation of PRI and LUE was greater than that at OZA of 0° (R2 = 0.4; p < 0.05) after distinguishing different OZAs and scatter directions and was the greatest in the backscatter direction with an OZA of 60° (R2 = 0.7; p < 0.01). This correlation was also corrected by the bidirectional reflectance distribution function (BRDF), where R2 = 0.72 after correction. We noted that the relationship between PRI and LUE on cloudy days was poor, where R2 = 0.26. Photosynthetically active radiation (PAR) had an influence on the LUE and PRI, while vapor pressure deficit (VPD) and air temperature (Ta) had negative influences on the correlation of PRI and LUE. Our research suggests that PRI can efficiently track the LUE of the rice growth period when considering environmental factors and rice canopy structures.
Introduction
Gross primary production (GPP) represents the amount of organic carbon fixed by terrestrial plants through photosynthesis and drives the carbon cycle of the ecosystem (Sun et al., 2018). Light use efficiency (LUE) is determined by environmental factors such as nutrients, moisture, and atmospheric temperature and has become the crucial parameter variable for estimating GPP. To date, vegetation indices constructed by remote sensing to estimate reliable vegetation information (Damm et al., 2010). The Normalized difference vegetation index (NDVI) (Peñuelas and Inoue, 1999) has been successfully applied to estimate leaf area index (LAI), leaf nitrogen concentration, leaf chlorophyll concentration, and fractional absorbed photosynthetically active radiation (FPAR) (Goward and Huemmrich, 1992; Gamon et al., 1995; Sellers et al., 1995; Justice et al., 1998) but could not be related to variable LUE from day to day even hour to hour (Running and Nemani, 1988), for it is relatively stable (Tenhunen et al., 1987).
The photochemical reflectance index (PRI), widely used to estimate LUE, was first proposed by Gamon et al. (1992) and can be measured using a spectrometer such as NDVI (Ryu et al., 2019). The changes in PRI are caused by changes in the pigment bank of plant leaves on the spectrum (Gamon et al., 1992) and are driven by the xanthophyll cycle on a daily scale. Researchers have found that there is a good correlation between PRI and LUE at the leaf, canopy, and landscape scales (Peñ uelas et al., 1997; Gamon and Surfus, 1999; Nichol et al., 2000; Asner et al., 2004; Fuentes et al., 2006), some study used PRI combined with solar-induced chlorophyll fluorescence (SIF) to estimate GPP (Wang et al., 2020). Taking the canopy level as an example, the influencing factors of PRI observation are mainly the characteristic of the canopy itself (such as average leaf angle and LAI) and observation geometric relations (such as the solar zenith angle and observed zenith angle) due to the difference in the observation geometry of the Sun and the observation target. The spectrometer may receive canopy and background information through different sunlight and observation angles when giving an instantaneous observation field of view. Multi-angle spectral observation provides a means of removing non-physiological factors from physiological signals. A study of different ecosystems in the Mediterranean (grassland, alfalfa, chickpea, and rice) showed that PRI directional responses of horizontally homogeneous canopies are characterized by higher values in the backscatter direction than in forward scatter direction (Biriukova et al., 2020). Two studies on multi-angle PRI indicated that the correlation of PRI and LUE on rice increased when raising the observed zenith angle (Zheng and Xin Bao, 2014; Li, 2018). On the basis of multi-angle spectral observation, recent studies provided that the PRI normalized by the bidirectional reflectance distribution function (BRDF) model can be explored to improve the relationship between PRI and LUE (Wen et al., 2018). The BRDF model describes how land surface reflectance varies with views and solar angles (Barnsley et al., 1997; Gao et al., 2003; Los et al., 2005), and the semi-empirical kernel representation is the most common (Roujean et al., 1992b; Wanner et al., 1995c). Given the Sun’s position and canopy structure, kernel-based BRDF models represent angular reflectance distribution as a linear superposition of a set of basic BRDF shapes.
However, using the BRDF model to improve the relationship between PRI and LUE was mostly applied to forests (Hilker et al., 2008; Zhang et al., 2015; Zhang et al., 2017; Wen et al., 2018; Ma et al., 2020), and there are few reports on crops which are also an important part of the ecosystem. The lack of data has led to the uncertainty of the relationship between PRI and LUE on crops such as rice. It is worth noting that the rice canopy, like most ground features, belongs to the non-Lambertian body and has not been reported on using multi-angle data to fit the BRDF model. It is also unclear whether vapor pressure deficit (VPD), air temperature (Ta), photosynthetically active radiation (PAR), and LAI can affect PRI capturing LUE changes in rice. A study on evergreen broad-leaved forests in Malaysia showed that the correlation between PRI and LUE reached R2 = 0.12. Using different fitting methods, the impact of VPD on the relationship between PRI and LUE was 34% and 38% (Nakaji et al., 2014). Ma et al. (2020) research in subtropical mixed forests showed that the correlation between PRI and LUE is best at Ta of 10–15°C and is negative with VPD.
In this study, we used the rice field in East China as the research object to study the relationship between PRI and LUE. The objectives of this study are, 1) to try to analyze the change law of multi-angle spectra under the condition of the same physiological conditions of the canopy, 2) to study the correlation between PRI and LUE and how it is affected by environmental factors (VPD, Ta, PAR), and 3) to improve PRI-LUE correlation by using angle distinction and BRDF model and evaluate the improvement effect.
Materials and Methods
Research Area and Period
The study was carried out in National Climate Observatory in Shou county, Anhui Province (32°26 ‘N, 116°47′ E), which covers an area of 20 hm2, and has an altitude of 27 m. The average temperature was 25°C during this experiment. Shou county represents the climate conditions of typical agricultural regions in the middle and lower reaches of the Yangtze River basically in East China. The rotation crop is single-cropping medium rice. The time period for the experiment is from 3 August 2018 to 4 October 2018.
Acquisition of Remote Sensing Field Observation Data
In this experiment, a JAZ-Combo2 spectrometer (Ocean Optics, United States) set up at an altitude of 2 m above the horizontal field canopy was used to automatically record the reflectance in all weather conditions, and it was capable of measuring the wavelength range of 350–800 nm with a resolution of 1.5 nm. The spectrometer has two probes, one of which was fitted with a cosine receiver, mounted vertically upward and fixed to observe the received solar radiation at any time, while the other is used in conjunction with the Pan-tilt Unit (PTU) platform (the type is D46-17.5 W). The platform was rotated horizontally from −150° to +150° and vertically from 0° to 60°, and canopy reflectance measurement at different observed angles was driven by the rotation of the PTU.
We set the due south direction as the observed azimuth angle of 0°, east as negative azimuth and west as positive azimuth. The probe rotated at a speed of 10°/10s. In the vertical direction, the instrument was observed at zenith angles of 0°, 15°, 30°, 45°, and 60°, respectively. The PTU did not convert the azimuths when the zenith angle was 0° (the probe is perpendicular to the ground). We obtained the observed zenith angle and observed azimuth angle according to the PTU angle code table and recorded the solar zenith angle and solar azimuth angle at the same time. The definition of the terms used to describe the geometry of spectral measurements is given in Table 1. After acquiring multi-angle spectrometer data, we first retrieved the data. Then, the whiteboard correction parameters and the value of the central wavelength were used to control the quality of data. The whiteboard was a standard diffuse reflection reference for measurement. After the outliers were removed, we extracted the canopy reflectance at the wavelengths of 531 and 570 nm from the archived data, and PRI was calculated using the following equation (Gamon et al., 1992):
where
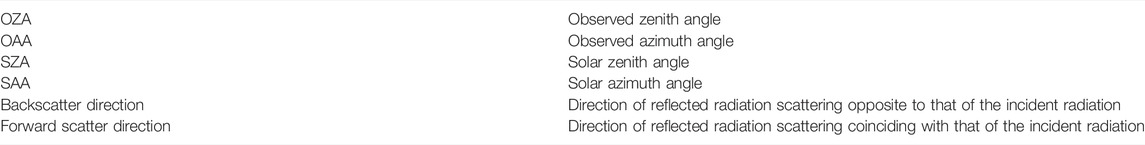
TABLE 1. Definition of terms used to describe the geometry of the measurements.
Acquisition and Calculation of Eddy Covariance and Radiation Data
An infrared open circuit CO2/H2O gas analyzer (LI-7500, LI-Cor Inc., United States), a data collector, and a 3D ultrasonic anemometer (CSAT, Campbell., United States) were installed at a height of 2 m above the canopy to determine the water vapor content and CO2 concentration in the air and measure the 3D wind speed and temperature above the canopy. The flux data were collected by a high-speed data collector and communication system, with a sampling frequency of 10 Hz. We retrieved the CO2 flux (Fc), VPD, and Ta at 30-min intervals by Eddypro. Then, we screened the original flux data obtained and set the following four criteria to remove invalid flux data, 1) out of range of the instrument, 2) negative at night, 3) one hour before and after rain, and 4) when frictional wind speed was below critical value at night, we set critical value at night to 0.13 m s−1 (Hilker et al., 2008). The net ecosystem exchange (NEE) was considered as Fc, which was used in calculating gross primary production (GPP):
where
where
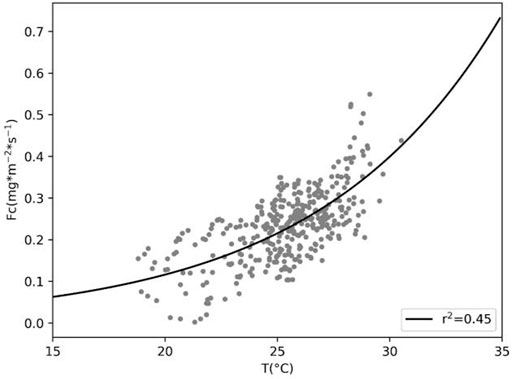
FIGURE 1. Fitting effect of night
We conducted conventional meteorological element observations, used the RMET system supplied by VECTOR and VAISALA, and installed approximately 5 m from the vorticity correlation system to measure wind direction, wind speed, temperature, and humidity at two heights of 1 and 2 m above the canopy. Total radiation (CM11), net radiation (CNR-1), photosynthetically active radiation (LI-190SB), and rainfall (TE525MM) were measured above the canopy to obtain PAR. The data measured earlier were subsequently processed by a data collector and averaged at 30-min. LUE was calculated using the following equation (Gamon et al., 1992):
where
where FPAR represents the fraction of the absorbed photosynthetically active radiation, k is the extinction coefficient; we chose 0.5 (Chen et al., 2006).
Using Multi-Angle PRI and the BRDF Model to Track LUE
The PRI obtained from the JAZ-Combo2 spectrometer was affected by the observation angle and physiological status. We assumed that the physiological state and lighting conditions of the rice remained unchanged every 15 min, and we followed the method by Hilker et al. (Wanner et al., 1995b). Kernel-based BRDF model was used to present vegetation index from different angles for the differences in the sun–observer geometry as the sensor observed different locations around the flux tower (Wanner et al., 1995a; Wanner et al., 1997), which was widely used in ground-based measurements and satellite remote sensing (Roujean et al., 1992b). The semi-empirical kernel representation is given by Roujean et al. (1992a):
where
Results
Multi-Angle Rice Spectra and PRI
Figure 2 shows an example of reflectance acquired over a 15-min interval at the rice canopy, and the reflectance reached a peak at 550 nm, which showed varied reflectance obviously. It can be seen that reflectance increased with rising OZA (Figure 2A) and was higher in backscatter direction than in forward scatter direction (Figure 2B). Figure 3 shows the multi-angle PRI over a 15-min interval before (a, b, c, and d) and after (e, f, g, and h) noon. The change characteristics of PRI with angle were the same at 4 days of the rice growth period. PRI varied with the angle of observation and was smaller in the direction of the solar incident (backscatter direction) than the reflective (forward scatter direction) direction. However, the hot spot effect of the multi-angle PRI was not obvious.
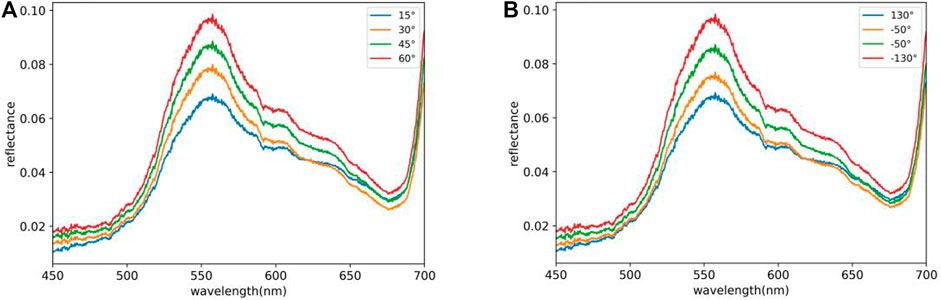
FIGURE 2. Multi-angle reflectance within 15 min at 10:30 a.m. on August 29 (ZAA was about 47.2°), 2018; (A) various OZA with OAA at −130° and (B) various OAA with OZA at 60°.
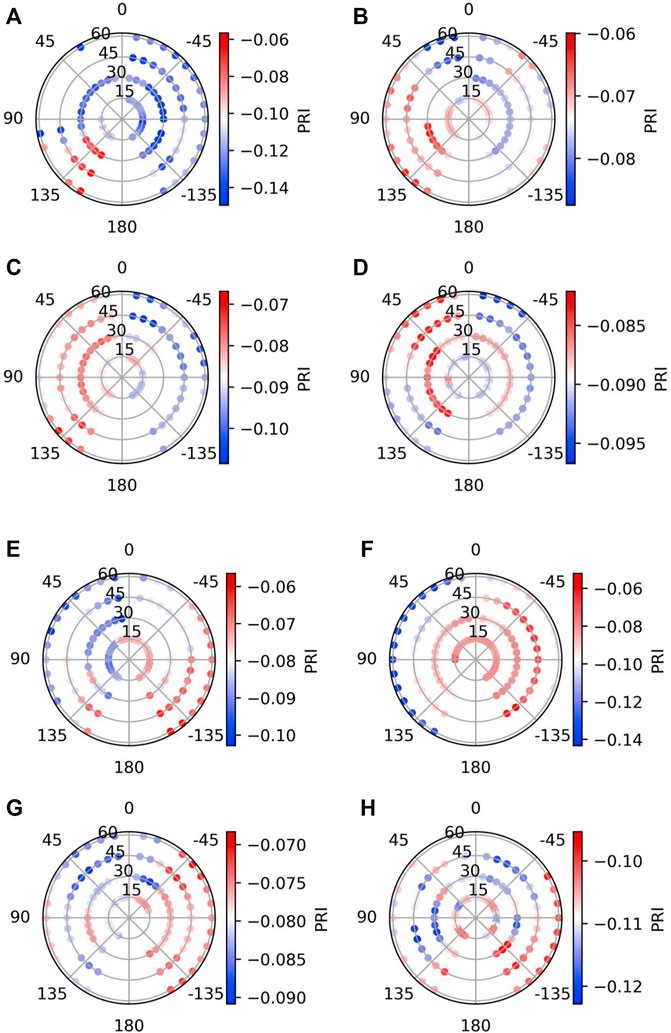
FIGURE 3. Multi-angle PRI within 15 min at 10:30 (A–D) and 13:30 (E–H) in August 10, August 29, September 12, and September 23, 2018. The polar angles represent OAA, and the polar diameter represents OZA.
Figure 4 shows multi-angle PRI, LUE, and PAR over a day interval, and the 3 days we chose can represent the tasseling, filling, and maturing stages of rice. The change characteristics of LUE related to the light conditions had a tendency to decrease with rising PAR (Figures 4G–I) and were close to the change of PRI, especially in backscatter direction. The cold spot of daily PRI was concentrated near noon in backscatter direction (Figures 4B and C). Generally, the LUE and PRI gradually decreased with the growth of rice.
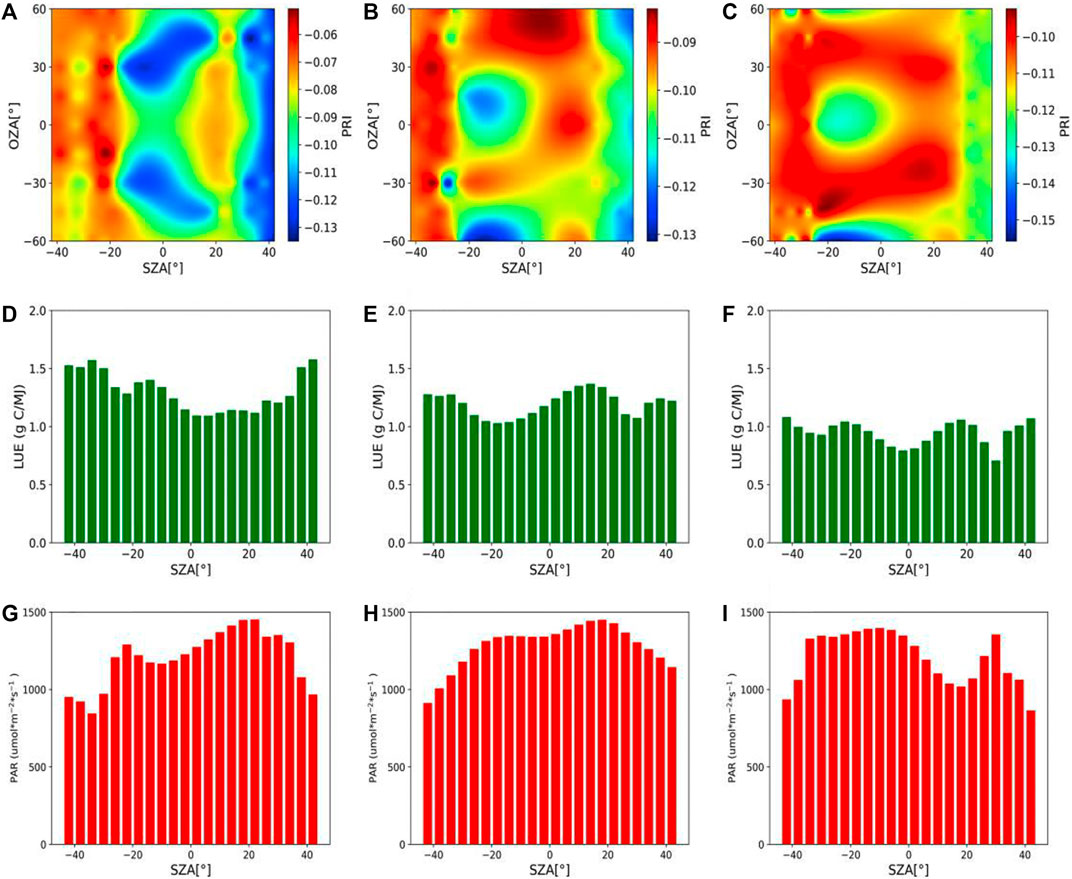
FIGURE 4. Daily multi-angle-PRI (A–C), LUE (D–F), and PAR (G–I) of the canopy during rice growth. Three times were selected as representative periods of rice growth [(A–I) represent 9:00–15:00 in August 10, August 29, and September 12, 2018, respectively]. The x-axis is the SZA; the negative direction of which is before 12:00. The negative direction of the left y-axis in (A–C) is the backscatter. The values between the measurements are linearly interpolated.
Using Multi-Angle PRI and the BRDF Model to Track LUE
Figure 5 shows the comparisons of the relationships between the LUE and PRI on sunny (R2 = 0.4, p < 0.01) and cloudy (R2 = 0.26, p < 0.05) days at a half-hourly time scale with OZA of 0°. The relationship between the LUE and PRI was significantly improved by distinguishing four OZAs and two scatter directions of PRI on sunny days, as shown in Figure 6. Generally, the correlation of PRI and LUE increased with rising OZA and was better in backscatter than forward scatter direction. The correlation was most significant at OZA of 60° in backscatter direction but was less in back than forward scatter direction at OZA of 30°. As shown in Figure 7, the PRI standardized by the BRDF model to common observation and solar illumination geometry enhanced the correlation with LUE (R2 = 0.72, p < 0.01), as the vertical range of PRI values for a given LUE was reduced. Figure 8 shows the comparisons of the PRI with and without the correction of the BRDF model in forward and back scatter direction, respectively. In the rice growth period, the PRI of backscatter direction was lower than that of forward scatter direction regardless of observation or BRDF model. Although the PRI of observation exhibited a performance of nonlinear change, it was lowest at OZA of 60° and −60°, respectively. In brief, the BRDF model made PRI linear with OZA in both scatter directions.
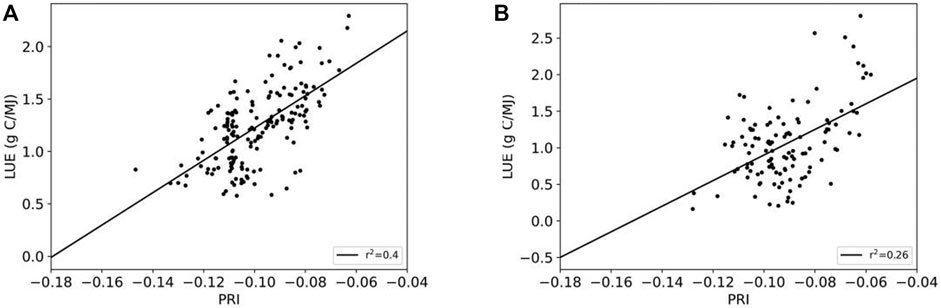
FIGURE 5. Correlation between PRI and LUE on sunny days (A) and cloudy days (B) with the OZA of 0°.
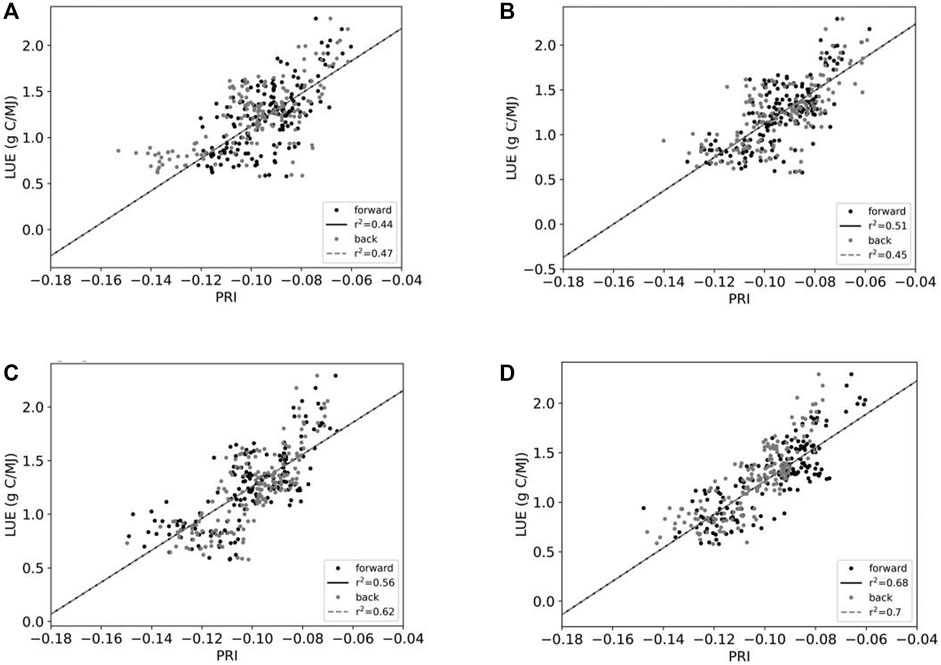
FIGURE 6. Correlation comparison of PRI-LUE from different observation angles on clear days. (A–D) represent OZAs of 15°, 30°, 45°, and 60°, respectively.
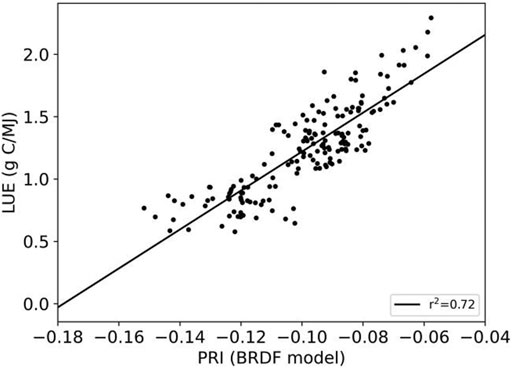
FIGURE 7. Relationship between LUE and PRI corrected by BRDF. After using the BRDF model to correct PRI, the correlation was improved (R2 = 0.72; p < 0.01).
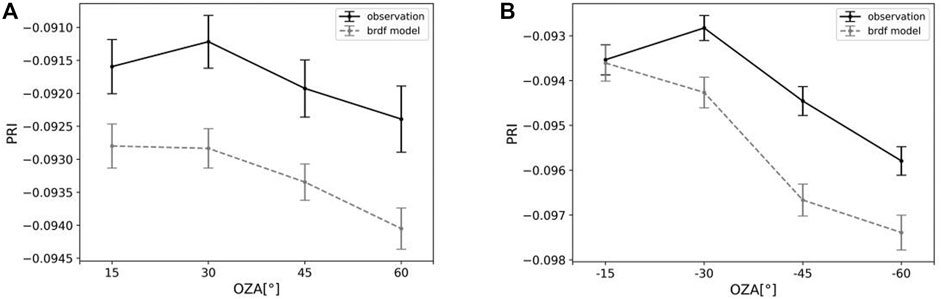
FIGURE 8. PRI observations and BRDF fitting values under different observation zenith angles in forward (A) and backward (B) scattering directions.
The Effect of Environmental Variation on the Relationship Between PRI and LUE
Figures 9A and B illustrate the effects of VPD on LUE and PRI, observed using the JAZ-Combo2 spectrometer. Figure 7 reveals the change in the correlation between PRI and LUE as a function of VPD. PRI decreased with rising VPD while LUE increased, and the correlation between PRI and LUE decreased with rising VPD. The best correlation between PRI and LUE (R2 = 0.32) occurred when VPD<2 kpa. Figure 10 shows the change in the correlation between the PRI and the LUE as a function of air temperature, which ranged from 20 to 35°C in our study, and the LUE and PRI increased gradually with rising Ta. The correlation was at its largest (R2 = 0.29) when Ta was between 25 and 30°C. Table 2 shows the response of LUE and PRI to PAR, VPD and Ta on sunny and cloudy days. On sunny days, LUE was affected by PAR and VPD, PAR had the best impact on LUE (R2 = 0.27), followed by Ta (R2 = 0.26), while the effect of VPD on LUE can be ignored, and PRI also had the best response to PAR (R2 = 0.26), while Ta and VPD had no effect on PRI. However, the response was not obvious, even though PAR could explain LUE (R2 = 0.19).
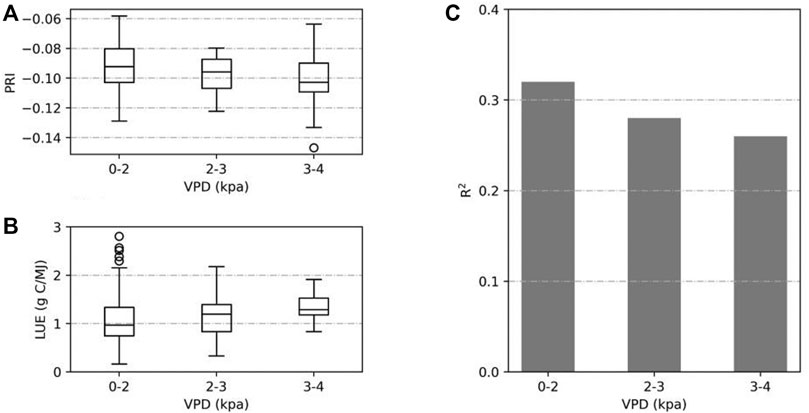
FIGURE 9. Half-hour time scale of PRI and LUE are as affected by VPD (A,B). Correlation between PRI and LUE under different VPD gradings (C).
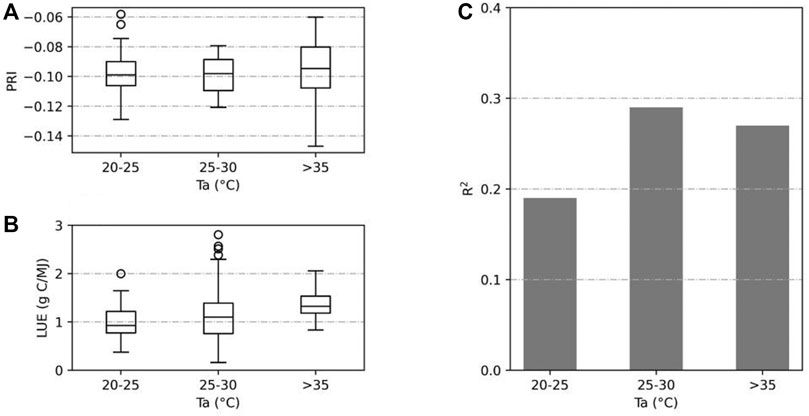
FIGURE 10. Half-hour time scale of PRI and LUE are as affected by Ta (A,B). Correlation between PRI and LUE under different Ta gradings (C).
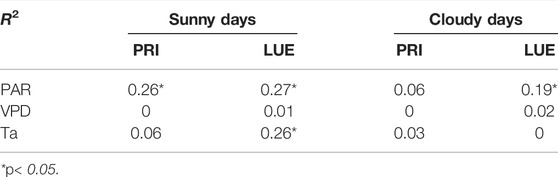
TABLE 2. Comparison of responses of PRI and LUE to environmental factors in the sunny and cloudy days.
Discussion
Multi-Angle Canopy Reflectance and PRI
The results in Figure 3 confirm the expectation of reflectance changing with observation angles, which correlated with canopy structures and different observation angles. The characteristics of reflectance in observation angles are mainly due to the differences in the sun–observer geometry as the sensor observes different locations around the observation tower under the assumption that the physiological state remains unchanged (Hilker et al., 2010a). The PRI over a 15-min interval was smaller in backscatter than forward scatter direction (Figure 3). This result seems to be inconsistent with the that reported by Ma et al. (2020), which may be explained by the difference in physiological characteristics of rice from forests. The cold spot PRI appeared in the backscatter direction (Figures 4B and C), and the hot spot appeared in the forward scatter direction (Figure 4B). The change of PRI near −60° is linear with the daily change of LUE (Figures 4A–F). Rising OZA seems to be more conducive to PRI tracking LUE, and this result was consistent with that reported by Khelvi et al. (Biriukova et al., 2020). The improvement of correlation between PRI and LUE was limited at the OZA of 15° and 30° but obvious at 45° and 60° (Figure 6). The correlation was greatest at OZA of 60° with a backscatter direction (Figure 6D). The different correlations in OZAs and scatter directions may be ascribed to the fact that the leaf inclination of the whole rice canopy was about 60° in our study. The OZA of 60° reduces the influence of PRI instability caused by the incorporation of non-canopy information, and the backscatter direction reduces the influence of canopy shadow. Generally, multi-angle observation can reveal the anisotropy of vegetation surface reflectance, reducing the influence of the structural and shadow on vegetation canopy according to the canopy structures.
Response of the Correlation Between PRI and LUE to BRDF Model
The multi-angle PRI corrected by the semi-empirical kernel-driven bidirectional BRDF model improved the correlation with LUE (Figure 7). The result indicates that using the BRDF model correction, the spatial structure characteristics of vegetation can be more accurately observed through spectral observations (Hall et al., 2008), can eliminate the uncertainty brought by the Sun and observation angles, and increase the comparability of different observations (Ma et al., 2020). The changing angle of observation and Sun will cause the variance of the observation data to increase. This uncertainty caused by the angle factor will no longer exist after using the BRDF model correction, and the estimation accuracy of the LUE by PRI will be improved. However, this improvement of rice seems to be worse than the results reported by some boreal and tropical forests (Hilker et al., 2008; Wen et al., 2018; Ma et al., 2020). This seems to be due to the better continuity of the rice canopy structures, and further experiments on other crops are needed to verify the feasibility of the BRDF model in multi-angle observations of crops.
Response of PRI and LUE to Environmental Factors
The spectroscopic and flux observation is also affected by growth environment factors, such as light intensity, air temperature, and moisture. Previous studies found that environmental factors affected the physiological state of the plant and the accuracy of PRI tracking LUE (Chunlin et al., 2007; Hall et al., 2008; Hilker et al., 2010b; Garbulsky et al., 2011; Soudani et al., 2014; Zhang et al., 2015). The results of Figure 5 confirm the difference in PRI-LUE correlation between sunny and cloudy days. This difference explained that the change of PRI is undefined when radiation is scattered and light diffused in sky, leading to unclear changes in LUE and PRI (Table 2). PRI and LUE were also sensitive to Ta, and the correlation between PRI and LUE was greater in a low VPD environment (Figure 9), which explained the effect of moisture and temperature on PRI and LUE. The temperature does not interfere with the characterization of LUE by PRI (Ma et al., 2020). The response of PRI and LUE to environmental factors was inconsistent with the results of forests (Hilker et al., 2010a; Zhang et al., 2017; Ma et al., 2020). Therefore, finding a clear response of PRI and LUE to environmental change on rice still needs further research.
Conclusion
This study used the reflectance and flux data by the multi-angle automatic remote sensing platform and the flux tower during the period from 3 August 2018 to 4 October 2018. The goal was to study the ability of PRI in estimating the LUE of middle and lower reaches of the Yangtze River rice in China. The following conclusions were drawn from this study:
1 The reflectance changes with observation angles with the physiological state remaining unchanged. The PRI was smaller in backscatter than the forward scatter direction over a 15-min interval.
2 The improvement of correlation between PRI and LUE was greatest at OZA of 60° with backscatter direction (R2 = 0.7), and using the BRDF model also improved this correlation (R2 = 0.72).
3 The correlation of PRI and LUE on rice canopy was greater on sunny days than on cloudy days, which was mostly affected by PAR, followed by VPD.
PRI has a vital reference value in estimating LUE. However, strict requirements for testing and observation sites may limit the promotion of research results to some extent. Separating PRI and LUE of sunlit and shaded leaves still needs to be verified in crop ecosystems. Subsequent research could be carried out on multiple crops to make it possible to apply the PRI inversion LUE in a large area.
Data Availability Statement
The original contributions presented in the study are included in the article/supplementary material; further inquiries can be directed to the corresponding author.
Author Contributions
JG: data collection and processing; ZZ: data processing and writing the manuscript. CG: manuscript proofreading. SJ: manuscript proofreading.
Funding
Our research was supported by the Natural Science Foundation of Jiangsu Province, China (BK20191139).
Conflict of Interest
The authors declare that the research was conducted in the absence of any commercial or financial relationships that could be construed as a potential conflict of interest.
The reviewer (YL) declared a shared affiliation with the authors to the handling editor at the time of the review.
Publisher’s Note
All claims expressed in this article are solely those of the authors and do not necessarily represent those of their affiliated organizations, or those of the publisher, the editors, and the reviewers. Any product that may be evaluated in this article, or claim that may be made by its manufacturer, is not guaranteed or endorsed by the publisher.
Acknowledgments
The authors would like to thank Dr. Chen, J. M. (University of Toronto) for his advocacy of multi-angle reflectance observations of ecosystems. The authors would also like to acknowledge the research on PRI conducted by Dr. Thomas Hilker (Oregon State Univ., in memorium). The authors also acknowledge the Jiangsu Key Laboratory of Agricultural Meteorology Foundation on the Crop Disaster Evaluation Method Based on the Combination of Crop Growth Model and Remote Sensing Technology.
References
Asner, G. P., Nepstad, D., Cardinot, G., and Ray, D. (2004). Drought Stress and Carbon Uptake in an Amazon Forest Measured with Spaceborne Imaging Spectroscopy. Proc. Natl. Acad. Sci. U.S.A. 101 (16), 6039–6044. doi:10.1073/pnas.0400168101
Baldocchi, D. D., Hincks, B. B., and Meyers, T. P. (1988). Measuring Biosphere-Atmosphere Exchanges of Biologically Related Gases with Micrometeorological Methods. Ecology 69 (5), 1331–1340. doi:10.2307/1941631
Barnsley, M. J., Lewis, P., Sutherland, M., and Muller, J.-P. (1997). Estimating Land Surface Albedo in the HAPEX-Sahel Southern Super-site: Inversion of Two BRDF Models against Multiple Angle ASAS Images. J. Hydrology 188-189 (1), 749–778. doi:10.1016/s0022-1694(96)03169-1
Biriukova, K., Celesti, M., Evdokimov, A., Labrador, J. P., Julitta, T., and Migiavacca, M. Effects of Varying Solar-View Geometry and Canopy Structure on Solar-Induced Chlorophyll Fluorescence and PRI [J]. Int. J. Appl. Earth Observation Geoinformation, 2020, 89. doi:10.1016/j.jag.2020.102069
Chen, J. M., Govind, A., Sonnentag, O., Zhang, Y., Barr, A., and Amiro, B. Leaf Area Index Measurements at Fluxnet-Canada Forest Sites[J]. Agric. For. Meteorology, 2006, 140(1-4): 257–268.doi:10.1016/j.agrformet.2006.08.005
Chunlin, W., Guoyi, Z., Xu, W., Xuli, T., Chuanyan, Z., and Guirui, Y. (2007). Below-canopy CO2 Flux and its Environmental Response Characteristics in a Coniferous and Broad-Leaved Mixed Forest in Dinghushan, China. Acta Ecol. Sin. 27 (3), 846–853. doi:10.1016/s1872-2032(07)60021-3
Damm, A., Elbers, J., Erler, A., Gioli, B., Hamdi, K., Hutjes, R., et al. (2010). Remote Sensing of Sun-Induced Fluorescence to Improve Modeling of Diurnal Courses of Gross Primary Production (GPP). Glob. Change Biol. 16 (1), 171–186. doi:10.1111/j.1365-2486.2009.01908.x
Fuentes, D., Gamon, J., Cheng, Y., Claudio, H., Qiu, H., Mao, Z., et al. (2006). Mapping Carbon and Water Vapor Fluxes in a Chaparral Ecosystem Using Vegetation Indices Derived from AVIRIS. Remote Sens. Environ. 103 (3), 312–323. doi:10.1016/j.rse.2005.10.028
Gamon, J. A., Field, C. B., Goulden, M. L., Griffin, K. L., Hartley, A. E., Joel, G., et al. (1995). Relationships between NDVI, Canopy Structure, and Photosynthesis in Three Californian Vegetation Types. Ecol. Appl. 5 (1), 28–41. doi:10.2307/1942049
Gamon, J. A., Peñuelas, J., and Field, C. B. (1992). A Narrow-Waveband Spectral Index that Tracks Diurnal Changes in Photosynthetic Efficiency. Remote Sens. Environ. 41 (1), 35–44. doi:10.1016/0034-4257(92)90059-s
Gamon, J. A., and Surfus, J. S. (1999). Assessing Leaf Pigment Content and Activity with a Reflectometer. New Phytol. 143 (1), 105–117. doi:10.1046/j.1469-8137.1999.00424.x
Gao, F., Schaaf, C. B., Strahler, A. H., Jin, Y., and Li, X. (2003). Detecting Vegetation Structure Using a Kernel-Based BRDF Model. Remote Sens. Environ. 86 (2), 198–205. doi:10.1016/s0034-4257(03)00100-7
Garbulsky, M. F., Peñuelas, J., Gamon, J., Inoue, Y., and Filella, I. (2011). The Photochemical Reflectance Index (PRI) and the Remote Sensing of Leaf, Canopy and Ecosystem Radiation Use efficienciesA Review and Meta-Analysis. Remote Sens. Environ. 115 (2), 281–297. doi:10.1016/j.rse.2010.08.023
Goward, S. N., and Huemmrich, K. F. (1992). Vegetation Canopy PAR Absorptance and the Normalized Difference Vegetation Index: An Assessment Using the SAIL Model. Remote Sens. Environ. 39 (2), 119–140. doi:10.1016/0034-4257(92)90131-3
Hall, F. G., Hilker, T., Coops, N. C., Lyapustin, A., Huemmrich, K. F., Middleton, E., et al. (2008). Multi-angle Remote Sensing of Forest Light Use Efficiency by Observing PRI Variation with Canopy Shadow Fraction. Remote Sens. Environ. 112 (7), 3201–3211. doi:10.1016/j.rse.2008.03.015
Hilker, T., Coops, N. C., Hall, F. G., Black, T. A., Wulder, M. A., Nesic, Z., et al. (2008). Separating Physiologically and Directionally Induced Changes in PRI Using BRDF Models. Remote Sens. Environ. 112 (6), 2777–2788. doi:10.1016/j.rse.2008.01.011
Hilker, T., Nesic, Z., Coops, N. C., and Lessard, D. (2010). A New, Automated, Multiangular Radiometer Instrument for Tower-based Observations of Canopy Reflectance (Amspec Ii). Instrum. Sci. Technol. 38 (5), 319–340. doi:10.1080/10739149.2010.508357
Hilker, T., van Leeuwen, M., Coops, N. C., Wulder, M. A., Newnham, G. J., Jupp, D. L. B., et al. (2010). Comparing Canopy Metrics Derived from Terrestrial and Airborne Laser Scanning in a Douglas-fir Dominated Forest Stand. Trees 24 (5), 819–832. doi:10.1007/s00468-010-0452-7
Chen, J. M.Evaluation of Vegetation Indices and a Modified Simple Ratio for Boreal Applications [J]. Can. J. Remote Sens.,2014,22(3).doi:10.1080/07038992.1996.10855178
Roujean, J.‐L., Leroy, M., and Deschamps, P.‐Y. A Bidirectional Reflectance Model of the Earth's Surface for the Correction of Remote Sensing Data [J]. John Wiley Sons, Ltd,1992,97(D18).doi:10.1029/92jd01411
Justice, C. O., Vermote, E., Townshend, J. R. G., Defries, R., Roy, D. P., Hall, D. K., et al. (1998). The Moderate Resolution Imaging Spectroradiometer (MODIS): Land Remote Sensing for Global Change Research. IEEE Trans. Geosci. Remote Sens. 36 (4), 1228–1249. doi:10.1109/36.701075
Li, S. (2018). PRI-LUE Model Optimization Based on Multi-Angle Remote Sensing and Flux Data (In Chinese) [D]. Nanjing: Nanjing University of Information Science & Technology.
Los, S. O., North, P. R. J., Grey, W. M. F., and Barnsley, M. J. (2005). A Method to Convert AVHRR Normalized Difference Vegetation Index Time Series to a Standard Viewing and Illumination Geometry. Remote Sens. Environ. 99 (4), 400–411. doi:10.1016/j.rse.2005.08.017
Ma, L., Wang, S., Chen, J., Chen, B., Zhang, L., Ma, L., et al. (2020). Relationship between Light Use Efficiency and Photochemical Reflectance Index Corrected Using a BRDF Model at a Subtropical Mixed Forest. Remote Sens. 12 (3), 550. doi:10.3390/rs12030550
Nakaji, T., Kosugi, Y., Takanashi, S., Niiyama, K., Noguchi, S., Tani, M., et al. (2014). Estimation of Light-Use Efficiency through a Combinational Use of the Photochemical Reflectance Index and Vapor Pressure Deficit in an Evergreen Tropical Rainforest at Pasoh, Peninsular Malaysia. Remote Sens. Environ. 150, 82–92. doi:10.1016/j.rse.2014.04.021
Nichol, C. J., Huemmrich, K. F., Black, T. A., Jarvis, P. G., Walthall, C. L., and Grace, J. Remote Sensing of Photosynthetic-Light-Use Efficiency of Boreal Forest [J]. Agric. For. Meteorology, 2000, 101(2-3): 131–142. doi:10.1016/s0168-1923(99)00167-7
Peñuelas, J., Llusia, J., Pinol, J., and Filella, I. (1997). Photochemical Reflectance Index and Leaf Photosynthetic Radiation-Use-Efficiency Assessment in Mediterranean Trees [J]. Int. J. Remote Sens., 1997, 18(13): 2863–2868. doi:10.1080/014311697217387
Peñuelas, J., and Inoue, Y. (1999). Reflectance Indices Indicative of Changes in Water and Pigment Contents of Peanut and Wheat Leaves[J]. Photosynthetica 36 (3). doi:10.1023/A:1007033503276
Roujean, J. L., Leroy, M., and Deschamps, P. Y. A Bidirectional Reflectance Model of the Earth's Surface for the Correction of Remote Sensing Data[J]. J. Geophys. Res. Atmos., 1992, 97(D18). doi:10.1029/92jd01411
Running, S. W., and Nemani, R. R. (1988). Relating Seasonal Patterns of the AVHRR Vegetation Index to Simulated Photosynthesis and Transpiration of Forests in Different Climates. Remote Sens. Environ. 24 (2), 347–367. doi:10.1016/0034-4257(88)90034-x
Ryu, Y., Berry, J. A., and Baldocchi, D. D. (2019). What Is Global Photosynthesis? History, Uncertainties and Opportunities. Remote Sens. Environ. 223, 95–114. doi:10.1016/j.rse.2019.01.016
Sellers, P., Hall, F., Ranson, K. J., Margolis, H., Kelly, B., Baldocchi, D., et al. (1995). The Boreal Ecosystem-Atmosphere Study (BOREAS): An Overview and Early Results from the 1994 Field Year. Bull. Amer. Meteor. Soc. 76 (9), 1549–1577. doi:10.1175/1520-0477(1995)076<1549:tbesao>2.0.co;2
Soudani, K., Hmimina, G., Dufrêne, E., Berveiller, D., Delpierre, N., Ourcival, J.-M., et al. (2014). Relationships between Photochemical Reflectance Index and Light-Use Efficiency in Deciduous and Evergreen Broadleaf Forests. Remote Sens. Environ. 144 (Complete), 73–84. doi:10.1016/j.rse.2014.01.017
Strahler, A. H. A Hybrid Geometric Optical-Radiative Transfer Approach for Modeling Light Absorption and Albedo of Discontinuous Canopies [J].Sci. China(Series B),1995,38(07):807–816. doi:10.1109/TGRS.1985.289389
Sun, Y., Frankenberg, C., Jung, M., Joiner, J., Guanter, L., Köhler, P., et al. (2018). Overview of Solar-Induced Chlorophyll Fluorescence (SIF) from the Orbiting Carbon Observatory-2: Retrieval, Cross-Mission Comparison, and Global Monitoring for GPP. Remote Sens. Environ. 209, 808–823. doi:10.1016/j.rse.2018.02.016
Tenhunen, J. D., Catarino, F. M., and Lange, O. L., (1987). Plant Response to Stress: Functional Analysis in Mediterranean Ecosystems [M]. doi:10.1109/36.701075
Verma, S. B., Dobermann, A., Cassman, K. G., Walters, D. T., Knops, J. M., and Arkebauer, T. J. Annual Carbon Dioxide Exchange in Irrigated and Rainfed Maize-Based Agroecosystems [J]. Agric. For. Meteorology, 2005, 131(1-2): 77–96.doi:10.1016/j.agrformet.2005.05.003
Wang, X., Chen, J. M., and Ju, W. (2020). Photochemical Reflectance Index (PRI) Can Be Used to Improve the Relationship between Gross Primary Productivity (GPP) and Sun-Induced Chlorophyll Fluorescence (SIF). Remote Sens. Environ. 246, 111888. doi:10.1016/j.rse.2020.111888
Wanner, W., Li, X., and Strahler, A. H. (1995). On the Derivation of Kernels for Kernel-Driven Models of Bidirectional Reflectance. J. Geophys. Res. 100 (D10), 21077–21089. doi:10.1029/95jd02371
Wanner, W., Li, X., and Strahler, A. H. (1995). On the Derivation of Kernels for Kernel‐driven Models of Bidirectional reflectance[J]. John Wiley & Sons, 100.D10.
Wanner, W., Li, X., and Strahler, A. H. (1995). On the Derivation of Kernels for Kernel‐driven Models of Bidirectional reflectance[J]. John Wiley & Sons, 100.D10.
Wanner, W., Strahler, A. H., Hu, B., Lewis, P., Muller, J.-P., Li, X., et al. (1997). Global Retrieval of Bidirectional Reflectance and Albedo over Land from EOS MODIS and MISR Data: Theory and Algorithm. J. Geophys. Res. 102 (D14), 17143–17161. doi:10.1029/96jd03295
Wen, J., Coops, N. C., Tortini, R., Pang, Y., and Black, A. Remote Sensing of Variation of Light Use Efficiency in Two Age Classes of Douglas-fir[J]. Remote Sens. Environ., 2018, 219:284–297.
Zhang, Q., Ju, W., Chen, J., Wang, H., Yang, F., Fan, W., et al. (2015). Ability of the Photochemical Reflectance Index to Track Light Use Efficiency for a Sub-tropical Planted Coniferous Forest. Remote Sens. 7 (12), 16938–16962. doi:10.3390/rs71215860
Zhang, Q., M. Chen, J., Ju, W., Wang, H., Qiu, F., Yang, F., et al. (2017). Improving the Ability of the Photochemical Reflectance Index to Track Canopy Light Use Efficiency through Differentiating Sunlit and Shaded Leaves. Remote Sens. Environ. 194, 1–15. doi:10.1016/j.rse.2017.03.012
Keywords: photochemical reflectance index (PRI), light use efficiency (LUE), multi-angle observation, remote sensing, carbon fluxes, BRDF model
Citation: Guo J, Zhang Z, Guo C and Jin S (2022) Research of Light Use Efficiency for Paddy Rice Using Multi-Angle Hyperspectral Observations. Front. Earth Sci. 10:829315. doi: 10.3389/feart.2022.829315
Received: 05 December 2021; Accepted: 26 May 2022;
Published: 14 July 2022.
Edited by:
Shibo Fang, Chinese Academy of Meteorological Sciences, ChinaReviewed by:
Yan Li, Nanjing University of Information Science and Technology, ChinaJian Yang, China University of Geosciences Wuhan, China
Yuping Ma, Chinese Academy of Meteorological Sciences, China
Copyright © 2022 Guo, Zhang, Guo and Jin. This is an open-access article distributed under the terms of the Creative Commons Attribution License (CC BY). The use, distribution or reproduction in other forums is permitted, provided the original author(s) and the copyright owner(s) are credited and that the original publication in this journal is cited, in accordance with accepted academic practice. No use, distribution or reproduction is permitted which does not comply with these terms.
*Correspondence: Jianmao Guo, Z3Vvamlhbm1hbzIwMDRAMTYzLmNvbQ==