- 1National School of Surveying, University of Otago, Dunedin, New Zealand
- 2Department of Geology, University of Otago, Dunedin, New Zealand
- 3Antarctica New Zealand, Christchurch, New Zealand
- 4Institute for Marine and Antarctic Studies, University of Tasmania, Hobart, TAS, Australia
- 5Division of Earth Sciences, Korea Polar Research Institute, Incheon, Korea
- 6British Antarctic Survey, Cambridge, United Kingdom
We use high resolution, ground-based observations of ice displacement to investigate ice deformation across the floating left-lateral shear margin of Priestley Glacier, Terra Nova Bay, Antarctica. Bare ice conditions allow us to fix survey marks directly to the glacier surface. A combination of continuous positioning of a local reference mark, and repeat positioning of a network of 33 stakes installed across a 2 km width of the shear margin are used to quantify shear strain rates and the ice response to tidal forcing over an 18-day period. Along-flow velocity observed at a continuous Global Navigation Satellite Systems (GNSS) station within the network varies by up to ∼30% of the mean speed (±28 m a−1) over diurnal tidal cycles, with faster flow during the falling tide and slower flow during the rising tide. Long-term deformation in the margin approximates simple shear with a small component of flow-parallel shortening. At shorter timescales, precise optical techniques allow high-resolution observations of across-flow bending in response to the ocean tide, including across-flow strains on the order of 10–5. An elastodynamic model informed by the field observations is used to simulate the across-flow motion and deformation. Flexure is concentrated in the shear margin, such that a non-homogeneous elastic modulus is implied to best account for the combined observations. The combined pattern of ice displacement and ice strain also depends on the extent of coupling between the ice and valley sidewall. These conclusions suggest that investigations of elastic properties made using vertical ice motion, but neglecting horizontal displacement and surface strain, will lead to incorrect conclusions about the elastic properties of ice and potentially over-simplified assumptions about the sidewall boundary condition.
1 Introduction
The rate at which water stored in an ice sheet returns to the ocean is regulated in part by flow resistance provided by marine-terminating glaciers and floating ice shelves (Dupont and Alley, 2005; Goldberg et al., 2009; Gudmundsson et al., 2019). Where the flowing ice transitions from grounded to floating, basal drag reduces to zero and other sources of resistance, including longitudinal stress gradients and lateral drag, must balance the driving stress (van der Veen and Whillans, 1989; van der Veen et al., 2014). Lateral drag is localised by the non-linear flow law into shear zones at margins where ice is in contact with confining features such as valley walls and coastal headlands (Thomas, 1979). More generally, shear margins form wherever there is a boundary between ice that is deforming rapidly, and ice or rock, that is not (Echelmeyer et al., 1994; Jackson and Kamb, 1997; Whillans and van der Veen, 1997). Changes in shear margin properties have been associated with climate-driven changes in the flow of Greenland and West Antarctic outlet glaciers (Cavanagh et al., 2017; Lampkin et al., 2018; Alley et al., 2019). The mechanics of lateral margins are thus important to both ice-sheet system dynamics and to the representation of marine-terminating glacial systems in models used to project future change.
The horizontal velocity of ice shelves, and the downstream reaches of their tributaries, is observed to vary at semidiurnal, diurnal, and fortnightly frequencies in association with ocean tides (Murray et al., 2007; King et al., 2011; Padman et al., 2018). In the Ross Sea/Terra Nova Bay region of Antarctica, where the vertical tidal signal is dominated by the diurnal constituents K1 and O1 (MacAyeal, 1984; Padman et al., 2003; Byun and Hart, 2020; Ray et al., 2021), ice flow exhibits a strong diurnal variation and smaller responses at the higher and lower frequencies. For example, horizontal velocity at the calving front of the Ross Ice Shelf (RIS) varies by ±100% of the mean speed at a diurnal timescale and by a lesser amount semidiurnally (Brunt et al., 2010; Brunt and MacAyeal, 2014). Beardmore Glacier, a RIS tributary, exhibits diurnal variations of ±20% to ±50% of the mean long-term speed (Marsh et al., 2013; Cooley et al., 2019). Tidally-paced flow variation is also observed tens of kilometres upstream of the grounding line in several of the RIS tributary ice streams (Anandakrishnan et al., 2003; Bindschadler et al., 2003; Wiens et al., 2008).
Tidally-forced variation in ice shelf and tributary flow has been attributed to tide-modulated processes acting at/upstream of the grounding line (Thompson et al., 2014; Walker et al., 2014; Rosier et al., 2015; Minchew et al., 2017), at pinning points seaward of the grounding line (Heinert and Riedel, 2007; Robel et al., 2017) and within floating shear margins (Rosier and Gudmundsson, 2018). Two possible mechanisms of response are generally considered: 1) an instantaneous, elastic or viscoelastic response to bending stresses associated with the rising and falling tide (Rack et al., 2017; Minowa et al., 2019; Rosier and Gudmundsson, 2020); and 2) modifications to basal drag/contact stresses that change resistive stresses throughout the floating and near-floating domain (Schmeltz et al., 2001; Gudmundsson, 2011; King et al., 2011; Lescarmontier et al., 2015; Robel et al., 2017; Rosier and Gudmundsson, 2020). Local conditions, including the mechanical properties of the ice and its underlying substrate, affect how ice responds to the tidal forcing. Tide regime also varies, for example, the Ross Sea region is dominated by diurnal tides while the Weddell Sea is dominated by semidiurnal tides (Padman et al., 2003).
Measurement of the ice response to regular tidal forcing provides an opportunity to investigate ice material properties in situ and the focus here is on properties within a floating shear margin. Shear stresses arising at lateral boundaries result in ice deformation (Jackson and Kamb, 1997; van der Veen et al., 2007; Bondzio et al., 2017) that modifies ice physical properties (e.g., crystal preferred orientation, grain size, temperature) (Harrison et al., 1998; Perol and Rice, 2015; Minchew et al., 2018) and those modifications, in turn, can enhance deformation rates (Patrick et al., 2003; van der Veen et al., 2007; Gerbi et al., 2021). Field observations (e.g., Vaughan, 1994, 1995; Hulbe et al., 2016) tend to focus on elastic bending across relatively accessible grounding zones. Modelling studies suggest that viscous deformation within shear margins may be tidally-modulated due to bending stresses and spatially variable due to the effects of deformation on ice properties (Schmeltz et al., 2002; Rosier and Gudmundsson, 2018). High-resolution field observations of these flow-regulating boundaries are therefore an important objective.
1.1 Objectives
This study examines the tidally modulated mechanics of the glacier-left, floating shear margin of Priestley Glacier (74.33° S, 163.36° E) in Terra Nova Bay, Antarctica (Figure 1). The study is motivated by high-resolution field observations of ice motion, collected to provide context for a shallow ice coring project (Thomas et al., 2021). Two different surveying techniques, satellite-signal based GNSS positioning and optical angle and distance measurements using a total station, are used to track a closely-spaced network of surveying markers installed on the exposed ice surface. Together the techniques allow us to observe motion in 3 dimensions at a precision required for useful single–season results. The observations include a GNSS time series of along-flow displacement (predominantly viscous), a GNSS time series of across-flow displacement (predominantly elastic), and a total station time series of across-flow bending (predominantly elastic). The observations span 18 days and include both neap and spring tides. We use a 2D finite-element dynamic elastic bending model to investigate the observed ice response to tidal forcing, and to consider the effects of both the lateral boundary condition and spatial variation in mechanical properties across the margin. These observations also allow a comparison of the precision of the two positioning techniques. While they are somewhat limited by that original intent, their high precision and relatively fine resolution in both space and time reveal details of the ice motion that are only likely to be recognised in in situ data of this type.
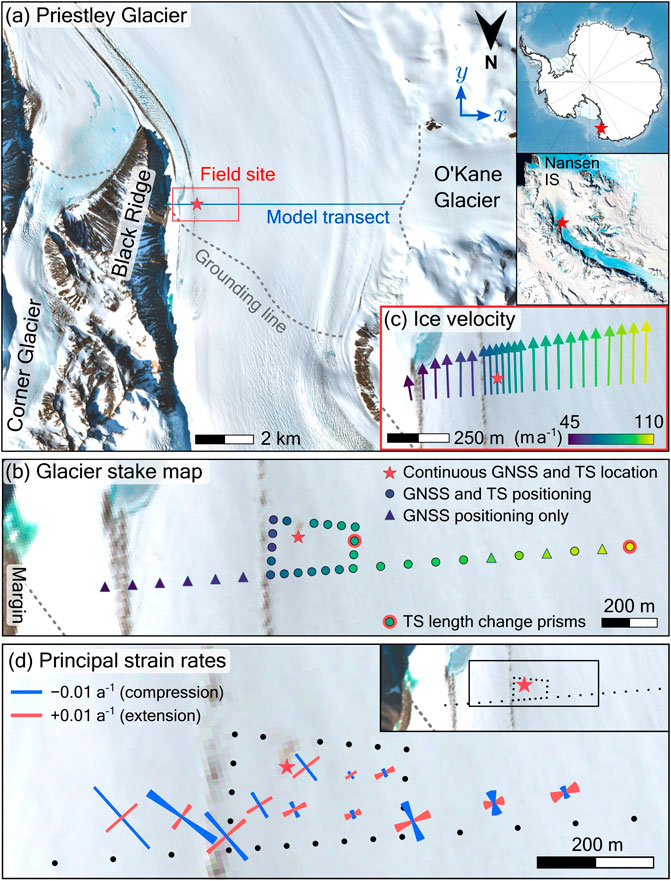
FIGURE 1. (A) Priestley Glacier’s left lateral shear margin and two nearby tributary glaciers (O’Kane and Corner Glaciers). The red star indicates the location of the GNSS receiver and total station (TS) installed to monitor tidally-forced variations in ice position. The basemap is a Sentinel-2, 10 m true colour composite image, courtesy of the European Space Agency. The approximate grounding line location (dashed line) is from Rignot et al. (2016) and the inset map is from the Landsat Image Mosaic of Antarctica (LIMA) (Bindschadler et al., 2008). (B) The locations of stakes installed across the shear margin. (C) The ice velocity gradient inferred with GNSS positioning. (D) Principal strain rates near the GNSS station and shallow ice coring site, computed from GNSS-observed ice velocities. The blue line denotes the maximum compressional strain rate and the red line denotes the maximum extensional strain rate. The error on the direction is 2σ.
1.2 Study Site
Priestley Glacier is a ∼100 km-long outlet glacier flowing southeast through the glaciated valleys of Victoria Land into the Nansen Ice Shelf in the Ross Sea region. The glacier drains Talos Dome and is representative of the numerous small outlet glaciers that drain the East Antarctic Ice Sheet. We focus on Priestley Glacier’s left lateral shear margin, 3 km downstream from the grounding zone, and 3 km upstream from the confluence of Priestley and Corner Glaciers at the tip of Black Ridge (Figure 1). The ridge rises with an average slope of 35° above horizontal adjacent to our field site. The 3-km-wide outlet of O’Kane Glacier, a steeply-sloping, 28-km-long tributary, is located directly across-stream from our field site (Figure 1).
The field site was chosen to permit safe operations, away from large shear margin crevasses. Nevertheless, numerous narrow cracks in the ice surface were observed. Horizontal ice velocity, measured using feature tracking of 10 m resolution Sentinel-2 image pairs acquired between November 2019 and December 2020 (Messerli and Grinsted, 2015), ranges from
The ice surface slopes downward slightly from our GNSS station site, in both the downstream direction and toward the nearby glacier margin (Supplementary Figure S1). Katabatic wind transport and melting remove surface snow, intermittently leaving an exposed blue ice surface in the summer. Meltwater ponds form along moraines and near accumulated debris, and surface streams near the Black Ridge margin transport water onto the Nansen Ice Shelf (Bell et al., 2017). The exposed ice surface makes it possible to safely collect ice cores in an active shear margin (Thomas et al., 2021) and to make a direct connection between survey marks and dense glacier ice, simplifying the interpretation of their displacement over tide cycles.
2 Observations
2.1 GNSS Record of Tidally-Forced Ice Motion
Horizontal and vertical displacement of the ice surface are observed with high temporal resolution using GNSS positioning. A dual-frequency Trimble R10 GNSS receiver was installed 950 m inboard from the glacier edge and ∼3 km downstream from the grounding line. The receiver was positioned 1.7 m above the ice surface and mounted on a tripod attached to three plastic surveying pegs drilled into the ice for stability. Observations were recorded at 15 s intervals between the 31st December 2019 and 18th January 2020. Processing the raw GNSS data with Trimble Business Center software (TBC) Version 5.4 involves a single baseline correction function using the stationary reference at Jang Bogo Station (Trimble NetR9), ∼30 km from the local Priestley Glacier GNSS station. This method achieves a precision (1σ) of 0.005 m (across-flow, x-component), 0.013 m (along-flow, y-component) and 0.025 m (vertical, z-component, relative to the WGS84 ellipsoid) (estimated from 500 consecutive measurements collected over 2 h). High-frequency noise is reduced by smoothing all three position time series with a simple six-hour moving average (Figure 2).
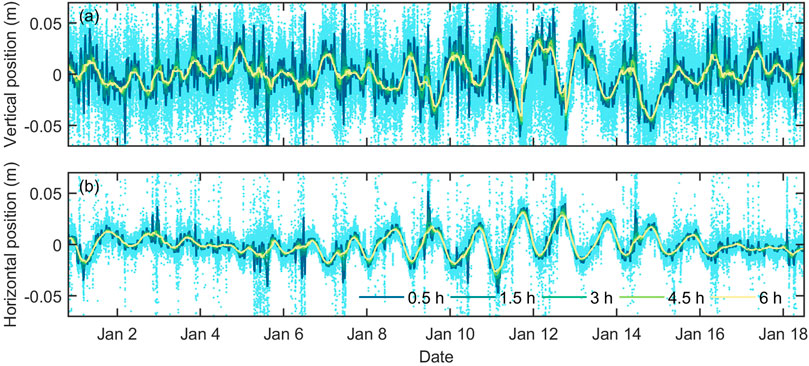
FIGURE 2. Raw and smoothed GNSS observations of the (A) vertical and (B) across-flow position of the local GNSS station. The effects of different smoothing windows (coloured lines) are shown. Negative horizontal (across-flow) distances indicate displacement toward the glacier margin, and positive distances indicate displacement toward the glacier centre.
2.2 GNSS Observations of Glacier Stake Displacements and Velocities
Ice velocities and strain rates are determined using repeated positioning of 19 stakes installed with 100 m spacing along a 2-km transect across the shear margin, and 18 stakes installed in a more compact loop around the ice core drilling site with 50 m spacing (Figure 1B). The eastern-most stake is ∼350 m from the glacier margin. Crevasses, meltwater pooling, and frequent rockfalls prevented the installation of stakes nearer to the glacier edge. The stakes are 40 mm square sections of uPVC, 1.8 m long, with 3/8 inch screws to attach either a surveying prism or a GNSS receiver. One metre deep holes were drilled into the ice with a 2 inch Kovacs auger. Glacier stakes were frozen in by filling the holes with a mixture of snow powder and water.
Ten GNSS stake surveys were completed between the 1st and 18th January 2020, a range that spans the full spring-neap tidal cycle. Across- and along-flow velocity components, vx and vy, are computed as the slope of the best linear least-squares fit for the displacement in the two directions, as a function of time t. Uncertainty in the velocity components computed using standard error propagation theory (Taylor, 1997, p. g., 181), ranged from ∼ 0.2 to 0.5 m a−1 (Supplementary Table S1). Strain rates are approximated as the horizontal gradient of the displacement rate v. The stake array is delineated into a network of triangles with a velocity vector at each vertex. Strain rates are then calculated for the centroid of each triangle following Cai et al. (2008) and Cardozo and Allmendinger (2009). The equations are provided in Supplementary Section S1.4.
2.3 Total Station Observations of Glacier Stake Displacements
The stake network (Figure 1B; Supplementary Figure S2) was resurveyed with a Trimble M3 total station every 1–2 days. This technique provides a very high precision measure of relative motion among the stakes that is independent of the GNSS method (Supplementary Section S1.3). Errors in relative velocities from total station observations are smaller overall than errors for the GNSS method though this depends on the network geometry (Supplementary Figure S3). Repeat total station positioning can also be used to calculate time-series distance changes between stakes, that is, surface compression and extension. Optical–electronic surveying is well suited to this task because total station slope distance observations have an uncertainty of less than 0.001 m (1σ) over lengths
2.4 Tide Model
The Circum-Antarctic Tidal Simulation (CATS2008) model (Howard et al., 2019; Erofeeva et al., 2020) is used to predict the tide cycle for the lower Priestley Glacier in January 2020. Tide constituents included in the model are M2, S2, N2, K2 (semidiurnal), K1, O1, P1, Q1 (diurnal), Mf (fortnightly), and Mm (monthly). Our field site is near the edge of the CATS2008 model domain, in a relatively narrow fjord with poorly known bathymetry that is represented with a uniform water column depth in the model (Supplementary Figure S4). At the inland edge of the tide model domain (the grounding line), a minimum water column depth of 100 m is imposed and freely-floating ice in hydrostatic equilibrium is assumed. The tide prediction is therefore more representative of the downstream Nansen Ice shelf region than the shear margin field site. While the CATS2008 model is likely to predict correct tidal phases, amplitudes may be overestimated.
3 Interpretation of Field Observations
3.1 Mean Ice Flow Pattern
Mean horizontal velocities from the survey stake network range from 45.59 ± 0.56 m a−1 at the outer-most stake to 110.26 ± 0.46 m a−1 at the inner-most stake (Figure 1). While surface conditions prevented the connection of the survey network to a fixed local reference, the shape of the velocity profile across the shear margin suggests that the ice speed at the valley sidewall is ∼0 m a−1 (Supplementary Section S3.2). In detail, however, the velocity profile is not consistent with uniform ice properties across the margin (Supplementary Figures S6, S7).
The overall horizontal strain field observed using our survey stake network (Figure 1D) is indicative of simple shear with a shear direction approximately parallel to the flow direction, and longitudinal compression, also in the flow direction. At the continuous GNSS location, the simple shear strain rate,
3.2 The Tidal Cycle
Tides in the Priestley Glacier and Nansen Ice Shelf region are predominantly diurnal (Figure 3A). The diurnal declinational tides K1 (23.93 h) and O1 (25.82 h) are the most energetic constituents with modelled amplitudes of 17 and 18 cm, respectively. On the spring tide, when K1 and O1 are in phase, the model-predicted maximum range (peak-to-peak) is 0.87 m. On the neap tide, however, when K1 and O1 are out of phase, a semidiurnal cycle is predicted (Figure 3A). M2 (12.42 h) and S2 (12.00 h) are the most energetic semidiurnal constituents, with predicted amplitudes of 0.06 and 0.04 cm, respectively. This predominately diurnal regime, with a transition to semidiurnal double peaks during the neap tide, is also observed fortnightly at the nearby open-ocean Jang Bogo Antarctic Research Station tide station (Byun and Hart, 2020) and at the Scott Base sea level monitoring tide gauge, 300 km south of Priestley Glacier (LINZ, 2021).
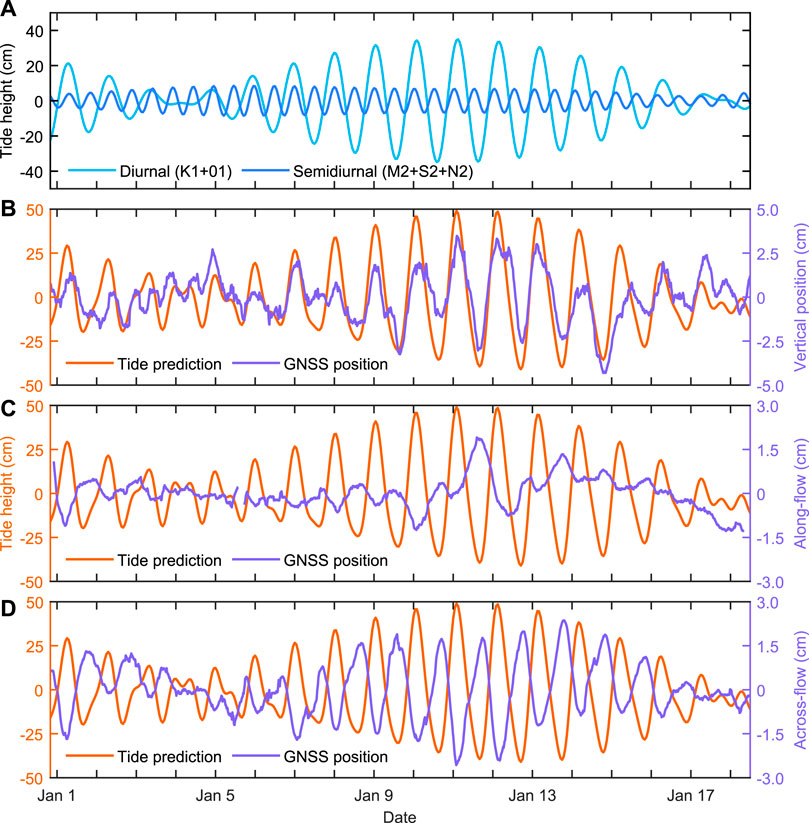
FIGURE 3. Panel (A) is the predicted diurnal and semidiurnal tides for Priestley Glacier. Note that the amplitude of the semidiurnal signal exceeds the diurnal signal during the neap tide (4th and 18th January). (B) is a comparison between the detrended surface elevation time series from GNSS positioning and the tide prediction. (C) is the detrended along-flow position with the mean displacement rate removed. Positive values indicate an increased rate of displacement in the downstream direction. (D) is the across-flow position with negative horizontal displacements indicating ice motion towards the glacier margin. Timestamps are in local time (UTC+13 h).
The tide prediction provides context for frequency content of the GNSS station position time series. The 18-days data set is too short to resolve the frequencies of individual tide constituents, however, both a higher amplitude diurnal frequency and a lower amplitude semidiurnal frequency are found in all three components of ice motion observed using GNSS (Figures 3, 4). The diurnal spectral peak is associated with the K1 and O1 constituents, and the semidiurnal peak is associated with the M2 and S2 constituents (Figure 4). Features of the individual GNSS time series and their apparent relationship to the tide are considered in the next sections.
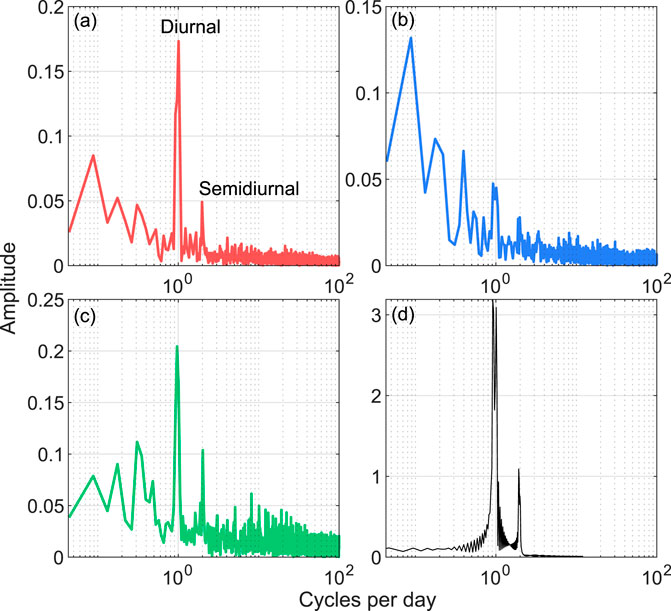
FIGURE 4. Spectra of the raw GNSS station time series and the modelled tide, computed using the MATLAB fast Fourier transform algorithm. Panel (A) is the across-flow position, (B) is the along-flow position, (C) is the vertical position, and (D) is the tide prediction.
3.3 Time Series of Vertical Ice Motion
The observed vertical motion is predominantly diurnal with an amplitude that reflects the phase of the spring-neap tidal cycle (Figure 3B). The semidiurnal signal is most apparent during the neap tide, when the diurnal constituents K1 and O1 are perfectly out of phase. During this time (1–5 January), the semidiurnal tide constituents are responsible for frequency doubling in the GNSS elevation time series. From January 6 onward, the phase shift between K1 and O1 diminishes, the two components synchronise to form the spring tide and the larger amplitude, diurnal signal dominates. Error in the vertical position from GNSS is 0.025 m, on the same order as the signal amplitude. While their amplitudes vary, the phases of the tide prediction and observed vertical position agree well.
3.4 Time Series of Horizontal Ice Motion
The observed horizontal ice motion is tidally-modulated (Figures 3C,D, 5). In the along-flow direction, downstream displacement at the local GNSS station site is larger at low tide and smaller at high tide, and therefore, ice velocity is largest during the falling tide. This pattern is most clear during the spring-tide but is evident throughout the time series. Only one clear velocity maximum is observed per diurnal tide cycle, with no evidence of velocity peaks at a semidiurnal frequency. Maximum amplitudes of the along-flow velocity variations are 28 m a−1, ±32% of the mean speed (Figure 5). In the across-flow direction, the ice surface at the local GNSS station is displaced towards the valley sidewall during the high tide, and toward the glacier centre during the low tide.
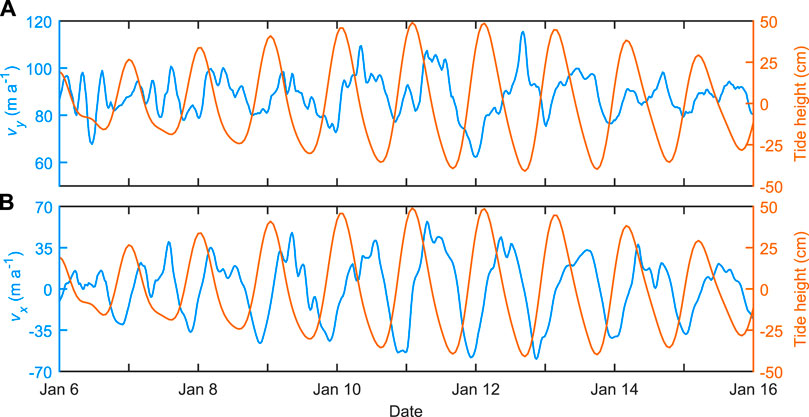
FIGURE 5. (A) Along-flow vy and (B) across-flow vx ice velocity from GNSS positioning. Negative vx indicates ice motion toward the glacier margin and positive vx indicates ice motion toward the glacier centre.
3.5 Surface Strain
Continuous slope–distance observations between the GNSS station position and other survey stakes were obtained with the total station from 14 to 18 January. Because the stakes are frozen into the ice, these observations can be reliably used to calculate surface strain of the ice layer as it flexes in response to the tide. Slope-distance measurements made with the total station have the fine precision and small uncertainty required to detect the surface strain while its cumulative effect is manifest as motion relative to the valley sidewall in the GNSS time series.
The ice surface experiences extension during high tide and compression during low tide near the local GNSS station, ∼950 m inboard of the valley sidewall (Figure 6). At high tide, the magnitude of the across-flow lengthening is 10.1 ± 0.4 mm over a 200 m line centre-ward of the GNSS station, a strain of 4.9 × 10⁻⁵ ± 0.2 × 10⁻⁵, and 14.4 ± 0.8 mm over the 1,200 m distance from the GNSS station to the end of the survey stake line (Figure 1B), a strain of 1.2 × 10⁻⁵ ± 0.1 × 10⁻⁵. Similar magnitude shortening is observed at low tide. The complete time series spans a transition from spring to neap tide and both diurnal and semi-diurnal patterns appear in the strain time series (Figure 6). The frequencies of the strain and tide prediction do not agree during the neap tide, which may be due to limitations in the tide prediction discussed earlier.
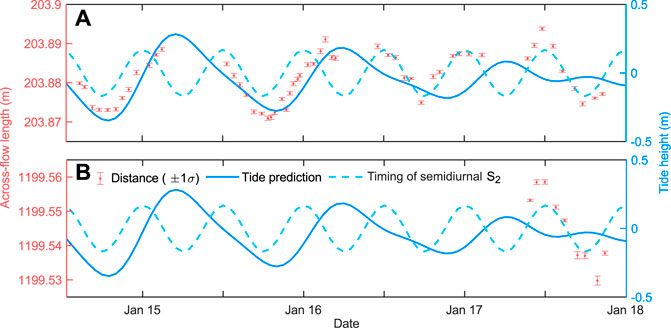
FIGURE 6. Total station slope-distance observations of an across-flow line. Panels (A) and (B) are the 200 and 1,200 m across-glacier surveying transects, respectively. Error bars (1σ) are computed from 15 repeated measurements of stake position. Time variation in the slope-distance across the margin is a measure of the tidally-induced ice deformation.
The observed transverse motion and strains are due to flexure in the across-flow direction on the rising and falling tide. Considering the across-flow profile as a simple beam fixed to the valley sidewall, the rising tide should drive a flexure profile that is concave up near the margin and convex up toward the centre of the glacier, with bending stresses that are compressive and extensional, respectively, at the upper surface. The pattern reverses on the falling tide. The positive extensional strain observed at the local GNSS station during the rising tide indicates that the GNSS station is center-ward of the transition from concave to convex. The smaller strain obtained along a line extending farther toward the centre of the glacier implies that the shorter line was across a zone of locally maximum extension, either due to the flexure profile or spatially heterogeneous ice stiffness. In the next section, a beam bending model is used to interpret the observed motion and strain in terms of boundary conditions and material properties.
4 Ice Flexure Model
We use an elastodynamic model (Bleyer, 2018) to examine the continuous bending motion of the ice layer in response to tide forcing (i.e., changes in water pressure at the ice base). Linear elastic models are appropriate for simulating response to shorter tidal frequencies (e.g., semidiurnal and diurnal) (Vaughan, 1995; Marsh et al., 2014; Rack et al., 2017; Rosier et al., 2017). Viscoelastic models also account for the non-linear viscous flow that dominates longer–timescale deformation, including tidal perturbations to boundary conditions, and grounding line position (Gudmundsson, 2011; Walker et al., 2014; Wild et al., 2017; Rosier and Gudmundsson, 2020). Of relevance to our shear margin field site, Rosier and Gudmundsson (2018) and Drews et al. (2021) use a numerical model to show that flexural stresses within margins may enhance horizontal motion via perturbation to the effective margin softness on both the high and low tides, resulting in a double velocity peak per diurnal tide cycle. This predicted frequency doubling is not observed in our GNSS data. All together, a relatively simple elastodynamic model is consistent with both what we observe in the GNSS time series and the available data, which is largely 2D, aligned across-flow.
4.1 Model Set-Up
The floating cross-section of Priestley Glacier is represented as a 2D (x, z) isotropic linear elastic medium with varying thickness H (Supplementary Figures S1, S5). The field site is floating throughout the tidal cycle and the observed ∂vy/∂x suggests that the nearby boundary between ice and valley sidewall is no-slip. This is a generalised plane strain problem with fixed lateral boundaries, which can be simplified to a real plane strain by removing out-of-plane strains and in-plane dependencies.
The finite element computational software FEniCS (Alnæs et al., 2015) is used to solve for the unknown 2D displacement vector u associated with the tidal cycle. The governing equations for the linear elastic deformation of a medium Ω are
where σ is the stress tensor, f is the body force per unit volume, λ and μ are the Lamé coefficients, ϵ is the strain tensor and u is the displacement vector field. The Lamé coefficients are
where E is the Young’s modulus and ν is Poisson’s ratio (0.3).
Time discretisation using the generalised alpha method (Erlicher et al., 2002) is introduced to solve for the unknown elastic dynamic displacement with zero damping following Bleyer (2018). A Robin-type boundary condition imposes pressure perturbations to the mean tide on the underside of the ice layer, and Dirichlet boundary conditions of zero displacement are imposed at the left and right boundaries.
The effects of gravity and the supporting seawater pressure on the ice can be represented in different ways and this has implications for model initialisation. If gravitational pull on the elastic domain is included, domain deflection associated with compression due to the ice overburden and mismatch between domain shape and true hydrostatic equilibrium must be estimated. Displacements and stresses due to tidal motion are then found by subtracting this initial “compression solution” from models forced by different tide heights. A simpler approach, which we use here, is to neglect gravity, assuming the domain is already in hydrostatic equilibrium, and use pressure perturbations to the mean-tide as a forcing. The two approaches yield solutions with differences several orders of magnitude smaller than the displacements themselves, but the latter avoids small mismatches from the compression step and is a true plane strain problem.
4.2 Experiment Design
The model domain represents an across-flow section across the full 9 km width of the glacier at the study site. Surface elevation and ice thickness are from the MEaSUREs BedMachine v2 Antarctica compilation (Morlighem et al., 2020). Roving GNSS observations along the stake network agree with the BedMachine surface elevation (Supplementary Figure S1). Mean sea level is at z = 0 m. The simplest lateral boundary conditions are fully fixed, with zero displacement along the full ice thickness at the sidewall ice/rock contact. Such conditions, and several cases with partial or additional contact are examined.
Elastic properties of the ice layer are described by the elastic modulus (Young’s modulus) E and Poisson’s ratio ν. The value ν = 0.3 is standard for isotropic polycrystalline ice (Gammon et al., 1983a), while values of E reported in the literature range across two orders of magnitude. Very small strain measurements of synthetic isotropic ice, made at high frequency, give E = ∼ 9 GPa (Gold, 1958; Gammon et al., 1983b; Vaughan et al., 2016). Values of E calculated from ultrasonic and seismic velocities of natural ice (Bentley, 1972; Kohnen and Gow, 1979; Hellmann et al., 2021) are also on the order of 9 GPa at these high frequencies, and seismic velocities at the Priestley Glacier site give a similar value (Lutz et al., 2022). McCarthy and Cooper (2016) show that measured E values reduce with frequency, down to values more than an order of magnitude lower at tidal frequencies. Indeed, inversions of tidal flexure field data span a range of values from E = ∼ 9 GPa to an order of magnitude lower. An inversion of data from a stagnant and cyclically worked ice sheet grounding line (Hulbe et al., 2016) gives much lower apparent values of ∼0.05 GPa. The continuous GNSS record is used here to infer an apparent elastic modulus for the Priestley Glacier shear zone site.
The elastic beam model is used to simulate the tidally-forced flexure of Priestley Glacier over the 18 days of our field observations with a timestep of 15 min. The time period spans a spring–neap tidal cycle. Neither the lateral boundary condition nor the elastic modulus is known independently of the observed motion and as discussed above, the modelled tide amplitude is most appropriate downstream, on the Nansen Ice Shelf. To manage these limitations, the model experiments begin with a reference case (experiment ‘M1’), using fully coupled lateral boundaries and a uniform elastic modulus E. A root-mean square best fit between observed and simulated across-flow x and vertical z motion at the local GNSS station is used to calibrate E and the tide forcing (Supplementary Section 3.3). This provides a sense of scale for both. The continuous total station measurements of across-flow strain (Figure 6) provide an independent measure against which to evaluate model performance and consider alternative conditions.
While the GNSS-observed velocity transect indicates that some part of the sidewall boundary contact is fully coupled, this observation alone does not reveal the depth to which the coupling extends. If, for example, the coupling is shallow only, the sloping sidewall would, on the rising tide, allow a wedge of water to lift the ice closer to the margin than in the fully-coupled case, and thereby shift the location of maximum curvature—on the rising tide—toward the sidewall. Alternatively, if part of the margin is grounded on the seabed, vertical motion in response to the tide would be damped and flexure would extend over a longer distance inboard from the sidewall.
To examine these possibilities, model experiments “M2_partial” and “M3_grounded” reduce and extend the fixed portion of the boundary (Table 1). In “M2_partial”, the upper 400 m of the boundary is fixed while a no contact boundary condition is specified below that depth. In the “M3_grounded” case, additional grounding is simulated by fixing the ice along a 350 m wide section of the seafloor adjacent to the margin. In all cases, the right lateral boundary is fixed at the observed O’Kane Glacier grounding line. In the real system, bending must extend upstream of the grounding line (Sayag and Worster, 2011), however, we have no observations of vertical motion from the O’Kane Glacier outlet. The net effect is that the width of the model domain may be slightly underestimated.
Lacking better information, elastic descriptions of ice bending typically assume that E is spatially uniform. Experiments show that both grain size and crystal fabrics are modified by shear deformation (Bouchez and Duval, 1982; Journaux et al., 2019; Qi et al., 2019) and natural ice shear zones (Hudleston, 1977; Jackson and Kamb, 1997; Monz et al., 2021), including the Priestley Glacier shear margin (Thomas et al., 2021) have crystal fabrics consistent with the experiments. Shear deformation can also increase ice temperature (Echelmeyer et al., 1994; Perol and Rice, 2015; Hunter et al., 2021) and there is some evidence from experiments (Golding et al., 2010) and natural ice shear zones (Harrison et al., 1998) that this occurs, potentially giving rise to temperate ice (Meyer and Minchew, 2018). Qualitatively, the spacing of fractures observed at the ice surface increases across the shear zone, with distance from the ice edge. All together, these effects suggest that ice stiffness may not be uniform across the glacier.
Three model experiments allow for horizontal variation in ice stiffness by decreasing E within the shear margin and increasing E in the glacier trunk, relative to the reference ‘M1’ (Table 1). The relatively soft band is narrower in the M4_stiffness case (1,000 m wide) than in the other cases (1,400 m wide). The values of E used here fall within the range of apparent elastic moduli previously inferred by fitting beam bending models to observed flexure zones (e.g., Vaughan, 1995; Hulbe et al., 2016; Rack et al., 2017; Wild et al., 2017). Two additional experiments, ‘M7_both’ and ‘M8_both’ are combinations of spatially variable E and alternative boundary contact situations.
5 Model Results
5.1 Reference Model With Homogeneous Ice Properties
Model experiment M1 is used to calibrate the tidal forcing and the uniform reference value of E (Supplementary Tables S6, S7). Using the tide prediction from the CATS2008 model as a starting point, the best overall match between observed and simulated motion in the vertical direction is found when E = 4 GPa and the tide forcing is scaled by 0.75 (Figure 7).
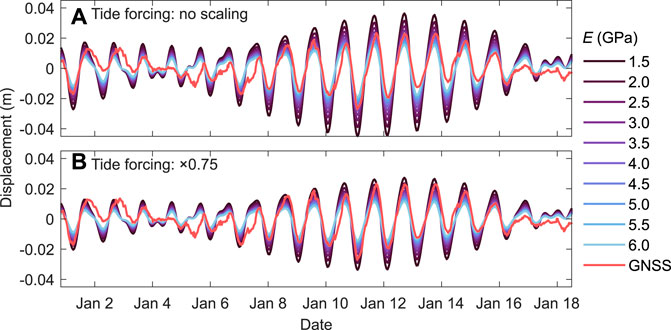
FIGURE 7. Modelled versus GNSS–observed horizontal (across-flow) displacement. In (A), no scaling is applied to the tide prediction. In (B), the ice flexure model is forced by the CATS2008 tide prediction, scaled by ×0.75 to account for our proximity to the grounding line and glacier margin.
While the reference model produced a good match to motion at the local GNSS station site (Figure 7), surface strains computed along the modelled ice surface are inconsistent with observed strains (4.9 ± 0.2 × 10⁻⁵ versus −5.0 × 10⁻⁶, respectively, along the 200 m line centre-ward of the GNSS station). At high tide, the modelled transition from surface compression to extension occurs far inboard of the GNSS station location (Figure 8, M1). Put another way, the radius of curvature is too large and as a result, high tide in the model generates surface compression at the GNSS station site and low tide generates surface extension (Figure 8). Total station strain observations indicate the reverse pattern with surface extension observed on the diurnal rising tide (Figure 6). To correct this mismatch, the site of maximum compression (maximum convex-up curvature) must be shifted toward the valley sidewall so that extension is experienced on the rising tide, at the local GNSS station site. This implies that either the sidewall boundary condition or the assumption of uniform E is incorrect.
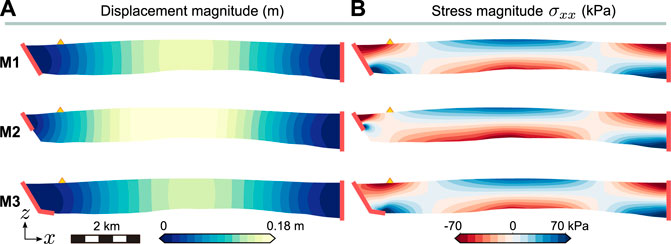
FIGURE 8. Upward bending of the ice layer for three different left lateral boundary conditions. M1 is the reference model, M2 has a partially fixed left boundary and M3 represents additional grounding on the seafloor. The first column shows the displacement magnitude and the second column is the transverse (across-flow) component of the stress tensor. Negative stresses are compressive and positive stresses are tensile. The tide forcing is +37 cm, representing the scaled spring high tide. All experiments have a uniform Young’s modulus of E = 4 GPa. Opposite downward bending of the ice layer is shown in Supplementary Section 3.4.
5.2 Left Lateral Boundary Condition
The partial contact boundary condition (M2) shifts the centre of curvature toward the valley sidewall. This condition focuses the transverse bending stress σxx in a narrower zone with a larger magnitude, relative to the reference model (Figure 8), improving simulation of the observed surface strain. However, both vertical and horizontal motion are overestimated for the rising tide (Figure 9).
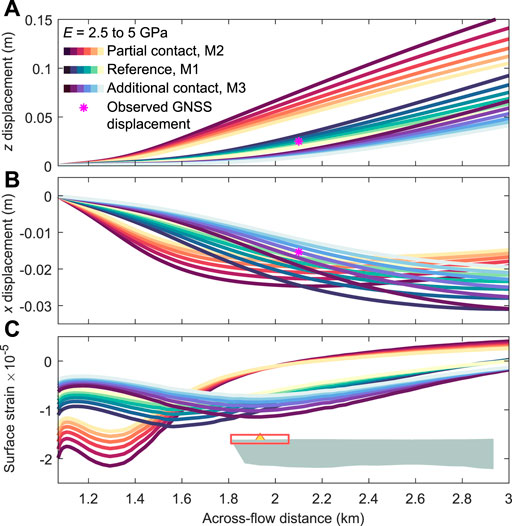
FIGURE 9. Panel (A) is the vertical component z of the ice surface displacement for each of the three margin boundary conditions and a range of apparent Young’s modulus values (E = 2.5–5 GPa, dark to light shading, respectively). Panel (B) is the horizontal component x of the ice surface displacement, with negative displacements indicating motion toward the margin. Panel (C) is the surface strain (engineering strain) computed for each model element at the ice surface. The tide forcing applied to generate the upward deflection in this example is the spring high tide (+37 cm). The red inset box indicates the section of the glacier surface shown in each plot. Opposite downward bending of the ice layer is shown in Supplementary Section 3.4.
The additional grounding condition (M3) shifts the centre of curvature away from the valley sidewall. This distributes σxx over a wider zone and decreases its magnitude, and reduces vertical motion at the local GNSS station site. While the latter consequence provides an alternative explanation for the scaling we applied to the tidal forcing, the strain observations are not reproduced, and indeed, the result is poorer than the reference case.
5.3 Spatially Variable Ice Stiffness
Softening the shear margin by reducing E focuses compression and shifts the convex/concave transition closer to the valley sidewall (M4, M5, and M6 in Figure 10). Shifting the boundary between relatively softer and stiffer ice engages more or less of the margin in the compressive, convex-up part of the flexure profile (M5 versus M4). Grounding under the margin damps this effect (M7) while partial sidewall decoupling intensifies it and shifts the convex/concave transition even closer to the valley sidewall (M8). These modifications also affect horizontal and vertical motion (Figure 11). All together, the best comparison is obtained when the transition in E is near the site of the local GNSS station (Figure 12). More complicated patterns of variation in the apparent Young’s modulus may improve the result, however, additional strain observations would be required to justify additional model experiments.
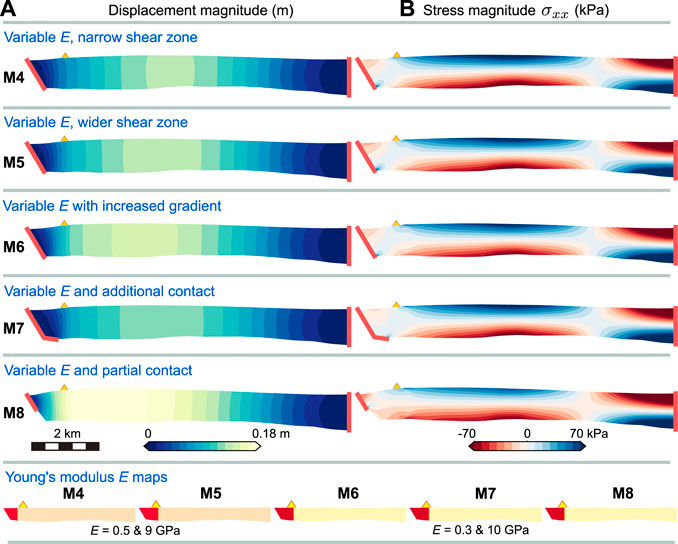
FIGURE 10. Upward deflection of the ice layer for five experiments with spatially variable E across the shear margin. The first column shows the displacement magnitude and the second column is the transverse (across-flow) component of the stress tensor. Negative stresses are compressive and positive stresses are tensile. Opposite downward bending of the ice layer is shown in Supplementary Section 3.4.
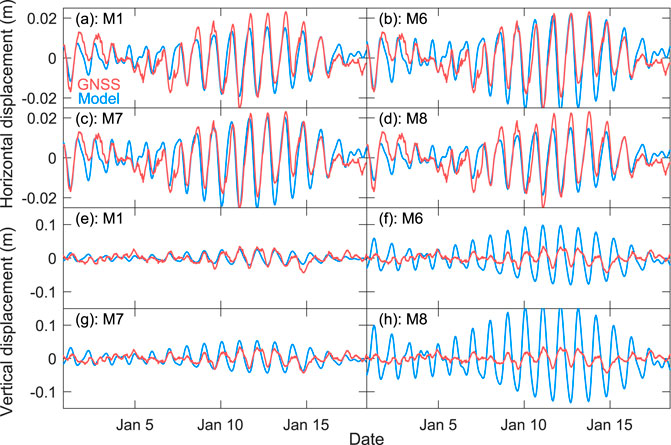
FIGURE 11. Modelled versus GNSS–observed horizontal (across-flow) and vertical displacement for experiments M1, M6, M7, and M8.
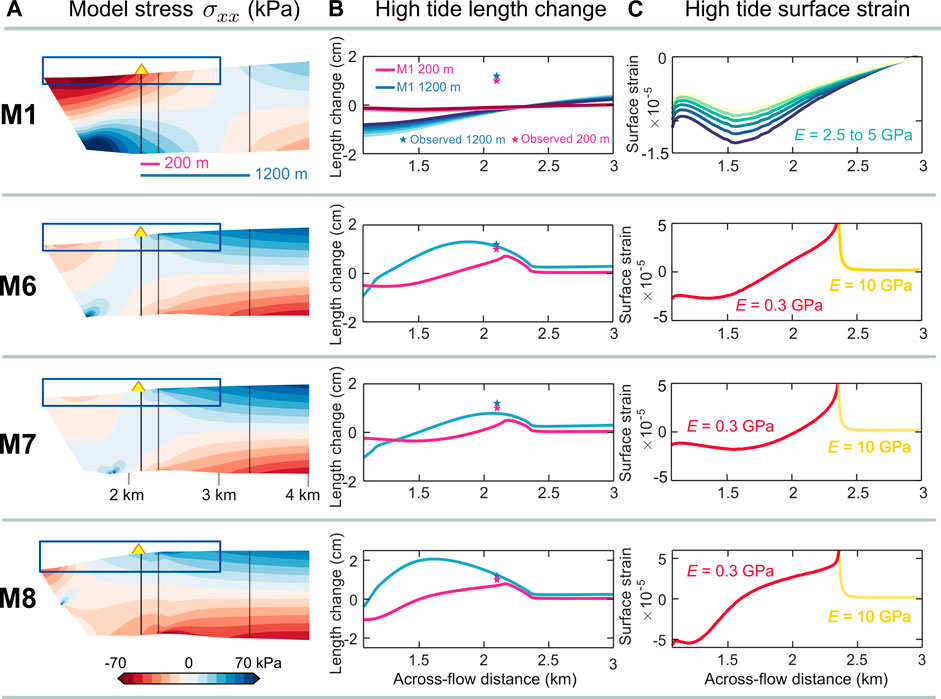
FIGURE 12. Column (A) inset boxes show the section of the ice surface plotted in (B) and (C). Column (B) shows the surface extension/compression associated with an upward deflection over 200 and 1,200 m transects. At the location of the field camp, the observed length change (surface extension) is +1.0 and +1.2 cm (indicated by the stars). The modelled length change is computed for 200 and 1,200 m segments, moving along the ice surface at 10 m increments. Column (C) shows the pattern of across-flow surface strain, computed for each model element along the ice surface. In (C), the transition from compression (negative) to extension (positive) corresponds to the location of the positive/negative transition in the contour maps in column (A). In (B) the location of the transition also depends on the length scale of the strain measurement.
6 Discussion
The vertical and across-flow motion observed across Priestley Glacier’s floating shear margin is in phase with the CATS2008 model tide prediction while the along-flow velocity is out of phase. The in-plane motion is well described as a linear elastic response to forcing by the ocean tide. Periodic compression due to tidally-modulated discharge from O’Kane Glacier (across from the study site) may also account for the observed in-plane motion, however, in that case we would expect maximum compression and motion toward the margin during the falling tide, which is not observed.
Bending stresses have been proposed as a mechanism to explain tidally-paced variation in along-flow velocity (Rosier and Gudmundsson, 2018, 2020; Drews et al., 2021). This ‘flexural softening’ mechanism works by reducing the effective viscosity of ice near the margin. As simulated by Rosier and Gudmundsson (2018), floating ice subject to this mechanism experiences velocity maxima at maximum bending on both high and low tides, when bending stresses are at their largest. With only one velocity maximum per tide cycle, during the falling tide, there is no indication of this effect at the Priestley Glacier study site.
Different estimates of the elastic modulus will result in different estimates of bending stresses in the model shear margin. The maximum depth-averaged σxx amplitude, calculated from the neutral line to a free surface, produced in our bending models is 60 kPa in the uniform-E experiment M1 and 10 kPa in the spatially-varying E experiment M5 (Figures 8, 10). The heterogeneous ice properties case thus implies a factor of six smaller σxx than would be obtained using the assumption of uniform E. This result suggests caution in how elastic properties are inferred using bending models. It also reduces the contribution that bending stresses could make to the flexural softening mechanism proposed by Rosier and Gudmundsson (2018).
The vertical extent of sidewall coupling modifies elastic deformation in both the horizontal and vertical dimensions in our simulations. For example, during high tide, shallower sidewall coupling (M2) increases and focuses the bending stress magnitude at the upper surface while limiting the depth to which the intensification extends. The pattern would revert to a fully coupled situation (M1, with opposite signs) on the falling tide. In-plane motion is also enhanced, on the rising tide. In this way, different coupling situations give rise to different patterns of surface strain and vertical motion that could be used to deduce the extent of sidewall coupling at any tidally modulated ice-shelf margin. The data available for the present study are limited by the original purpose of the survey network, but more complete investigations would be straightforward, provided observations with precision similar to the total station are available.
The relatively low value of the apparent Young’s modulus implied by observed deformation within the shear margin (an order of magnitude lower than the laboratory value for isotropic ice), and the heterogeneity implied by the model experiments, require explanation. Cryo-EBSD analysis of the microstructure of ice core samples from the centre of the survey network (Figure 1, red star) found a very strong fabric with c-axes oriented perpendicular to the margin, as expected (e.g., Jackson and Kamb, 1997; Monz et al., 2021), and grain sizes of ∼1 mm (Thomas et al., 2021). This is unexpected: grain size during creep corresponds to differential stress (Kohlstedt and Weathers, 1980; Derby, 1991; Cross et al., 2017) and the piezometer relationship for ice (Jacka and June 1994) indicates that recrystallisation to 1 mm requires an octahedral stress magnitude of ∼0.4 MPa. This would be a peak stress magnitude, as grain size responds more rapidly to increasing rather than decreasing stresses (Cross et al., 2015). The only comparative data for grain size collected from a polar, cold ice, lateral shear margin setting, are from Jackson and Kamb (1997), although we note that similar, shear margin, temperate ice samples have been examined by Gerbi et al. (2021) (mean englacial temperature, − 2°C) and Monz et al. (2021) (margin ice temperature, − 4°C). Jackson and Kamb (1997) observed grain sizes of ∼5 mm, corresponding to octahedral shear stresses of 0.2 MPa in the Whillans Ice Stream (WIS) shear margin. The WIS samples are from a grounded shear zone with larger shear strain rate and colder temperature than the Priestley Glacier case (WIS: ∼0.14 a−1, −24°C; PG: 0.019 a−1, −19°C). Given these conditions, we would expect grain sizes to be coarser in the Priestley Glacier margin than at WIS, but they are not. The grain sizes and shapes are inconsistent with simple shear (Thomas et al., 2021) and imply larger stresses in the shear zone than can be explained by viscous deformation alone. On this basis, we speculate that flexural deformation in the floating margin must influence dynamic recrystallisation processes and control grain size and shape in the margin.
The observational evidence shows only that tidally forced flexural deformation is larger than can be explained by the laboratory value for E. However, the deformation may not be purely elastic. Both grain boundary sliding and basal glide are recognised as anelastic attenuation mechanisms in ice (Kuroiwa, 1964). Finer grain sizes would promote weakening, and the strong alignments of ice basal planes parallel to the shear margin (Thomas et al., 2021) would allow shearing on vertical planes that could accommodate flexural bending. Neither grain boundary sliding nor basal slip can operate in isolation (Ashby, 1972; Goldsby and Kohlstedt, 1997, 2001; Langdon, 2006) but can operate simultaneously, so it could be the combination of these mechanisms that facilitates weakening of the shear margin.
Two independent surveying methods, GNSS and total-station positioning (an optical technique), were used to monitor the horizontal and vertical position of the ice surface. Both methods resolved the pattern of velocity across Priestley Glacier’s shear margin within the two-week field campaign. However, they are characterised by different uncertainties and this affects the derived quantities that are of primary interest here. GNSS errors vary by an order of magnitude over diurnal cycles. 2σ standard deviations range from ±0.005 m in the horizontal and ±0.019 m in the vertical (6 h starting at 16:00 on 4 January) and ±0.062 m in the horizontal and ±0.12 m in the vertical (6 h starting at 08:00 on 14 January). Propagated errors on the stake velocities are smaller overall for total-station positioning than for the more commonly used GNSS positioning method (Supplementary Figure S3) and this can result in smaller errors on strain rates computed from velocities (Supplementary Tables S4, S5). During the neap tide, when the modelled minimum ocean tide amplitude is ∼0.05 m (and observed amplitude of vertical displacement is 0.005 m), variations in ice velocity are difficult to detect with GNSS positioning because noise obscures the signal of fastest (slowest) velocities with the falling (rising) tide. We encourage the use of optical electronic surveying instruments (e.g., robotic total stations) to complement the conventional GNSS positioning used in studies of ice mechanics.
7 Conclusion
Our unusual study site, a floating shear margin with exposed blue ice and safe field conditions, allowed us to observe 3D motion and deformation with very fine precision. Coupling survey marks directly to the ice ensured that the observed strains represented deformation directly. Our precise positioning methods allowed us to resolve the velocity gradient and strain across the margin within a time frame of 2 weeks, with no return to the field required. Long-term horizontal shear strain rates in the central part of our survey network are on the order of 10−2a−1 and the inferred effective stress (the second invariant of the deviatoric stress tensor) is ∼160 kPa.
Together, the total station and GNSS observations reveal heterogeneity in deformation across the shear margin over relatively short spatial scales. When such heterogeneity exists, the spatial scale at which ice displacement is observed will affect the inference of ice properties. In the present work, high-precision optical measurements of strain over two different length scales (200 and 1,200 m) allowed us to consider curvature in some detail and deduce that bending and deformation must be focused within a relatively narrow zone of the shear margin. If the present study had relied on the vertical component of the GNSS observations alone, the assumption of uniform mechanical properties would have sufficed and the apparent Young’s modulus would have differed from the value constrained from our more detailed observations of vertical motion and horizontal strain.
Priestley Glacier’s shear margin experiences velocity variations of up to 32% of the mean speed despite the relatively small-amplitude tidal cycle. We observe one peak in the downstream velocity per tide cycle, on the falling tide. Across flow, the ice at our study site moves toward (away from) the valley sidewall on the rising (falling) tide as a result of flexure across the margin. Semidiurnal variations in both vertical and horizontal motion become apparent during the neap tide and the same relationships between motion and tide forcing observed during the spring tide apply.
A range of mechanisms have been proposed to explain variation in ice shelf motion at ocean-tide frequencies. These include the tidal modulation of grounded ice stream/glacier flow, transmitted both upstream and downstream (Thompson et al., 2014; Walker et al., 2014; Minchew et al., 2017), changes in the degree of contact with lateral margins and pinning points (Heinert and Riedel, 2007; Robel et al., 2017), and variations in the effective stress and effective viscosity of shear margins (Rosier and Gudmundsson, 2018, 2020). We have no observational evidence of a change in either margin contact or effective viscosity across repeated tide cycles and conclude instead that the along-flow variation is more likely due to changes in flow of the grounded part of Priestley Glacier.
The simple linear elastic bending model describes the tidally-forced vertical and across-flow motion of Priestley Glacier’s left shear margin. While the observed vertical motion could be adequately described by uniform elastic properties of the ice, across-flow deformation, observed with very high precision over different length scales, cannot. This conclusion points to the usefulness of precise, high resolution observations of motion in 3 dimensions for ice mechanics studies of this kind. The observed deformation implies a spatially variable ice stiffness, with relatively deformable ice in the shear margin, relatively stiff ice in the central part of the floating glacier, and a sharp transition between the two. This implies that the elastic modulus is spatially variable, and lower than the laboratory value in the shear margin. Connecting these results with analyses of ice cores collected at the study site, we propose that grain size reduction and c-axis alignment within the relatively rapidly deforming margin are responsible for the implied softening of the margin.
Data Availability Statement
The original contributions presented in the study are included in the Supplementary Material. Further inquiries can be directed to the corresponding author.
Author Contributions
HS, CH, and DJP: experiment design. HS and MHB: data collection. MF: model development. HS, CH, and MF: data analysis. HS and CH: manuscript writing. BB: logistics and safety planning. DJP, MHB, BB, LC, DK, RM, FL, and RET: fieldwork support.
Funding
This work is supported by the Marsden Fund (grant number UOO052) and a University of Otago Research Grant. HS is supported by a University of Otago Doctoral Scholarship and the Antarctica New Zealand and New Zealand Antarctic Research Institute Doctoral Scholarship. DK is supported by the Korea Polar Research Institute (KOPRI) project 22100.
Conflict of Interest
The authors declare that the research was conducted in the absence of any commercial or financial relationships that could be construed as a potential conflict of interest.
Publisher’s Note
All claims expressed in this article are solely those of the authors and do not necessarily represent those of their affiliated organizations, or those of the publisher, the editors and the reviewers. Any product that may be evaluated in this article, or claim that may be made by its manufacturer, is not guaranteed or endorsed by the publisher.
Acknowledgments
We are thankful for field and logistics support from Antarctica New Zealand and the staff at Scott Base, Mario Zucchelli Station, and Jang Bogo Station. We would also like to thank the two reviewers and the editor for their time and thoughtful feedback.
Supplementary Material
The Supplementary Material for this article can be found online at: https://www.frontiersin.org/articles/10.3389/feart.2022.828313/full#supplementary-material
References
Alley, K. E., Scambos, T. A., Alley, R. B., and Holschuh, N. (2019). Troughs Developed in Ice-Stream Shear Margins Precondition Ice Shelves for Ocean-Driven Breakup. Sci. Adv. 5, eaax2215. doi:10.1126/sciadv.aax2215
Alnæs, M. S., Blechta, J., Hake, J., Johansson, A., Kehlet, B., Logg, A., et al. (2015). The FEniCS Project Version 1.5. Arch. Num. Soft. 3, 9–23. doi:10.11588/ans.2015.100.20553
Anandakrishnan, S., Voigt, D. E., Alley, R. B., and King, M. A. (2003). Ice Stream D Flow Speed Is Strongly Modulated by the Tide Beneath the Ross Ice Shelf. Geophys. Res. Lett. 30, 1361. doi:10.1029/2002GL016329
Ashby, M. F. (1972). Boundary Defects, and Atomistic Aspects of Boundary Sliding and Diffusional Creep. Surf. Sci. 31, 498–542. doi:10.1016/0039-6028(72)90273-7
Bell, R. E., Chu, W., Kingslake, J., Das, I., Tedesco, M., Tinto, K. J., et al. (2017). Antarctic Ice Shelf Potentially Stabilized by Export of Meltwater in Surface River. Nature 544, 344–348. doi:10.1038/nature22048
Bentley, C. R. (1972). Seismic-Wave Velocities in Anisotropic Ice: A Comparison of Measured and Calculated Values in and Around the Deep Drill Hole at Byrd Station, Antarctica. J. Geophys. Res. 77, 4406–4420. doi:10.1029/jb077i023p04406
Bindschadler, R. A., Vornberger, P. L., King, M. A., and Padman, L. (2003). Tidally Driven Stick-Slip Motion in the Mouth of Whillans Ice Stream, Antarctica. Ann. Glaciol. 36, 263–272. doi:10.3189/172756403781816284
Bindschadler, R., Vornberger, P., Fleming, A., Fox, A., Mullins, J., Binnie, D., et al. (2008). The Landsat Image Mosaic of Antarctica. Remote Sensing Environ. 112, 4214–4226. doi:10.1016/j.rse.2008.07.006
Bleyer, J. (2018). Numerical Tours of Computational Mechanics with FEniCS. Zenodo. doi:10.5281/zenodo.1287832
Bondzio, J. H., Morlighem, M., Seroussi, H., Kleiner, T., Rückamp, M., Mouginot, J., et al. (2017). The Mechanisms Behind Jakobshavn Isbræ's Acceleration and Mass Loss: A 3‐D Thermomechanical Model Study. Geophys. Res. Lett. 44, 6252–6260. doi:10.1002/2017GL073309
Bouchez, J. L., and Duval, P. (1982). The Fabric of Polycrystalline Ice Deformed in Simple Shear: Experiments in Torsion, Natural Deformation and Geometrical Interpretation. Textures and Microstructures 5, 171–190. doi:10.1155/tsm.5.171
Brunt, K. M., King, M. A., Fricker, H. A., and MacAyeal, D. R. (2010). Flow of the Ross Ice Shelf, Antarctica, Is Modulated by the Ocean Tide. J. Glaciol. 56, 157–161. doi:10.3189/002214310791190875
Brunt, K. M., and MacAyeal, D. R. (2014). Tidal Modulation of Ice-Shelf Flow: A Viscous Model of the Ross Ice Shelf. J. Glaciol. 60, 500–508. doi:10.3189/2014JoG13J203
Byun, D.-S., and Hart, D. E. (2020). Predicting Tidal Heights for Extreme Environments: From 25 H Observations to Accurate Predictions at Jang Bogo Antarctic Research Station, Ross Sea, Antarctica. Ocean Sci. 16, 1111–1124. doi:10.5194/os-16-1111-2020
Cai, J., Wang, J., Wu, J., Hu, C., Grafarend, E., and Chen, J. (2008). Horizontal Deformation Rate Analysis Based on Multiepoch GPS Measurements in Shanghai. J. Surv. Eng. 134, 132–137. doi:10.1061/(asce)0733-9453(2008)134:4(132)
Cardozo, N., and Allmendinger, R. W. (2009). SSPX: A Program to Compute Strain From Displacement/Velocity Data. Comput. Geosciences 35, 1343–1357. doi:10.1016/j.cageo.2008.05.008
Cavanagh, J. P., Lampkin, D. J., and Moon, T. (2017). Seasonal Variability in Regional Ice Flow Due to Meltwater Injection into the Shear Margins of Jakobshavn Isbræ. J. Geophys. Res. Earth Surf. 122, 2488–2505. doi:10.1002/2016JF004187
Cooley, J., Winberry, P., Koutnik, M., and Conway, H. (2019). Tidal and Spatial Variability of Flow Speed and Seismicity Near the Grounding Zone of Beardmore Glacier, Antarctica. Ann. Glaciol. 60, 37–44. doi:10.1017/aog.2019.14
Cross, A. J., Ellis, S., and Prior, D. J. (2015). A Phenomenological Numerical Approach for Investigating Grain Size Evolution in Ductiley Deforming Rocks. J. Struct. Geology 76, 22–34. doi:10.1016/J.JSG.2015.04.001
Cross, A. J., Prior, D. J., Stipp, M., and Kidder, S. (2017). The Recrystallized Grain Size Piezometer for Quartz: An EBSD-Based Calibration. Geophys. Res. Lett. 44, 6667–6674. doi:10.1002/2017GL073836
Derby, B. (1991). The Dependence of Grain Size on Stress During Dynamic Recrystallisation. Acta Metallurgica et Materialia 39, 955–962. doi:10.1016/0956-7151(91)90295-C
Drews, R., Wild, C. T., Marsh, O. J., Rack, W., Ehlers, T. A., Neckel, N., et al. (2021). Grounding‐Zone Flow Variability of Priestley Glacier, Antarctica, in a Diurnal Tidal Regime. Geophys. Res. Lett. 48, e2021GL093853. doi:10.1029/2021GL093853
Dupont, T. K., and Alley, R. B. (2005). Assessment of the Importance of Ice-Shelf Buttressing to Ice-Sheet Flow. Geophys. Res. Lett. 32, L04503. doi:10.1029/2004GL022024
Echelmeyer, K. A., Harrison, W. D., Larsen, C., and Mitchell, J. E. (1994). The Role of the Margins in the Dynamics of an Active Ice Stream. J. Glaciol. 40, 527–538. doi:10.1017/s0022143000012417
Erlicher, S., Bonaventura, L., and Bursi, O. S. (2002). The Analysis of the Generalized -α Method for Non-Linear Dynamic Problems. Comput. Mech. 28, 83–104. doi:10.1007/s00466-001-0273-z
Erofeeva, S., Padman, L., and Howard, S. L. (2020). Tide Model Driver (TMD) Version 2.5, Toolbox for Matlab. GitHub. Available at: https://www.github.com/EarthAndSpaceResearch/TMD Matlab Toolbox v2.5.
Gammon, P. H., Kiefte, H., Clouter, M. J., and Denner, W. W. (1983a). Elastic Constants of Artificial and Natural Ice Samples by Brillouin Spectroscopy. J. Glaciol. 29 (103), 433–460. doi:10.1017/s0022143000030355
Gammon, P. H., Kiefte, H., and Clouter, M. J. (1983b). Elastic Constants of Ice Samples by Brillouin Spectroscopy. J. Phys. Chem. 87 (21), 4025–4029. doi:10.1021/J100244A004
Gerbi, C., Mills, S., Clavette, R., Campbell, S., Bernsen, S., Clemens-Sewall, D., et al. (2021). Microstructures in a Shear Margin: Jarvis Glacier, Alaska. J. Glaciol. 67, 1163–1176. doi:10.1017/jog.2021.62
Gold, L. W. (1958). Some Observations on the Dependence of Strain on Stress for Ice. Can. J. Phys. 36 (10), 1265–1275. doi:10.1139/P58-131
Goldberg, D., Holland, D. M., and Schoof, C. (2009). Grounding Line Movement and Ice Shelf Buttressing in Marine Ice Sheets. J. Geophys. Res. 114, F04026. doi:10.1029/2008JF001227
Golding, N., Schulson, E. M., and Renshaw, C. E. (2010). Shear Faulting and Localized Heating in Ice: The Influence of Confinement. Acta Materialia 58, 5043–5056. doi:10.1016/J.ACTAMAT.2010.05.040
Goldsby, D. L., and Kohlstedt, D. L. (1997). Grain Boundary Sliding in Fine-Grained Ice I. Scripta Materialia 37, 1399–1406. doi:10.1016/S1359-6462(97)00246-7
Goldsby, D. L., and Kohlstedt, D. L. (2001). Superplastic Deformation of Ice: Experimental Observations. J. Geophys. Res. 106, 11017–11030. doi:10.1029/2000JB900336
Gudmundsson, G. H. (2011). Ice-Stream Response to Ocean Tides and the Form of the Basal Sliding Law. The Cryosphere 5, 259–270. doi:10.5194/tc-5-259-2011
Gudmundsson, G. H., Paolo, F. S., Adusumilli, S., and Fricker, H. A. (2019). Instantaneous Antarctic Ice Sheet Mass Loss Driven by Thinning Ice Shelves. Geophys. Res. Lett. 46, 13903–13909. doi:10.1029/2019GL085027
Harrison, W. D., Echelmeyer, K. A., and Larsen, C. F. (1998). Measurement of Temperature in a Margin of Ice Stream B, Antarctica: Implications for Margin Migration and Lateral Drag. J. Glaciol. 44, 615–624. doi:10.3189/s0022143000002112
Heinert, M., and Riedel, B. (2007). Parametric Modelling of the Geometrical Ice-Ocean Interaction in the Ekstroemisen Grounding Zone Based on Short Time-Series. Geophys. J. Int. 169, 407–420. doi:10.1111/J.1365-246X.2007.03364.X
Hellmann, S., Grab, M., Kerch, J., Löwe, H., Bauder, A., Weikusat, I., et al. (2021). Acoustic Velocity Measurements for Detecting the Crystal Orientation Fabrics of a Temperate Ice Core. The Cryosphere 15, 3507–3521. doi:10.5194/TC-15-3507-2021
Howard, S. L., Padman, L., and Erofeeva, S. (2019). CATS2008: Circum-Antarctic Tidal Simulation Version 2008.
Hudleston, P. J. (1977). Progressive Deformation and Development of Fabric Across Zones of Shear in Glacial Ice. Energetics Geol. Process. 1977, 121–150. doi:10.1007/978-3-642-86574-9_7
Hulbe, C. L., Klinger, M., Masterson, M., Catania, G., Cruikshank, K., and Bugni, A. (2016). Tidal Bending and Strand Cracks at the Kamb Ice Stream Grounding Line, West Antarctica. J. Glaciol. 62, 816–824. doi:10.1017/jog.2016.74
Hunter, P., Meyer, C., Minchew, B., Haseloff, M., and Rempel, A. (2021). Thermal Controls on Ice Stream Shear Margins. J. Glaciol. 67, 435–449. doi:10.1017/JOG.2020.118
Jacka, T. H., and Jun, L. (1994). The Steady-State Crystal Size of Deforming Ice. Ann. Glaciol. 20, 13–18. doi:10.3189/1994aog20-1-13-18
Jackson, M., and Kamb, B. (1997). The Marginal Shear Stress of Ice Stream B, West Antarctica. J. Glaciol. 43, 415–426. doi:10.3189/s0022143000035000
Journaux, B., Chauve, T., Montagnat, M., Tommasi, A., Barou, F., Mainprice, D., et al. (2019). Recrystallization Processes, Microstructure and Crystallographic Preferred Orientation Evolution in Polycrystalline Ice During High-Temperature Simple Shear. The Cryosphere 13, 1495–1511. doi:10.5194/TC-13-1495-2019
King, M. A., Makinson, K., and Gudmundsson, G. H. (2011). Nonlinear Interaction Between Ocean Tides and the Larsen C Ice Shelf System. Geophys. Res. Lett. 38, L08501. doi:10.1029/2011GL046680
Kohlstedt, D. L., and Weathers, M. S. (1980). Deformation-Induced Microstructures, Paleopiezometers, and Differential Stresses in Deeply Eroded Fault Zones. J. Geophys. Res. 85, 6269–6285. doi:10.1029/JB085iB11p06269
Kohnen, H., and Gow, A. J. (1979). Ultrasonic Velocity Investigations of Crystal Anisotropy in Deep Ice Cores from Antarctica. J. Geophys. Res. 84, 4865–4874. doi:10.1029/JC084IC08P04865
Kuroiwa, D. (1964). “Internal Friction of Ice,” in Contributions from the Institute of Low Temperature Science, A18.
Lampkin, D. J., Parizek, B., Larour, E. Y., Seroussi, H., Joseph, C., and Cavanagh, J. P. (2018). Toward Improved Understanding of Changes in Greenland Outlet Glacier Shear Margin Dynamics in a Warming Climate. Front. Earth Sci. 6, 156. doi:10.3389/feart.2018.00156
Langdon, T. G. (2006). Grain Boundary Sliding Revisited: Developments in Sliding Over Four Decades. J. Mater. Sci. 41, 597–609. doi:10.1007/S10853-006-6476-0
Lescarmontier, L., Legresy, B., Young, N. W., Coleman, R., Testut, L., Mayet, C., et al. (2015). Rifting Processes and Ice-Flow Modulation Observed on Mertz Glacier, East Antarctica. J. Glaciol. 61, 1183–1193. doi:10.3189/2015JoG15J028
LINZ (2021). Scott Base Tide Gauge Data (Land Information New Zealand, LINZ). Available at: http://sealevel-data.linz.govt.nz/index.html?tidegauge=SCOT.
Lutz, F., Prior, D. J., Still, H., Bowman, M. H., Boucinhas, B., Craw, L., et al. (2022). Ultrasonic and Seismic Constraints on Crystallographic Preferred Orientations of the Priestley Glacier Shear Margin, Antarctica. Cryosphere Discuss. [preprint]. doi:10.5194/tc-2021-382
MacAyeal, D. R. (1984). Numerical Simulations of the Ross Sea Tides. J. Geophys. Res. 89, 607–615. doi:10.1029/jc089ic01p00607
Marsh, O. J., Rack, W., Floricioiu, D., Golledge, N. R., and Lawson, W. (2013). Tidally Induced Velocity Variations of the Beardmore Glacier, Antarctica, and Their Representation in Satellite Measurements of Ice Velocity. The Cryosphere 7, 1375–1384. doi:10.5194/tc-7-1375-2013
Marsh, O. J., Rack, W., Golledge, N. R., Lawson, W., and Floricioiu, D. (2014). Grounding-Zone Ice Thickness from InSAR: Inverse Modelling of Tidal Elastic Bending. J. Glaciol. 60, 526–536. doi:10.3189/2014JOG13J033
McCarthy, C., and Cooper, R. F. (2016). Tidal Dissipation in Creeping Ice and the Thermal Evolution of Europa. Earth Planet. Sci. Lett. 443, 185–194. doi:10.1016/J.EPSL.2016.03.006
Messerli, A., and Grinsted, A. (2015). Image Georectification and Feature Tracking Toolbox: ImGRAFT. Geosci. Instrum. Method. Data Syst. 4, 23–34. doi:10.5194/gi-4-23-2015
Meyer, C. R., and Minchew, B. M. (2018). Temperate Ice in the Shear Margins of the Antarctic Ice Sheet: Controlling Processes and Preliminary Locations. Earth Planet. Sci. Lett. 498, 17–26. doi:10.1016/j.epsl.2018.06.028
Minchew, B. M., Meyer, C. R., Robel, A. A., Gudmundsson, G. H., and Simons, M. (2018). Processes Controlling the Downstream Evolution of Ice Rheology in Glacier Shear Margins: Case Study on Rutford Ice Stream, West Antarctica. J. Glaciol. 64, 583–594. doi:10.1017/jog.2018.47
Minchew, B. M., Simons, M., Riel, B., and Milillo, P. (2017). Tidally Induced Variations in Vertical and Horizontal Motion on Rutford Ice Stream, West Antarctica, Inferred From Remotely Sensed Observations. J. Geophys. Res. Earth Surf. 122, 167–190. doi:10.1002/2016JF003971
Minowa, M., Podolskiy, E. A., and Sugiyama, S. (2019). Tide-Modulated Ice Motion and Seismicity of a Floating Glacier Tongue in East Antarctica. Ann. Glaciol. 60, 57–67. doi:10.1017/aog.2019.25
Monz, M. E., Hudleston, P. J., Prior, D. J., Michels, Z., Fan, S., Negrini, M., et al. (2021). Full Crystallographic Orientation (a and c Axes) of Warm, Coarse-Grained Ice in a Shear-Dominated Setting: A Case Study, Storglaciären, Sweden. The Cryosphere 15, 303–324. doi:10.5194/TC-15-303-2021
Morlighem, M., Rignot, E., Binder, T., Blankenship, D., Drews, R., Eagles, G., et al. (2020). Deep Glacial Troughs and Stabilizing Ridges Unveiled Beneath the Margins of the Antarctic Ice Sheet. Nat. Geosci. 13, 132–137. doi:10.1038/s41561-019-0510-8
Murray, T., Smith, A. M., King, M. A., and Weedon, G. P. (2007). Ice Flow Modulated by Tides at up to Annual Periods at Rutford Ice Stream, West Antarctica. Geophys. Res. Lett. 34, L18503. doi:10.1029/2007GL031207
Padman, L., Erofeeva, S., and Joughin, I. (2003). Tides of the Ross Sea and Ross Ice Shelf Cavity. Antarctic Sci. 15, 31–40. doi:10.1017/S0954102003001032
Padman, L., Siegfried, M. R., and Fricker, H. A. (2018). Ocean Tide Influences on the Antarctic and Greenland Ice Sheets. Rev. Geophys. 56, 142–184. doi:10.1002/2016RG000546
Patrick, B. A., Corvino, A. F., and Wilson, C. J. L. (2003). Ice-Flow Measurements and Deformation at Marginal Shear Zones on Sørsdal Glacier, Ingrid Christensen Coast, East Antarctica. Ann. Glaciol. 37, 60–68. doi:10.3189/172756403781815933
Perol, T., and Rice, J. R. (2015). Shear Heating and Weakening of the Margins of West Antarctic Ice Streams. Geophys. Res. Lett. 42, 3406–3413. doi:10.1002/2015GL063638
Qi, C., Prior, D. J., Craw, L., Fan, S., Llorens, M.-G., Griera, A., et al. (2019). Crystallographic Preferred Orientations of Ice Deformed in Direct-Shear Experiments at Low Temperatures. The Cryosphere 13, 351–371. doi:10.5194/TC-13-351-2019
Rack, W., King, M. A., Marsh, O. J., Wild, C. T., and Floricioiu, D. (2017). Analysis of Ice Shelf Flexure and its InSAR Representation in the Grounding Zone of the Southern McMurdo Ice Shelf. The Cryosphere 11, 2481–2490. doi:10.5194/tc-11-2481-2017
Ray, R. D., Larson, K. M., and Haines, B. J. (2021). New Determinations of Tides on the North-Western Ross Ice Shelf. Antarctic Sci. 33, 89–102. doi:10.1017/S0954102020000498
Rignot, E., Mouginot, J., and Scheuchl, B. (2016). MEaSUREs Antarctic Grounding Line From Differential Satellite Radar Interferometry, Version 2. Boulder, Colorado USA: NASA National Snow and Ice Data Center Distributed Active Archive Center. doi:10.5067/IKBWW4RYHF1Q
Robel, A. A., Tsai, V. C., Minchew, B., and Simons, M. (2017). Tidal Modulation of Ice Shelf Buttressing Stresses. Ann. Glaciol. 58, 12–20. doi:10.1017/aog.2017.22
Rosier, S. H. R., and Gudmundsson, G. H. (2020). Exploring Mechanisms Responsible for Tidal Modulation in Flow of the Filchner-Ronne Ice Shelf. The Cryosphere 14, 17–37. doi:10.5194/tc-14-17-2020
Rosier, S. H. R., Gudmundsson, G. H., and Green, J. A. M. (2015). Temporal Variations in the Flow of a Large Antarctic Ice Stream Controlled by Tidally Induced Changes in the Subglacial Water System. The Cryosphere 9, 1649–1661. doi:10.5194/tc-9-1649-2015
Rosier, S. H. R., and Gudmundsson, G. H. (2018). Tidal Bending of Ice Shelves as a Mechanism for Large-Scale Temporal Variations in Ice Flow. The Cryosphere 12, 1699–1713. doi:10.5194/tc-12-1699-2018
Rosier, S. H. R., Marsh, O. J., Rack, W., Gudmundsson, G. H., Wild, C. T., and Ryan, M. (2017). On the Interpretation of Ice-Shelf Flexure Measurements. J. Glaciol. 63, 783–791. doi:10.1017/jog.2017.44
Sayag, R., and Worster, M. G. (2011). Elastic Response of a Grounded Ice Sheet Coupled to a Floating Ice Shelf. Phys. Rev. E 84, 036111. doi:10.1103/PHYSREVE.84.036111
Schmeltz, M., Rignot, E., and MacAyeal, D. R. (2001). Ephemeral Grounding as a Signal of Ice-Shelf Change. J. Glaciol. 47, 71–77. doi:10.3189/172756501781832502
Schmeltz, M., Rignot, E., and MacAyeal, D. (2002). Tidal Flexure Along Ice-Sheet Margins: Comparison of InSAR with an Elastic-Plate Model. Ann. Glaciol. 34, 202–208. doi:10.3189/172756402781818049
Taylor, J. R. (1997). An Introduction to Error Analysis: The Study of Uncertainties in Physical Measurements. New York, NY: University Science Books, 327.
Thomas, R. E., Negrini, M., Prior, D. J., Mulvaney, R., Still, H., Bowman, M. H., et al. (2021). Microstructure and Crystallographic Preferred Orientations of an Azimuthally Oriented Ice Core from a Lateral Shear Margin: Priestley Glacier, Antarctica. Front. Earth Sci. 9, 1084. doi:10.3389/feart.2021.702213
Thompson, J., Simons, M., and Tsai, V. C. (2014). Modeling the Elastic Transmission of Tidal Stresses to Great Distances Inland in Channelized Ice Streams. The Cryosphere 8, 2007–2029. doi:10.5194/tc-8-2007-2014
van der Veen, C. J., Jezek, K. C., and Stearns, L. (2007). Shear Measurements Across the Northern Margin of Whillans Ice Stream. J. Glaciol. 53, 17–29. doi:10.3189/172756507781833929
van der Veen, C. J., Stearns, L. A., Johnson, J., and Csatho, B. (2014). Flow Dynamics of Byrd Glacier, East Antarctica. J. Glaciol. 60, 1053–1064. doi:10.3189/2014JoG14J052
van der Veen, C. J., and Whillans, I. M. (1989). Force Budget: I. Theory and Numerical Methods. J. Glaciol. 35, 53–60. doi:10.3189/002214389793701581
Vaughan, D. G. (1994). Investigating Tidal Flexure on an Ice Shelf Using Kinematic GPS. Ann. Glaciol. 20, 372–376. doi:10.3189/1994aog20-1-372-376
Vaughan, D. G. (1995). Tidal Flexure at Ice Shelf Margins. J. Geophys. Res. 100, 6213–6224. doi:10.1029/94JB02467
Vaughan, M. J., Van Wijk, K., Prior, D. J., and Bowman, M. H. (2016). Monitoring the Temperature-Dependent Elastic and Anelastic Properties in Isotropic Polycrystalline Ice Using Resonant Ultrasound Spectroscopy. The Cryosphere 10 (6), 2821–2829. doi:10.5194/TC-10-2821-2016
Walker, R. T., Parizek, B. R., Alley, R. B., Brunt, K. M., and Anandakrishnan, S. (2014). Ice-Shelf Flexure and Tidal Forcing of Bindschadler Ice Stream, West Antarctica. Earth Planet. Sci. Lett. 395, 184–193. doi:10.1016/j.epsl.2014.03.049
Whillans, I. M., and van der Veen, C. J. (1997). The Role of Lateral Drag in the Dynamics of Ice Stream B, Antarctica. J. Glaciol. 43, 231–237. doi:10.1017/s0022143000003178
Wiens, D. A., Anandakrishnan, S., Winberry, J. P., and King, M. A. (2008). Simultaneous Teleseismic and Geodetic Observations of the Stick-Slip Motion of an Antarctic Ice Stream. Nature 453, 770–774. doi:10.1038/nature06990
Keywords: shear margin, tides, ice deformation, elastic model, ice flexure, GNSS, Priestley Glacier, Antarctica
Citation: Still H, Hulbe C, Forbes M, Prior DJ, Bowman MH, Boucinhas B, Craw L, Kim D, Lutz F, Mulvaney R and Thomas RE (2022) Tidal Modulation of a Lateral Shear Margin: Priestley Glacier, Antarctica. Front. Earth Sci. 10:828313. doi: 10.3389/feart.2022.828313
Received: 03 December 2021; Accepted: 11 April 2022;
Published: 31 May 2022.
Edited by:
Alun Hubbard, Aberystwyth University, United KingdomReviewed by:
Olivier Castelnau, Centre National de la Recherche Scientifique (CNRS), FranceLynn Kaluzienski, University of Alaska Southeast, United States
Copyright © 2022 Still, Hulbe, Forbes, Prior, Bowman, Boucinhas, Craw, Kim, Lutz, Mulvaney and Thomas. This is an open-access article distributed under the terms of the Creative Commons Attribution License (CC BY). The use, distribution or reproduction in other forums is permitted, provided the original author(s) and the copyright owner(s) are credited and that the original publication in this journal is cited, in accordance with accepted academic practice. No use, distribution or reproduction is permitted which does not comply with these terms.
*Correspondence: Holly Still, aG9sbHkuc3RpbGxAb3RhZ28uYWMubno=
 Holly Still
 Christina Hulbe
 Martin Forbes1
 David J. Prior
 M. Hamish Bowman
 Lisa Craw
 Daeyeong Kim
 Franz Lutz
 Robert Mulvaney
 Rilee E. Thomas