 Yuying Duan
 Xiangjun Pei1,2*
 Xiaochao Zhang
- 1State Key Laboratory of Geological Disaster Prevention and Environmental Protection, Chengdu University of Technology, Chengdu, China
- 2State Environmental Protection Key Laboratory of Synergetic Control and Joint Remediation for Soil & Water Pollution, School of Ecological and Environmental Sciences, Chengdu University of Technology, Chengdu, China
A hypsometric integral (HI) is a topographical index with important geomorphological meaning. It can both describe the development state of the watershed and reflect the strength of activity in the geological structure. Based on this index, the integral curve method was used to analyze the HI characteristics of watersheds in the region west of the Lvliang Mountains on the Loess Plateau of Shanxi Province, China, in combination with 30-m resolution Shuttle Radar Topography Mission data. In order to accurately characterize erosion development within the watershed, the HI characteristics of each topographic feature object in the watershed were comprehensively analyzed. The results of HI scale effects show that HI was not strongly dependent on the spatial resolution of Digital Elevation Model (DEM) data, but had some scale dependence on the stable area of the watershed. The spatial distribution of the HI shows that the HI values of the watersheds in the southern loess residual tableland were the largest, and the degree of erosion was the weakest; the HI values of the watersheds in the north-central part of the loess hilly-gully region were relatively small, and the degree of erosion was stronger. This result is consistent with the results of the spatial distribution of sediment yield in literatures. The reasons for the spatial distribution of the HI were analyzed in terms of geological formations and climatic environments. The results show that for the study area, tectonic activity, formation lithology, rainfall, and agrotype were not the main factors affecting the HI values. The structure of the paleotopography and erosion cutting due to the uplift of the Lvliang Mountains and later water erosion controlled the spatial distribution state of HI. Thus, for the study area, the HI value cannot reflect the strength of tectonic activity. The combination of topographic feature object method and the HI index further quantified the erosion development state of the watershed.
Introduction
A hypsometric integral (HI) is a macroscopic indicator that can be used to study the quantitative relationship between the area of a regional horizontal section of an area and its elevation, which can reflect the state of watershed development (Chen et al., 2003; Hamdouni et al., 2008; Andreani et al., 2014; Qing et al., 2020; Gharehchahi et al., 2021). The origin of HIs can be traced back to Darwin’s theory of evolution (Slaymaker, 1972; Kowall, 1976), which was applied to characterize the surface of the Earth in the late 19th century (Bannister, 1980; Lifton and Chase, 1992; Hiroo, 1993). Strahler was the first geographer to use an HI to characterize the development of watersheds (Strahler, 1952; Givens 1963). His main idea was to quantify Davies’ model of the erosion cycle. With the development of Geographic Information Science (GIS) and Digital Elevation Model (DEM), the HI has become more widely used in geomorphology. For example, it has been used to classify the stage of watershed geomorphic development (Willgoose and Hancock, 1998; Ohmori, 1993), detect the intensity of glacial activity (Sternai et al., 2011; Brocklehurst and Whioole, 2004), evaluate the relative role of lithology and tectonics (Lifton and Chase, 2021), and assess the relative strength of tectonic activity in orogenic zones (Matos et al., 2016; Rabii et al., 2017). It could even be used on Mars, though this has not been examined in the field (Ansan and Mangold, 2006). The focus of this study was to analyze the application of HI in the Loess Plateau watershed.
Regarding research on the evaluation of watershed development by the geographic indicators, most scholars currently combine various geographic indicators to analyze the development status of watersheds in a comprehensive manner. The area elevation integral index can reflect the watershed development status, as well as the activity of geological structure. However, for the Loess Plateau watershed, except for scholars such as Nanshan Ai (1987), Ai and Yue (1988), Li et al. (1990), and Guoan Tang (Tang et al., 2008; Xiong, 2015), there have been few studies on expanding this index. Professor Guoan Tang’s team, combining the HI with the slope spectrum theory, extended this index in depth on the Loess Plateau in Shaanxi (Cao et al., 2017; Na et al., 2020; Zhou et al., 2010). The method was an important geographic concept extension for the study of area elevation integrals on the Loess Plateau watershed. The main idea of its series of studies was to analyze the development of watersheds in depth from the perspective of smaller topographic units of topographic feature objects for the special loess plateau. Studies on topographic feature objects can be summarized as follows: the study of spatial relationships between summit points, valley bottom points, and saddle points (Okabe and Sadahiro, 1994; Sadahiro, 2001; Sadahiro, 2002; Sadahiro, 2003; Sadahiro, 2004); the analysis of the relationship between landforms and geological formations using summit points and valley floor points (Dornkamp, 1972); the combination of topographic feature points and feature surfaces to delineate landform patterns (Bolongaro-Crevenna et al., 2005); and the study of the influence of gully network nodes on the spatial differentiation pattern of gullies on the Loess Plateau (Dong et al., 2008). Professor Tang introduced the idea of topographic feature object into the study of the area elevation integral of the Loess Plateau watershed, and explored it mainly in the Shaanxi Loess Plateau. However, for the Shanxi Loess Plateau, one of the main sources of sandy and coarse sand in the Yellow River Basin (Yang et al., 2011; Huang et al., 2021), there has been a lack of in-depth HI studies. Duan et al. (2020) did a study on the spatial distribution characteristics of elevation integrals of watershed areas on the Loess Plateau in western Shanxi, and also analyzed the correlation of integrals of individual geomorphic objects. The deficiency of the study is that it does not analyze the spatial distribution characteristics and differences of HI in each geomorphic object, and does not systematically analyze the relationship between HI and geological structure, formation lithology and other factors.
The topography of the Shanxi region of the Ordos Stable Massif has been mainly characterized by the tectonic influence of the Lvliang Mountains and the Shanxi-Shaanxi Gorge, and the topography has mainly showed a stepped combination structure. This feature is completely different from the ring and tree-like combination structure of the Loess Plateau in Shaanxi (Cao et al., 2019). The special geological environment has caused severe soil erosion in the study area. Therefore, it is necessary to analyze the area elevation integral characteristics of the regional watershed and the relationship between HI and factors such as tectonics and lithology. The topographic feature object method was combined with the HI index to analyze the HI characteristics of the Loess Plateau watershed in western Shanxi.
Study Area and Methods
Study Area
Shanxi Province is located in the eastern part of the Loess Plateau (34°34′-40°43′ N, 110°14′-114°33′ E). Loess covers 25.6% of the province (Cui et al., 2020), and is mainly distributed in the area west of Lvliang Mountains (35°41′–39°39′N, 110°22′–112°1′E), which is the most serious area of soil erosion in Shanxi Province (Sun et al., 2020). This study focused on the area elevation integral characteristics of this regional watershed. The region belongs to the easternmost part of the Ordos stable massif of the Loess Plateau. Its western side is the lowest part of the Ordos massif, the Shanxi-Shaanxi Gorge, and its eastern side is the continuously deformed Lvliang Mountains. This special geological and tectonic environment forms a typical stepped combination structure topography. According to scholars (Ma, 2004), the Li Shi Fault is the main tectonic zone within the region. Moreover, since the Quaternary, no important neotectonic movements of the Loess Plateau have occurred. The lithology of the strata is mainly sandstone, mudstone, and shale from the Triassic, and the sandy, gravelly loess of the Quaternary. The soil type is mainly loessal soil with weak erosion resistance. The study area has a typical Monsoon Climate of Medium Latitudes. The multi-year average temperature and precipitation shows a spatial trend of gradually increasing from northwest to southeast, with average annual precipitation ranging from 400 to 550 mm and the average multi-year temperature ranging from 4 to 12°C. The average elevation in the region is about 1,250 m, with a trend of high in the east and low in the west. The river basins, from north to south, include the Pianguan, Zhu Jiachuan, Qiushui, Sanchuan, and Xinshui rivers. Among them, the Pianguan, Sanchuan, and Xinshui rivers have important influences on the development of loess landforms. From the north to the south, the landforms are mainly represented by hilly-gully loess, hill loess, and residual loess tableland. In order to study the HI characteristics of these three types of geomorphic object watersheds, sample areas were selected in each region. From the north to the south, Pianguan and Baode represented loess ridges; Xingxian and Linxian represented loess hilly-gullies; and Shilou, Daning, Jixian, and Xiangning represented loess residual tablelands. These eight regions were selected for HI characterization. An overview of the region is shown in Figure 1.
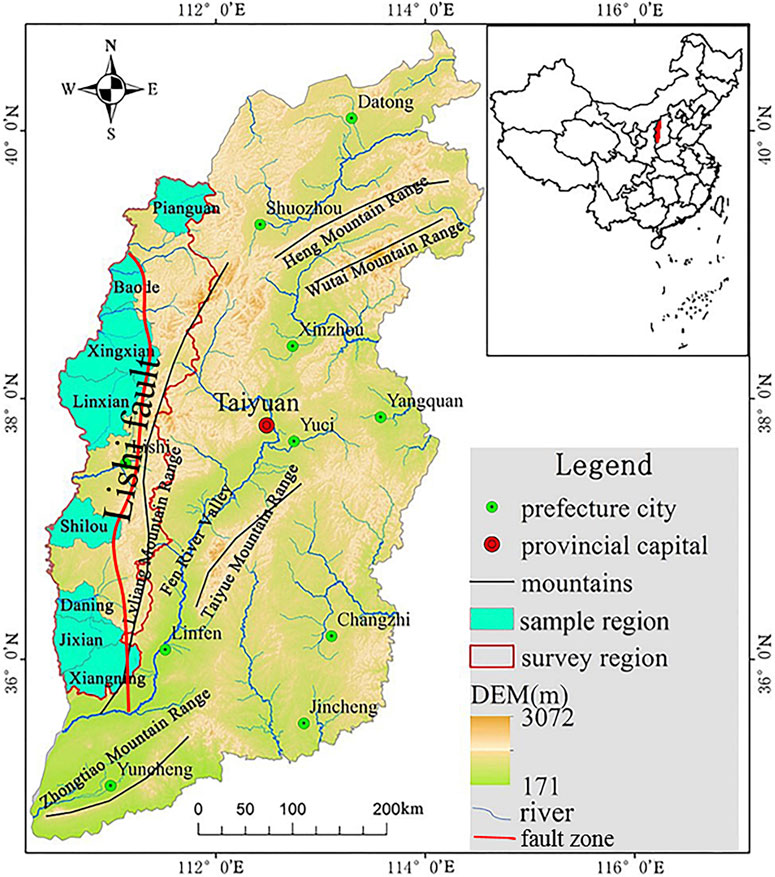
FIGURE 1. Map of the study area in wastern Shanxi Province, China. An inset map shows the location of the study area within an outline map of other administrative areas of China.
HI Calculation Method
The integral curve (Luo, 1998), volume-ratio (Meerkerk et al., 2009), and elevation relief ratio (Richard and Stephen, 1971) methods have been gradually developed with the application of HI. The integral curve method is based on the physical meaning of the HI and was used in this study to divide the basin elevation into equal intervals. The ratio of the area above different contours to the total was taken as the x-axis, and the ratio of the elevation corresponding to that contour to the total elevational differences was taken as the y-axis. The resulting series of scatter points were curve-fitted, and the curve corresponding to the polynomial with the highest fit coefficient was selected. The area between that curve and the x-axis was the HI value. The integral curve can visually reflect the development of erosion in a watershed more graphically. The HI value calculation models developed based on this principle include CalHypso (Perez-Pena et al., 2009) and others. The volumetric ratio method calculates the ratio of the volume between the existing watershed surface and the lowest elevation to the volume of the original uneroded watershed (Kaliraj et al., 2015). The elevation-relief ratio method is a simplified method for calculating HI, which was proposed by Pike and Wilson (Chorley, 1995). In this study, we need to analyze the integral curve characteristics of each basin, so the integral curve method was chosen to calculate HI values.
The integral curve was calculated as shown below (Strahler, 1952). First, the elevation difference of the watershed was subdivided infinitely, and the area of the watershed greater than the elevation value of each subdivision unit was obtained separately and homogenized as the x value as shown in Eq. 1:
where xi is the percentage of the area greater than the ith graded elevation; ai is the area greater than the ith graded elevation; and A is the total area of the watershed. The homogenization value of the elevation in each subdivision is used as the y value in Eq. 2:
where yi is the relative percentage elevation of the ith classification; hi is the relative elevational difference between the ith classification elevation and the lowest point in the basin; and H is the total range in elevation in the basin. A series of consecutive points were plotted in the Cartesian coordinate system, and a polynomial curve was fitted to the scattered points using Eq. 3:
Next, the polynomial with the highest fitting coefficient was selected, and the value of the definite integral in the range of 0–1 was found:
This value (S) is the HI value of the basin.
We combined previous studies with ArcGIS (ESRI, Redlands, CA, United States) methods to calculate the HI values for each terrain feature object. In the ArcGIS, point, line, and polygon elements are often used to represent terrain objects. For example, watershed boundaries, gully networks, and shoulder lines are line elements; peaks and saddle points are point elements; and watersheds are polygon elements. Theoretically, the terrain feature point and line elements are zero-dimensional and one-dimensional spatial objects, respectively, in GIS, lacking area attributes. However, from the perspective of practical geographic significance, each element is a combination of local elevation groups, occupying a certain spatial area in the geographic location. Therefore, we used GIS methods to generate polygon elements with area properties by properly buffering the point and line elements. The DEM data were extracted with this polygon element, and then its HI value was calculated.
The HI curve is shown in Figure 2; the HI values range from 0 to 1. Generally, values close to 0 or 1 indicate areas of high or minor erosional activity, respectively (Azor et al., 2002). The convex area of the curve indicates relatively “young” eroded areas (HI > 0.6), the s-lines indicate mature eroded areas (0.35 ≤ HI ≤ 0.6), and the concave curve indicates relatively “old” highly eroded areas (HI < 0.35).
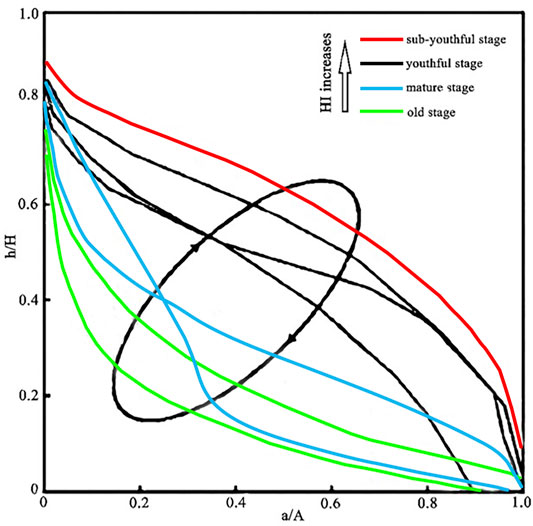
FIGURE 2. Schematic diagram of hypsometric integral (HI) result: A, the total area of the watershed; a, the area greater then the ith graded elevation; H, the total range in elevation in the basin; h, the relative elevational difference betwen the ith classification elevation and the lowest point in the basin.
Scale Effects of HI
The area elevation integral is a geographic metric with the scale effect. Currently, the topic most discussed in the literature regarding the scale effect is its scale dependence on DEM resolution and the analysis window (Walcott and Summerfield, 2008). Some scholars (Joel et al., 2018; Mahmood and Gloaguen 2011) found that the HI value was less sensitive to DEM resolution through statistical and autocorrelation analysis and other methods. Previous studies showed that the analysis window could influence the HI values (Chen et al., 2003). When calculating HI values, it is not advisable to choose too large an analysis window, and to try to maintain the relative consistency of physical geographic features (e.g., lithology, landform type, and vegetation type) within the analysis window.
Dependence of HI Value on DEM Resolution
The experiment was based on data at 30-m spatial resolution, with 10-m sampling intervals. The DEMs of eight sample areas were resampled, and 17 datasets were obtained at resolutions of 30–190 m.
Hypsometric integral values were calculated simultaneously for each region at each resolution using the integral curve method. The results show that with the change of resolution, the HI values in each area exhibited a fluctuated slightly pattern, but there were no dramatic fluctuations. The overall HI values exhibited a stable trend. The standard deviations of the HI values at each resolution are shown in Table 1. The results show that the value for Xingxian was 0.046; the values for Pianguan, Jixian, and Xianning were about 1%; and those for Baode, Linxian, Shilou, and Daning were about 0.1%. Studies in the literature have shown that the analysis window affects HI values. For large standard deviations, this may have stemmed from differences in the area of the catchment extracted from data of different resolutions. Therefore, our next step was to examine the influence of the watershed stability zone on HI values.
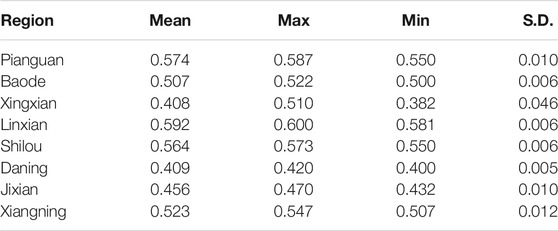
TABLE 1. Statistics of the mathematical characteristics of the hypsometric integral (HI) of each region.
Small fluctuations in HI values were observed as the DEM resolution progressively increased, but the errors largely met the statistical requirements. Across the range of spatial resolutions, the HI values were stable and less sensitive to DEM resolution. Therefore, a DEM with a 30-m resolution could be used to analyze HI features.
Dependence of HI Value on the Stable Area of the Watershed
The analysis window can be created in various forms, such as using an administrative boundary or a rule analysis window. The present study referred to the idea of a geographical object-oriented analysis (Saadat et al., 2008; Saito et al., 2009). A complete watershed was used as an analysis window to study the HI. The formation of a watershed requires delineation of the watershed within a certain area. Only a watershed with a certain area can be in a geomorphologically stable state. The United States Environmental Protection Agency has classified basins into five classes, which were used here to define the watershed at a sub-watershed scale as one of the following: Catchment, Sub-Watershed, Watershed, Sub-basin, and Basin. The agency has described the defining criteria and scope of application for each category (Table 2).
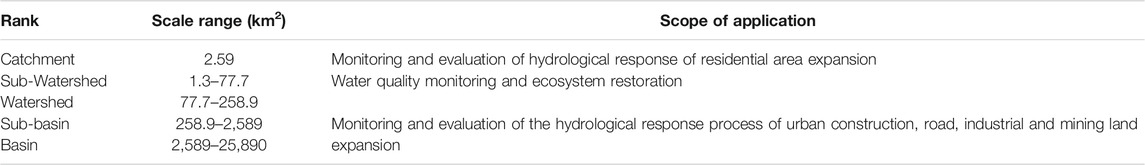
TABLE 2. Watershed scale and scope of application (source: United States Environmental Protection Agency).
In this section, we describe how the watershed was divided into sub-basins with certain thresholds. The basins were divided into three classes according to the Strahler watershed classification method (Figure 3). The number of level 1 sub-basins was much larger than the number of level 2 and 3 sub-basins, and the areas of level 1 sub-basins were generally smaller than those of levels 2 and 3. Little difference was observed between level 2 and 3 sub-basins.
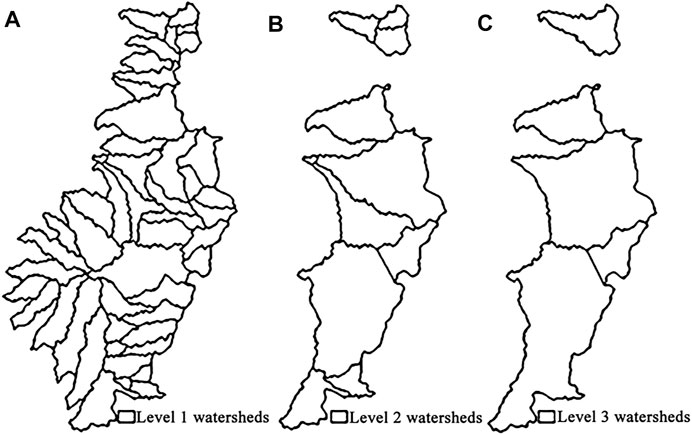
FIGURE 3. Three difference grades of sub-watersheds: (A) Level 1 watersheds, (B) Level 2 watersheds and (C) Level 3 watersheds.
In order to fully consider the overall characteristics and the scale level of the watershed, the scatter distribution of HI values versus area is summarized Figure 4. According to the Strahler watershed classification method, the watershed areas ranged from 11 to 1,481 km2. Watersheds with an area of less than 400 km2 accounted for 91% of all watersheds, with a wide range of HI values within this area, demonstrating that HI had a strong scale dependence on the stable area of a watershed. Therefore, the stability threshold was determined to be 400 km2. The area of the watershed subjects was mainly concentrated below 400 km2, and the basin scale is the watershed, based on the United States Environmental Protection Agency system.
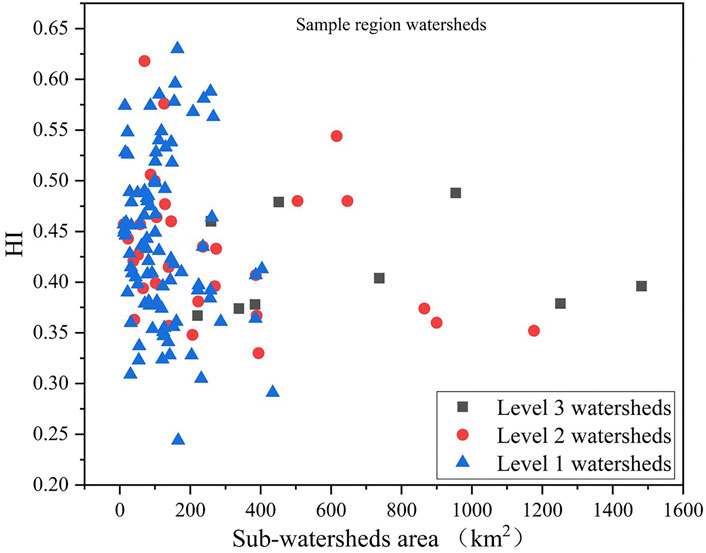
FIGURE 4. Scatter point distribution diagram of hypsometric integral value and area of each level of sub-watersheds.
The HI of Topographic Feature Elements
Correlation of the HI of Terrain Elements
The HI of each type of topographic feature element could reflect the topographic attributes in an angle. However, the shortcoming that still needed to be improved was the lack of comprehensiveness compared with the watershed HI. We considered the spatial topological relationship between geographic objects and the containment relationship of various terrain elements in space. Therefore, a certain correlation exists between the HI values of various types of elements. Typical topographic feature elements were selected, and the strength of their HI correlation was analyzed. The combination of topographic elements with weak correlations was analyzed to better reflect the spatial differences in watershed development.
We selected seven topographic features, watershed boundary, peak, positive and negative terrain, ridge line, gully line, and main gully, and calculated HI values for each element within each area (Table 3). The results of the HI value analysis could be ranked as watershed boundary > peak > ridge line > positive terrain > watershed > shoulder line > negative terrain > main gully. The HI value of watershed boundary was largest, basically around 0.6. The HI value of main gully was the smallest, at about 0.2. The overall position of the watershed boundary was high for the entire watershed. There were more high values of elevation on the watershed boundary, so the HI value was the largest. The main gully had the lowest position and more low values of elevation, so the HI value was the smallest.
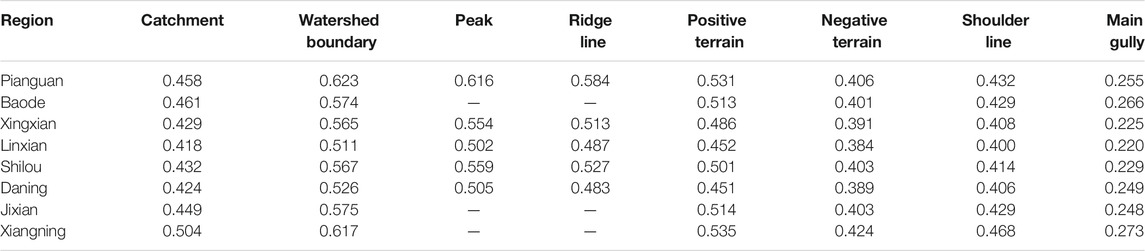
TABLE 3. Hypsometric integral (HI) of landform features in each plot.
The correlations are shown in Table 4. The strong correlation combinations were: watershed boundary–peak, watershed boundary–ridge line, peak–ridge line and watershed–shoulder line, and so on. The weak correlation combinations were: watershed–watershed boundary, watershed–peak, watershed boundary–negative terrain and peak–main gully, and so on. Based on the correlations, the three weakly correlated elements, watershed boundary, watershed and main gully, were selected for combination. The HI values of these three elements were initially calculated. Then, the HI differences of the watershed boundary–watershed and watershed–main gully, were calculated.
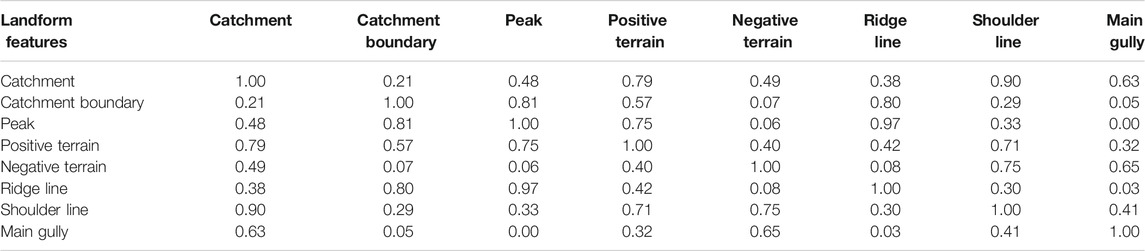
TABLE 4. R2 of the hypsometric integral (HI) of each landform feature.
Spatial Differentiation of Watershed HI in Eight Plots
The study started by calculating the HI values of the watershed in the eight sample areas and analyzing the status of their development including the integral value and curve of each sub-basin (Figure 5). Among them, 12 watersheds were extracted from Pianguan, with HI values ranging from 0.364 to 0.618 (mean 0.516), and the watersheds were in the early mature stage. In Baode, a total of nine watersheds were extracted, with HI values ranging from 0.386 to 0.505 (mean 0.386), and the watersheds were in the late mature stage. In Xing County, a total of 20 watersheds were extracted, with 85% values ranging from 0.243 to 0.454 (mean 0.317), and the watersheds were in the old stage. A total of 19 watersheds were extracted from Lin County, with 80% values ranging from 0.303 to 0.450 (mean 0.337), and the watersheds were close to the early old stage. In Shilou, a total of 15 watersheds were extracted, with HI values ranging from 0.309 to 0.562 (mean 0.368), and the watersheds were in the early old age. In Daning, seven watersheds were extracted, with HI values ranging from 0.361 to 0.516 (mean 0.404), and the watersheds were in the mature stage. In Ji County, a total of 13 watersheds were extracted, with HI values ranging from 0.378 to 0.536 (mean 0.494), and the watersheds were mature. In Xiangning, ten watersheds were extracted, with HI values ranging from 0.392 to 0.633 (mean 0.536), and the watersheds were in the early mature stage. Using integrated analysis, the HI values could be ranked as: loess hilly-gully < loess ridge < loess residual tableland.
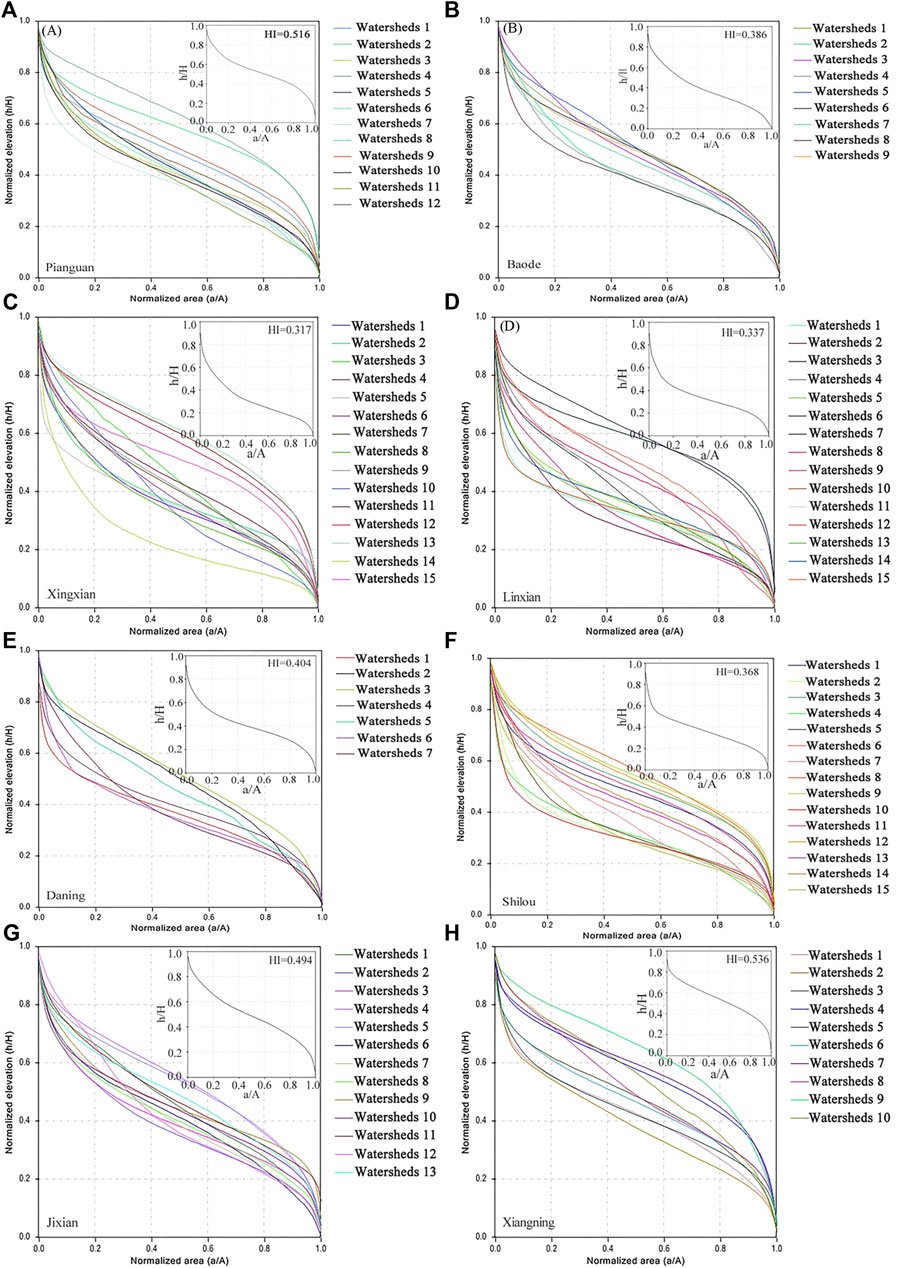
FIGURE 5. Hypsometric integral (HI) curves of sub-watersheds in each plot: (A) Pianguan, (B) Baode, (C) Xingxian, (D) Linxian, (E) Daning, (F) Shilou, (G) Jixian, (H) Xiangning.
Spatial Differentiation of Watershed HI
In order to analyze the development status of watersheds on the Loess Plateau in western Shanxi as a whole, we selected 18 county-level administrative regions, with a total of 205 watersheds. The HI characteristics of these watersheds were analyzed from five perspectives: watershed, watershed boundary, main gully, watershed boundary–watershed and watershed–main gully.
The spatial variability of watershed HI was divided based on the Strahler watershed classification method as shown in Figure 6. Overall, nearly 78% of the study area was in the mature stage of erosion development. The mature areas were mainly concentrated on the north loess ridge and loess residual tableland in the south. The HI values in the central loess hilly-gully were small overall; some watersheds were already in the old stage. The geographical variation in HI tended to vary from north to south, in a pattern from large to small then to large again. Specifically, the northern part of the watershed from Pianguan to Xingxian north (Pianguan River type) is in the water and wind erosion loess hilly landform area and had a relatively large HI value. In the central part, the watershed from Xingxian south to Yonghe north (Qiushui River type) is in the water-erosion cave erosion hilly landform area with a low HI value. In the southern part, the watershed from Yonghe south to Xiangning (Xinshui River type) is in the water erosion (hanging ditch) cave erosion remnant loess landform area with relatively large HI values. The results indicated that the spatial distribution of HI matched with the Loess Plateau landform type zoning in the study area.
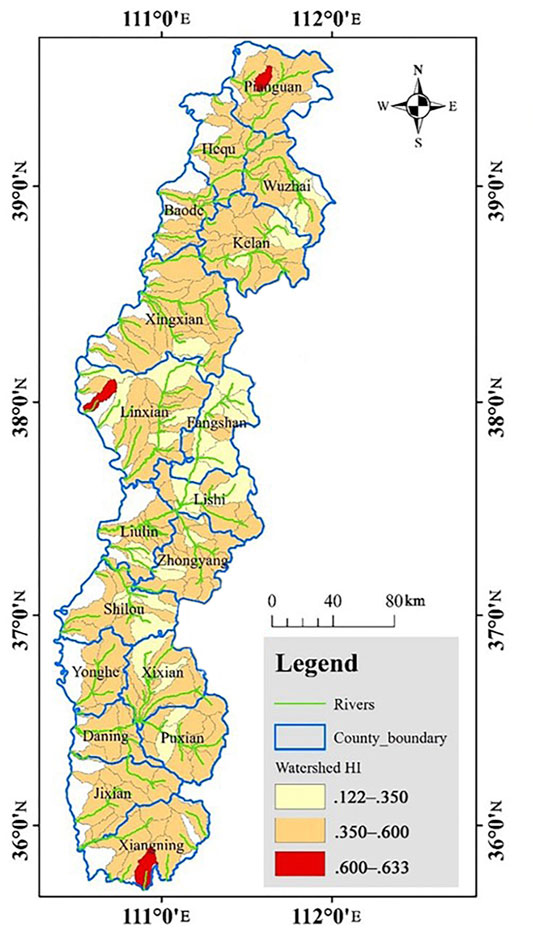
FIGURE 6. Map of the spatial differentiation of the hypsometric integral (HI) of the watershed based on the Strahler watershed classification method.
Spatial Differentiation of Watershed Boundary HI
To a considerable extent, watershed boundaries inherit the undulating character of the underlying paleotopography and reflect the original mounded topographic form of the loess landform. A watershed boundary has important tectonic significance in studies of erosion development (Wilson et al., 2015). The spatial differentiation of the watershed boundary HI is shown in Figure 7. The watershed boundary HI values were large throughout the study area. Only in the north-central loess hilly-gully area had small HI values. The southern loess residual tableland area showed clustered high values. Nearly 50% of the watershed boundary HI values were greater than 0.6. The HI values of a few wide and slow valleys in Pianguan and Wuzhai in the north were greater than 0.65. Most of Pianguan, Hequ, Baode, and Kelan were in the face erosion hilly area with HI values ranging 0.59–0.65. Xingxian, Linxian, Liulin, Fangshan, Lishi, Zhongyang, Shilou, and Yonghe were in gully erosion area, with HI values of 0.29–0.52. In Yonghe, Xi County, Daning, Puxian, Xiangning, and Ji County, the HI values ranged from 0.65 to 0.75. The results of the study of the watershed boundary show that the most severe erosion occurred in the gully erosion area, and weaker erosion occurred in the surface erosion area.
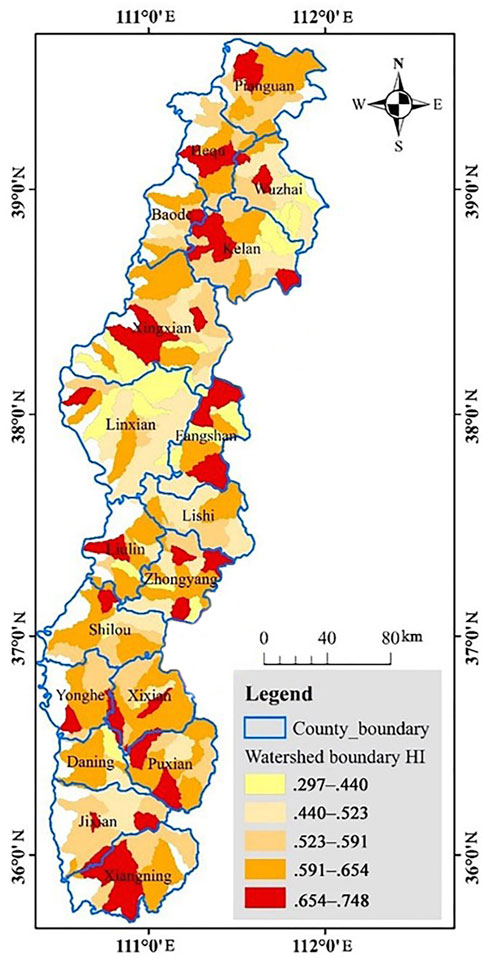
FIGURE 7. Map of the spatial differentiation of the Hypsometric integral (HI) of the watershed boundary.
Spatial Differentiation of Main Gully HI
The main gully is a normalization of the gully profile. It generally progresses towards an equilibrium profile over time and is the collection of relatively minimum elevations within the watershed. Its HI magnitude reflects the relative residual mass at the time of erosion equilibrium (Wu and Cheng, 2005; Zhang et al., 2015). Figure 8 shows the classification of the HI values of the main gully through the nature break method. The overall HI values were small, ranging from 0.064 to 0.36. The spatial differentiation is generally consistent with the watershed and watershed boundary. The HI values in the north-central loess hilly-gully area were low overall. In the southern loess residual tableland area, clustered peaks in HI values were observed. An anomaly of high HI values occurred in the northern loess ridge area of Baode and Hequ. The result might be due to an error in the data, which extended over the positive terrain when extracting the main gully, causing the locally HI high values. Among all terrain feature elements, the main valley had the smallest HI values. The main gully was the relatively lowest point of the watershed, representing the stable stage of gully erosion, that is, with a relatively “final” state of watershed development.

FIGURE 8. Map of the spatial differentiation of the hypsometric integral (HI) of the main gully.
HI Spatial Differentiation of Watershed Boundary–Watershed–Main Gully
1) Spatial differentiation of HI difference of watershed boundary–watershed
The HI characteristics of the watershed boundaries reflect, to some extent, the total amount of the most pristine that has accumulated material in the basin. Watershed HI reflects the amount of material remaining after erosion. Therefore, the HI difference between the watershed boundary and watershed itself can, from a theoretical point of view, represent the amount of material that has been eroded during the development of the watershed.
The spatial characteristics of the HI difference between the two elements are shown in Figure 9. The integral difference in the southern loess tableland area was generally small, indicating that the tableland watersheds were less eroded. The magnitude of change in watershed morphology over time was relatively small, with less material being eroded with the passage of time. The difference in the loess hilly-gully area was larger, which demonstrated that more materials had been eroded, leading to lower HI values. These results indicated that the amount of eroded material varies over time between by approximately 10–20%.
2) Spatial differentiation of HI difference of watershed–main gully
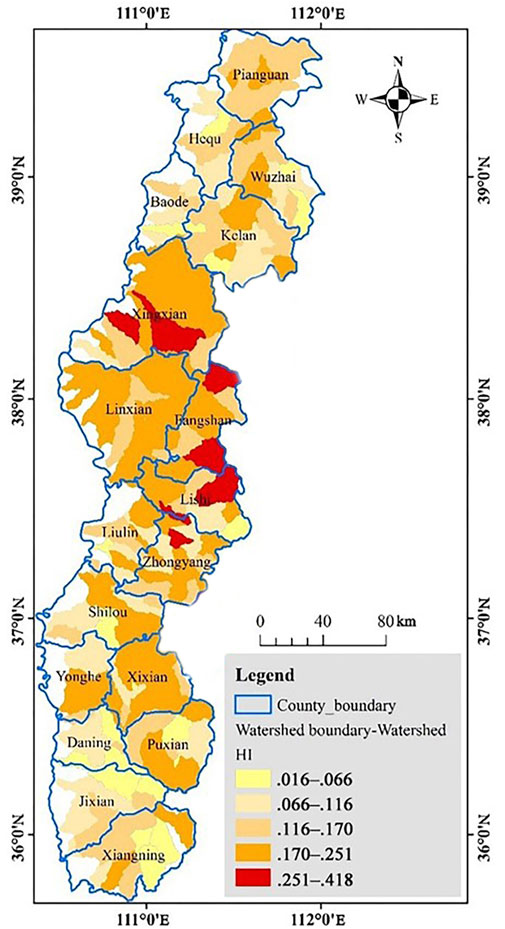
FIGURE 9. Map of the spatial differentiation of the hypsometric integral (HI) of the watershed boundary-watershed.
The HI reflects current development and the amount of material accumulation in the watershed. The main gully reflects the relative “final” topography of the basin, and the HI reflects the amount of material remaining after the basin has reached the end of the old stage. The HI difference reflects the amount of material that can be eroded in the basin under current erosive conditions.
The HI difference between the watershed and the main gully was not very regular on the loess hilly-gully area (Figure 10), with some sub-watersheds in Linxian showing anomalously high values. The results indicated that some weakly eroded watersheds were present that still had some potential to be eroded. The southern loess tableland area showed clusters of high values, especially around Ji County and Xiangning. The result indicated that a large amount of uneroded material still existed in this part of the area. The combination suggested that, under the current erosive conditions, relatively speaking, 15–25% of the material could still be eroded.
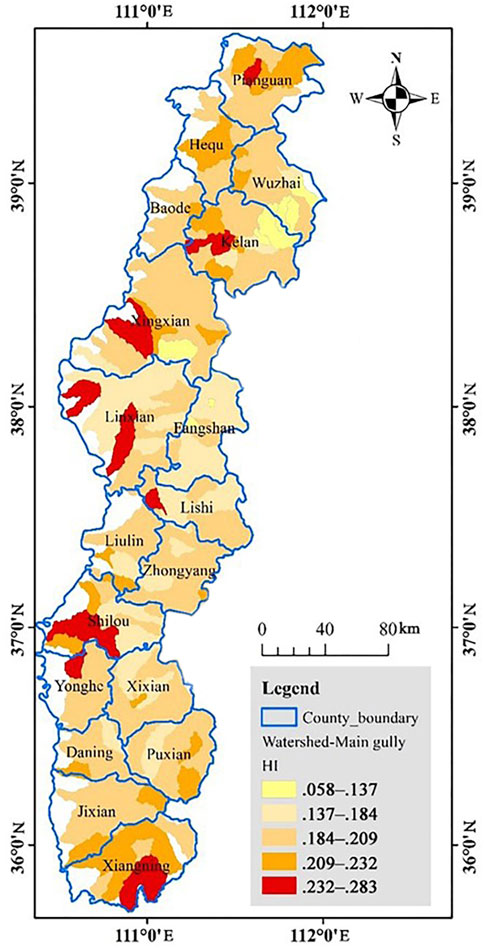
FIGURE 10. Map of the spatial differentiation of the hypsometric integral (HI) of the watershed-main gully.
The HI difference between the watershed boundary and the watershed reflects the relative amount of material that has been eroded within the basin. The HI difference between the watershed and the main gully reflects the amount of material that can still be eroded within the basin. A single watershed HI can only simply determine the period of erosion development. By referring to these two indicators, the development of the watershed can be further quantified in concrete terms.
Discussion
Scale Dependence of HI on DEM Resolution
The results of the study on the scale effect of area elevation integration show that the HI value was weakly dependent on the DEM resolution. This result is consistent with the findings of Duan et al. (2020). For a long time, scholars have began to pay attention to the scale response of HI to DEM resolution. The results showed that HI values changed slightly with the variation of the DEM resolution (Hurtrez et al., 1999; Pérez-Peña et al., 2009; Chen et al., 2003; Mahmood and Gloaguen, 2011; Mu, 2013). Scholars believed that the reason for this phenomenon was that although the reduction in the DEM resolution causes the elevation to be filtered and smoothed, the spatial structure of the terrain within the analysis window is stable. Changes in the DEM resolution do not have a large impact on the spatial distribution structure of the elevation, so the HI values do not change significantly. However, Joel et al. (2018) fitted the elevation curves of the watershed with polynomials and showed that polynomials of different orders gave different results for fitting the elevation curves. In this case, the HI values did not show a strong robustness to the DEM resolution. His conclusion that HI values were less sensitive to the DEM resolution should be based on the important premise that the study was on a small-scale watershed. Whether this conclusion was appropriate for a large-scale watershed remained to be studied.
Hurtrez et al. quantitatively studied the magnitude of change in HI values for different scale variations in resolution. The results showed that increasing the DEM resolution from 400 to 100 m and 200–100 m changed HIs by approximately 4.7 and 3.6% respectively, and there was no change in HI from 100 to 20 m. However, these results also based on small-scale watersheds. At present, there were few studies on the elevation integration characteristics of large-scale watershed. Especially, there was a lack of literature for the Loess Plateau watershed. As the results of Joel W., polynomials of different orders and watersheds of different sizes might lead to different findings. This issue deserves a more in-depth study on the Loess Plateau.
Influencing Factors of Area Elevation Integral
The comprehensive study results show that the erosion development in the area west of Lvliang Mountains in Loess Plateau, Shanxi, was in its mature overall. The watershed in the southern loess residual tablelands area had the largest HI value and the weakest erosion. The northern loess ridge area had the second-highest HI value and weaker erosion. The central loess hilly-gully area had the smallest HI value and the strongest erosion. The reasons for this spatial distribution of HI in the study area are worth exploring. At present, the most discussed factors influencing HI are tectonics, stratigraphic lithology, rainfall, and soil type (Joel et al., 2018; Qureshi. et al., 2019).
First, we examined the influence of tectonic activity on HI values. According to the description of Quaternary geology and major tectonic system of Loess Plateau in the Geological Atlas of China, no important fracture tectonics had occurred in the eastern region of Ordos stable massif since Quaternary. No neotectonic movement of the Loess Plateau had occurred in the study area. Therefore, the influence of Cenozoic tectonic activity of Loess Plateau on HI value was small, and the magnitude of HI value could not reflect the strength of tectonic activity. The distribution of formation lithology in the study area was overall more uniform (Huang et al., 2011), so lithology was also not the main factor. The factor that had the greatest influence on HI in the climatic environment was precipitation. We counted the multi-year average precipitation on the Loess Plateau from 1981 to 2018 and found that the precipitation trend in the study area was gradually increasing from northwest to southeast. Increased rainfall caused more severe soil and water erosion, which is inconsistent with the spatial distribution state of weaker erosion in the southern part of the study area. Therefore, rainfall had less influence on the spatial distribution of HI values. The soil types in the study area were more uniformly distributed, mainly loessal soil, and the degree of soil erosion resistance was consistent. Therefore, agrotype was not the primary factor controlling HI. Analyzing the sediment yield of the study area, it was found that the sediment yield in the northern part of the study area (6,943 t/a·km2) was much larger than that in the southern part (5,803 t/a·km2), which is consistent with the spatial distribution results of HI.
A comprehensive analysis of the geological and tectonic environment of the study area revealed that the main factors affecting the geological structure were the Li Shi Fault and the Lvliang Mountains, located in the eastern part of the study area. The Li Shi Fault crossed the study area longitudinally and divided the Ordos stable massif from the Lvliang Mountains. Since the Quaternary, the tectonic activity of the Li Shi Fault was weak and had less influence on the erosion of the Loess Plateau watershed. However, the Lvliang Mountains are a continuously deforming tectonic belt (Burchfiel et al., 1991). The uplift of the Lvliang Mountains was the main reason for the topography of the stepped combination structure of the study area (Lin et al., 2001). The study area as a whole showd a high eastern and low western posture. Analysis of the elevation difference in the study area revealed that the elevation difference in the northern part of the study area was 2003 m, the elevation difference in the central part was 2,138 m, and the elevation difference in the southern part was 1704 m. The larger the elevation drop, the smaller the HI value, and the stronger the erosion of the watershed. It could be seen that the uplift of Lvliang Mountaind had caused severe erosion cutting in the study area by watershed erosion. It caused the central part of the study area from Xingxian to Yonghe area to be an area of extremely intense water erosion and the main source of coarse sand in the Yellow River basin.
Numerous studies (Zhang et al., 2009; Lu et al., 2010; Guo et al., 2002) have shown that the topography of the loess hilly-gully was formed long before the Loess cover. Therefore, the causes of the special topographic features in the study area were mainly the control of paleotopography and the erosion of watershed development. Comprehensive analysis show that the factors affecting the spatial distribution state of area elevation integrals in the study area were mainly the control of paleotopography, the continuous deformation of the Lvliang Mountains, and the late water erosion. The area elevation integral characteristics of the region could not directly reflect the strength of tectonic activity.
Based on the previous study by Duan et al. (2020), the experiment systematically and thoroughly analyzed the area elevation integral characteristics of the Loess Plateau watershed in western Shanxi. The analysis focused on the relationship between elevation integration and the geological structure, stratigraphic lithology and rainfall in the study area.
Conclusion
In this study, the SRTM digital elevation model with 30-m spatial resolution was used to study the HI characteristics of the watershed in the area west of Lvliang Mountains on the Loess Plateau of Shanxi, China. In order to deeply characterize the developmental features within the watershed, the study synthesized the area elevation integration characteristics of each topographic feature object within the watershed. The area elevation integral features of the topographic feature objects and the watershed showed that the HI value was the largest in the southern loess residual loess area, which also had the weakest erosion of the watershed. The HI value was the smallest in the central part, and the erosion there was the most serious. We analyzed the reasons for the differences in the spatial distribution of area elevation integrals in terms of geological structure, formation lithology, rainfall, and paleotopography. It was found that the control of paleotopography, uplift of the Lvliang Mountains, and late water erosion were the main factors affecting the spatial distribution of HI. The results of the HI did not reflect the strength of tectonic activity in the study area. The analysis method of topographic feature objects we used further quantified the developmental state of the watershed.
Data Availability Statement
The original contributions presented in the study are included in the article/Supplementary Material, further inquiries can be directed to the corresponding authors.
Author Contributions
YD performed the experiments and wrote the manuscript. XP and XZ supervised the study. All authors have read and agreed to the published version of the manuscript.
Funding
This research was funded by the Major Program of the National Natural Science Foundation of China (Grant No. 41790445), and the National Key Research and Development Project (Grant No. 2018YFC1504702).
Conflict of Interest
The authors declare that the research was conducted in the absence of any commercial or financial relationships that could be construed as a potential conflict of interest.
Publisher’s Note
All claims expressed in this article are solely those of the authors and do not necessarily represent those of their affiliated organizations, or those of the publisher, the editors and the reviewers. Any product that may be evaluated in this article, or claim that may be made by its manufacturer, is not guaranteed or endorsed by the publisher.
Acknowledgments
We thank LetPub (www.letpub.com) for its linguistic assistance during the preparation of this manuscript.
References
Ai, N. S. (1987). Information Entropy of Erosion basin Systems[J]. J. Soil Water Conservation 1 (2), 3–10. doi:10.13870/j.cnki.stbcxb.1987.02.001
Ai, N. S., and Yue, T. X. (1988). Information Entropy of Watershed System. J. Soil Water Conservation 2 (4), 3–11. doi:10.13870/j.cnki.stbcxb.1988.04.001
Andreani, L., Stanek, K., Gloaguen, R., Krentz, O., and Domínguez-González, L. (2014). DEM-based Analysis of Interactions between Tectonics and Landscapes in the Ore Mountains and Eger Rift (East Germany and NW Czech Republic). Remote Sensing 6, 7971–8001. doi:10.3390/rs6097971
Ansan, V., and Mangold, N. (2006). New Observations of Warrego Valles, Mars: Evidence for Precipitation and Surface Runoff. Planet. Space Sci. 54 (3), 219–242. doi:10.1016/j.pss.2005.12.009
Azor, A., Keller, E. A., and Yeats, R. S. (2002). Geomorphic Indicators of Active Fold Growth: South Mountain–Oak Ridge Anticline, Ventura basin, Southern California. GSA Bull. 114, 745–753. doi:10.1130/0016-7606
Bannister, E. N. (1980). Hypsometries of Michigan's Southeastern Lake Plain. J. Great Lakes Res. 6, 154–163. doi:10.1016/S0380-1330(80)72094-4
Bolongaro-Crevenna, A., Torres-Rodríguez, V., Sorani, V., Frame, D., and Arturo Ortiz, M. (2005). Geomorphometric Analysis for Characterizing Landforms in Morelos State, Mexico. Geomorphology 67, 407–422. doi:10.1016/j.geomorph.2004.11.007
Brocklehurst, S. H., and Whipple, K. X. (2004). Hypsometry of Glaciated Landscapes. Earth Surf. Process. Landforms 29 (7), 907–926. doi:10.1002/esp.1083
Burchfiel, B. C., Zhang, P., Wang, Y., Zhang, W., Song, F., Deng, Q., et al. (1991). Geology of the Haiyuan Fault Zone, Ningxia-Hui Autonomous Region, China, and its Relation to the Evolution of the Northeastern Margin of the Tibetan Plateau. Tectonics 10 (6), 1091–1110. doi:10.1029/90TC02685
Cao, J., Na, J., Li, J., Tang, G., Fang, X., and Xiong, L. (2017). Topographic Spatial Variation Analysis of Loess Shoulder Lines in the Loess Plateau of China Based on MF-DFA. ISPRS Int. J. Geo-Information 6, 141. doi:10.3390/ijgi6050141
Cao, J., Tang, G., Fang, X., Li, J., Liu, Y., Zhang, Y., et al. (2019). Terrain Relief Periods of Loess Landforms Based on Terrain Profiles of the Loess Plateau in Northern Shaanxi Province, China. Front. Earth Sci. 13 (2), 410–421. doi:10.1007/s11707-018-0732-x
Chen, Y.-C., Sung, Q., and Cheng, K.-Y. (2003). Along-strike Variations of Morphotectonic Features in the Western Foothills of Taiwan: Tectonic Implications Based on Stream-Gradient and Hypsometric Analysis. Geomorphology 56, 109–137. doi:10.1016/S0169-555X(03)00059-X
Chorley, R. (1995). Horton, R.E. 1945: Erosional Development of Streams and Their Drainage Basins: Hydrophysical Approach to Quantitative Morphology. Bulletin of the Geological Society of America 56, 2 75-3 70. Prog. Phys. Geogr. Earth Environ. 19 (4), 533–554. doi:10.1177/030913339501900406
Cui, Y., Bi, H., Liu, S., Hou, G., Wang, N., Ma, X., et al. (2020). Developing Additive Systems of Biomass Equations for Robinia Pseudoacacia L. In the Region of Loess Plateau of Western Shanxi Province, China. Forests 11, 1332. doi:10.3390/f11121332
Dong, Y., Tang, G., and Luo, M. (2009). “The Extraction and Quantitative Analysis of Channel Junctions Based on DEMs,” in Proceedings of the Geoinformatis 2008 and Joint Conference on GIS and Built Environment, October 2009. SPIE 71462N. doi:10.1117/12.813191
Doornkamp, J. C. (2019). “Trend-surface Analysis of Planation Surfaces, with an East African Case Study,” in Spatial Analysis in Geomorphology[M] (Harper & Row Publishers), 247–282. doi:10.4324/9780429273346-9
Duan, Y. Y., Tang, J., and Duan, Y. X. (2020). Area Elevation Integral in Shanxi Section of Loess Plateau Based on DEM[J]. Res. Soil Water conservation 27 (05), 81–86. doi:10.13869/j.cnki.rswc.20200522.001
El Hamdouni, R., Irigaray, C., Fernández, T., Chacón, J., and Keller, E. A. (2008). Assessment of Relative Active Tectonics, Southwest Border of the Sierra Nevada (Southern Spain). Geomorphology 96, 150–173. doi:10.1016/j.geomorph.2007.08.004
Gharehchahi, S., Ballinger, T. J., Jensen, J. L. R., Bhardwaj, A., Sam, L., Weaver, R. C., et al. (2021). Local- and Regional-Scale Forcing of Glacier Mass Balance Changes in the Swiss Alps. Remote Sensing 13, 1949. doi:10.3390/rs13101949
Givens, W., The earth sciences, Harper and Row. Pub New York and London (1963). "Life" Science Library: Mathematics . David Bergamini and the Editors of Life . Time, Inc., New York, 1963. 200 Pp. Illus. $3.95. Science 142, 1287. doi:10.1126/science.142.3597.1287-a
Guo, Z. T., Ruddiman, W. F., Hao, Q. Z., Wu, H. B., Qiao, Y. S., Zhu, R. X., et al. (2002). Onset of Asian Desertification by 22 Myr Ago Inferred from Loess Deposits in China. Nature 416 (6877), 159–163. doi:10.1038/416159a
Hiroo, O. (1993). Changes in the Hypsometric Curve through Mountain Building Resulting from Concurrent Tectonics and Denudation. Geomorphology 8, 263–277. doi:10.1016/0169-555X(93)90023-U
Huang, C., Zhao, W., Liu, F., Tan, W., and Koopal, L. K. (2011). Environmental Significance of mineral Weathering and Pedogenesis of Loess on the Southernmost Loess Plateau, China. Geoderma 163 (3-4), 219–226. doi:10.1016/j.geoderma.2011.04.018
Huang, H., Zhou, Y., Qian, M., and Zeng, Z. (2021). Land Use Transition and Driving Forces in Chinese Loess Plateau: A Case Study from Pu County, Shanxi Province. Land 10, 67. doi:10.3390/land10010067
Hurtrez, J.-E., Sol, C., and Lucazeau, F. (1999). Effect of Drainage Area on Hypsometry from an Analysis of Small-Scale Drainage Basins in the Siwalik Hills (Central Nepal). Earth Surf. Process. Landforms 24 (9), 799–808. doi:10.1002/(sici)1096-9837(199908)24:9<799:aid-esp12>3.0.co;2-4
Kaliraj, S., Chandrasekar, N., and Magesh, N. S. (2015). Morphometric Analysis of the River Thamirabarani Sub-basin in Kanyakumari District, South West Coast of Tamil Nadu, India, Using Remote Sensing and GIS. Environ. Earth Sci. 73, 7375–7401. doi:10.1007/s12665-014-3914-1
Kowall, S. J. (1976). The Hypsometric Integral and Low Streamflow in Two Pennsylvania Provinces. Water Resour. Res. 12, 497–502. doi:10.1029/WR012i003p00497
Li, Q., Lu, Z. C., and Yuan, B. Y. (1990). A Quantitative Study on the Developmental Stages of Landforms[J]. J. Geogr. 57 (01), 110–120. doi:10.3321/j.issn:0375-5444.1990.01.013
Liffner, J. W., HewaGuna, G. A., and PeelMurray, M. C. (2018). The Sensitivity of Catchment Hypsometry and Hypsometric Properties to DEM Resolution and Polynomial Order. Geomorphology 309, 112–120. doi:10.1016/j.geomorph.2018.02.022
Lifton, N. A., and Chase, C. G. (1992). Tectonic, Climatic and Lithologic Influences on Landscape Fractal Dimension and Hypsometry: Implications for Landscape Evolution in the San Gabriel Mountains, California. Geomorphology 5, 77–114. doi:10.1016/0169-555X(92)90059-W
Lin, A., Yang, Z., Sun, Z., and Yang, T. (2001). How and when Did the Yellow River Develop its Square bend. Geol 29 (10), 951–954. doi:10.1130/0091-7613(2001)029<0951:hawdty>2.0.co;2
Lu, H., Wang, X., and Li, L. (2010). Aeolian Sediment Evidence that Global Cooling Has Driven Late Cenozoic Stepwise Aridification in central Asia. Geol. Soc. Lond. Spec. Publications 342, 29–44. doi:10.1144/SP342.4
Luo, W. (1998). Hypsometric Analysis with a Geographic Information System. Comput. Geosciences 24, 815–821. doi:10.1016/S0098-3004(98)00076-4
Ma, L. F. (2004). Geological Atlas of China. Beijing, China: Institute of Geology, Chinese Academy of Geological Sciences.
Mahmood, S. A., and Gloaguen, R. (2011). Analyzing Spatial Autocorrelation for the Hypsometric Integral to Discriminate Neotectonics and Lithologies Using DEMs and GIS. GIScience & Remote Sensing 48 (4), 541–565. doi:10.2747/1548-1603.48.4.541
Matoš, B., Pérez-Peña, J. V., and Tomljenović, B. (2016). Landscape Response to Recent Tectonic Deformation in the SW Pannonian Basin: Evidence from DEM-Based Morphometric Analysis of the Bilogora Mt. Area, NE Croatia. Geomorphology 263, 132–155. doi:10.1016/j.geomorph.2016.03.020
Meerkerk, A. L., van Wesemael, B., and Bellin, N. (2009). Application of Connectivity Theory to Model the Impact of Terrace Failure on Runoff in Semi-arid Catchments. Hydrol. Process. 23, 2792–2803. doi:10.1002/hyp.7376
Mu, L. (2013). From Zipf's Law to Hypsometry: Seeking the 'signature' of Elevation Distribution. Int. J. Geographical Inf. Sci. 27 (7), 1312–1328. doi:10.1080/13658816.2012.721887
Na, J., Yang, X., Tang, G., Dang, W., and Strobl, J. (2020). Population Characteristics of Loess Gully System in the Loess Plateau of China. Remote Sensing 12, 2639. doi:10.3390/rs12162639
Ohmori, H. (1993). Changes in the Hypsometric Curve through Mountain Building Resulting from Concurrent Tectonics and Denudation. Geomorphology 8 (4), 263–277. doi:10.1016/0169-555X(93)90023-U
Okabe, A., and Sadahiro, Y. (1994). A Statistical Method for Analyzing the Spatial Relationship between the Distribution of Activity Points and the Distribution of Activity Continuously Distributed over a Region. Geographical Anal. 26 (2), 152–167. doi:10.1111/j.1538-4632.1994.tb00317.x
Pérez-Peña, J. V., Azañón, J. M., Booth-Rea, G., Azor, A., and Delgado, J. (2009). Differentiating Geology and Tectonics Using a Spatial Autocorrelation Technique for the Hypsometric Integral. J. Geophys. Res. 114, F02018. doi:10.1029/2008JF001092
Qing, F., Zhao, Y., Meng, X., Su, X., Qi, T., and Yue, D. (2020). Application of Machine Learning to Debris Flow Susceptibility Mapping along the China-Pakistan Karakoram Highway. Remote Sensing 12, 2933. doi:10.3390/rs12182933
Qureshi, J., Mahmood, S. A., Masood, A., Khalid, P., and Kaukab, I. S. (2019). DEM and GIS-Based Hypsometric Analysis to Study Tectonics and Lithologies in Southern Suleiman Fold and Thrust belt (Balochistan-Pakistan). Arab J. Geosci. 12 (5), 1–15. doi:10.1007/s12517-019-4283-6
Rabii, F., Achour, H., Rebai, N., and Jallouli, C. (2017). Hypsometric Integral for the Identification of Neotectonic and Lithology Differences in Low Tectonically Active Area (Utica-Mateur Region, north-eastern Tunisia). Geocarto Int. 32 (11), 1229–1242. doi:10.1080/10106049.2016.1195890
Richard, J. P., and Stephen, E. W. (1971). Elevation-Relief Ratio, Hypsometric Integral, and Geomorphic Area-Altitude Analysis. GSA Bull. 82, 1079–1084. doi:10.1130/0016-7606(1971)82
Sadahiro, Y. (2001). Analysis of Surface Changes Using Primitive Events. Int. J. Geographical Inf. Sci. 15 (6), 523–538. doi:10.1080/13658810110060433
Sadahiro, Y. (2002). A Graphical Method for Exploring Spatiotemporal Point Distributions[J]. Cartogr. Geogr. Inf. Sci. 29 (2), 67–84. doi:10.1559/152304002782053332
Sadahiro, Y. (2003). Stability of the Surface Generated from Distributed Points of Uncertain Location. Int. J. Geogr. Inf. Sci. 17 (2), 139–156. doi:10.1080/713811751
Sadahiro, Y., and Masui, M. (2004). Analysis of Qualitative Similarity Between Surfaces. Geographical Analysis 36 (3), 217–233. doi:10.1111/j.1538-4632.2004.tb01133.x
Slaymaker, H. O. (1972). Patterns of Present Sub-aerial Erosion and Landforms in Mid-Wales. Trans. Inst. Br. Geogr. 55, 47–68. doi:10.2307/621722
Sternai, P., Herman, F., Fox, M. R., and Castelltort, S. (2011). Hypsometric Analysis to Identify Spatially Variable Glacial Erosion. J. Geophys. Res. 116 (F3). doi:10.1029/2010JF001823
Strahler, A. N. (1952). Hypsometric (Area-Altitude) Analysis of Erosional Topography. Geol. Soc. America Bull. 63, 1117–1142. doi:10.1130/0016-7606(1952)63[1117:haaoet]2.0.co;2
Sun, R., Ma, L., Zhang, S., Yu, Y., Shen, M., Zhang, H., et al. (2020). Study on Landscape Patches Influencing Hillslope Erosion Processes and Flow Hydrodynamics in the Loess Plateau of Western Shanxi Province, China. Water 12, 3201. doi:10.3390/w12113201
Saadat, H., Bonnell, R., Sharifi, F., Mehuys, G., Namdar, M., and Ale-Ebrahim, S. (2008). Landform Classification from a Digital Elevation Model and Satellite Imagery. Geomorphology 2008 (100), 453–464. doi:10.1016/j.geomorph.2008.01.011
Saito, H., Nakayama, D., and Matsuyama, H. (2009). Comparison of Landslide Susceptibility Based on a Decision-Tree Model and Actual Landslide Occurrence: The Akaishi Mountains, Japan. Geomorphology 2009 (109), 108–121. doi:10.1016/j.geomorph.2009.02.026
Tang, G., Li, F., Liu, X., Long, Y., and Yang, X. (2008). Research on the Slope Spectrum of the Loess Plateau. Sci. China Ser. E-technol. Sci. 51 (1), 175–185. doi:10.1007/s11431-008-5002-9
Walcott, R. C., and Summerfield, M. A. (2008). Scale Dependence of Hypsometric Integrals: An Analysis of Southeast African Basins. Geomorphology 96 (1-2), 174–186. doi:10.1016/j.geomorph.2007.08.001
Willgoose, G., and Hancock, G. (1998). Revisiting the Hypsometric Curve as an Indicator of Form and Process in Transport-Limited Catchment. Earth Surf. Process. Landforms 23, 611–623. doi:10.1002/(sici)1096-9837(199807)23:7<611:aid-esp872>3.0.co;2-y
Wilson, G. V., Rigby, J. R., and Dabney, S. M. (2015). Soil Pipe Collapses in a Loess Pasture of Goodwin Creek Watershed, Mississippi: Role of Soil Properties and Past Land Use. Earth Surf. Process. Landforms 40, 1448–1463. doi:10.1002/esp.3727
Wu, Y., and Cheng, H. (2005). Monitoring of Gully Erosion on the Loess Plateau of China Using a Global Positioning System. CATENA 63, 154–166. doi:10.1016/j.catena.2005.06.002
Xiong, L. Y. (2015). Dem Based Research on the Loess Landform Inheritance in the Loess Plateau of China. Ph.D. Thesis. Nanjing, China: Nanjing Normal University.
Yang, Z. P., Zhang, Q., Wang, Y. L., Zhang, J. J., and Chen, M. C. (2011). Spatial and Temporal Variability of Soil Properties under Caragana Microphylla Shrubs in the Northwestern Shanxi Loess Plateau, China. J. Arid Environments 75, 538–544. doi:10.1016/j.jaridenv.2011.01.007
Zhang, J.-F., Qiu, W.-L., Li, R.-Q., and Zhou, L.-P. (2009). The Evolution of a Terrace Sequence along the Yellow River (HuangHe) in Hequ, Shanxi, China, as Inferred from Optical Dating. Geomorphology 109 (1-2), 54–65. doi:10.1016/j.geomorph.2008.08.024
Zhang, W., Wang, W.-g., Zheng, J.-h., Wang, H.-g., Wang, G., and Zhang, J.-s. (2015). Reconstruction of Stage-Discharge Relationships and Analysis of Hydraulic Geometry Variations: The Case Study of the Pearl River Delta, China. Glob. Planet. Change 125, 60–70. doi:10.1016/j.gloplacha.2014.12.004
Keywords: watershed, hypsometric integral, terrain feature elements, influencing mechanism, Shanxi loess plateau
Citation: Duan Y, Pei X and Zhang X (2022) The Hypsometric Integral Based on Digital Elevation Model for the Area West of Lvliang Mountains in Loess Plateau, Shanxi, China. Front. Earth Sci. 10:827836. doi: 10.3389/feart.2022.827836
Received: 02 December 2021; Accepted: 17 January 2022;
Published: 16 February 2022.
Edited by:
Chong Xu, Ministry of Emergency Management, ChinaReviewed by:
Siyuan Ma, China Earthquake Administration, ChinaQi Yao, China Earthquake Administration, China
Copyright © 2022 Duan, Pei and Zhang. This is an open-access article distributed under the terms of the Creative Commons Attribution License (CC BY). The use, distribution or reproduction in other forums is permitted, provided the original author(s) and the copyright owner(s) are credited and that the original publication in this journal is cited, in accordance with accepted academic practice. No use, distribution or reproduction is permitted which does not comply with these terms.
*Correspondence: Xiangjun Pei, cGVpeGlhbmdqdW4yMDEyQGNkdXQuY24=; Xiaochao Zhang, emhhbmd4aWFvY2hhb0BjZHV0LmNu