 Sikelela Gomo
 Gordon R. J. Cooper
 Raymond J. Durrheim
 Musa S. D. Manzi
- School of Geosciences, University of the Witwatersrand, Johannesburg, South Africa
Surface displacement measurements collected using continuous Global Positioning System (cGPS) stations include the contribution of both endogenic processes (e.g., plate tectonics, isostasy) and exogenic processes that show seasonal variation (e.g., climate). These seasonal variations distort the tectonic signals and limit the usefulness of short-term investigations. This paper explores cGPS and meteorological time series collected in southern Africa and investigates whether the usefulness of cGPS time series can be improved by accounting for the seasonal effects of the dominant meteorological processes. The study is carried out using time, frequency, and time-frequency domain signal processing (inferential) analysis techniques. It was found that from the considered atmospheric processes, thermally-induced effects, which are not corrected for in the cGPS data, are the most prominent meteorological contributors in the vertical annual deformation component observed in cGPS time series. The effects of heave action (due to seasonal subsurface water infiltration and absorption, as well as changes in the water table) and changes of water mass distribution (caused by infiltration, transportation, extractions, and evaporation) on the displacement time series are much smaller. This suggests that correcting for thermal expansion, contraction, and thermal-induced errors could reduce the annual seasonal deformation component observed in cGPS position measurements in southern Africa and, most probably, in other parts of the world subjected to large seasonal variations in atmospheric temperatures. Reducing the magnitude of the seasonal components would increase the usefulness of short-term cGPS campaigns.
Introduction
The continuous Global Positioning System (cGPS) is a space geodetic technique that measures positional changes on the Earth’s surface. cGPS measurements are used to study, infer, and monitor plate tectonic motion and drift rates, crustal deformation caused by earthquakes and volcanoes, and crustal motion due to geodynamic and hydrospheric processes (Rabbel and Schuh, 1986; Yan et al., 2009; Argus et al., 2014; Knowles et al., 2020). cGPS data have been used to investigate many space and Earth science research questions, for example, Cilliers et al. (2004) and Malservisi et al. (2013) used the South African cGPS TrigNet network to study the ionospheric conditions over southern Africa, and to investigate the dynamics of the South African portion of the African plate, respectively.
cGPS position measurements generally contain annual and semi-annual seasonal deformation components that are not accounted for and, thus, distort the cGPS measurements (Figure 1). Rabbel and Schuh (1986), van Dam and Wahr (1998), and Yan et al. (2009) attribute these deformation signals to seasonal and partly seasonal variations from multiple sources including surface loading owing to solid Earth tides, pole tides, oceanic tides, atmospheric mass variations, and non-tidal surface fluctuations. Moreover, processing- and equipment-induced errors contribute to the observed seasonal variations. Thermal expansion and contraction of the cGPS monument and the bedrock, along with soil consolidation and the extraction of surface and subsurface water mass near a cGPS station are also thought to be significant contributors of local surface deformation signals (van Dam et al., 2001; Romagnoli et al., 2003; Yan et al., 2009). The vertical displacement of these seasonal deformation components tends to be largest as some exogenic processes (e.g., atmospheric loading and oceanic loading) induce greater surface displacement in the vertical direction than in the horizontal direction (Figure 1) (Dong et al., 2002; Min et al., 2005; He et al., 2015).
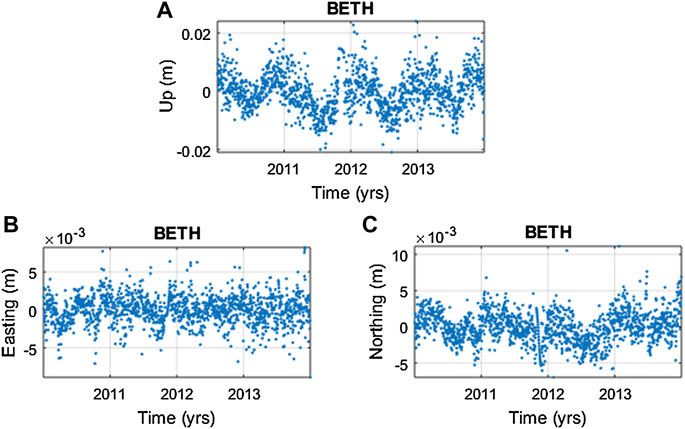
FIGURE 1. cGPS daily position time series of station BETH located in Bethlehem, South Africa. (A) Detrended and interpolated vertical surface displacement time series at the station. (B,C) are detrended and interpolated horizontal surface displacement time series x (easting) and y (northing) directions, respectively. 27.
This study sought to better understand cGPS and meteorological data collected in southern Africa and draw inference on the seasonal influence of meteorological processes and climatic zones on the vertical component of cGPS surface displacement measurements. This study is fitting, as in some areas (e.g., the Amazon basin) mass loading has been demonstrated to be driven by its local climatic system, and cGPS measurements have been observed to have high enough temporal resolution to enable the correlation of cGPS measurements and that of several other environmental parameters (Romagnoli et al., 2003; Davis et al., 2004; Yan et al., 2009; Fu et al., 2013; Knowles et al., 2020). Additionally, Knowles et al. (2020) suggest that cGPS time series record displacements are driven by local- and large-scale climate oscillations. Southern Africa is an ideal place to conduct such research because it has several well-maintained cGPS (Figure 2A) and meteorology stations, situated in regions of varying climatic zones (Figure 2B), and low seismic and tectonic activity.
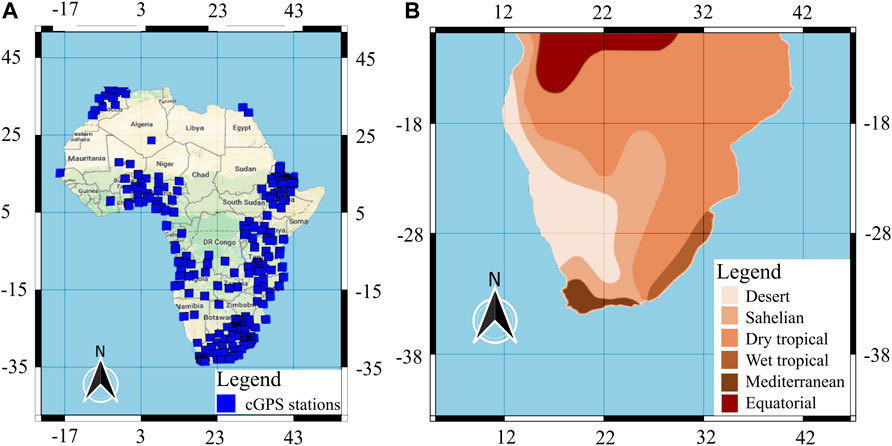
FIGURE 2. (A) Location of cGPS station in the African continent. (B) Climatic zones in southern Africa (modified after Hepburn and Radloff, 1998). 27. Southern Africa is a largely semi-arid region, consisting of five different climatic zones (i.e., the Mediterranean, Desert, Sahelian, Dry tropical, and Wet tropical climatic zones). Its general climate varies from dry arid conditions in the west to humid tropical conditions in the north and east sides.
Materials and Methods
Description
In this paper, we used data from the South African TrigNet geodetic network and the South African Weather Service (SAWS) to investigate the seasonal effects of changing atmospheric temperature, pressure, rainfall, and humidity processes on vertical cGPS surface displacement measurements. The cGPS data are archived and processed by the geodetic laboratory at the University of Nevada Reno (UNR) (http://geodesy.unr.edu/index.php) (Blewitt et al., 2018). The data processing is based on the International GNSS Service (IGS14) realization of the International Terrestrial Reference Frame 2014 (ITRF14) (Altamimi et al., 2016; Rebischung et al., 2016). The processing by UNR includes corrections for tropospheric effects (i.e., hydrostatic and non-hydrostatic delays), first-order ionospheric effects, solid Earth tides, pole tides, and oceanic tide loading. However, it does not include corrections for non-tidal loading effects (e.g., atmospheric pressure, ocean bottom pressure, surface hydrology), seasonal thermal expansion, and shrink-swell heave effects. The complete processing procedure of the cGPS dataset is given at http://geodesy.unr.edu/gps/ngl.acn.txt. The meteorological data used are from meteorological ground stations managed by the SAWS. To be able to analyse the data for annual and semi-annual seasonal variation, both the cGPS and meteorological data were corrected for long term tectonic and climatic variations by detrending the data. In preparing the data for spectral analysis, the data were detrended, zero centred, interpolated and windowed to minimise the occurrence of spectral distortion, leakage, shift, and the formation of false peaks.
All the data used for the study were acquired in South Africa (Figure 3) because 1) most of the cGPS stations in southern Africa are in South Africa; and 2) the cGPS data from other southern African countries have many gaps, which makes it difficult to apply signal processing techniques. Our results are expected to be valid in other southern African regions as the environmental setting is similar.
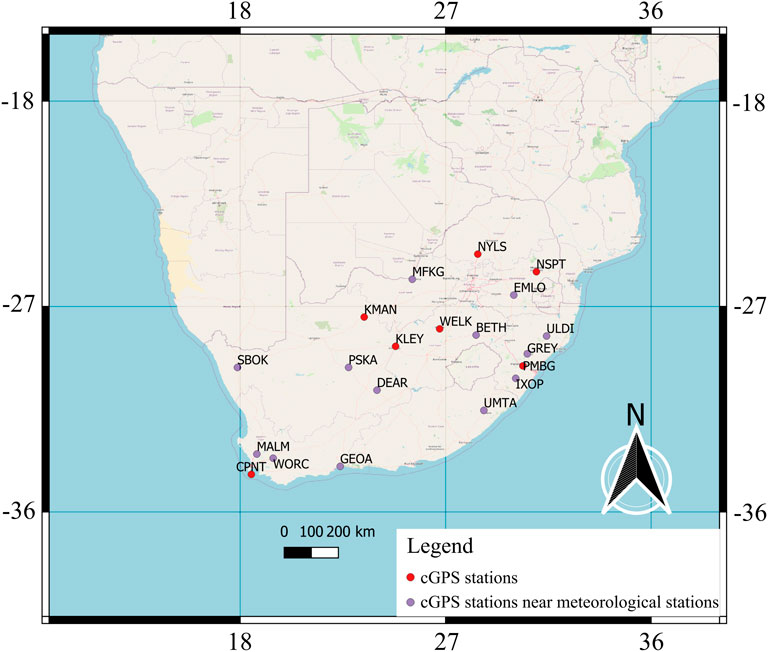
FIGURE 3. Spatial distribution of the chosen cGPS and meteorological stations. 28.
Analysis Techniques
Inferential signal processing techniques were used to explore the nature of the chosen cGPS and meteorological datasets and to infer their relationships. The time series were decomposed and correlated in the time, frequency, and time-frequency domains. The various analysis techniques are briefly described below.
Spearman’s correlation coefficient (rho) is a nonparametric (distribution free) rank correlation time domain technique defined as (Gauthier, 2001; Mukaka, 2012):
where
The Fourier Transform (FT) is a frequency domain decomposition technique used in this study to uncover the dominant frequency components of the cGPS and meteorological time series. The FT
where
The magnitude-squared coherence (MSC) is a complex frequency domain technique used in this study to determine and quantify the relationship strength of the components of the cGPS and meteorological time series in the frequency domain (Torrence and Compo, 1998; Friston et al., 2011). The technique is mathematically defined as:
where
The continuous wavelet transform (CWT) is a time-frequency domain decomposition technique used in this study to decompose the cGPS and meteorological time series. The CWT is good at analyzing both continuous and discrete time series; unlike the FT, it is also good at decomposing non-stationary time series (Zhao et al., 2004; Baker, 2007; Kaiser, 2011). The CWT is mathematically defined as (Mallat, 1998, p. 5):
where s and u are the scale and translation (position) factors, respectively, f(t) is the time domain function being decomposed,
where
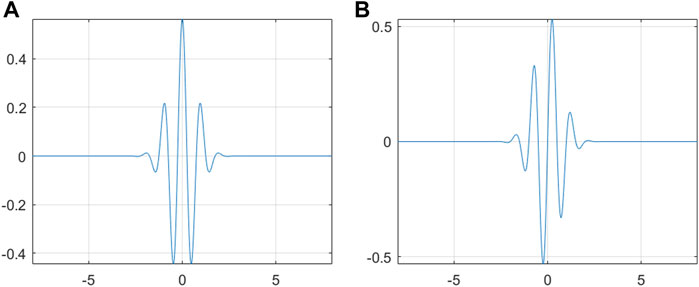
FIGURE 4. (A) Real part of the complex Morlet wavelet and (B) Imaginary part of the complex Morlet wavelet. 28.
The wavelet-based semblance (WS) is a qualitative time-frequency domain technique used in this study to correlate the cGPS and meteorological time series in the time-frequency domain. Since the method uses phase information, it can be used to compute the correlation of time series with different units of measure and is mathematically defined as (Christensen, 2003; Cooper, 2009).
where n is an odd integer greater than zero, that allows the response of the technique to be refined, in this paper, n = 1 was used to compute the semblance results, while
Results and Interpretation
FFT and CWT Decomposition Analysis
Surface Displacement
Frequency and time-frequency domain decomposition results show that surface displacement time series consist of an annual and semi-annual deformation component (Figures 5A, 6A, 7A, Supplementary Material Appendix 1, Figures 1, 2, 3). The power of the annual displacement component is larger than that of the semi-annual component at most stations, often by one order of magnitude (Table 1). This is consistent with the findings in other areas of the world (Ray et al., 2008). The power of the time series varies systematically between the different climatic zones (Table 1). This implies that the magnitude of seasonal weather variation within a climatic zone has an influence on the magnitude of the deformation components observed in the surface displacement time series. The annual displacement components are largest in cGPS data from the Desert climatic zone and lower in time series at stations located in the Wet and Dry Tropical climatic zones (Table 1). The CWT spectrums show slight variation in cycle periods and frequency (non-stationarity) of the time series over time, this is characteristic of signals in the real environment (Figure 7).
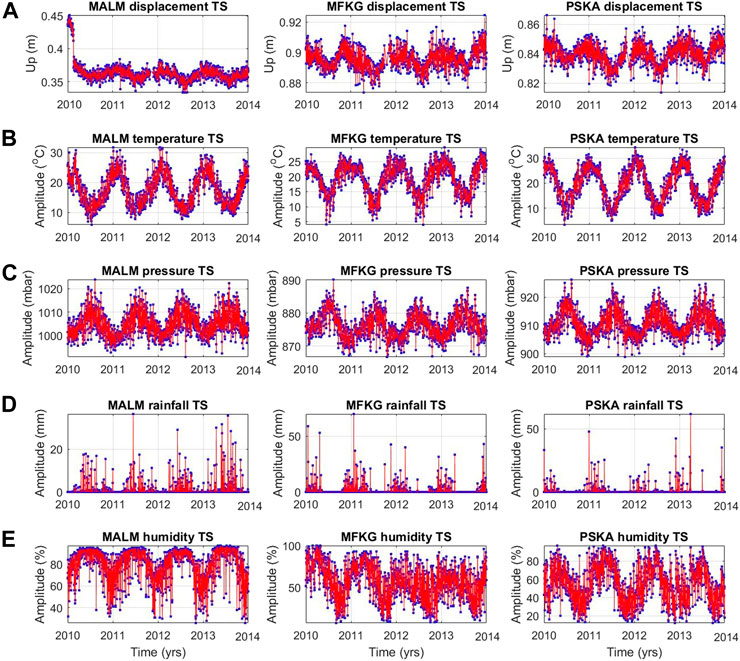
FIGURE 5. Time domain displacement and meteorological time series at stations MALM, MFKG, and PSKA situated in the towns of Malmesbury, Mahikeng, and Prieska, respectively, the station names are the abbreviations of the town names where they are located. (A) cGPS surface displacement, (B) atmospheric temperature, (C) atmospheric pressure, (D) rainfall, and (E) humidity time series across stations in southern Africa. Due to a lack of space and similarity of the results, results for only three stations are shown. 29.
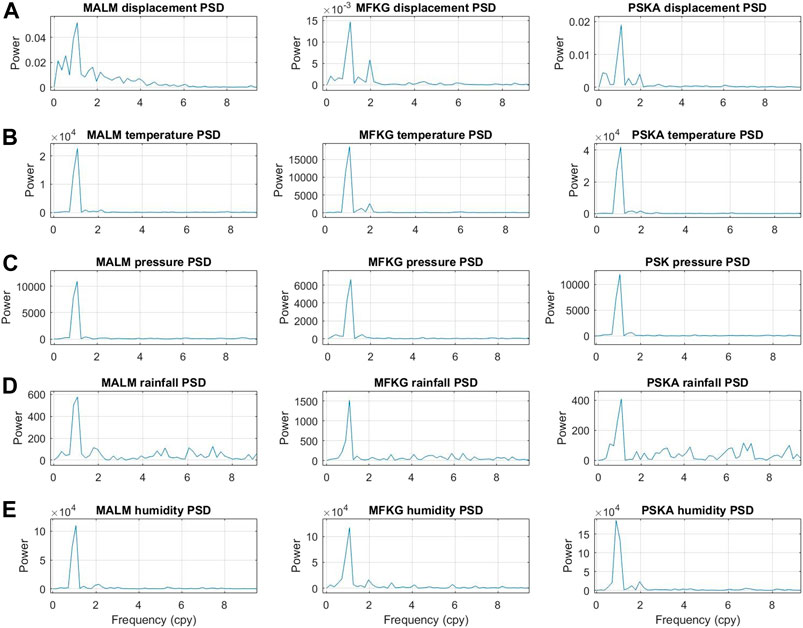
FIGURE 6. Fourier power spectra. (A) cGPS surface displacement, (B) atmospheric temperature, (C) atmospheric pressure, (D) rainfall, and (E) humidity decomposition spectra. 30.
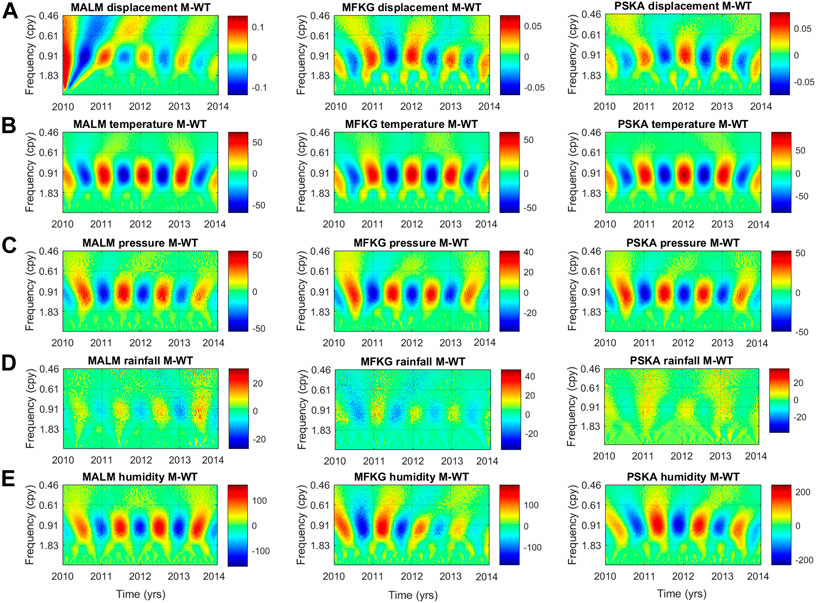
FIGURE 7. Wavelet Transform (WT) decomposition spectra. (A) cGPS surface displacement, (B) atmospheric temperature, (C) atmospheric pressure, (D) rainfall, and (E) humidity decomposition spectra. Some of the characteristic CWT features observed in the plots are the exaggeration of low frequencies, suppression of high frequencies, and component frequency overlap. The spectra are also characterised by good time localisation. 31.
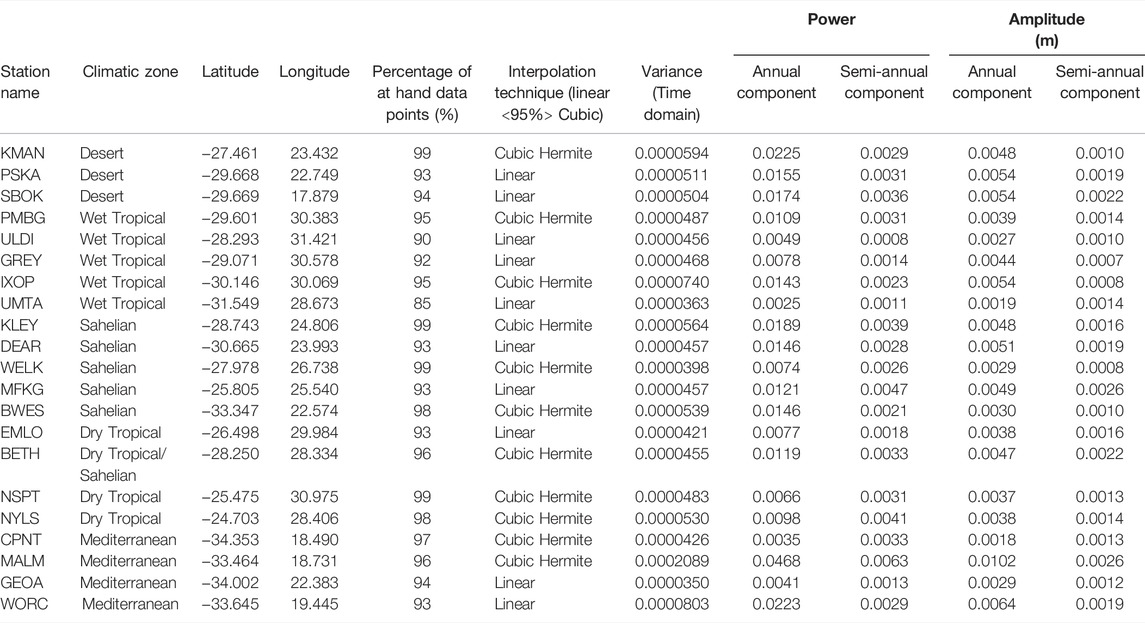
TABLE 1. Climatic zone, latitude longitude, power, and amplitude of the analysed cGPS station, displacement time series.
Atmospheric Temperature
Atmospheric temperature time series are predominantly composed of an annual and semi-annual seasonal component. (Figures 5B, 6B, 7B, Supplementary Material Appendix 2, Figures 4, 5, 6). The semi-annual component is absent in the temperature time series in the Mediterranean climatic zone. The temperature time series are also characterised by a low noise level and a high degree of stationarity (Figures 6B, 7B, Supplementary Material Appendix 2, Figures 4, 5, 6). Annual seasonal temperature fluctuations are higher in time series from the Desert and Sahelian climatic zones, regions where the Intertropical Convergence Zone (ITCZ) does not move over, and lower in time series from the Dry and Wet Tropical climatic zones - regions where the ITCZ passes over (Table 2). This is because areas characterised by low levels of cloudiness are characterised by high temperatures and extreme seasonal temperature fluctuation, while areas of high cloudiness are characterised by low temperatures and low-temperature fluctuation, except during tropical storms (Hobbs et al., 1998; Barry and Chorley, 2010).
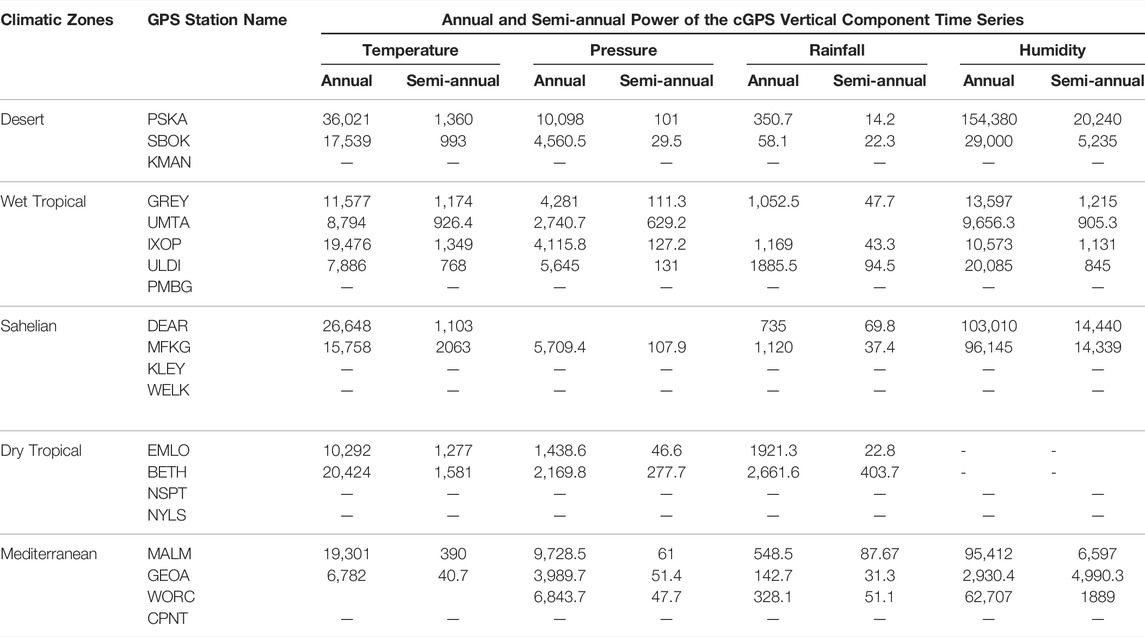
TABLE 2. Quantified power of the annual and semi-annual frequency components forming the meteorological time series as obtained from FFT.
Atmospheric Pressure
Atmospheric pressure time series consist only of the annual seasonal component (Figures 5C, 6C, 7C, Supplementary Material Appendix 2, Figures 7, 8, 9). The time series are characterised by low levels of noise, variance, spectral averaging, and a high degree of stationarity (Figures 6C, 7C). Seasonal atmospheric pressure fluctuations are higher at stations from the Desert and Mediterranean climatic zones and lower at stations from the Wet and Dry Tropical climatic zones (Table 2). This is because subtropical deserts are high seasonal atmospheric pressure zones due to the seasonal presence of Hadley cells over them, and tropical climatic regions are low atmospheric pressure fluctuation zones (Nicholson and Flohn, 1980; Barry and Chorley, 2010; Bollasina and Nigam, 2010). Insolation differences due to the absence and presence of clouds in the Desert and Tropical climatic zones, respectively, may also play a role.
Rainfall
Rainfall time series predominantly consist of an annual seasonal component only, the phase of the annual component varies moving across the central, north-eastern, and south-western parts of southern Africa (Figures 5D, 6D, 7D, Supplementary Material Appendix 2, Figures 10, 11, 12). The time series are characterised by a high degree of noise and variance, which, according to Potter and Colman (2003), Jury (2013) and MacKellar et al. (2014) is caused by processes, such as the ITCZ, solar radiation, El Niño-Southern Oscillation (ENSO), and variations in atmospheric circulation. Seasonal rainfall fluctuations are higher in time series from the Wet and Dry Tropical climatic zones and low in time series from the Desert climatic zone (Table 2). These findings are consistent with known information, i.e., continental Dry and Wet Tropical climatic zones are characterised by well-defined alternating high rainfall and dry seasons (Hepburn and Radloff, 1998; Barry and Chorley, 2010).
Humidity
Humidity data consist of an annual and semi-annual seasonal component, except for stations in the Wet Tropical climatic zone (Figures 5E, 6E, 7E, Supplementary Material Appendix 2, Figures 13, 14, 15). The phase of the humidity time series varies as a function of time and spatial geographic location, similar to rainfall time series but less defined. In general, in the central and north-eastern parts of southern Africa, the moisture content is high during summer and low during winter; while in the south-western parts of southern Africa, humidity levels are high during winter and low during summer. It is important to note that at some stations (e.g., PSKA), a deviation is observed from this general trend. It is also observed that humidity fluctuations are greater in the semi-arid regions than in tropical regions, which could be because annual humidity fluctuation is more defined in the semi-arid region than in the tropics.
Correlation Analysis
The time, frequency, and time-frequency domain comparisons show that surface displacement is directly and inversely proportional to atmospheric temperature and pressure changes, respectively. The correlation between atmospheric temperature, pressure, and surface displacement is highest in stations in the Desert, Sahelian, and Mediterranean climatic zones (Tables 3, 4), these are zones that receive the most solar radiation, heat, and least amount of water in southern Africa. The displacement-temperature correlation is observed to be smallest in the Dry and Wet Tropical climatic zones, which are climatic zones that are cooler and receive the most amounts of rainfall. In addition, the frequency and phase correlation results between surface displacement-temperature and surface displacement-pressure time series show a high and consistent frequency and phase correlation between the time series (Figures 8A,8B, 9A,9B, Supplementary material Appendix 3: Figures 16, 17).
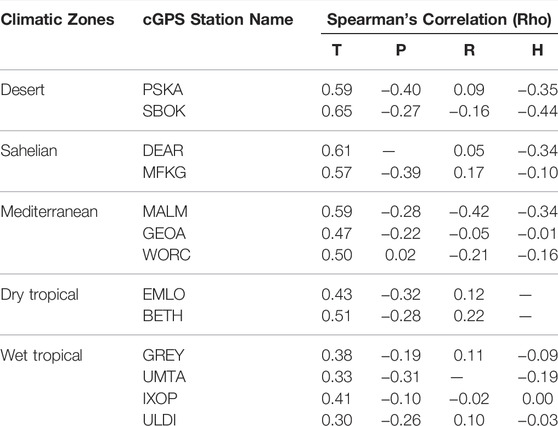
TABLE 3. Displacement time series correlation values with atmospheric temperature (T), atmospheric pressure (P), rainfall (R), and humidity (H) time series at the selected stations in southern Africa.
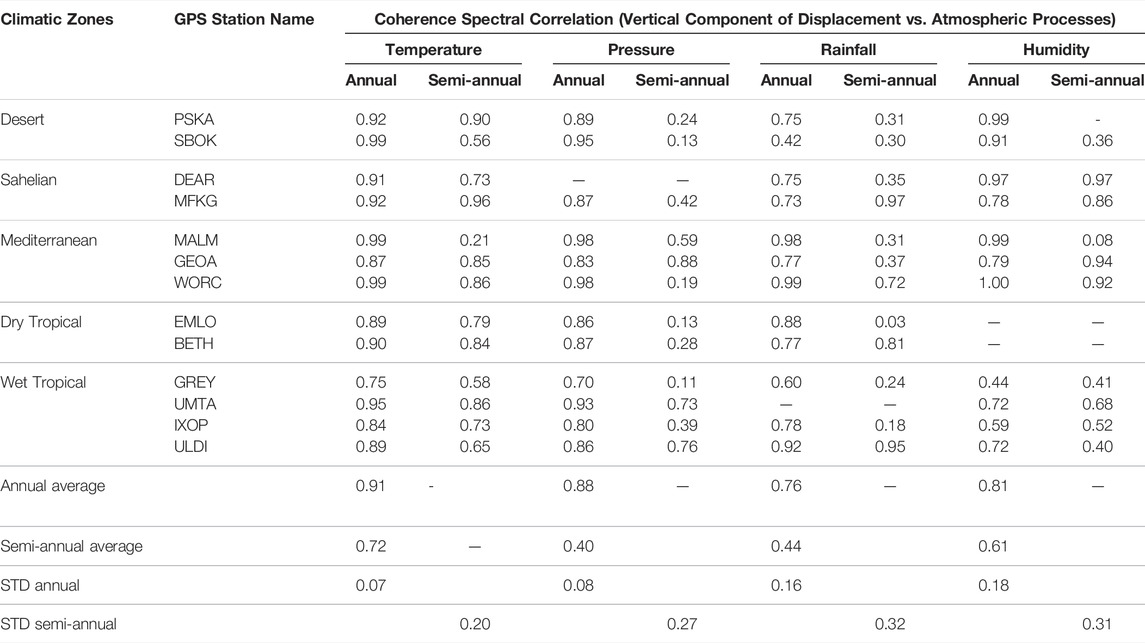
TABLE 4. Coherence correlation strength of displacement vs. meteorological (average temperature, pressure, rainfall, and humidity) processes.
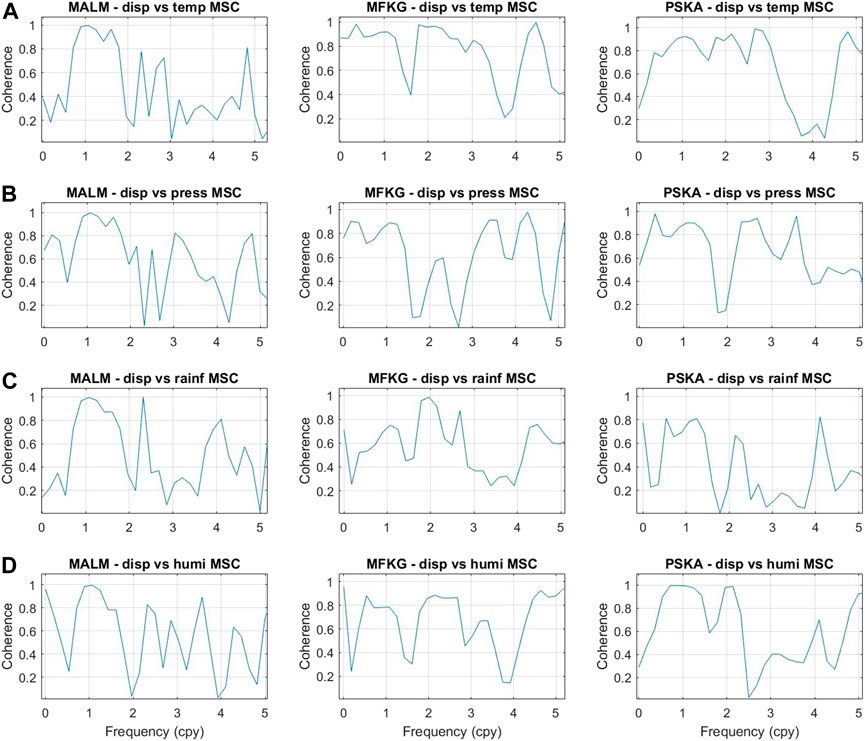
FIGURE 8. cGPS surface displacement and meteorological time series coherence correlation spectra. (A) displacement-temperature (disp vs. temp), (B) displacement-atmospheric pressure (disp vs. pressure), (C) displacement-rainfall (disp vs. rainf), and (D) displacement-humidity (disp vs. humi). 32.
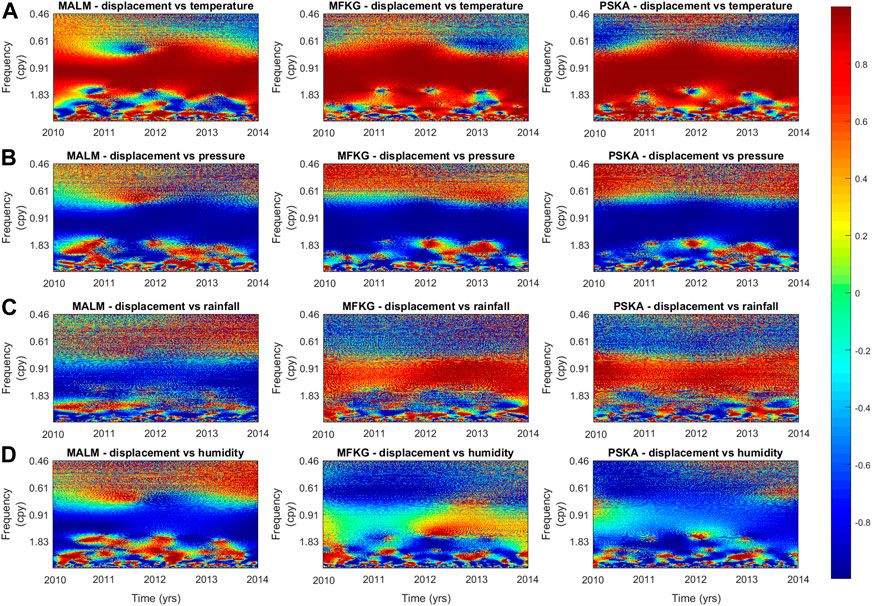
FIGURE 9. cGPS surface displacement and meteorological time series wavelet-based semblance correlation spectra. (A) cGPS surface displacement-temperature spectra, (B) cGPS surface displacement-atmospheric spectra, (C) cGPS surface displacement-rainfall spectra, (D) cGPS surface displacement-humidity spectra. 32.
Depending on the spatial location, rainfall and humidity time series are either directly or inversely correlated to surface displacement time series. The correlation of the time series is low in the time domain, that of the annual component is high to moderate in the frequency and time-frequency domains (Tables 3, 4; Figures 8C, D, 9C, D, Supplementary Material Appendix 3: Figures 16, 17). The displacement-rainfall and displacement-humidity correlation, at certain locations, is observed to be inconsistent over time (Figure 9).
The relation between the semi-annual component of the temperature and humidity time series with that of the cGPS surface displacement is too inconsistent to suggest that any of the considered meteorological processes have an influence, if at all, on the semi-annual deformation components (Table 4) (Figure 8).
Discussion
Meteorological Time Series
The temperature, pressure, rainfall, and humidity fluctuations in southern Africa are primarily controlled by the complex interaction between midlatitude, tropical, and subtropical climate systems, together with the development, seasonal positional-shift, and interaction of atmospheric and oceanic circulation systems of the Atlantic, Indian, and Southern oceans (Chase and Meadows, 2007). This is apparent in the temperature and pressure data in southern Africa, which appear to be controlled by 1) the seasonal variation in the Sun’s radiation, 2) migration of the ITCZ away from the southern hemisphere (after summer periods) to the northern hemisphere, and 3) a shift of anticyclones from the southern Atlantic and Indian oceans towards the southern Africa continent in winter (Hobbs et al., 1998; Sun et al., 2017; Byrne et al., 2018).
The ITCZ is also the primary source of rainfall activity in the central and north-eastern parts of southern Africa, thus these regions are summer rainfall regions. In the south-western parts of southern Africa, rainfall is associated with the winter inflow of low- and high-level westerlies that carry moist air (Ellis and Galvin, 1994; Barry and Chorley, 2010).
Moist air, in the central and north-eastern parts of southern Africa, is brought by inflowing easterlies that carry moist air from the southwest Indian Ocean and warm Agulhas currents (Chase and Meadows, 2007; Jury, 2013). In the south-western parts of southern Africa, moist air is brought about by westerlies as they move towards the equator during winter (Chase and Meadows, 2007).
Displacement Time Series
Similar to the studies conducted by Dong et al. (2002) and Ray et al. (2008), using a global dataset and Earth model, cGPS displacement time series in southern Africa are found to consist of two dominant seasonal components. Dong et al. (2002), Romagnoli et al. (2003) and Xu et al. (2017) link these deformation components to gravitational attraction, thermal, hydrodynamical, unmodeled, and error-related processes. The observed systematic variation of the power of the displacement time series suggests that the magnitude of seasonal weather variation within a climatic zone has an influence on the magnitude of the deformation components observed in the cGPS surface displacement time series. It indicates that changes in atmospheric temperature, atmospheric pressure, rainfall, and humidity processes in each climatic zone do have an influence on the surface deformation recorded by cGPS station. These findings demonstrate the influence of local effects on cGPS measurements, which is consistent with what has been found in other studies (Romagnoli et al., 2003; Nahmani et al., 2012; Fu et al., 2013; Knowles et al., 2020).
Meteorological Processes and Surface Displacement Relation
Generally, high temperatures cause thermal expansion of consolidated soil particles and water molecules in the near subsurface, expansion of the concrete and metallic components of the cGPS station, and the expansion of atmospheric air mass density (which results in a reduction in atmospheric pressure); all these phenomena may affect cGPS measurements. The opposite is thought to apply in cold conditions (i.e., winter), which might explain the high correlation observed between atmospheric temperature, pressure, and vertical displacement changes.
The type of interaction (viz. reinforcement or opposition) between rainfall and humidity effects vs temperature and pressure effects on surface displacement is thought to vary spatially as postulated below:
1 In southern Africa’s central and north-eastern parts, the rainfall-displacement and humidity-displacement time series are largely directly correlated. Thus, in summer, constructive interference may occur between rainfall and humidity surface deformation effects, with surface deformation effects induced by variations in atmospheric temperature and atmospheric pressure. Constructive interference may be occurring between surface deformation effects due to swelling on soil absorption of water and the seasonal tropospheric error introduced in the cGPS datasets due to high rainfall and humidity levels; with thermal expansion effects caused by thermal expansion of soil particles and water molecules in the near subsurface; and thermal expansion of concrete and metallic components of the cGPS stations in response to the prevalence of high temperatures and low atmospheric pressure.
2 In the south-western parts of southern Africa, the rainfall-displacement and humidity-displacements are anticorrelated. Thus, in winter, destructive interference may occur between rainfall- and humidity-induced surface deformation effects, with surface deformation effect induced by variations in atmospheric temperature and atmospheric pressure. In addition, destructive interference may occur between surface deformation effects due to soil absorption of water molecules and the seasonal tropospheric error introduced in the cGPS datasets due to high rainfall and humidity levels, with thermal contraction effects due to the contraction of soil particles and water molecules in the near subsurface, and thermal contraction of concrete and metallic components of the cGPS stations in response to the prevalence of cold temperatures and high atmospheric pressure.
The spatially inconsistent and weak relationship between surface displacement, rainfall, and humidity processes observed from time, frequency, and time-frequency correlation is interpreted to imply that rainfall and humidity processes have little influence on seasonal surface displacement variations. Thus, deformation due to surficial hydrology (i.e., gravitational loading and soil consolidation induced by changes in surface and ground water levels) is also observed to have lesser influence on the seasonal surface displacement variations, the dominant factor is temperature. These findings are different to what has been found in other research studies and highlight the importance of carrying out thermal corrections (Wahr et al., 2004; Schmidt et al., 2006; Nahmani et al., 2012).
Conclusion
This study examines cGPS surface displacement and meteorological time series with the aim of improving their understanding and inferring the seasonal influence that the meteorological processes considered in this study have on surface displacement measurements measured by cGPS systems in southern Africa. Atmospheric temperature variations (thermoelastic effects) are found to have higher correlation with surface displacement time series, suggesting a greater thermal influence on the surface displacement measurements than water mass changes. These findings imply that correcting for thermal expansion effects in summer, thermal contraction in winter, and thermally-induced seasonal errors (thermoelastic effects) could reduce the seasonal variations observed in cGPS displacement time series in southern Africa and increase the accuracy of the cGPS displacement measurements. In turn, this could improve the accuracy of short-term crustal deformation measurements and their usefulness, for example, in the assessment of seismic hazard.
Data Availability Statement
The datasets presented in this study can be found in online repositories. The names of the repository/repositories and accession number(s) can be found in the article/Supplementary Material.
Author Contributions
SG wrote the manuscript under the supervision of GC, RD, and MM. All authors reviewed the final manuscript.
Funding
Council for Geoscience NRF through the South African Research Chairs Initiative (SARChI).
Conflict of Interest
The authors declare that the research was conducted in the absence of any commercial or financial relationships that could be construed as a potential conflict of interest.
Publisher’s Note
All claims expressed in this article are solely those of the authors and do not necessarily represent those of their affiliated organizations, or those of the publisher, the editors and the reviewers. Any product that may be evaluated in this article, or claim that may be made by its manufacturer, is not guaranteed or endorsed by the publisher.
Acknowledgments
We would like to acknowledge the Council for Geoscience and CIMERA for funding this research work, the South African Weather Service (SAWS), and TrigNet for providing the meteorological and availing the cGPS displacement data used to conduct the research. Special thanks go to the Department of Geophysics at the University of the Witwatersrand for providing the platform to carry out this work and its staff for providing constructive feedback on the work. RD acknowledges support from the NRF through the South African Research Chairs Initiative (SARChI). Some of the work presented here is part of the first author’s MSc thesis, titled: Analysing ground surface position cGPS and meteorology measurements in southern Africa using signal processing techniques (Gomo, 2019).
Supplementary Material
The Supplementary Material for this article can be found online at: https://www.frontiersin.org/articles/10.3389/feart.2022.827011/full#supplementary-material
References
Altamimi, Z., Rebischung, P., Métivier, L., Collilieux, X., and Baker, J. W. (2016). ITRF2014: A New Release of the International Terrestrial Reference Frame Modeling Nonlinear Station motionsQuantitative Classification of Near-Fault Ground Motions Using Wavelet Analysis. J. Geophys. Res. Solid EarthBulletin Seismol. Soc. Am. 12197, 61091486–61311501. doi:10.1785/012006025510.1002/2016jb013098
Argus, D. F., Fu, Y., and Landerer, F. W. (2014). Seasonal Variation in Total Water Storage in California Inferred from GPS Observations of Vertical Land Motion. Geophys. Res. Lett. 41, 1971–1980. doi:10.1002/2014gl059570
Baker, J. W. (2007). Quantitative classification of near-fault ground motions using wavelet analysis. Bull. Seismol. Soc. Am. 97, 1486–1501. doi:10.1785/0120060255
Barry, R. G., and Chorley, R. J. (2010). Atmosphere, Weather and Climate. 9th edition. London, UK: Routledge Taylor & Francis Group.
Blewitt, G., Hammond, W., and Kreemer, C. (2018). Harnessing the GPS Data Explosion for Interdisciplinary Science. Eos 99. doi:10.1029/2018EO104623
Bollasina, M., and Nigam, S. (2010). The Summertime “Heat” Low over Pakistan/northwestern India: Evolution and Origin. Clim. Dyn. 37, 957–970. doi:10.1007/s00382-010-0879-y
Byrne, M. P., Pendergrass, A. G., Rapp, A. D., and Wodzicki, K. R. (2018). Response of the Intertropical Convergence Zone to Climate Change: Location, Width, and Strength. Curr. Clim. Change Rep. 4, 355–370. doi:10.1007/s40641-018-0110-5
Chase, B. M., and Meadows, M. E. (2007). Late Quaternary Dynamics of Southern Africa's Winter Rainfall Zone. Earth-Science Rev. 84, 103–138. doi:10.1016/j.earscirev.2007.06.002
Christensen, A. N. “Semblance Filtering of Airborne Potential Field Data,” in Proceedings of the Extended Abstracts, 16th ASEG Geophysical Conference and Exhibition, Adelaide, Australia, February 2003. (2003). doi:10.1071/aseg2003ab024
Cilliers, P. J., Opperman, B. D. L., Mitchell, C. N., and Spencer, P. J. (2004). Electron Density Profiles Determined from Tomographic Reconstruction of Total Electron Content Obtained from GPS Dual Frequency Data: First Results from the South African Network of Dual Frequency GPS Receiver Stations. Adv. Space Res. 34, 2049–2055. doi:10.1016/j.asr.2004.08.002
Cochran, W. T., Cooley, J. W., Favin, D. L., Helms, H. D., Kaenel, R. A., Lang, W. W., et al. (1967). What Is the Fast Fourier Transform? Proc. IEEE 55, 1664–1674. doi:10.1109/proc.1967.5957
Cooper, G. R. J., and Cowan, D. R. (2008). Comparing Time Series Using Wavelet-Based Semblance Analysis. Comput. Geosciences 34, 95–102. doi:10.1016/j.cageo.2007.03.009
Cooper, G. R. J. (2009). Wavelet-based Semblance Filtering. Comput. Geosciences 35, 1988–1991. doi:10.1016/j.cageo.2008.10.017
Davis, J. L., Elsegue, P., Mitrovica, J. X., and Tamisiea, M. E. (2004). Climate-driven Deformation of the Solid Earth from GRACE and GPS. Geophys. Res. Lett. 31, 1–4. doi:10.1029/2004GL021435
Dong, D., Fang, P., Bock, Y., Cheng, K. M., and Miyazaki, S. (2002). Anatomy of Apparent Seasonal Variations from GPS-Derived Site Position Time Series. J. Geophys. Res. 107, 1–17. doi:10.1029/2001jb000573
Ellis, J., and Galvin, K. A. (1994), Climate Patterns and Land-Use Practices in the Dry Zones of Africa, BioScience 44, 340–349.doi:10.2307/1312384
Fletcher, P., and Sangwine, S. J. (2017). The Development of the Quaternion Wavelet Transform. Signal Process. 136, 2–15. doi:10.1016/j.sigpro.2016.12.025
Friston, K. J., Bastos, A., Litvak, V., Stephan, K. E., Fries, P., and Moran, R. J. (2012), DCM for Complex-Valued Data: Cross-Spectra, Coherence and Phase-Delays, NeuroImage 59, 439–455. doi:10.1016/j.neuroimage.2011.07.048
Fu, Y., Argus, D. F., Freymueller, J. T., and Heflin, M. B. (2013). Horizontal Motion in Elastic Response to Seasonal Loading of Rain Water in the Amazon Basin and Monsoon Water in Southeast Asia Observed by GPS and Inferred from GRACE. Geophys. Res. Lett. 40, 6048–6053. doi:10.1002/2013GL058093
Gauthier, T. (2001). Detecting Trends Using Spearman's Rank Correlation Coefficient. Environ. Forensics 2, 359–362. doi:10.1006/enfo.2001.0061
Gomo, S. (2019). Analysing Ground Surface Position cGPS and Meteorology Measurements in Southern Africa Using Signal Processing Techniques. Johannesburg, Africa. University of the Witwatersrand. MSc dissertation
Graps, A. (1995). An Introduction to Wavelets. IEEE Comput. Sci. Eng. 2, 50–61. doi:10.1109/99.388960
He, X., Hua, X., Yu, K., Xuan, W., Lu, T., Zhang, W., et al. (2015). Accuracy Enhancement of GPS Time Series Using Principal Component Analysis and Block Spatial Filtering. Adv. Space Res. 55, 1316–1327. doi:10.1016/j.asr.2014.12.016
Hepburn, H. R., and Radloff, S. E. (1998). Honeybees of Africa. Berlin, Germany. Springer-Verlag Berlin Heidelberg GmBH, United States of America. doi:10.1007/978-3-662-03604-4
Hobbs, J. E., Lindesay, L. A., and Bridgman, H. A. (1998). Climate of the Southern Continents: Present, Past and Future. New York, NY, USA: John Wiley & Sons.
Issartel, J., Bardainne, T., Gaillot, P., and Marin, L. (2015). The relevance of the cross-wavelet transform in the analysis of human interaction-a tutorial. Frontiers in Psychology 5, 1566. doi:10.3389/fpsyg.2014.01566
Kaiser, G. (2011). A Friendly Guide to Wavelets. Basel, Switzerland. Birkhuser. doi:10.1007/978-0-8176-8111-1
Knowles, L. A., Bennett, R. A., and Harig, C. (2020). Vertical Displacement of the Amazon Basin from GRACE and GPS. J. Geophys. Res. 125. doi:10.1029/2019JB018105
MacKellar, N., New, M., and Jack, C. (2014). Observed and Modelled Trends in Rainfall and Temperature for South Africa: 1960-2010. Sajs 110, 1–13. doi:10.1590/sajs.2014/20130353
Mallat, S. (2009). A Wavelet Tour of Signal Processing. 3rd edition. Cambridge, MA, USA: Academic Press.
Malservisi, R., Hugentobler, U., Wonnacott, R., and Hackl, M. (2013). How Rigid Is a Rigid Plate? Geodetic Constraint from the TrigNet CGPS Network, South Africa. Geophys. J. Int. 192, 918–928. doi:10.1093/gji/ggs081
Meyers, S. D., Kelly, B. G., and O'Brien, J. J. (1993). An Introduction to Wavelet Analysis in Oceanography and Meteorology: with Application to the Dispersion of Yanai Waves. Mon. Wea. Rev. 121, 2858–2866. doi:10.1175/1520-0493(1993)121<2858:aitwai>2.0.co;2
Min, W., Zheng-Kang, S., and Da-Nan, D. (2005). The Effect and Correction of Non-tectonic Crustal Deformation and Continuous GPS Position Time Series. Chin. J. Geophys. 48, 1121–1129. doi:10.1002/cjg2.755
Mukaka, M. M. (2012). Statistics Corner: A Guide to Appropriate Use of Correlation Coefficient in Medical Research. Malawi Med. J. 24, 69–71. doi:10.1016/j.cmpb.2016.01.020
Nahmani, S., Bock, O., Bouin, M.-N., Santamaría-Gómez, A., Boy, J.-P., Collilieux, X., et al. (2012). Hydrological Deformation Induced by the West African Monsoon: Comparison of GPS, GRACE and Loading Models. J. Geophys. Res. 117, a–n. doi:10.1029/2011JB009102
Nicholson, S. E., and Flohn, H. (1980). African Environmental and Climatic Changes and the General Atmospheric Circulation in Late Pleistocene and Holocene. Clim. Change 2, 313–348. doi:10.1007/bf00137203
Potter, T. R., and Colman, B. R. (2003). Handbook of Weather, Climate, and Water: Atmospheric Chemistry, Hydrology and Social Impacts. Hoboken, NJ, USA: John Wiley & Sons.
Rabbel, W., and Schuh, H. (1986). The Influence of Atmospheric Loading on VLBI-Experiments. J. Geophys. 59, 164–170.
Ray, J., Altamimi, Z., Collilieux, X., and van Dam, T. (2008). Anomalous Harmonics in the Spectra of GPS Position Estimates. GPS Solut. 12, 55–64. doi:10.1007/s10291-007-0067-7
Rebischung, P., Altamimi, Z., Ray, J., and Garayt, B. (2016). The IGS Contribution to ITRF2014. J. Geod. 90, 611–630. doi:10.1007/s00190-016-0897-6
Romagnoli, C., Zerbini, S., Lago, L., Richter, B., Simon, D., Domenichini, F., et al. (2003). Influence of Soil Consolidation and Thermal Expansion Effects on Height and Gravity Variations. J. Geodyn. 35, 521–539. doi:10.1016/S0264-3707(03)00012-7
Ryan, O. (2015). Linear Algebra, Signal Processing, and Wavelets: a Unified Approach-MATLAB Version. Available from: https://www.uio.no/studier/emner/matnat/math/nedlagte-emner/MAT-INF2360/v15/kompendium/applinalgmatlab.pdf.
Schmidt, R., Schwintzer, P., Flechtner, F., Reigber, C., Guntner, A., Doll, P., et al. (2006). GRACE Observations of Changes in Continental Water Storage. Glob. Planet. Change 50, 112–126. doi:10.1016/j.gloplacha.2004.11.018
Struzik, Z. R. (2001). Wavelet Methods in (Financial) Time-Series Processing. Phys. A Stat. Mech. its Appl. 296, 307–319. doi:10.1016/s0378-4371(01)00101-7
Sun, X., Cook, K. H., and Vizy, E. K. (2017). The South Atlantic Subtropical High: Climatology and Interannual Variability. J. Clim. 30, 3279–3296. doi:10.1175/JCLI-D-16-0705.1
Teolis, A. (1998). Computational Signal Processing with Wavelets. Boston, MA, USA: Birkhuser Boston Inc.
Torrence, C., and Compo, G. P. (1998). A Practical Guide to Wavelet Analysis. Bull. Amer. Meteor. Soc. 79, 61–78. doi:10.1175/1520-0477(1998)079<0061:apgtwa>2.0.co;2
van Dam, T. M., and Wahr, J. (1998). Modeling Environment Loading Effects: a Review. Phys. Chem. Earth 23, 1077–1087. doi:10.1016/S0079-1946(98)00147-5
van Dam, T., Wahr, J., Milly, P. C. D., Shmakin, A. B., Blewitt, G., Lavallée, D., et al. (2001). Crustal Displacements Due to Continental Water Loading. Geophys. Res. Lett. 28, 651–654. doi:10.1029/2000gl012120
Wahr, J., Swenson, S., Zlotnicki, V., and Velicogna, I. (2004). Time-variable Gravity from GRACE: First Results. Geophys. Res. Lett. 31, a–n. doi:10.1029/2004GL019779
Xu, X., Dong, D., Fang, M., Zhou, Y., Wei, N., and Zhou, F. (2017). Contributions of Thermoelastic Deformation to Seasonal Variations in GPS Station Position. GPS Solut. 21, 1265–1274. doi:10.1007/s10291-017-0609-6
Yan, H., Chen, W., Zhu, Y., Zhang, W., and Zhong, M. (2009). Contributions of Thermal Expansion of Monuments and Nearby Bedrock to Observed GPS Height Changes. Geophys. Res. Lett. 36, 1–5. doi:10.1029/2009GL038152
Keywords: Signal processing, meteorological, cGPS, wavelet, Fourier, semblance, southern Africa
Citation: Gomo S, Cooper GRJ, Durrheim RJ and Manzi MSD (2022) Influence of Meteorological Processes on cGPS Measurements of Crustal Movements. Front. Earth Sci. 10:827011. doi: 10.3389/feart.2022.827011
Received: 01 December 2021; Accepted: 19 April 2022;
Published: 12 May 2022.
Edited by:
Mourad Bezzeghoud, Universidade de Évora, PortugalReviewed by:
Yuanjin Pan, Wuhan University, ChinaAlexis Rigo, Laboratoire de géologie de l'Ecole Normale Supérieure (LG-ENS), France
Copyright © 2022 Gomo, Cooper, Durrheim and Manzi. This is an open-access article distributed under the terms of the Creative Commons Attribution License (CC BY). The use, distribution or reproduction in other forums is permitted, provided the original author(s) and the copyright owner(s) are credited and that the original publication in this journal is cited, in accordance with accepted academic practice. No use, distribution or reproduction is permitted which does not comply with these terms.
*Correspondence: Sikelela Gomo, c2lrZWxlbGFnb21vQGdtYWlsLmNvbQ==