
95% of researchers rate our articles as excellent or good
Learn more about the work of our research integrity team to safeguard the quality of each article we publish.
Find out more
ORIGINAL RESEARCH article
Front. Earth Sci. , 10 February 2022
Sec. Atmospheric Science
Volume 10 - 2022 | https://doi.org/10.3389/feart.2022.824769
This article is part of the Research Topic Landfalling Tropical Cyclones: Physical Processes, Forecasting and Impacts View all 26 articles
This study investigates the variation in large-scale parameters associated with two types of El Niño and their impact on tropical cyclone (TC) activity over the Bay of Bengal (BoB) from 1980 to 2019. The Genesis Potential Index (GPI)-based quantitative evaluation was conducted to compute the relative contribution of ENSO and El Niño flavor–associated large-scale parameters. Relationship between the GPI and ENSO in the primary TC peak season (October–November; OND) exhibits a distinct meridional pattern over southwestern to northeastern parts of the BoB. Moreover, the results show that ENSO-modulated vertical wind shear (VWS) term (relative humidity; RH term) contributes the most to enhancing (suppressing) the GPI over the southwestern (northeastern) BoB during the primary TC peak season. The GPI exhibits a significantly positive (negative) dipole pattern with EP El Niño in the southern (northern) BoB, while CP El Niño shows a southwestern (positive)–northeastern (negative) meridional pattern. The increased GPI in the southern BoB with EP El Niño is due mainly to the VWS term, while RH term makes a minimal contribution. Similarly, during CP El Niño, VWS term contributes the most to the enhancement of the GPI, while the smallest contribution is from potential intensity (PI) term. Moreover, this study reveals that the thermodynamic (RH) factor is crucial in reducing TC genesis during CP El Niño in the northeastern BoB. On the other hand, the dynamic (VWS) and thermodynamic (RH) terms are almost equally important for suppressing TCs over the northern BoB in EP El Niño.Analysis of the secondary TC peak season (April–June; AMJ) demonstrates that CP El Niño and EP El Niño induce an increase and decrease in the GPI in the southern BoB mainly due to the dynamic factor (VWS term) and thermodynamic factor (RH term), respectively. On the other hand, TCs in AMJ are more favorable to occur in the south of BoB during CP El Niño events. The two types of El Niño-associated physical mechanisms are consistent with the diagnosed GPI changes, emphasizing the vital role of both EP and CP El Niño in influencing thermodynamic and dynamic parameters related to TC genesis over the BoB. Thus, the association of CP and EP El Niño with the GPI provides a valuable platform for studying El Niño–generated TC impacts over the BoB.
Tropical cyclones (TCs) are among the most destructive natural disasters in the world. The Bay of Bengal (BoB) accounts for an average of 5–6 cyclones among the world’s TCs each year (Pal and Chatterjee, 2020). Though this is a low number, TCs in the BoB basin result in a massive death toll compared to other regions. For instance, the Great Bhola Cyclone in 1970 killed more than 300,000 people and remains one of the deadliest natural disasters in the world (Frank and Husain, 1971; Dube et al., 1997). Most recently, Cyclone Amphan killed 72 people in India and 112 people in Bangladesh (Halder et al, 2021). Due to the geographical location of the BoB, countries with highly populated coastal regions such as India, Sri Lanka, Bangladesh, and Myanmar are at risk from TCs. In addition, the BoB is an ideal site for studying variation in the large-scale environmental parameters that influence tropical cyclogenesis due to its isolation from other oceans by land on its western, eastern, and northern margins.
Researchers have therefore begun to assemble more data/observations of BoB TCs and have conducted more comprehensive studies to understand TC dynamics over the BoB on an interannual scale. These investigations illustrate that the El Niño–Southern Oscillation (ENSO) strongly influences TC activity over the BoB on an interannual time scale with variation in thermodynamic and dynamic factors (Girishkumar and Ravichandran 2012; Felton et al., 2013; Li et al., 2016). Moreover, it has been found that El Niño events suppress the formation of cyclones in the BoB while La Niña enhances TC genesis with changes in large-scale environmental conditions. Thus, to understand the influence of thermodynamic and dynamic factors on TC formation in detail, it is essential to identify the relative contribution of each parameter at different time scales.
Li et al. (2013) developed an advanced quantitative diagnosis method that can quantify the relative contributions of large-scale environmental parameters based on the modified GPI by Emanuel and Nolan (2004). Their findings indicate that GPI reduction is due mainly to vertical wind shear (VWS), while relative humidity (RH) enhances TCs in summer over the BoB. Hence, the empirical GPI method is a new approach to quantify the contribution of large-scale parameters to TC genesis under different climate modes. For instance, Girishkumar et al. (2015) used the same method to quantify the relative contribution of large-scale conditions responsible for TC activity under different phases of ENSO and Madden Julian oscillation (MJO) during the postmonsoon (October–December). Results show the importance of mid-tropospheric relative humidity, which is responsible for the enhancement (reduction) of the GPI during La Niña (El Niño) events over the BoB. Li et al. (2019) also used the quantitative method with another modified GPI (Kotal et al., 2009) to investigate the contribution of environmental parameters to TC formation in the BoB during the premonsoon transition period (PMT). They found that a significant difference in vorticity during the PMT contributed to TC development in the BoB. These previous studies on the relationship between TCs in the BoB and ENSO have been conducted by defining ENSO with the Niño-3.4 index, focusing only on El Niño intensity and not pattern diversity.
El Niño is known to occur in two types according to the location of the SST anomaly center: namely central Pacific El Niño (CP-type) and eastern Pacific El Niño (EP-type) (Larkin and Harrison 2005; Ashok et al., 2007). Thus, the impact of EP and CP type El Niño on TC activity has become an interesting topic among the scientific community worldwide because of its conspicuous and unique influences on the relationship between ENSO and TC genesis (Chen and Tam, 2010; Yang, 2018; Choi et al., 2019). Most of these studies show the contribution of large-scale parameters in EP and CP El Niño to TC genesis based on the GPI. For instance, Xu and Huang (2015) found that more vigorous and intense TCs are more frequent in EP years over the western North Pacific and eastern North Pacific during July and August.
Overall, previous investigations of the impact of the two types of El Niño on TC variation in other ocean basins have shown more advanced and adequate results (Hong et al., 2011; Kim et al., 2011; Wang et al., 2013; Wu et al., 2018; Choi et al., 2019). However, the BoB basin has not received much attention, though it demonstrates the significant role of ENSO-induced large-scale parameters on TC activity. In addition, preliminary analysis of SST variation during the two types of El Niño shows different wave train patterns entering the Indian Ocean basin during EP El Niño but not CP El Niño. Yu et al. (2017) also explained that the more westward-located positive SST anomalies of the CP type might induce weaker SST anomalies in the Indian Ocean than the EP type. Hence, it is worth revisiting the ENSO influences on TC genesis in the BoB by investigating the impact of EP and CP type El Niño. The outcomes of this research will help answer the following questions: How does El Niño diversity (EP and CP type) impact TC variation in the BoB? How do CP and EP type El Niño modulate large-scale parameters and TC genesis (reduction/enhancement) in the BoB? Which factors are the most (least) important in TC formation during the two types of El Niño? The primary purpose of this study is to investigate the two types of El Niño–associated large-scale parameters and their impact on TC activity in the BoB.
The rest of the paper is organized as follows: the next section describes the data and analysis methods used, including the identified years of the two types of El Niño events. The results section first investigates the TC variation and relationship with ENSO on an interannual time scale as well as the relationship between the GPI and El Niño pattern diversity. Next, the relative contribution of large-scale parameters from the diagnosed GPI and possible physical mechanisms during the two types of El Niño are examined. Finally, the main conclusions of this study are drawn in the conclusions and discussion section.
There are two TC peak seasons (bimodal distribution) over the BoB. Thus, the present study focuses on the primary TC peak season (postmonsoon) from October to December (OND) and the secondary TC peak season from April to June (AMJ) between 1980 and 2019. TC data from the Joint Typhoon Warning Center (JTWC) and the International Best-track Archive for Climate Stewardship (IBTrACS) are obtained for this study to investigate TC activity over the BoB. Atmospheric variables such as air temperature, wind, relative humidity, and specific humidity from the National Centers for Environmental Prediction (NCEP)–National Center for Atmospheric Research (NCAR) reanalysis from 1980 to 2019 are used for this study (Kalnay et al., 1996). For the Genesis Potential Index calculation (GPI), we use atmospheric data from ERA5 (Hersbach, et al., 2020), the latest global atmospheric reanalysis produced by the European Centre for Medium-Range Weather Forecasts (ECMWF). The monthly SST dataset is obtained from the Hadley Centre Sea Ice and Sea Surface Temperature dataset (HadISST) (Rayner et al., 2003).
The monthly Niño 3.4 SST indices from the NOAA Climate Prediction Center website (https://origin.cpc.ncep.noaa.gov/products/analysis_monitoring/ensostuff/ONIv5.php) and the monthly EP and CP El Niño indices from the (https://www.ess.uci.edu/∼yu/2OSC) (Kao and Yu 2009; Yu and Kim 2011) are used for this study.
First, the ENSO indices are defined as the averaged sea surface temperature anomalies of the Niño-3 (5°S–5°N, 150°–90°W), Niño-3.4 (5°S–5°N, 170°–120°W), and Niño-4 (5°S–5°N, 160°E–150°W)areas. The El Niño Modoki index (EMI) is also defined as the following (Ashok et al., 2007), where brackets indicate the area-averaged SST anomalies over the selected areas.
CP El Niño events are identified as those with the EMI higher than one standard deviation as well as the Niño-4 index higher than the Niño-3 index, and EP El Niño events are identified as those with both the Niño-3.4 and Niño-3 indices higher than one standard deviation, as shown in Table 1.
The Genesis Potential Index (GPI) was first developed by Gray (1979), representing the large-scale environmental conditions that affect TC genesis. For this study, we used the GPI suggested by Emanuel and Nolan (2004), with absolute vorticity, mid-tropospheric humidity, potential intensity, and vertical wind shear. The GPI is defined as follows:
where η is the absolute vorticity in s−1, H is the relative humidity at 700 hPa in percent, V pot is the potential intensity in m s−1 (Emanuel, 1995), and V shear is the magnitude of the vertical wind shear from 850 to 200 hPa in m s−1.
Quantitative evaluation (Li et al., 2013) was carried out to quantify the individual contributions from the four large-scale environmental parameters to changes in the GPI. The calculation of the diagnosed GPI is explained below. Eq. 2, two may obtain,
Where
First, changes in the GPI are diagnosed at different time scales using Eq. 2. Each term’s relative contributions (percentages) to the diagnosed GPI are then calculated by averaging each diagnosed term over the blue and red boxed regions in the regression maps. Student’s t-tests are conducted to test the statistical significance of the regression analysis.
From a climatological perspective, we first examine the variation in large-scale parameters and TCs in the North Indian Ocean (NIO) and BoB over 40 years (1980–2019). Figure 1A shows the locations of TC genesis over the six major ocean basins, including NIO TC genesis. Compared to the Arabian Sea (AS), the BoB has more TC genesis locations, indicating the high productivity of TCs over the NIO. Similarly, the GPI also exhibits a higher potential of TC formation in our study region than in the AS. The TC climatology shows a bimodal distribution with two TC peak seasons, AMJ and OND (Figures 1B,C), which we will focus on in the coming sections. Notably, TC peak seasons have weak VWS, higher SST, and higher low-level vorticity, and RH shows lower values than during the summer monsoon. Though higher mid-tropospheric RH is supportive, strong VWS is unfavorable for TC genesis during summer. Li et al. (2013) explained the relationship between the climatological variation of these large-scale parameters and the bimodal distribution of BoB TCs using detailed GPI quantitative analysis. The BoB shows (Figure 1B) fluctuations of large-scale parameters similar to those in the NIO and accounts for more than half of the TC frequency. In addition, the postmonsoon (OND) season of the BoB accounts for a total of 126 TCs (mean = 3.27 and standard deviation = 1.42) with higher fluctuations, whereas AMJ records 57 TCs (mean = 1.42 and standard deviation = 0.89) during the selected period. Analyses are then conducted on the interannual relationship of BoB TC frequency with ENSO and the Indian Ocean Dipole Index (IOD) during 1980–2019 for the two peak seasons. It is clear that BoB TCs (>17 knots) are significantly correlated with ENSO during the primary TC peak season with a slight influence of the IOD (Figure 2A). However, both indices show an insignificant relationship with BoB TCs in AMJ (Figure 2B). To further investigate the remote impact of SST on TC genesis in the BoB, spatial correlation maps are drawn between TC frequencies and tropical SSTs in AMJ and OND (Figure 3). A significant negative correlation (above the 95% confidence level) is found during OND over the eastern and central Pacific (Figure 3A), though AMJ TCs show a negative correlation with SST in the eastern to central Pacific, which is more concentrated in the eastern Pacific and less significant (Figure 3B). Analyses are then conducted between the GPI and Niño 3.4 following the quantitative analysis to compare with the impacts of El Niño pattern diversity on BoB TCs and demonstrate the novelty of the present study.
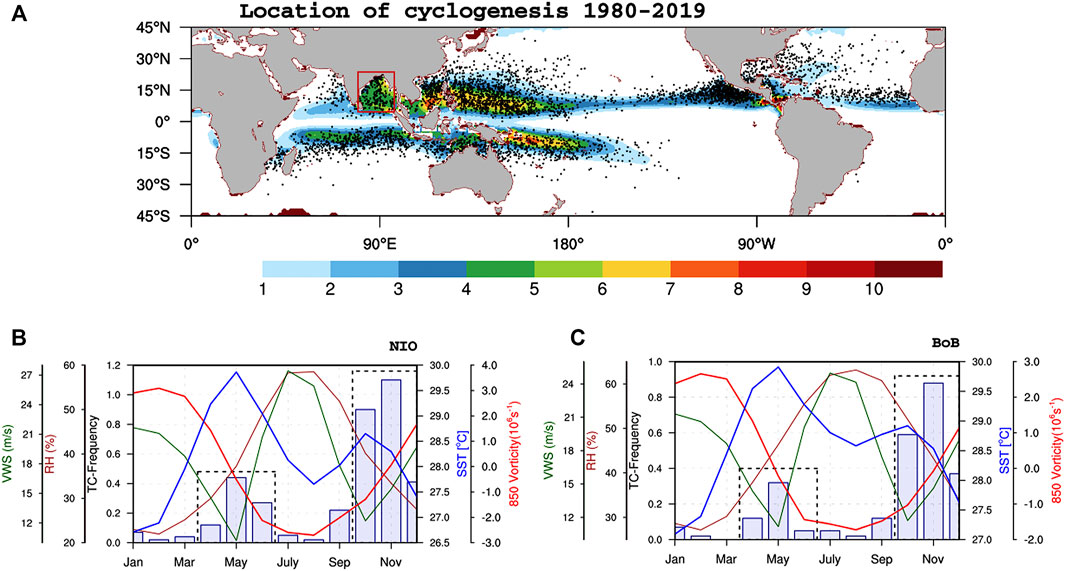
FIGURE 1. Global TC genesis location (black dots) and climatology of Genesis Potential Index during 1980–2019 (A); red box indicates the selected study region (BoB). Climatology of SST (blue), vertical wind shear (green), vorticity (red), and relative humidity at 600 hPa (brown) over the NIO (B) and the BoB (C) monthly distribution of TC frequency (number per month) are indicated by bars and dashed boxes indicate the TC peak seasons.
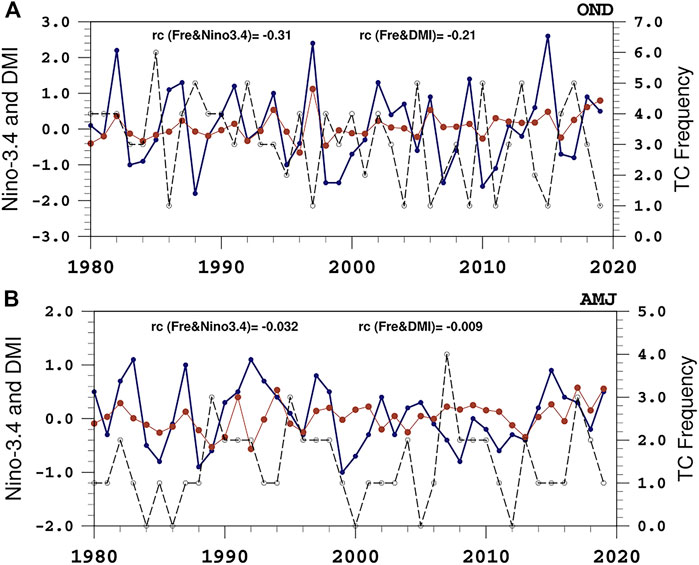
FIGURE 2. Time series of the October-December (OND) TC frequency (in black) over the BoB, the Niño-3.4 index (in blue), and DMI index (in brown) during 1980–2019; rc indicates their correlation coefficients (A). (B) Same as (A) but for April–June (AMJ).
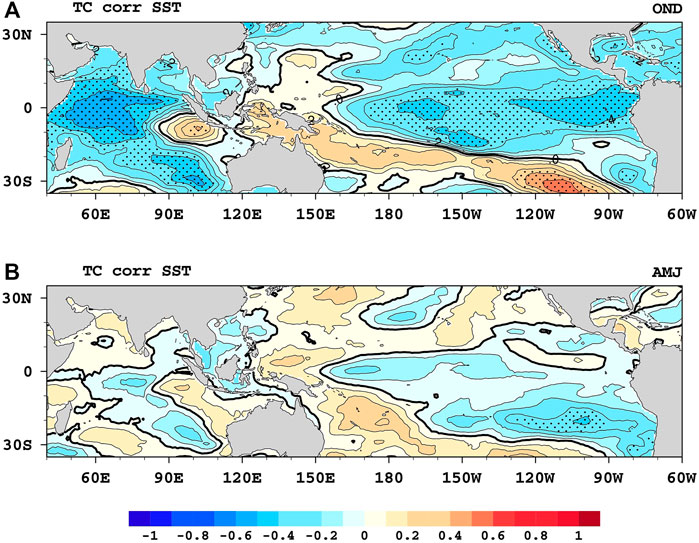
FIGURE 3. Correlation of TC frequency and sea surface temperature (SST) OND during (A) and AMJ (B); Stipplings indicate that correlations are significant at the 95% confidence level.
This study reveals a distinct meridional pattern of ENSO-associated GPI from the northeastern to southwestern BoB, similar to the GPI variation (Figures 4A,B). Thus, the GPI can represent the linkage between ENSO and TC formation in the BoB during OND. The relative contributions of changes in the different terms in the GPI due to ENSO are computed based on Eq. 2, as described in the methods, and the results are shown in Figures 5A–D. VWS term is the most important contributor (94.70%) (Figure 5B) over the red box in Figure 4B for the increased GPI during the primary TC peak season, indicating the importance of dynamic factors in ENSO-associated TC genesis during OND.
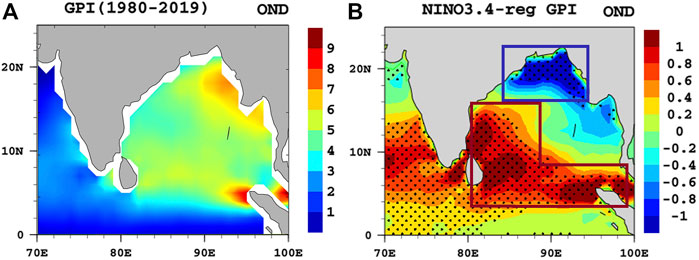
FIGURE 4. (A) Seasonal average GPI and (B) spatial distribution of GPI anomalies regressed onto the Niño-3.4 index in OND. Stipplings indicate significant correlations exceeding the 95% confidence level. The red box indicates the GPI increase, while the blue indicates the reduction.
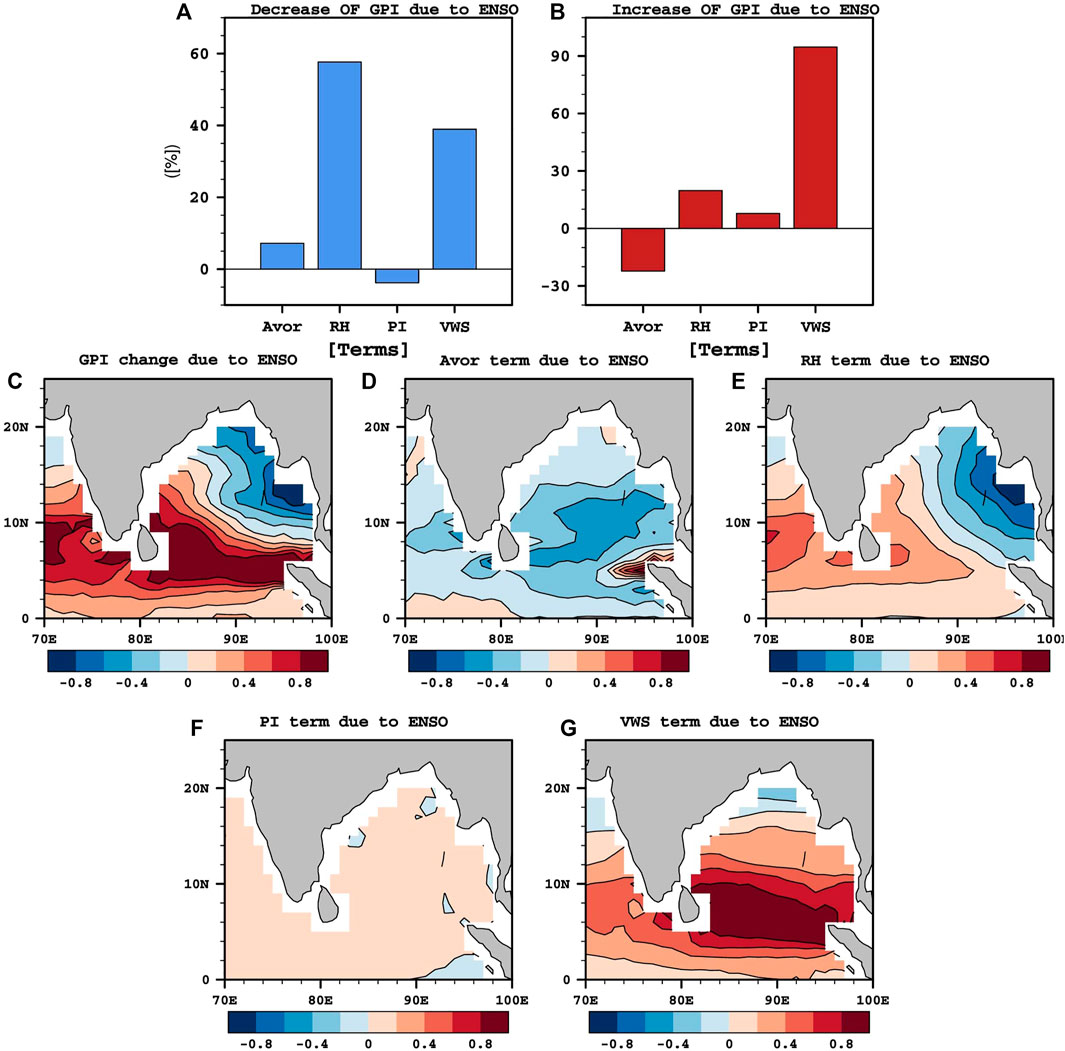
FIGURE 5. (A) Relative contributions (percentages) of each term to the diagnosed GPI changes associated with ENSO (Niño-3.4) during OND over the northeastern boxed region (15°–22°N, 85°–95°E) and (B) the southwestern boxed (red) region in Panel 4. (C) The diagnosed GPI change in the BoB due to ENSO and the spatial distribution of diagnosed four large-scale terms; (D) absolute vorticity at 850 hPa (Avor), (E) relative humidity at 700 hPa (RH), (F) potential intensity (PI)and (G) vertical wind shear (VWS).
In contrast, RH term is the most important contributor (59.69%) (Figure 5A) over the selected blue box (Figure 4B), which suppresses the GPI in the northeastern BoB. Though the thermodynamic influence (RH) is prominent, VWS term is the second most significant contributor (36.32%) for the blue box in the northeastern BoB. The diagnosed change in the GPI due to ENSO (Figure 5C) exhibits a southwest-northeast dipole pattern more consistent with the ENSO-associated GPI. On the other hand, the spatial patterns of the diagnosed terms clearly show different contributions of GPI reduction and enhancement over the BoB (Figures 5D–G). Most importantly, the diagnosed VWS term shows a distinct south-north dipole pattern around 14°N over the BoB (Figure 5G).
Regression analyses are carried out between the seasonal average of the GPI anomalies and the two types of El Niño in OND to investigate the association between the GPI and El Niño diversity. The GPI associated with both El Niño flavors illustrates a similar meridional distribution to GPI composites and TC genesis density (Figures 6A–F). In other words, the results show that the GPI increases south of the BoB and is suppressed over the northern BoB under EP El Niño. Significant GPI reduction is notably more concentrated in the northwestern BoB. In contrast, the relationship between the CP El Niño and the GPI is more analogous to the ENSO results, exhibiting a southwestern-northeastern meridional pattern.
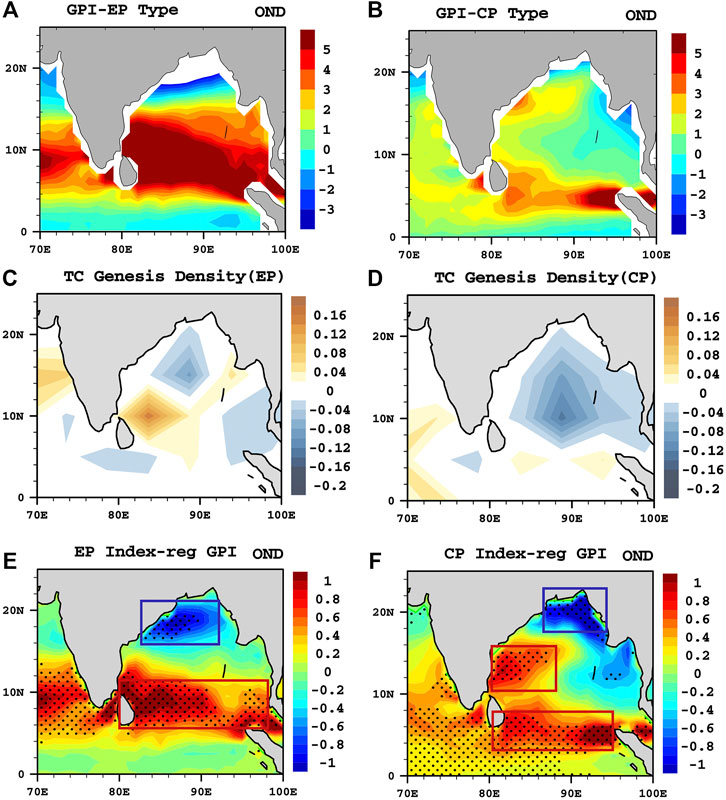
FIGURE 6. (A) GPI anomalies during EP and (B) CP El Niño in OND. Genesis density in a 5° × 5° grid in the EP (C) and CP types (D). (E) Spatial patterns of GPI anomalies regressed onto the EP El Niño Index in OND and (F) for CP El Niño Index. Stipplings indicate significant anomalies exceeding the 95% confidence level. The red box indicates the GPI increase, while the blue indicates the reduction.
Based on the spatial distribution of the significant regression anomalies, the area-averaged diagnosed GPI (blue and red boxes) is calculated to quantify the relative contribution of the four large-scale terms to the suppression and enhancement of the GPI. The decrease in the GPI in the northern BoB (blue box) during EP type El Niño is mainly due to RH (58.93%) and VWS term (51.77%) (Figure 7A). Moreover, absolute vorticity (Avor) (9.53%) makes a minor contribution to GPI reduction in the northern BoB. The increase in the GPI in the southern BoB in the EP type is due to VWS (123.73%), and the RH term makes a minimal contribution (6.27%) (Figure 7B). Consistently with the EP El Niño-associated GPI, the diagnosed GPI change in EP El Niño exhibits a visible south-north dipole pattern during the primary TC peak season (Figure 7C). Moreover, the diagnosed results show that the VWS, RH, and potential intensity (PI) terms work together to increase the GPI, though the Avor term indicates an unsupportive environment (Figures 7D–G).
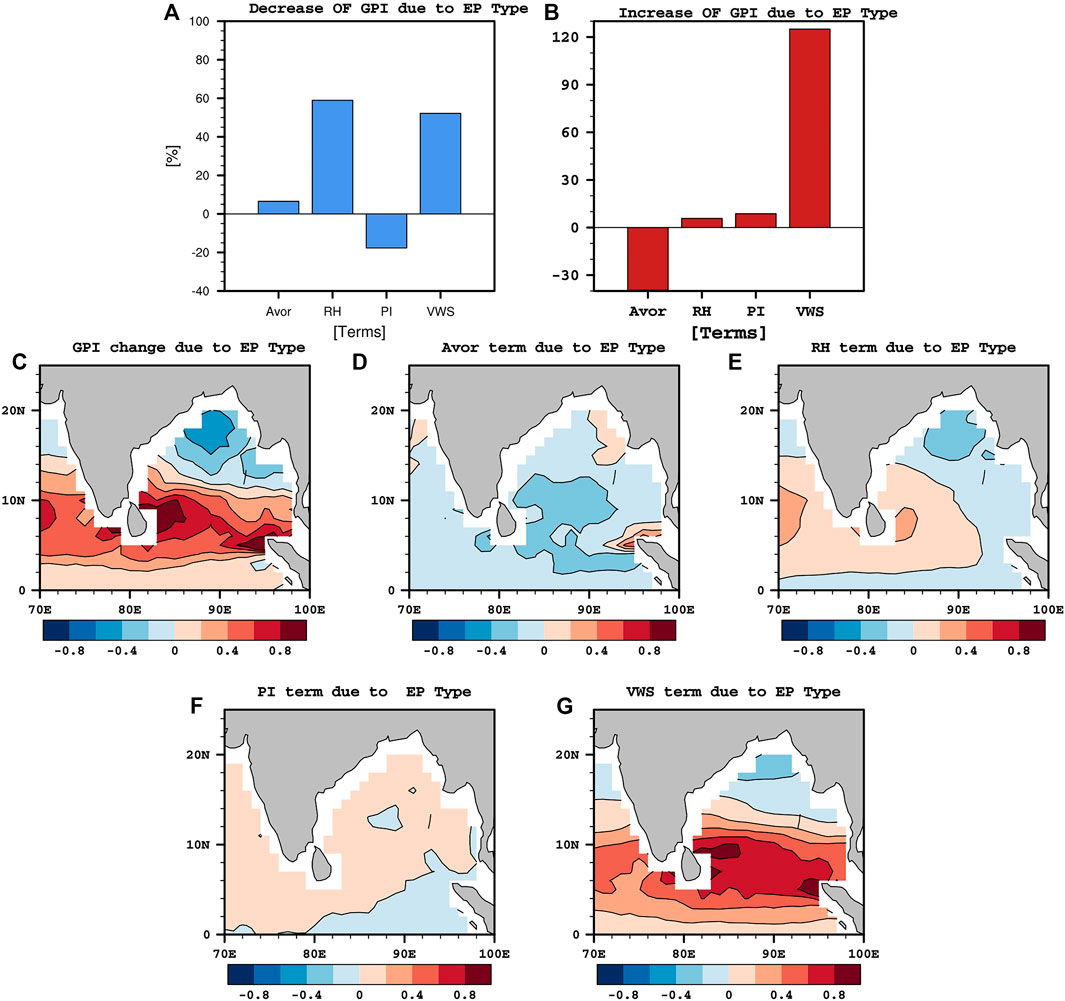
FIGURE 7. (A) Relative contributions (percentages) of each term to the diagnosed GPI changes associated with EP El Niño over the red boxed region (5°–11°N, 80°–98°E) and (B) blue boxed region (16°–21°N, 80°–93°E) in Panel 6E. (C) The diagnosed GPI change in the BoB due to EP El Niño and the spatial distribution of diagnosed four large-scale terms: (D) absolute vorticity at 850 hPa (Avor), (E) relative humidity at 700 hPa (RH), (F) potential intensity (PI) and (G) vertical wind shear (VWS).
For CP El Niño, RH term is the main contributor (69.16%) to GPI suppression over the northeastern BoB (Figure 8A). However, VWS term (24.89%) is not higher than in EP El Niño, and Avor (9.81%) again makes a minor contribution to GPI reduction. The above results indicate that the contribution of VWS term is more important over the northeastern BoB in CP El Niño, while both RH and VWS play an essential role in the northern BoB in EP type El Niño.
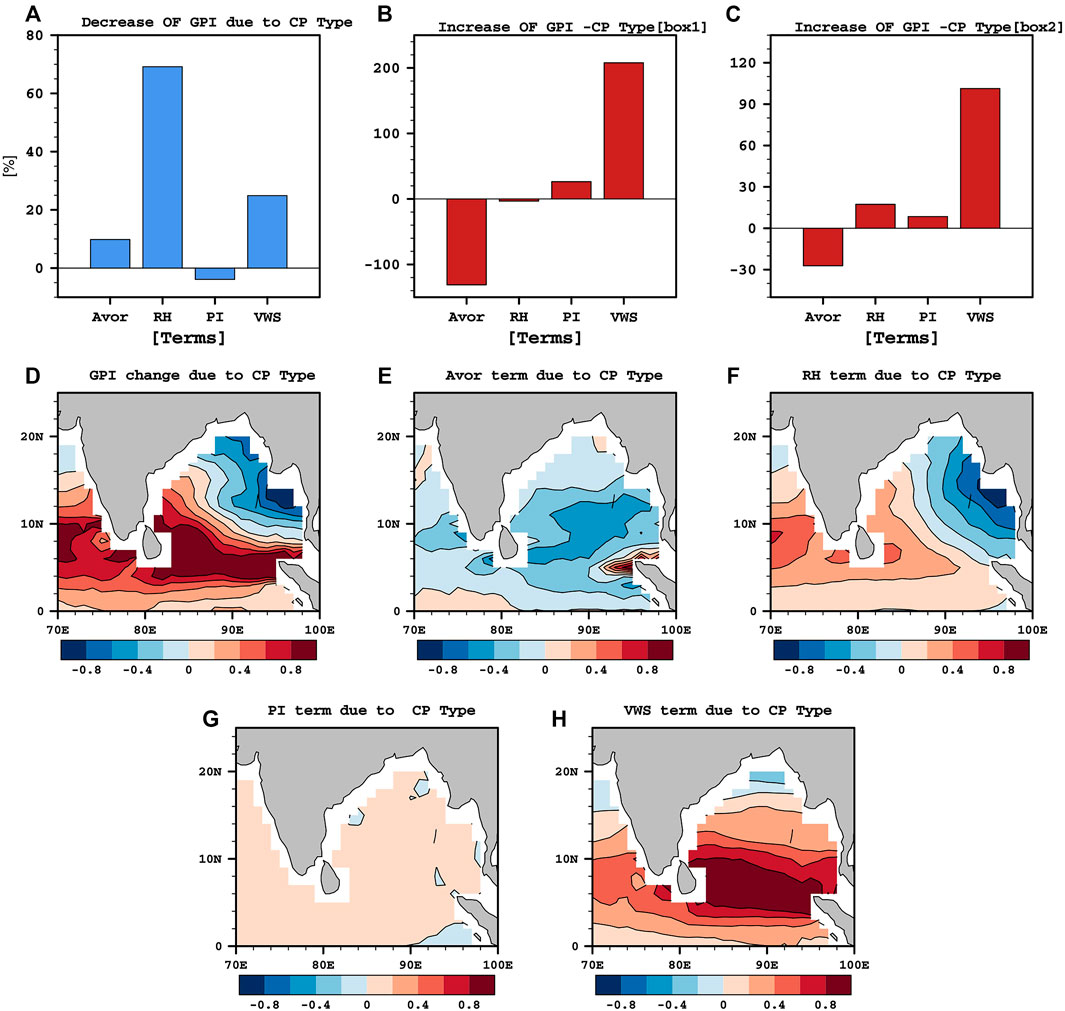
FIGURE 8. (A) Relative contributions (percentages) of each term to the diagnosed GPI changes associated with CP El Niño during in OND over the northeastern boxed region (17°–23°N, 87°–95°E) and (B) in red box 1 (10°–16°N, 81°–90°E), (C) red box 2 (3°–8°N, 82°–96°E) in Panel 6F. (D) Diagnosed GPI change in the BoB due to CP El Niño and the spatial distribution of diagnosed four large-scale terms; (E) absolute vorticity at 850 hPa (Avor), (F) relative humidity at 700 hPa (RH), (G) potential intensity (PI) and (H) vertical wind shear (VWS).
On the other hand, VWS (207.89, 101.33%) term is the main contributor to the increase in the GPI over the southern and western BoB during CP El Niño (Figures 8B,C). Nevertheless, RH makes a greater contribution (17.35%) in CP type El Niño in the southern BoB (red box 2) than in the EP type, and there is a minor contribution from PI term (8.49%). The diagnosed GPI change in CP El Niño exhibits a visible southwestern-northeastern dipole pattern (Figure 8D), indicating the consistency with CP El Niño-associated GPI. In addition, the diagnosed results clearly illustrate that excluding absolute vorticity, the other three terms work together to enhance the GPI in the southern BoB (Figures 8E–H).
The previous section showed the relative contribution of large-scale environmental factors in EP and CP El Niño in modulating TC genesis in the BoB during the primary TC peak season. Thus, regression analyses are conducted to understand the possible physical mechanisms for the diagnosed GPI changes.
First, the impact of VWS is revealed in detail by analyzing the two types of El Niño indices and the wind anomalies at 200 and 850 hPa. The result implies that an easterly VWS anomaly reduces the climatological VWS over the southern BoB (Figure 9) at 200 and 850 hPa because of EP and CP type El Niño, consistent with the diagnosed change in VWS term. In other words, VWS is reduced at both levels due to the impact of the EP and CP types, indicating a positive contribution to the increase in the GPI. Moreover, regressed wind anomalies at the lower level (850 hPa) in EP type El Niño exhibit a conspicuous anticyclonic circulation near the northern BoB, causing the reduction in TC genesis.
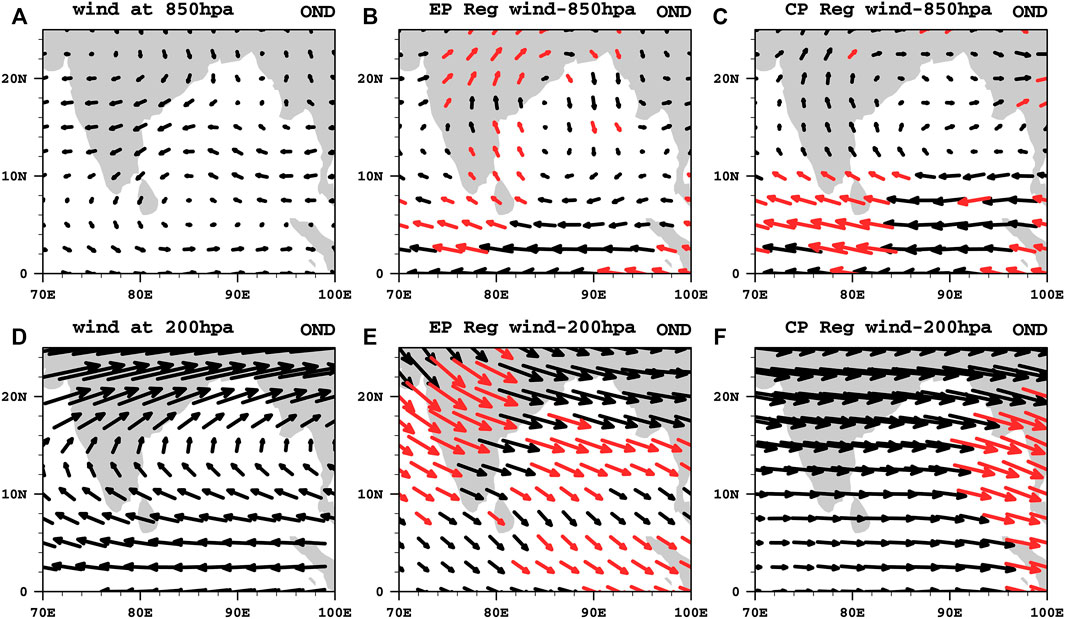
FIGURE 9. Climatological wind at 200 hPa in OND (A); wind vectors at 850 hPa regressed with the EP index (B) and with the CP Index (C). (D–F) same as for the upper panel but at 200 hPa. Red vectors are statistically significant at the 95% level.
On a global scale, both types of El Niño weaken the Walker circulation by strengthening westerly winds and weakening easterly winds over the equatorial Pacific Ocean (Figures 10A,C). In addition, significant wind divergence can be observed near northern Australia, which can induce air sinking and create opposing conditions for TC formation. Mid-level RH coincides with wind divergence due to subsidence over northern Australia, which enters the northern BoB, providing unfavorable conditions for TC genesis. A closer look at the BoB region (Figures 10B,D) shows that EP El Niño–associated RH explains the negative contribution to TC genesis over the northern BoB. On the other hand, CP El Niño–induced RH inhibits TC genesis over the northeastern BoB; nevertheless, the decrease in RH is more significant in CP El Niño than in EP El Niño. In addition, the Niño 3.4 regressed wind and mid-level RH display similar results to CP El Niño (Figure not shown). The critical point from the above results is greater consistency between the relative contribution of each diagnosed term and the two CP and EP El Niño–associated large-scale parameters.
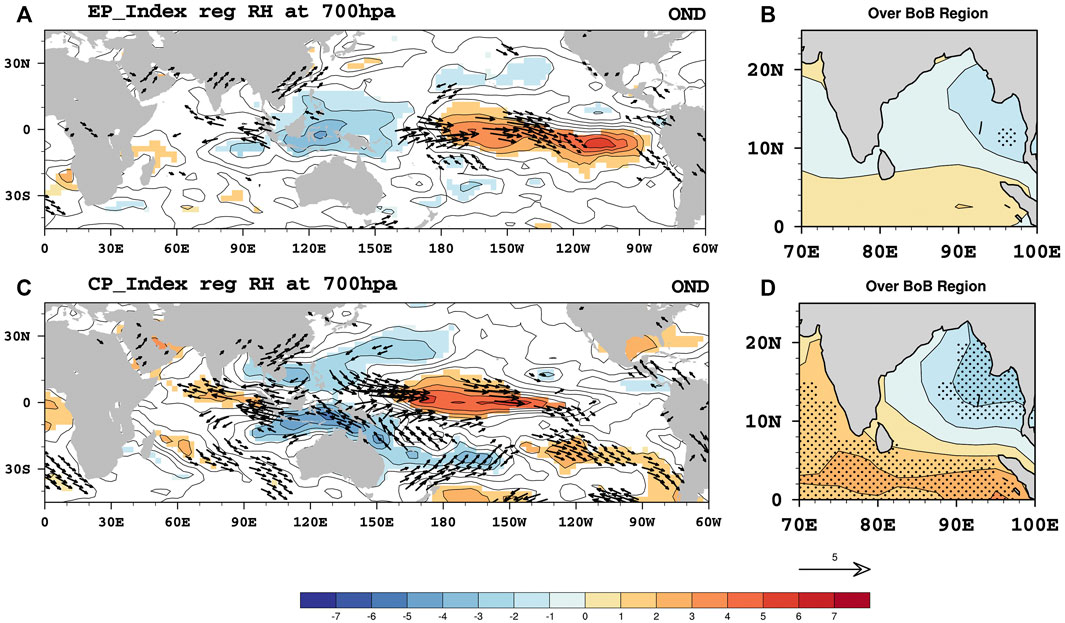
FIGURE 10. Regressed relative humidity (RH) at 700 hPa and wind at 850 hPa in OND with the EP index (A) at global scale, and (B) over the BoB. (C,D) Same as the upper panel but for the CP index. The red (blue) shading indicates positive (negative) significance at the 95% level. Vectors are statistically significant at the 95% level.
We investigate the GPI and ENSO relationship before looking into how EP and CP El Niño impact TC formation. The GPI anomalies associated with the Niño.3.4 index display a less significant reduction (northeastern) and enhancement (western and southern) in the BoB (Figure 11A), as TC frequencies also show an insignificant relationship with ENSO in AMJ (Figure 2B). However, the CP type–associated GPI exhibits similar patterns to the Niño 3.4 index, with significant enhancement in the southern BoB (Figure 11B). In contrast, the EP El Niño–linked GPI shows a remarkable reduction in the southern BoB (Figure 11C). It is notable that during CP El Niño (5 years) TCs in BoB tend to genesis farther south (mean latitude of 9.27°N, (Figure 11D). TC geneses are recorded in EP El Niño (7 years) at central BoB (Mean Lat: 11.6°N), except one TC in more southward.
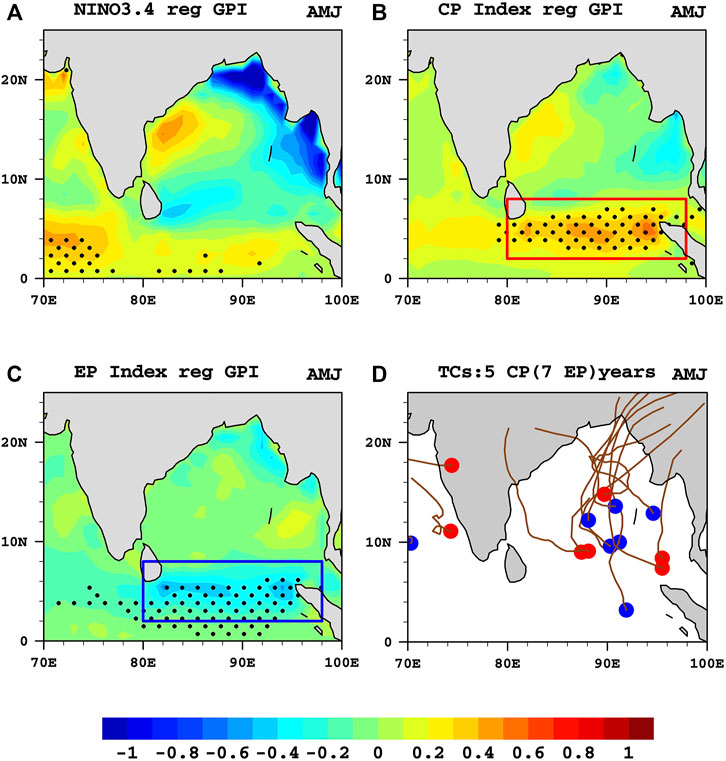
FIGURE 11. (A) Spatial patterns of GPI anomalies regressed onto the normalized Niño-3.4 index in AMJ. (B, C) Same as ((A)), but with the CP and EP indices; stipplings indicate significant anomalies exceeding the 95% confidence level. The red box indicates a GPI increase, while the blue indicates a reduction. (D) TC genesis and tracks over the northern Indian Ocean during EP type (blue) and CP type El Niño (red); each dot represents a tropical cyclone genesis point.
Therefore, further investigation is conducted with GPI decomposition analyses in the selected region (2°–8°N, 80°–98°E) in the red and blue boxes where the GPI increases and decreases due to CP and EP El Niño, respectively. This study reveals that the decrease in the GPI in the southern BoB (blue box) during EP type El Niño is mainly due to RH term (84.15%) and PI (7.68%) (Figure 12A). Meanwhile, the VWS term (2.03%) contributes less to GPI change over the southern BoB.The diagnosed GPI change consistently illustrates GPI reduction in EP El Niño over the selected region (Figure 12B). Noticeably, all four terms contribute to TC reduction in the southern BoB during EP type El Niño (Figures 12C–F).
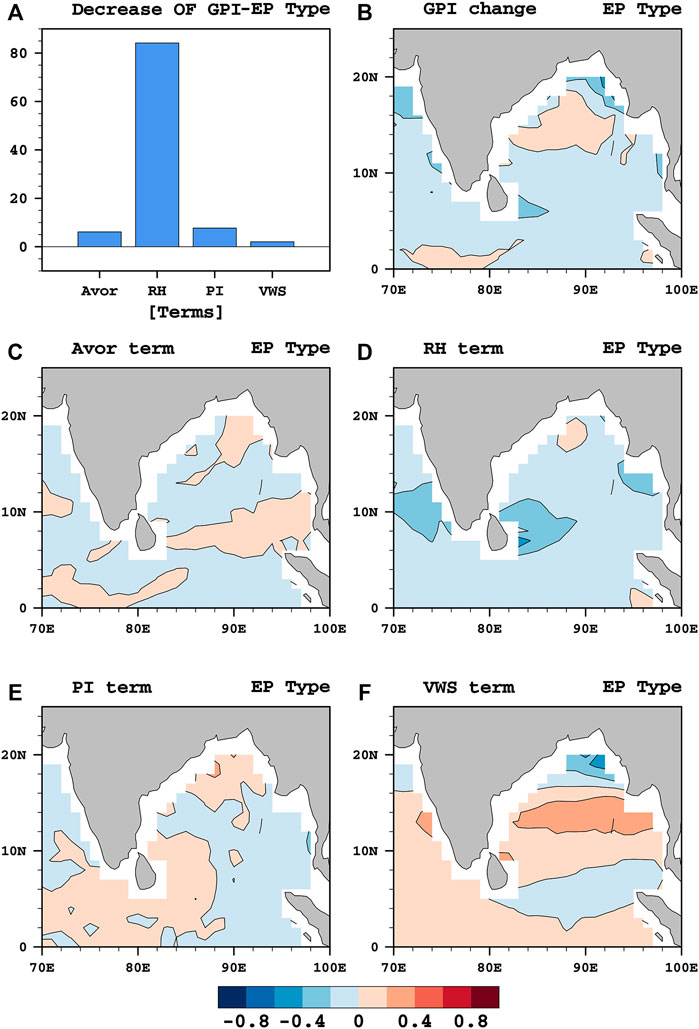
FIGURE 12. (A) Relative contributions (percentages) of each term to the diagnosed GPI changes associated with EP El Niño during in AMJ over the southern boxed (blue box) (2°–8°N, 80°–98°E) region in Panel 11C. (B) The diagnosed GPI change and the spatial distribution of diagnosed four large-scale terms; (C) absolute vorticity at 850 hPa (Avor), (D) relative humidity at 700 hPa (RH),(E) potential intensity (PI), and (F) vertical wind shear (VWS).
In contrast, VWS term is the main contributor (79.8%) to GPI enhancement over the northeastern BoB in CP type El Niño (Figure 13A). Second, RH term (14.16%) affects the GPI increase, followed by PI (7.74%), while Avor term is unfavorable for GPI enhancement. The diagnosed GPI change in CP El Niño shows the GPI enhancement over the selected region in southern BoB (Figure 13B). Furthermore, the diagnosed results illustrate that the VWS, RH, and potential intensity (PI) terms work together to enhance the GPI, though the Avor term indicates an unfavorable environment (Figures 13C–F). Consequently, TC formation over the BoB has distinct responses to EP and CP events during AMJ.
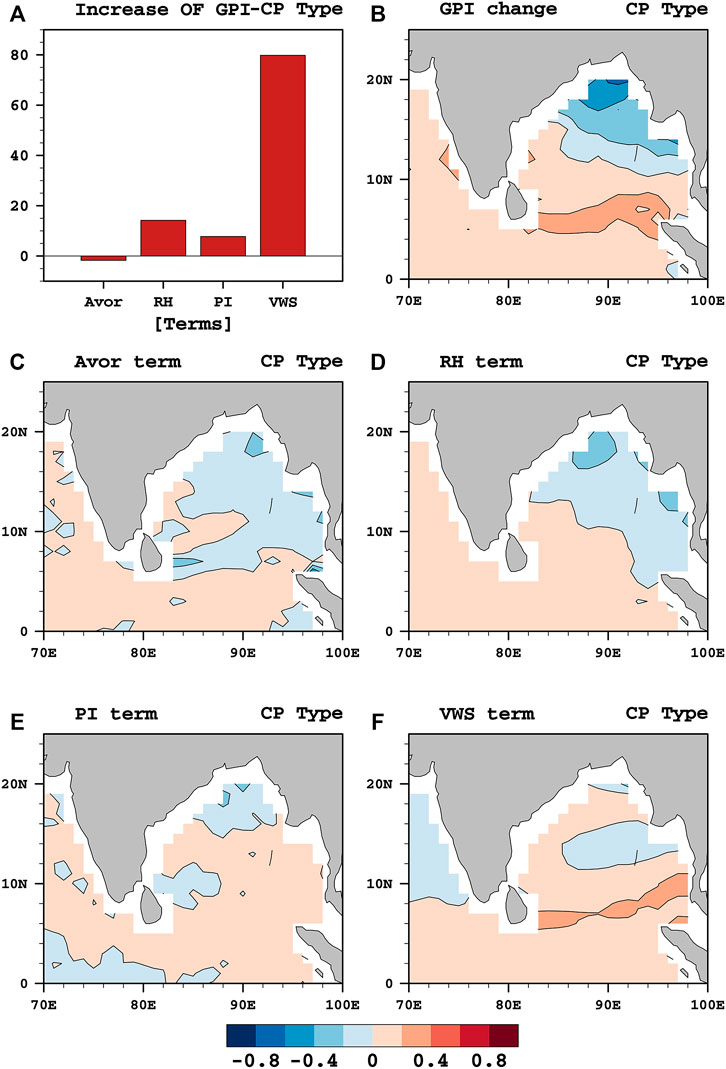
FIGURE 13. (A) Relative contributions (percentages) of each term to the diagnosed GPI changes associated with CP El Niño during AMJ over the southern boxed (red box) (2°–8°N, 80°–98°E) region in Panel 11B. (B) Diagnosed GPI change and the spatial distribution of diagnosed four large-scale terms: (C) absolute vorticity at 850 hPa (Avor), (D) relative humidity at 700 hPa (RH), (E) potential intensity (PI), and (F) vertical wind shear (VWS).
This section investigates the possible mechanisms responsible for TC genesis in AMJ to check the consistency of the GPI-diagnosed results. The climatological state and the regressed wind anomalies with EP and CP El Niño indices are compared (Figures 14A–F). It is found that VWS is reduced at both 200 and 850 hPa due to CP type El Niño in the southern BoB (Figures 14C,F). Especially significant strengthened westerlies at the lower level (850 hPa) can be observed in the selected region consistent with the diagnosed change in VWS, indicating a positive contribution to the increase in the GPI.
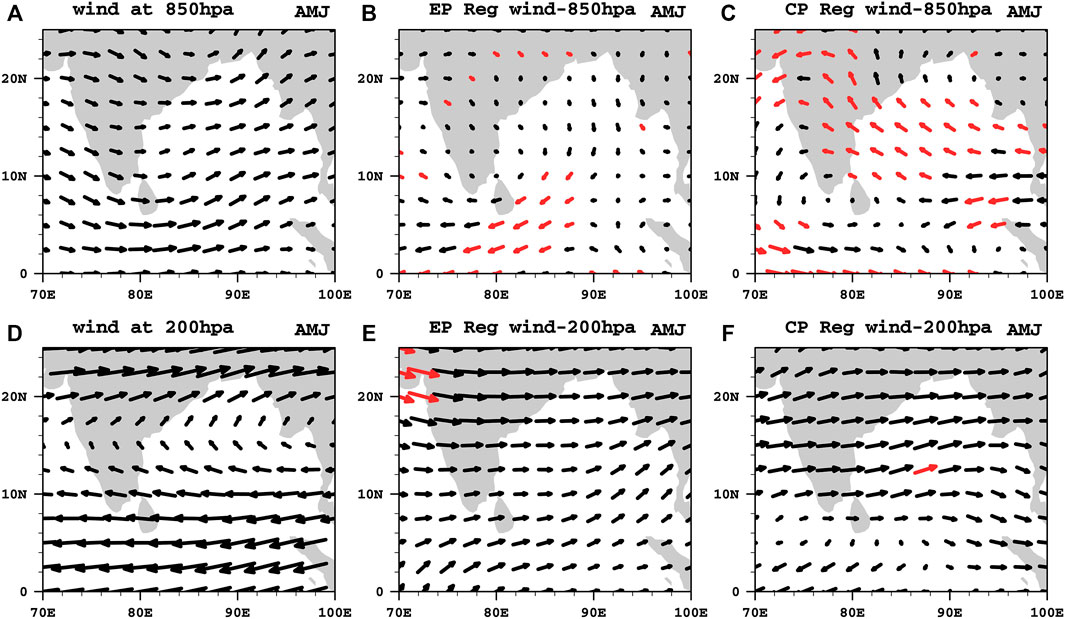
FIGURE 14. Climatological wind at 850 hPa in AMJ (A); wind vectors at 200hPa regressed with the EP index (B) and CP index (C). (D–F) same as for upper panel but at 200 hPa. Red vectors are statistically significant at the 90% level.
We then examined the impacts of two types of El Niño on mid-tropospheric RH over the BoB (Figures 15A–D). The spatial patterns of EP El Niño–associated RH enter the southern NIO from the Pacific with more significant dry anomalies (Figure 15A). Moreover, wind at 850 hPa also shows significant divergence over the Maritime Continent, indicating sinking air extending toward the southern BoB. From a close look at the BoB (Figure 15B), EP El Niño–associated RH clearly shows dryer conditions over the southern BoB, which is more consistent with the diagnosed GPI results.
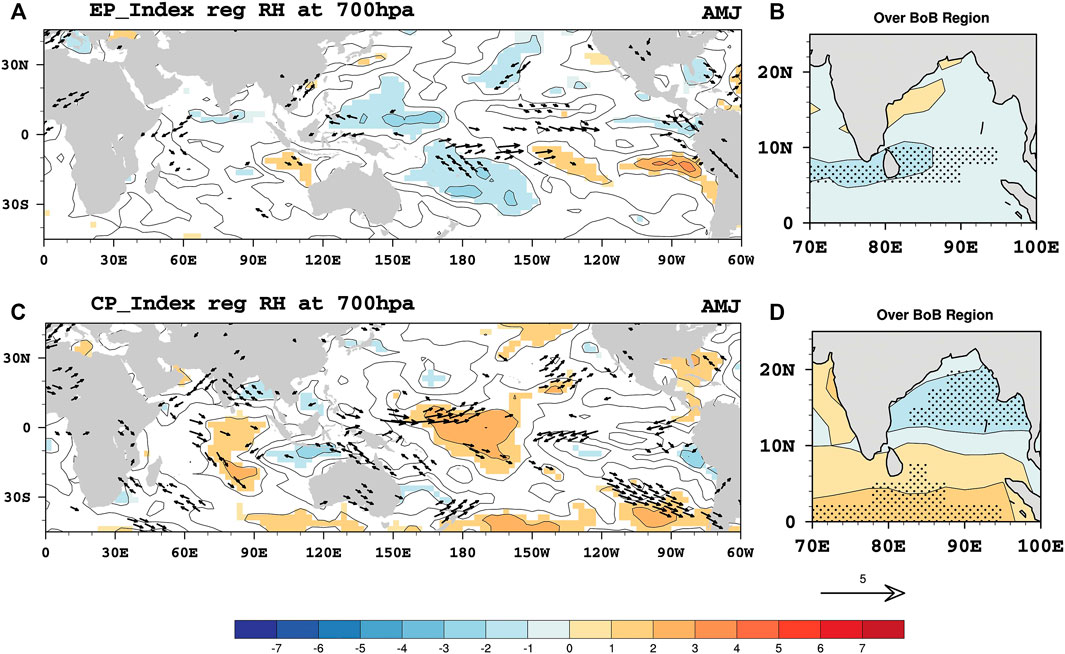
FIGURE 15. (A) Regressed relative humidity at 700 hPa and wind at 850 hPa in AMJ with the EP index at global scale and, (B) over the BoB. (C,D) Same as the upper panel but for the CP index. Shading indicates positive (negative) significance at the 95% level. Vectors are statistically significant at the 90% level.
In contrast to the EP El Niño, the spatial patterns of RH in CP El Niño enter the Indian Ocean with significant wet anomalies in the southern BoB, which expand toward the southern Indian Ocean to a greater extent (Figure 15C). Correspondingly, significant wind convergence is observed over the same region in the Indian Ocean, indicating upward air motion and facilitating TC formation. Thus, mid-tropospheric relative humidity provides more favorable conditions for the formation of TCs in the southern BoB under CP El Niño (Figure 15D). This demonstrates the second large contribution of RH term to the increase in the GPI in CP type El Niño, as explained earlier in the GPI quantitative analysis. Though CP El Niño–related, large-scale circulation reduces VWS, EP El Niño strengthens the westerly wind shear in the southern BOB, inhibiting TC formation during AMJ (Figures 14B,E). In other words, VWS is the key factor causing positive GPI over southern BoB in CP El Niño, while the RH (700 hPa) plays a vital role in reducing GPI in EP El Niño.
This study investigated the variation in large-scale parameters associated with the two types of El Niño and their impact on TC activity over the Bay of Bengal during the two TC peak seasons. We have shown that the contribution of the dynamic factor (VWS term) is more critical to the reduction of the GPI in CP El Niño over the northeastern BoB, while both the thermodynamic (RH term) and dynamic (VWS term) factors play an essential role in EP El Niño during the primary TC peak season (OND). In addition, the dynamic factor (VWS term) is the most critical contributor to the GPI enhancement induced by CP El Niño (EP El Niño) over the southwestern and southern (southern) BoB in OND. The relationship between the CP type and the GPI is more analogous to the ENSO results, exhibiting a southwestern-northeastern meridional pattern. Analysis of the secondary TC peak season (AMJ) demonstrates that CP El Niño and EP El Niño induce an increase and a decrease in the GPI, respectively, in the southern BoB mainly due to the dynamic factor (VWS term) and thermodynamic factor (RH term). In AMJ, on the other hand, TCs tend to genesis farther south during CP El Niño. Overall, our diagnosed GPI results for the two TC peak seasons are consistent with the two types of El Niño–associated physical mechanisms over the BoB.
To better understand the interannual variability of TCs in the BoB, we first investigate the correlation of BoB TCs with the Niño3.4 and DMI indices in OND. In line with a previous study by Girishkumar and Ravichandran (2012), BoB TCs show a significant relationship with ENSO but an insignificant relationship with the IOD. Nevertheless, it is worth noting that the IOD can trigger extreme TCs (Girishkumar and Ravichandran 2012), and co-occurrence of the IOD and ENSO events has different impacts on BoB TC formation (Mahala et al., 2015) Meyers et al., 2007). However, this study focused on the effects of ENSO and El Niño pattern diversity on TC genesis in the BoB. The diagnosed GPI change due to ENSO demonstrates that a reduction (enhancement) in the GPI over the northeastern (southwestern) BoB is due mainly to RH (VWS). Fan et al. (2019) investigated a similar relationship between the GPI and Niño-3.4 (1998–2015) and illustrated the contribution of weak VWS to TC genesis in the southern BoB. Interestingly, at the same time, they observed an El Niño–like pattern in the equatorial Pacific region. Most importantly, our findings establish the enhancement of TC genesis in the southwestern and southern (southern) BoB due to CP type El Niño (EP type El Niño). In addition, consistent with the decomposed GPI analysis, CP El Niño and EP El Niño–related atmospheric circulations significantly reduce VWS over the southern BoB.
It should be noted that the combination of VWS, RH, and PI terms increases the GPI, while Avor has a negative influence (reduction in the GPI). This is because El Niño–associated 850-hPa relative vorticity is insignificant in the BoB (Figure not shown). This indicates that low-level relative vorticity is not vital for TC genesis over the southern BoB under El Niño diversity. Moreover, this study reveals that the thermodynamic (RH) factor is crucial in reducing TC genesis during CP El Niño in the northeastern BoB. On the other hand, the dynamic (VWS) and thermodynamic (RH) terms are almost equally important in suppressing TCs over the BoB in EP El Niño. This is because EP El Niño–associated anticyclone anomalies replace climatological winds at the lower level (850 hPa) over the northern BoB and enhance VWS, suppressing TCs in the northern BoB. Both types of El Niño–associated RH are reduced in the mid-troposphere over the northern BoB, indicating that lower RH values can inhibit TC genesis. Further, we noted that the diagnosed GPI change due to ENSO has similarities with CP El Niño compared to EP El Niño. Previously, the Niño-3.4 index has been used to classify El Niño and La Niña events and to investigate the relative contribution of large-scale parameters to TC genesis in the BoB (Girishkumar et al., 2015). Thus, this study emphasizes that investigations of El Niño pattern diversity effects on BoB TCs are greatly needed, rather than only studies limited to El Niño intensity.
Furthermore, the GPI and ENSO (Niño-3.4) in the secondary TC peak season (AMJ) exhibit a more similar but insignificant relationship than with CP El Niño. Remarkably, CP El Niño enhances the GPI in the southern BoB while EP El Niño decreases the GPI in the same region. As a result, we expect that the mean genesis location during CP El Niño would be farther south than that during EP El Niño. Although the sample is small, this is supported by the observed cyclogenesis. During CP El Niño, the mean genesis latitude is 9.27°N (4 TCs), which is about 1.83° latitude south to that of EP El Niño (4 TCs, excluding the exceptional case that genesis around 2°N). In other words, more cyclogenesis seems to occur in the southern part of the BoB during CP type El Niño, and fewer TCs occur during EP type El Niño events. These TCs generated over the southern BoB have to travel farther over the ocean before they make landfall at the rim of the BoB. This increases the time they spend over water and therefore gives them more time to amplify. As a result, these TCs may tend to be more intense than those generated to the north. Consequently, by allowing TC genesis over the southern BoB, CP type El Niño may lead to more intense TCs than EP type El Niño. Hence, further investigations were carried out on large-scale parameters using GPI quantitative analysis. The findings reveal that GPI enhancement in the CP type is due mainly to VWS and the combination of RH and PI terms. This is because of the impact of reduced CP El Niño–associated VWS in the southern BoB, mainly due to the weakening of westerlies at lower levels (850 hPa). On the other hand, the significant increase in CP El Niño–associated mid-level RH indicates a supportive environment for TC genesis in the same region of the BoB. In contrast, EP El Niño–associated mid-tropospheric RH shows dryer conditions over the southern BoB and agrees better with the diagnosed GPI results.
This study suggests that further analysis is needed from the developing phase to the decaying phase of both types of El Niño since they have different life cycles and warming patterns (Kao and Yu, 2009; Sun et al., 2013). On the other hand, La Niña can be classified as EP and CP La Niña and has distinct influences on the tropical climate (Yuan and Yan, 2013). However, due to controversy and complexity, La Niña diversity and relationship with TCs gained less attention from scientists. Some studies illustrate that La Niña events cannot be divided into EP and CP La Niña due to similar distribution of SST and precipitations patterns (Kug and Ham, 2011; Shinoda et al., 2011). Nevertheless, most previous studies emphasized the distinct influence of the La Niña diversity on different climate impacts, such as rainfall variation (Song et al., 2017; Feng and Wang, 2018). Thus, the effect of two types of La Niña on TC activity in BoB may become an interesting topic for future investigations.
On the other hand, according to previous studies, the two types of El Niño have different influences on the IOD. For instance, during CP El Niño events, the SST center is located farther west than the mean state, creating uncooperative conditions for the IOD (Zhang et al., 2015). Thus, one of our future studies will examine the co-occurrence of EP/CP El Niño and the IOD and their influence on BoB TC genesis. The overall findings of this study provide a valuable platform for studying El Niño–generated TC impacts over the BoB.
The original contributions presented in the study are included in the article/supplementary material, further inquiries can be directed to the corresponding author.
WL carried out the analysis and wrote the manuscript with the supervision of WZ. PC provided feedback and helped with the analysis. All authors discussed the results and commented on the manuscript.
This study is supported by the key project of National Natural Science Foundation of China (Grant 42192563 and Grant 42120104001), project of the Center for Ocean Research in Hong Kong and Macau (CORE), and the Hong Kong RGC General Research Fund (11300920).
The authors declare that the research was conducted in the absence of any commercial or financial relationships that could be construed as a potential conflict of interest.
All claims expressed in this article are solely those of the authors and do not necessarily represent those of their affiliated organizations, or those of the publisher, the editors, and the reviewers. Any product that may be evaluated in this article, or claim that may be made by its manufacturer, is not guaranteed or endorsed by the publisher.
Ashok, K., Behera, S. K., Rao, S. A., Weng, H., and Yamagata, T. (2007). El Niño Modoki and its Possible Teleconnection. J. Geophys. Res. 112 (11), 1–27. doi:10.1029/2006JC003798
Chen, G., and Tam, C.-Y. (2010). Different Impacts of Two Kinds of Pacific Ocean Warming on Tropical Cyclone Frequency over the Western North Pacific. Geophys. Res. Lett. 37 (1), a–n. doi:10.1029/2009GL041708
Choi, Y., Ha, K.-J., and Jin, F.-F. (2019). Seasonality and El Niño Diversity in the Relationship between ENSO and Western North Pacific Tropical Cyclone Activity. J. Clim. 32 (23), 8021–8045. doi:10.1175/JCLI-D-18-0736.1
Dube, S. K., Rao, A. D., Sinha, P. C., Murty, T. S., and Bahulayan, N. (1997). Storm Surge in the Bay of Bengal and Arabian Sea: The Problem and its Prediction. Mausam 48, 283–304.
Emanuel, K. A., and Nolan, D. S. (2004). “Tropical Cyclone Activity and Global Climate,” in Preprints, 26th Conf. on Hurricanes and Tropical Meteorology, Miami, FL, July 14 2004 (American Meteorological Society), 240–241.
Emanuel, K. A. (1995). Sensitivity of Tropical Cyclones to Surface Exchange Coefficients and a Revised Steady-State Model Incorporating Eye Dynamics. J. Atmos. Sci. 52 (22), 3969–3976. doi:10.1175/1520-0469(1995)052<3969:sotcts>2.0.co;2
Fan, K., Wang, X., Foltz, G. R., and Balaguru, K. (2019). Meridional Oscillation in Genesis Location of Tropical Cyclones in the Postmonsoon Bay of Bengal. Clim. Dyn. 53 (3–4), 2103–2118. doi:10.1007/s00382-019-04794-1
Felton, C. S., Subrahmanyam, B., and Murty, V. S. N. (2013). ENSO-modulated Cyclogenesis over the Bay of Bengal. J. Clim. 26 (24), 9806–9818. doi:10.1175/JCLI-D-13-00134.1
Feng, J., and Wang, X.-C. (2018). Impact of Two Types of La Niña on Boreal Autumn Rainfall Around Southeast Asia and Australia. Atmos. Oceanic Sci. Lett. 11 (1), 1–6. doi:10.1080/16742834.2018.1386538
Frank, N. L., and Husain, S. A. (1971). The Deadliest Tropical Cyclone in History. Bull. Amer. Meteorol. Soc. 52, 438–445. doi:10.1175/1520-0477(1971)052<0438:tdtcih>2.0.co;2
Girishkumar, M. S., and Ravichandran, M. (2012). The Influences of ENSO on Tropical Cyclone Activity in the Bay of Bengal during October-December. J. Geophys. Res. 117 (2), a–n. doi:10.1029/2011JC007417
Girishkumar, M. S., Suprit, K., Vishnu, S., Prakash, V. P. T., and Ravichandran, M. (2015). The Role of ENSO and MJO on Rapid Intensification of Tropical Cyclones in the Bay of Bengal during October-December. Theor. Appl. Climatol 120 (3–4), 797–810. doi:10.1007/s00704-014-1214-z
Gray, W. M. (1979). “Hurricanes: Their Formation, Structure, and Likely Role in the Tropical Circulation,” in Meteorology over the Tropical Oceans. Editor D. B. Shaw (London: Royal Meteorological Society), 155–218.
Halder, B., Das, S., Bandyopadhyay, J., and Banik, P. (2021). The Deadliest Tropical Cyclone “Amphan”: Investigate the Natural Flood Inundation over South 24 Parganas Using Google Earth Engine. Saf. Extreme Environments 3, 63–73. doi:10.1007/s42797-021-00035-z
Hersbach, H., Bell, B., Berrisford, P., Hirahara, S., Horányi, A., Muñoz-Sabater, J., et al. (2020). The ERA5 Global Reanalysis. Q. J. R. Meteorol. Soc. 146 (730), 1999–2049. doi:10.1002/qj.3803
Hong, C.-C., Li, Y.-H., Li, T., and Lee, M.-Y. (2011). Impacts of central Pacific and Eastern Pacific El Niños on Tropical Cyclone Tracks over the Western North Pacific. Geophys. Res. Lett. 38 (16), a–n. doi:10.1029/2011GL048821
Kalnay, E., Kanamitsu, M., Kistler, R., Collins, W., Deaven, D., and Gandin, L. (1996). The NCEP/NCAR 40-Year Reanalysis Project. Bull. Am. Meteorol. Soc. 77, 437–472. doi:10.1175/1520-0477(1996)077<0437:TNYRP>2.0.CO;2
Kao, H.-Y., and Yu, J.-Y. (2009). Contrasting Eastern-Pacific and Central-Pacific Types of ENSO. J. Clim. 22 (3), 615–632. doi:10.1175/2008JCLI2309.1
Kim, H.-M., Webster, P. J., and Curry, J. A. (2011). Modulation of North Pacific Tropical Cyclone Activity by Three Phases of ENSO. J. Clim. 24 (6), 1839–1849. doi:10.1175/2010JCLI3939.1
Kotal, S. D., Kundu, P. K., and Roy Bhowmik, S. K. (2009). Analysis of Cyclogenesis Parameter for Developing and Nondeveloping Low-Pressure Systems over the Indian Sea. Nat. Hazards 50 (2), 389–402. doi:10.1007/s11069-009-9348-5
Kug, J.-S., and Ham, Y.-G. (2011). Are there two types of la Nina. Geophys. Res. Lett. 38 (16), a–n. doi:10.1029/2011GL048237
Larkin, N. K., and Harrison, D. E. (2005). Global Seasonal Temperature and Precipitation Anomalies during El Niño Autumn and winter. Geophys. Res. Lett. 32 (16), 1–4. doi:10.1029/2005GL022860
Li, Z., Li, T., Yu, W., Li, K., and Liu, Y. (2016). What Controls the Interannual Variation of Tropical Cyclone Genesis Frequency over Bay of Bengal in the post-monsoon Peak Season. Atmos. Sci. Lett. 17 (2), 148–154. doi:10.1002/asl.636
Li, Z., Yu, W., Li, K., Wang, H., and Liu, Y. (2019). Environmental Conditions Modulating Tropical Cyclone Formation over the Bay of Bengal during the Pre-monsoon Transition Period. J. Clim. 32 (14), 4387–4394. doi:10.1175/JCLI-D-18-0620.1
Li, Z., Yu, W., Li, T., Murty, V. S. N., and Tangang, F. (2013). Bimodal Character of Cyclone Climatology in the Bay of Bengal Modulated by Monsoon Seasonal Cycle*. J. Clim. 26 (3), 1033–1046. doi:10.1175/JCLI-D-11-00627.1
Mahala, B. K., Nayak, B. K., and Mohanty, P. K. (2015). Impacts of ENSO and IOD on Tropical Cyclone Activity in the Bay of Bengal. Nat. Hazards 75 (2), 1105–1125. doi:10.1007/s11069-014-1360-8
Meyers, G., McIntosh, P., Pigot, L., and Pook, M. (2007). The Years of El Niño, La Niña, and Interactions with the Tropical Indian Ocean. J. Clim. 20 (13), 2872–2880. doi:10.1175/JCLI4152.1
Pal, A., and Chatterjee, S. (2020). Seasonal Nature and Trends of Tropical Cyclone Frequency and Intensity over the North Indian Ocean. Curr. World Environ. 15 (3), 526–534. doi:10.12944/cwe.15.3.16
Rayner, N. A., Parker, D. E., Horton, E. B., Folland, C. K., Alexander, L. V., Rowell, D. P., et al. (2003). Global Analyses of Sea Surface Temperature, Sea Ice, and Night marine Air Temperature since the Late Nineteenth century. J. Geophys. Res. 108 (14). doi:10.1029/2002jd002670
Shinoda, T., Hurlburt, H. E., and Metzger, E. J. (2011). Anomalous Tropical Ocean Circulation Associated with La Niña Modoki. J. Geophys. Res. 116 (12). doi:10.1029/2011JC007304
Song, L., Chen, S., Chen, W., and Chen, X. (2017). Distinct Impacts of Two Types of La Niña Events on Australian Summer Rainfall. Int. J. Climatol. 37 (5), 2532–2544. doi:10.1002/joc.4863
Sun, D., Xue, F., and Zhou, T. (2013). Impacts of Two Types of El Niño on Atmospheric Circulation in the Southern Hemisphere. Adv. Atmos. Sci. 30 (6), 1732–1742. doi:10.1007/s00376-013-2287-9
Wang, C., Li, C., Mu, M., and Duan, W. (2013). Seasonal Modulations of Different Impacts of Two Types of ENSO Events on Tropical Cyclone Activity in the Western North Pacific. Clim. Dyn. 40 (11–12), 2887–2902. doi:10.1007/s00382-012-1434-9
Wu, L., Zhang, H., Chen, J.-M., and Feng, T. (2018). Impact of Two Types of El Niño on Tropical Cyclones over the Western North Pacific: Sensitivity to Location and Intensity of Pacific Warming. J. Clim. 31 (5), 1725–1742. doi:10.1175/JCLI-D-17-0298.1
Xu, S., and Huang, F. (2015). Impacts of the Two Types of El Niño on Pacific Tropical Cyclone Activity. J. Ocean Univ. China 14 (2), 191–198. doi:10.1007/s11802-015-2421-7
Yang, S. (2018). Different Impacts of Two Kinds of Pacific Ocean Warming on Tropical Cyclone Frequency over the Western North Pacific. Geophys. Res. Lett. 31 (5), 1–6. doi:10.1175/JCLI-D-17-0298.1
Yu, J.-Y., and Kim, S. T. (2011). Relationships between Extratropical Sea Level Pressure Variations and the central Pacific and Eastern Pacific Types of ENSO. J. Clim. 24 (3), 708–720. doi:10.1175/2010JCLI3688.1
Yu, J.-Y., Wang, X., Yang, S., Paek, H., and Chen, M. (2017). The Changing El Niño-Southern Oscillation and Associated Climate Extremes. Clim. Extremes,Geophysical Monogr. Ser. 226, 1–38. doi:10.1002/9781119068020.ch1
Yuan, Y., and Yan, H. (2013). Different Types of La Niña Events and Different Responses of the Tropical Atmosphere. Chin. Sci. Bull. 58 (3), 406–415. doi:10.1007/s11434-012-5423-5
Keywords: the Bay of Bengal, El Niño diversity, eastern Pacific-type El Niño, central Pacific-type El Niño, genesis potential index, primary TC peak season, secondary TC peak season
Citation: Lakshani WAE, Zhou W and Cheung PKY (2022) Impacts of El Niño Diversity on Tropical Cyclone Activity in the Bay of Bengal. Front. Earth Sci. 10:824769. doi: 10.3389/feart.2022.824769
Received: 29 November 2021; Accepted: 14 January 2022;
Published: 10 February 2022.
Edited by:
Hui Yu, China Meteorological Administration, ChinaReviewed by:
Ping Huang, Institute of Atmospheric Physics (CAS), ChinaCopyright © 2022 Lakshani, Zhou and Cheung. This is an open-access article distributed under the terms of the Creative Commons Attribution License (CC BY). The use, distribution or reproduction in other forums is permitted, provided the original author(s) and the copyright owner(s) are credited and that the original publication in this journal is cited, in accordance with accepted academic practice. No use, distribution or reproduction is permitted which does not comply with these terms.
*Correspondence: Wen Zhou, d2VuemhvdUBjaXR5dS5lZHUuaGs=
Disclaimer: All claims expressed in this article are solely those of the authors and do not necessarily represent those of their affiliated organizations, or those of the publisher, the editors and the reviewers. Any product that may be evaluated in this article or claim that may be made by its manufacturer is not guaranteed or endorsed by the publisher.
Research integrity at Frontiers

Learn more about the work of our research integrity team to safeguard the quality of each article we publish.