 Xing Yang
 Tie-bao Zhang1*
 Ming-jian Liang
- 1Sichuan Earthquake Administration, Chengdu, China
- 2Chengdu Institute of the Tibetan Plateau Earthquake Research, CEA, Chengdu, China
- 3Chengdu Earthquake Monitoring Center Station, Chengdu, China
- 4Xichang Earthquake Monitoring Center Station, Xichang, China
We processed MODIS data received from ground receiving stations into the spatial range of the Qinghai-Tibetan Plateau (China) and the eastern margin of the plateau, and then 283 K was set as the threshold value to remove the area covered by clouds. The monthly background field was calculated based on 17 years’ data, then we obtained the spatial Brightness Temperature anomaly of the current month by deducting the background field. Furthermore, the Brightness Temperature anomaly curves for secondary tectonic blocks in the plateau were calculated. The data indicated that since June 2020, the Brightness Temperature radiation within the Qinghai-Tibetan Plateau began to increase abnormally, starting from the western part of the study area and expanding eastward to cover the entire plateau. In January 2021, such an anomaly was seen again, extending to the Sichuan-Yunnan Block in the easternmost part of the study area in april. With the ongoing anomaly, a series of moderate and strong earthquakes occurred in the Qinghai-Tibetan Plateau, and finally, on 22 May 2021, the M7.4 earthquake struck the Madoi County. Moreover, according to the internal Brightness Temperature time series curves of the different secondary tectonic blocks, the Brightness Temperature has increased simultaneously since the beginning of 2020. A twofold standard deviation was found in the middle-east segment of the Bayanhar Block and the Qiangtang Block in October 2020, and an almost twofold standard deviation was found in March, while a twofold standard deviation was found in the Sichuan-Yunnan Block in april 2021. The occurrence of earthquakes in the plateau before the Madoi earthquake coincided with an upward trend of the time series curve. The spatial anomaly of Brightness Temperature over the Qinghai-Tibetan Plateau disappeared and the Brightness Temperature time series curve dropped drastically after the Madoi earthquake. The development of spatial anomaly of Brightness Temperature and the time series curve both coincide with the occurrence of earthquakes and are consistent with the generation of tectonic stress in the Qinghai-Tibetan Plateau. Our study showed that thermal infrared Brightness Temperature radiation reasonably reflects regional stress development and enables the detection of anomalies prior to moderate and strong earthquakes.
Introduction
Since the 1980s, thermal infrared data collected by an observation of the satellite platform was used to obtain abnormal information prior to earthquakes (Gorny et al., 1988). Significant thermal infrared radiation anomalies are usually recognized prior to moderate and strong earthquakes all over the world. Compared with conventional methods used to obtain information on earthquake anomalies, data collection via satellites is not limited by time and space, and they provide data with high spatial and temporal resolution worldwide. Moreover, satellite detection is less affected by ground factors, such as human activities or the stability of observation instruments on the ground, thus providing reliable and continuous observation results. Satellites can also be used to collect earthquake anomalies through a model integrating multiple means, multiple parameters, and multiple layers. As a consequence, ground surface parameters including temperature, outgoing long-wave radiation, and thermal infrared radiation can be detected (Ouzounov et al., 2004, Ouzounov et al., 2007; Tronin et al., 2002, Tronin et al., 2004; Rawat et al., 2011). Besides those ground surface parameters, atmospheric water vapor, CO2, CH4, CO, and other parameters can be monitored (Cui et al., 2011; Dey et al., 2004; Feng et al., 2020; Hayer et al., 2016; Weiyu et al., 2018; Wang et al., 2015; Zhong et al., 2020). The analysis of ground surface parameters prior to earthquakes in different areas revealed that temperature rise occurred in a large area around the epicenter and its vicinity several months to a week before the onset of the earthquake (Cervone et al., 2006; Tronin et al., 2002, Tronin et al., 2004; Pulinets et al., 2006; Xiong et al., 2010). Furthermore, significant anomalies in outgoing long-wave radiation were observed (Gruber et al., 1984; Ouzounov et al., 2007; Rawat et al., 2011; Kane, 2008; Zhang et al., 2017). Among the atmospheric parameters, the concentrations of CO2, CH4, and other gases increased in the seismic breeding zone prior to the earthquake due to underground gas overflow within this region. Such an anomaly often occurred several months to several weeks before the earthquake, and in some areas, a sudden rise in the impending stage was recorded (Corradini et al., 2010; Pardini et al., 2017; Theys et al., 2019; Feng et al., 2020).
With the increase of the monitored parameters, research methods for the reasonable interpretation of the data have been developed. Among them, eddy field, wavelet maxima, and power spectrum methods are used widely (Gruber et al., 1984; Saraf et al., 2008; Xiong et al., 2010). Based on the eddy field method, information about abnormal processes in the studied region can be obtained when the spatial resolution of data is low. For example, the outgoing longwave radiation data of NOAA(National Oceanic and Atmospheric Administration) documented different degrees of anomalies before many earthquakes worldwide (Gruber et al., 1984; Saraf et al., 2008; Xiong et al., 2010). The Wavelet Maxima method can be used to collect clear anomalies in the time domain. based on this method, interference phenomena caused by non-earthquake factors can be excluded, and the time of an anomaly result from the earthquake can be determined accurately (Cervone et al., 2004, Cervone et al., 2005; He et al., 2014; Saradjian et al., 2011; Xiong et al., 2010). The power spectrum method enables to analyze the data spectrum, which is a reliable method that was applied to monitor earthquakes for example in the eastern margin of the Qinghai-Tibetan plateau in China (Zhong et al., 2020).
The above methods and data have been successfully used and provided reasonable results in the study of earthquake anomalies all over the world. However, most studies are limited by the duration of available data. Usually, the data used in the studies are collected within 3–5 years or even within a shorter period. The limited time often complicates the modeling of a solid background field of the studied seismic breeding area. In this research, we take into account a long duration of time and try to use the Brightness Temperature (BT) as the parameter to find anomalies before earthquakes. Even thermal infrared brightness temperature was used in previous studies to detect the anomalies before earthquakes. However, only few studies have used BT data collected by Moderate-resolution Imaging Spectroradiometer (MODIS). The satellite of the MODIS sensor has operated in the orbit for more than 20 years, producing an enormous number of observation results, which requires huge storage space and supports from a long-time follow-up analysis. In the present study, the major M7.4 Madoi earthquake on 22 May 2021, and several moderate to strong earthquakes in the Qinghai-Tibetan Plateau from June 2020 (Table 1), were analyzed with BT data, collected by MODIS for nearly 17 years, to detect the variation of BT in two dimensions (space and time) and determine the possible anomalies. Based on the data we propose a refined model for the evolution of the Madoi earthquake.
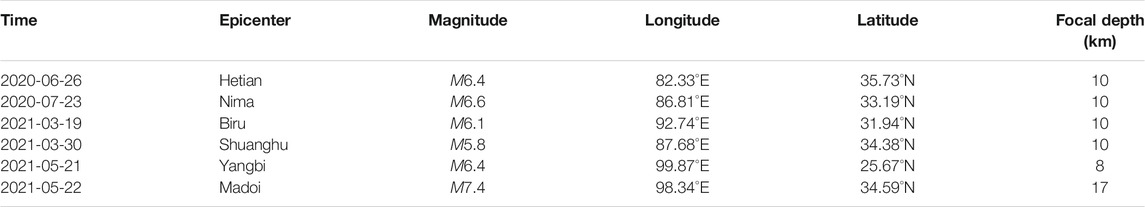
TABLE 1. Data of moderate and strong earthquakes in the Qinghai-Tibetan Plateau (2020.06–2021.05).
Data and Methodology
Dataset
Moderate-resolution Imaging Spectroradiometer (MODIS) is a sensor on the TERRA and AQUA satellites. TERRA was launched in 1999 and AQUA in 2002. The orbital altitude of both satellites is 705 km, with a coverage area (Swath Dimensions) of 2,330 km2. The spatial resolution ranges from 250 to 1,000 m and the observed waveband length is from 0.405 to 14.385 µm. The two satellites can observe both the atmosphere and ground surface.
Data Processing
In 2004, our research team established the satellite ground receiving station to constantly receive data from MODIS. The ground radio antenna could receive the satellite data on time every day, and the ground equipment also includes other receiving and data processing devices. We developed a software system equipped with geometric correction, radiometric correction, and other functions that enables the complete data clipping, splicing, and other operations and the conversion of the original data into thermal radiation BT. In the present study, we focus on earthquakes that occurred in the Qinghai-Tibetan Plateau (from June 2020 to May 2021). As the Qinghai-Tibetan Plateau was extruded by the Indian plate, the plateau migrated eastward and the stress was concentrated on the eastern margin of the Qinghai-Tibetan Plateau. The study area of this research covers the entire Qinghai-Tibetan Plateau (70°–110°E, 20°–45°N) and its eastern margin (90°–110°E, 20°–40°N; Figure 1). Because the plateau’s move creates different secondary tectonic blocks, we only take the eastern margin of the Plateau (90°–110°E, 20°–40°N) as the time series tracking area. The schematic map of the two study areas and the distribution of earthquakes with M ≥ 5.8 that occurred during the studied period is presented in Figure 1, and the information related to earthquakes is summarized in Table 1.
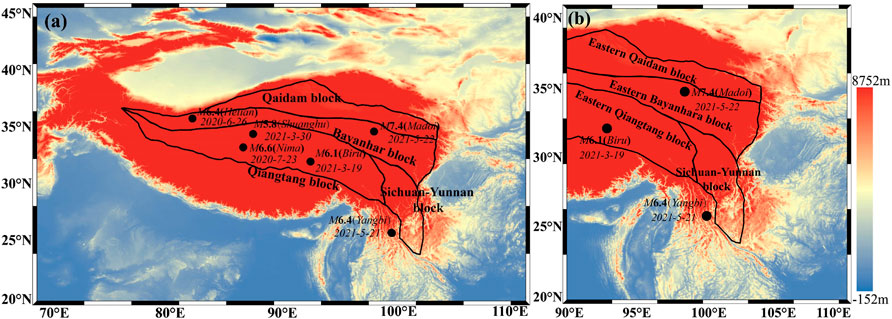
FIGURE 1. Distribution of earthquakes (active from 2020.06 to 2021.05) with M ≥ 5.8 in (A) the Qinghai-Tibetan Plateau and (B) its eastern margin.
Brightness temperature is the temperature at which a black body in thermal equilibrium with its surroundings would have to be in order to duplicate the observed intensity of a grey body object at a frequency
Eight wave bands, including 1–2, 20–23, and 31–32, were selected in the beginning of our study for BT inversion. Our data indicate that the 21-band provided the best response effect to the anomalies before the earthquake in the subsequent experiments where the historical earthquakes in the target areas were summarized. The wavelength of 21-Band is 3.93–3.99 um, as well as the spatial resolution of Band-21 is 1,000 m. Band-21 locates in the range of thermal infrared, it is profoundly sensitive to surface infrared radiation and the temperature of the cloud’s canopy. As TERRA is an optical satellite, the collected data need to be processed by cloud removal. MODIS uses the maximum value on one pixel in some time past as the observed value of the pixel on the one-phase data in the production process. This method was used as a reference in this study. The following procedure was applied to process the data: 1) The receiving station obtained the original data, which were subject to geometric and radiometric corrections in the processing system. Data of the study areas were clipped and converted into the BT data. 2) The daily data of the two study areas were obtained by splicing the clipped data. 3) After several tests, we recognize that in the process of removing clouds, multi-day data synthesized with a step size of 4 days after cloud removal could ensure the reliability of ground surface information and effectively remove cloud occlusion. 4) 283 K was set as the threshold, and cloud removal was repeatedly performed on the synthesized data of 4 days. Pixel with a lower value than the threshold was removed and only those higher than the threshold were used. After completion of this procedure, the BT data within the study areas were obtained (Figure 2). Figures 2A,B is shown by RGB format in order to highlight the cloud, the white in the Figs indicates the cloud; on the other hand, the black part in Figure 2C indicates the area without clouds cover, and the white is the cloud-removed area.
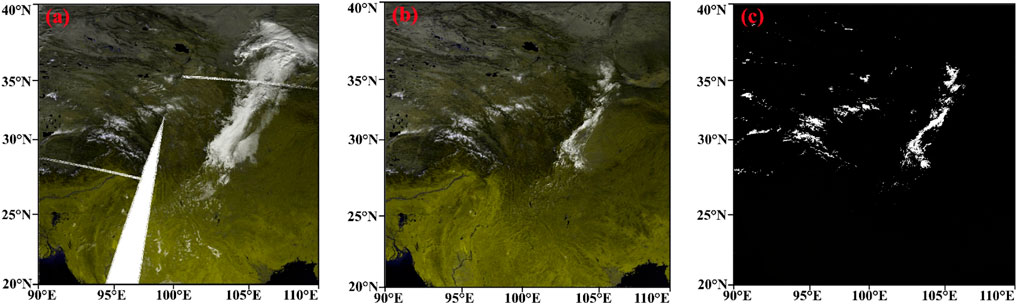
FIGURE 2. MODIS BT Images of the eastern margin of the Qinghai-Tibetan Plateau. (A) Single-day data splicing, (B) 4-days data splicing (The white in the figures almost indicates the cloud, the green is the region without cloud and the black represents the water), (C) Data after cloud removal (The white region is the cloud-removed area).
Methods
The Qinghai-Tibetan Plateau was uplifted (about starting in the Late Cretaceous and till to Late Eocene) after being extruded by the Indian subcontinent. Therefore, the internal ingredients and materials of the Qinghai-Tibetan Plateau migrated eastward, research shows that the speed of the plate is 50–60 mm/year (Tapponnier et al., 2001; Zhang et al., 2004). This migration is also based on the background of the eastward movement of the Eurasian plate, the GPS result demonstrated that the speed of the velocity field with respect to the Eurasian plate is 45 mm/year (Wang et al., 2020). The Tectonic deformation in continental China is mainly associated with the collision between the Indian and Eurasian plates. The northward indentation of the Indian plate has resulted in a continental deformation belt which is the most active, complex, and broad in the world (Xu et al., 2016; Wang et al., 2020). This migration process caused the formation of many secondary tectonic blocks inside the plateau (Tapponnier et al., 2001; Zhang et al., 2004; Chen et al., 2010), such as the Qiangtang Block and the Bayanhar Block. The eastward migration of the Qinghai-Tibetan Plateau was stopped by the eastern continental block (Southern China Block). The migration direction, therefore, turned to the south, again causing the generation of secondary tectonic blocks, such as the Sichuan-Yunnan Block (Figure 3). Due to the southward turning, the secondary blocks have the characteristics of right-handed movement in the east. Due to the intense tectonic activity, this east part is prone to M7.0 earthquakes in the past decade, including a series of recent strong earthquakes (Figure 3): Wenchuan M8.0 in 2008, Yushu M7.1 in 2012, and M7.0 Jiuzhaigou in 2017. The Madoi M7.4 on 22 May 2021, the topic of the present study, and earlier moderate-strong earthquakes in the previous year (from June 2020) also occurred in this context.
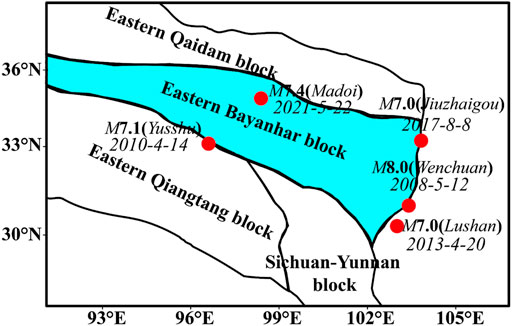
FIGURE 3. Schematic map showing secondary tectonic blocks on the eastern margin of the Qinghai-Tibetan Plateau and the distribution of strong earthquakes after 2008.
Spatial Tracking of BT Anomalies
In the present study, we focus on the Qinghai-Tibetan Plateau and its eastern margin. Based on 17 years of data collected by the ground station with natural months as the time step, the monthly background field was calculated by the average value method, the same month’s data in every year was added together then divided by 17, so finally, we have 12 monthly background fields. Subsequently, the BT anomaly was obtained after the background field was subtracted from the BT data of the study area (70°-110°E, 20°-45°N) from June 2020 to September 2021. In this way, the BT spatial anomalies in the study area were calculated, respectively. The anomaly was calculated by formula (2), where
Time Series Tracking of Secondary Blocks
In previous studies, some extracted data from a certain range near the epicenter for time series analysis, while others did so in the entire study area. The former failed to consider that the anomaly might not occur near the epicenter, whereas the latter might include the non-anomaly area in the calculation, thus weakening the anomaly information. Considering the geodynamic evolution, the overall force status of the Qinghai-Tibetan Plateau varies across the area, roughly with 90°E as the boundary. Due to the extrusion of the Indian subcontinent, the stress in the west of the 90°E showed a tendency to continue with a northward movement, whereas in the east of the 90°E the stress continued in an eastward direction (Chen, YT, et al., 1996; Hui et al., 2012; Wu et al., 2020), causing the eastern edge of the Qinghai-Tibetan Plateau to become the front end of power transmission. Consequently, tectonic activity is concentrated in this area. Therefore, this area represents the cumulative development of stress prior to the earthquake and the afterward adjustment of the stress. Moreover, several secondary tectonic blocks were formed during the action of stress in the eastern margin area, including the Eastern Bayanhar Block, the Eastern Qiangtang Block, and the Sichuan-Yunnan Block (Figure 3). Therefore, considering these secondary tectonic blocks of the eastern part as a unit, the time series curve of BT in the unified block was calculated. Specifically, after the background field of BT was deducted based on the data of 17 years, the time series curve of BT was obtained with the twofold standard deviation as the threshold line of anomaly determination (Formula (3)). In the equation,
Results
Characteristics of Spatial Anomaly Evolution Before Earthquakes
Figures 4A-L show the images of BT anomalies in the Qinghai-Tibetan Plateau from June 2020 to May 2021, thus 12 months in total. In this period, the Hetian M6.4 earthquake (26 June 2020), Nima M6.6 earthquake (23 July 2020), Biru M6.1 earthquake (19 March 2021), Shuanghu M5.8 earthquake (30 March 2020), Yangbi M6.4 earthquake (21 May 2021), and Madoi M7.4 earthquake (22 May 2021) occurred. The diagrams clearly demonstrate that the BT anomalies develop from the western part to the eastern part of the Qinghai-Tibetan Plateau, evident from the gradual increase of the BT intensity. The Hetian M6.4 earthquake occurred in June 2020. In July 2020, BT anomalies are observed in the Indian subcontinent and the western part of the Qinghai-Tibetan Plateau, with the enhancement of more than about 4 K. The area of radiation anomaly in the western part of the Plateau alone attained around 500,000 km2. Moreover, the Nima M6.6 earthquake occurred at the margin of the area where BT anomalies occurred in July (Figure 4B). In August (Figure 4C), the radiation anomaly continued to develop eastward, with the radiation area further increasing up to 800,000 km2, extending to the southern margin of the Qinghai-Tibetan Plateau and the western Kunlun Mountains. In September, BT anomalies basically occupied the entire western region of the Qinghai-Tibetan Plateau, with an area of about 1.7 million km2 (Figure 4D). In October, the anomalies had covered the entire Plateau and even developed into the northern Sichuan-Yunnan Block (Figure 4E), occupying an area of about 3.1 million km2. In November, the area of radiation anomaly decreased obviously and only affected some parts of the Qinghai-Tibetan Plateau (Figure 4F). In December, the anomalies basically disappeared (Figure 4G). However, since January 2021, BT radiation anomaly reappeared, covering the Qinghai-Tibetan Plateau and the Tarim Basin, covering an area of nearly 3 million km2 (Figure 4H). This increase continues in February 2021, with the distribution expanding to the eastern part of the Mongolian Plateau and the Qilian Mountains (Figure 4I). The anomaly range basically covered half of the study areas, occupying about 6.5 million km2. In March 2021, the enhanced radiation range was reduced, but it still dominated the Qinghai-Tibetan Plateau. In this month, Biru M6.1 earthquake and Shuanghu M5.8 earthquake occurred in the Plateau, with an interval of only 11 days (Figure 4J). By april 2021, such an anomaly disappeared in the Qinghai-Tibetan Plateau, but shifted southward to the northern part of the Sichuan-Yunnan Block, covering an area more than 300,000 km2 (Figure 4K). In May 2021 the spatial BT radiation anomaly vanished but the Yangbi M6.4 earthquake occurred in the southwestern Sichuan-Yunnan Block, and then the Madoi M7.4 earthquake occurred in the eastern Bayankala Block almost in the same time (Figure 4L), with an interval of less than 5 h (on May 21 and 22, respectively).
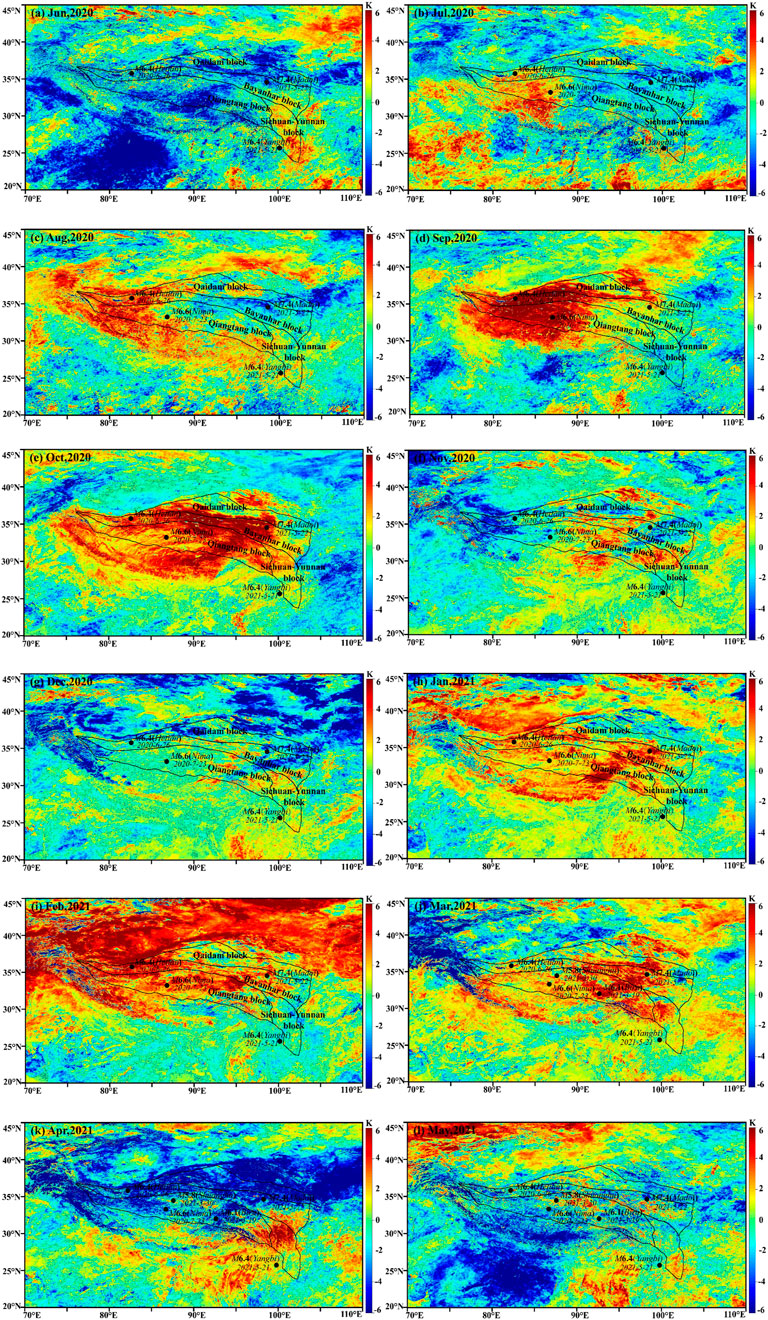
FIGURE 4. BT anomalies and earthquakes in the Qinghai-Tibetan Plateau (2020.06(A)-2021.05(L)).
Characteristics of the Post-earthquake Spatial Evolution
It has been mentioned in the former context that the eastern margin of the Qinghai-Tibetan Plateau (20°N∼40°N, 90°E∼110°E) became a center for the concentration of stress due to the tectonic evolution of the plateau. The present study was conducted to analyze the changes of the post-earthquake BT radiation in this area. Figure 5 highlights the evolution of the regional BT anomaly in the eastern margin of the Qinghai-Tibetan Plateau from June to September 2021. The maps indicate that the BT anomalies disappeared in space since the beginning of June 2021 (Figure 5A). In July (Figure 5B), several fluctuations in its space radiation are observed, but the strength is limited, which is a common phenomenon of stress adjustment in a post-earthquake zone. From August to September (Figures 5C,D), the BT radiation almost disappeared. We conclude from the perspective of BT changes that the regional energy was released after the earthquakes and the stress accumulation disappeared, causing the BT radiation anomalies to disappear as well in space.
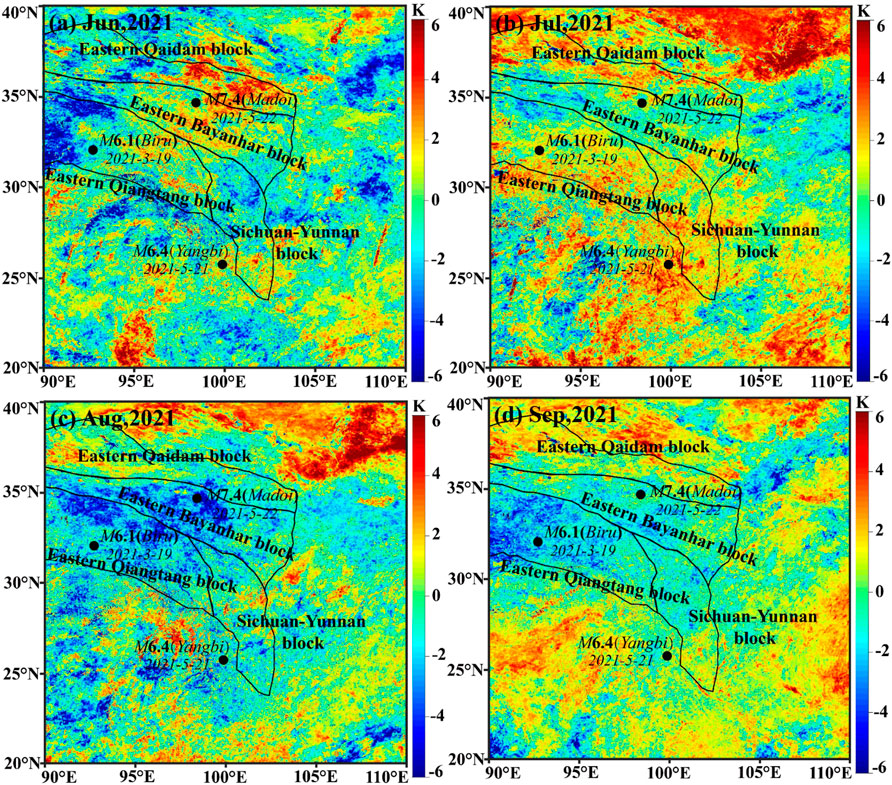
FIGURE 5. BT anomaly in the eastern margin of the Qinghai-Tibetan Plateau (2021.06 (A)-2021.09 (D)).
Time Series Tracking
The Eastern Bayanhar Block, the Eastern Qiangtang Block, and the Sichuan-Yunnan Block were selected to track the changes of BT in time series. Figures 6–8 correspond to the original BT data (Figure No.(a)), smoothing BT data (Figure No.(b)), the BT background field (Figure No.(c)) and the time series curve of BT anomaly in the three blocks. The original and smoothing data cover a time period from 2004 to September 2021. As the value of the BT background field was the same every year in the study period, only values during 2018–2020 were displayed. The BT anomaly was recorded from 2018 to September 2021(Figure No.(d)) and results from smoothing BT (Figure No.(b)) minus the background field (Figure No.(c)). In the diagrams, two times, one-and-a-half times, negative two times, and negative one-and-a-half times of standard deviations are marked in dotted lines. The BT anomalies occur as long as the curve exceeded two times the standard deviation. In the diagrams, Biru M6.1, Yangbi M6.4, and Madoi M7.4 earthquakes are marked with red pentacles.
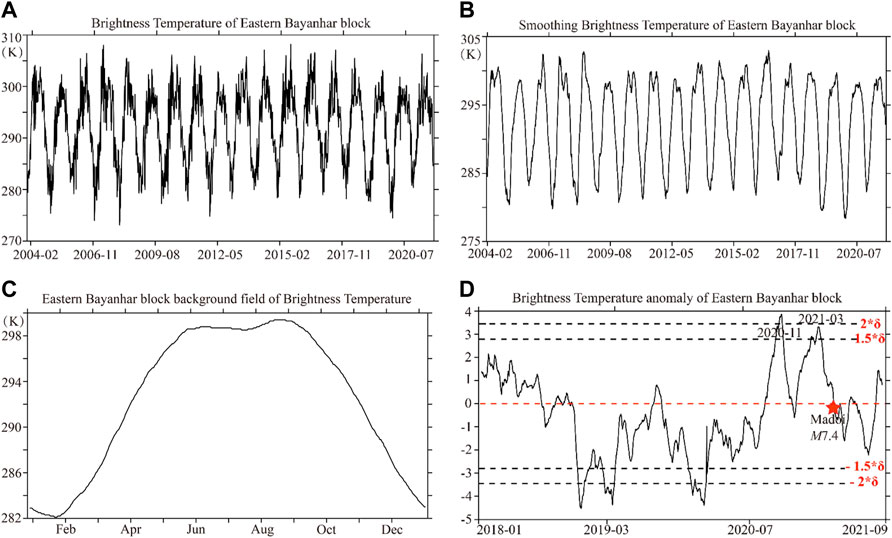
FIGURE 6. BT in (A) time series, (B) smoothing BT (C) background field of BT and (D) BT anomaly of the Eastern Bayanhar Block.
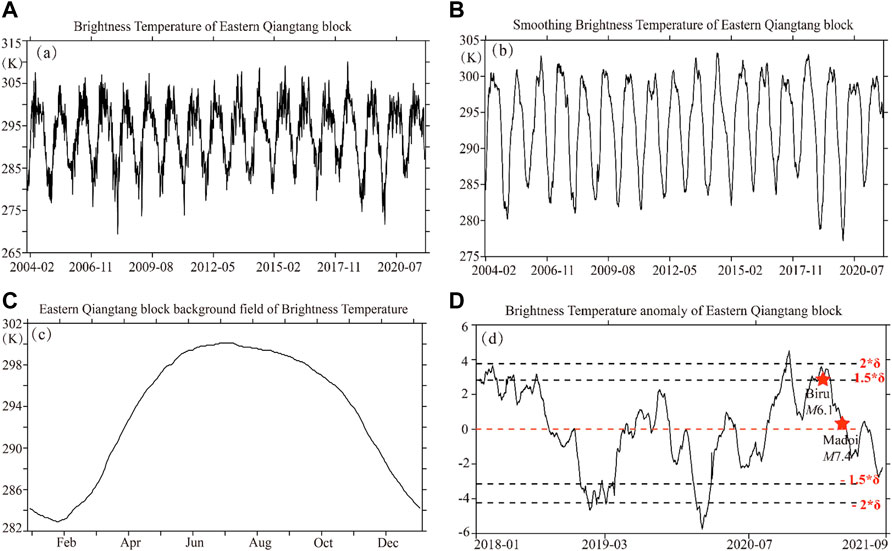
FIGURE 7. BT in (A) time series, (B) smoothing BT (C) background field of BT and (D) BT anomaly of the Eastern Qiangtang Block.
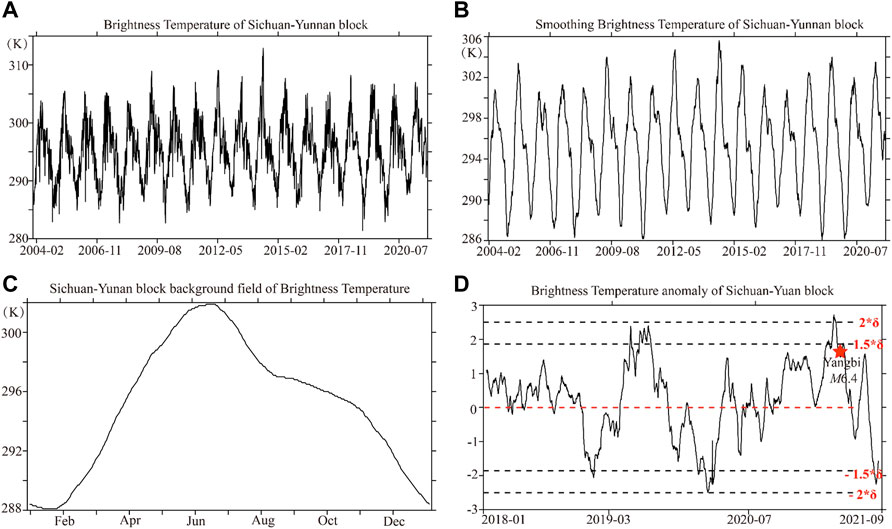
FIGURE 8. BT in (A) time series, (B) smoothing BT (C) background field of BT and (D) BT anomaly of the Sichuan-Yunnan Block.
The results in the figures reveal striking differences in the BT of the various blocks that are related to the tectonic position of the blocks. The blocks have a clear annual variation and exhibit different annual amplitudes. The overall amplitude range between 20 and 30 K, corresponding to high values in summer and low values in winter. The BT anomaly diagrams indicate that the curves exceeded the negative twofold standard deviation in early 2020 (the Bayanhar Block in late January), with its lowest point in mid-February (Figure 6D), and the Qiangtang Block in late January (Figure 7D), and then the curves increase rapidly, exceeding the twofold standard deviation in November (the Bayanhar Block reaches its maximum on November 16, and the Qiangtang Block on November 18). The roller-coaster change was formed in less than 11 months, demonstrating that BT anomalies were very prominent and the regional stress grew rapidly. Later, the BT anomaly curves of both blocks start to decrease until December 2020 but rapidly increase again after January 2021. They almost attained the threshold line-nearly twofold standard deviation in March 2021 (the Bayanhar Block reached its maximum value on March 28 and the Qiangtang Block on March 24). Two earthquakes, Biru M6.1 (on March 19) and Shuanghu M5.8 (on March 30) occurred after the internal Qiangtang Block curve increased twice. Finally, the curve decreases again and the Madoi M7.4 earthquake affected the Bayanhar Block about 50 days later.
The BT anomaly curve of the Sichuan-Yunnan Block (Figure 8D) varies from those of the Bayanhar Block and the Qiangtang Block. The curve of the Sichuan-Yunnan Block also began to rise rapidly after approaching the negative twofold standard deviation in February 2020, and the rising trend continued until the curve exceeded the twofold standard deviation, with a time span of about 14 months. Its BT anomaly curve reached the maximum value on april 30 and exceeded the twofold standard deviation to form anomalies. Later on, the curve decreases and after 21 days, the Yangbi M6.4 earthquake occurred.
Discussion
Link Between Spatial BT Anomalies and the Geodynamic Evolution
BT radiation anomalies document significant spatial and temporal migration in the Qinghai-Tibetan Plateau before the onset of the heavy M7.4 Madoi earthquake (Figure 4): The BT Anomalies occurred in the western Qinghai-Tibetan Plateau in July 2020 (Figure 4B), and then gradually spread eastward to the central plateau in August 2020, occupying the entire plateau after October 2020 (Figures 4C–F). From January to april 2021, the BT radiation anomalies reappeared (Figures 3H,I) and covered the northern Sichuan-Yunnan Block (Figures 4J,K. The evolution of BT radiation anomalies may be consistent with the geodynamic development of the Qinghai-Tibetan Plateau. The uplift of the Qinghai-Tibetan Plateau originated from the extrusion of the Indian subcontinent, the speed of the extrusion is about 50–60 mm/a (Tapponnier et al., 2001; Zhang et al., 2004). The plateau material was forced to migrate and later developed southward after the extrusion with the Southern China Block (Tapponnier et al., 2001; Zhang et al., 2004; Chen et al., 2010). The development of BT radiation anomalies probably corresponds to the geodynamic background and indicates the presence of a stress crush development in the Qinghai-Tibetan Plateau in the studied time interval, leading to a series of M6.0 earthquakes, including Madoi M7.4.
Correlation of BT Radiation Anomalies With Earthquakes
According to the principle of land surface thermal radiation anomalies, three major categories of theories were summarized in laboratory and practical applications through many studies: 1) Rock extrusion and burst (Saraf et al., 2008; Liu et al., 2016), 2) land surface degassing (Panda, et al., 2007; Saradjian et al., 2011) and 3) the theory of atmospheric ionization (Freund, 2000; Freund, 2002; Freund, 2003; Ouzounov et al., 2004; Pulinets et al., 2006; Ouzounov et al., 2007; Shah et al., 2018). In the seismogenic period, subsurface rocks are extruded or extended due to tectonic stress. Gradually, rocks burst internally and cause friction with other rocks externally. During the entire process, the thermal energy is accumulated and later released to spread outside from the lithosphere, and then to conduct to the air atmosphere in the form of thermal radiation. As a result, it forms the coupling of the lithosphere-atmosphere. The thermal radiation anomalies related to this process feature that with an extensive range and wide area, but can still be observed by satellites. (Eleftheriou et al., 2015; Lu et al., 2016). According to the pre-earthquake surface degassing theory, media in the lithosphere were squeezed and extended during the seismic breeding period, forcing subsurface heat source material to uprush. For example, the heat flux may rise to the surface through rocks fractures, forming an overburden layer in the form of water vapor on the land surface. Greenhouse gases, such as CO2 and CH4, could also rise to the surface along with rock fractures during the extrusion, and may create the regional “greenhouse effect” with water vapor and other gases on the surface. As a result, the surface temperature will increase and the surface thermal radiation will rise (Panda et al., 2007; Saradjian et al., 2011). A coupling process among lithosphere, air atmosphere, and ionosphere before strong earthquakes were reported in several studies (Freund, 2000; Freund, 2002; Freund, 2003; Ouzounov et al., 2004; Pulinets et al., 2006; Shah et al., 2018). The rock’s crack or fusion, and mineral dissolution or phase transition may cause the formation of daughter isotopes from the decay of radioactive isotopes in the minerals (Chen et al., 2021a), it should be emphasized that this mechanism is a hypothesis, which originates from observations and experimental results, it needs further confirmation in the future work. however, it still remains one of the mainstream consensuses on thermal radiation anomalies’ interpretation. So, the release of radon gas is used as an example; during radon gas decay, numerous
We summarized our result in Figure 9 which shows long trend time series from 2004 to 2021 in the Eastern Bayanhar block. The main earthquakes are underlined by a black arrow and it is possible to note a systematic increase in the BT radiation before most of the events that occurred in the investigated area. Both the Madoi M7.4 and a series of M6.0 earthquakes are originated from the tectonic activities inside the Qinghai-Tibetan Plateau, as tectonic extrusion must be accompanied by stress development. This process causes the enhancement of radiation in the seismogenic zone. The reason for the production of BT radiation anomalies in the study period is probably related to a combination of multiple processes, including rock extrusion and burst, the release of subsurface greenhouse gases, and atmospheric ionization. As the BT reflects the changes of the surface radiation value, heat sources or greenhouse gases may rather reflect the changes of surface temperature, and atmospheric ionization may rather be recorded by electromagnetic detection methods. Based on these findings and the tectonic evolution of the Qinghai-Tibetan Plateau, we propose that the lithosphere extrusion and the related stress development could be as the main reason for the observed anomalies and that the other two mechanisms were rather supplementary causes.
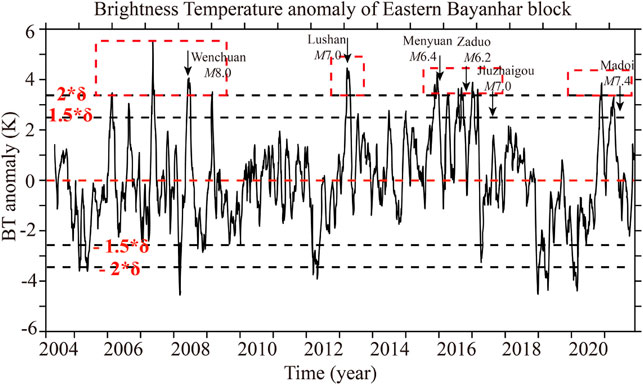
FIGURE 9. Time series of BT anomaly of the Eastern Bayanhar block from 2004 to 2021.
(The red dotted line indicates the 0-value line, the black dotted lines above and below the 0-value line represent the 1.5 (negative 1.5) and 2 (negative 2) times the standard deviation respectively; the red rectangles indicate the period of the BT radiation’s anomaly, and the black arrows are the corresponding earthquakes).
Correlation of Spatial and Temporal Anomalies With Seismic Events
Six moderate to strong earthquakes occurred in the interior and margin of the Qinghai-Tibetan Plateau between June 2020 and May 2021. The time and location of the seismic activity are significantly correlated with the development of BT Anomalies in space, and BT curves of the block also match the earthquake time. Therefore, we propose that the Madoi M7.4 earthquake and a series of earthquakes were not isolated events, but typically occurred inside the Qinghai-Tibetan Plateau under stress development.
In the beginning of 2020, the BT anomalies of the Eastern Bayanhar Block, the Eastern Qiangtang Block, and the Sichuan-Yunnan Block almost simultaneously began to rise from low values (Figures 6D, 7D and 8D). The values of the Bayanhar Block and the Eastern Qiangtang Block attained the maximum level in October 2020, exceeding the twofold standard deviation. This formed the only BT anomaly exceeding the twofold standard deviation since 2018. The BT radiation anomaly in space started in July 2020 and then gradually increased to cover the entire Qinghai-Tibetan Plateau finally (Figures 4B–E), which is consistent with the evolution of the time series. The Hetian M6.4 earthquake, Xinjiang on 26 June 2020, and the Nima M6.6 earthquake on 23 July 2020, occurred in the anomalous development process.
Since January 2021, BT anomalies had reappeared in the Qinghai-Tibetan Plateau, covering a larger area than before, and the BT time series curve also started to increase again. The BT anomalies developed from the hinterland of the Qinghai-Tibetan Plateau to the northern Sichuan-Yunnan Block. In this process, the Biru M6.1 earthquake and the Shuanghu M5.8 earthquake in Tibet occurred successively on March 19 and March 30, respectively and are also displayed in the high-value segment of the time series curve (Figures 6D, 7D). The BT spatial anomalies disappear in May (Figure 4J), and the Yangbi M6.4 and Madoi M7.4 earthquakes successively occurred on 21st and 22nd in the month. The Yangbi earthquake occurred at the southwest boundary of the Sichuan-Yunnan Block. This region marks the end of the tectonic migration and stress development of the Qinghai-Tibetan Plateau, so that stress conduction was slower than those of the Bayanhar and Qiangtang blocks. This was also the reason why the time series curve of the Sichuan-Yunnan Block started to rise and attained its peak at a lower rate compared with the other two blocks. The time series curve of the Sichuan-Yunnan Block exceeded the anomalies threshold of the twofold standard deviation in april 2021, and the Yangbi M6.4 earthquake occurred 21 days later.
Spatial and Temporal Development of BT Anomalies After the Earthquakes
The extensive spatial and temporal BT anomalies finally disappeared after the earthquakes (from June 2021) (Figure 5). Local anomalies in some time intervals were attributed to post-earthquake stress adjustment or normal annual variation, and the fluctuation of the time series curve was within the normal range after the Madoi earthquake. The adjustment to normal values of BT in time and space also demonstrated that the accumulated stress in the studied regions may have been completely released in the seismic events, and also indicated that the anomalies development of this stage might come to an end.
Conclusion
MODIS data were processed by splicing, cloud removal, extraction of the background field of BT, and the monthly calculation of BT anomalies with an independently developed system. The secondary tectonic blocks in the eastern margin of the Qinghai-Tibetan Plateau were modeled as one common unit to acquire the BT time series and spatial anomaly distribution of these blocks. Subsequently, the twofold standard deviation was taken as the anomaly threshold. The tracking study of the Madoi M7.4 and several previous earthquakes was conducted on this basis. The following conclusions are constrained by the new data:
(1) A strong correlation exists between earthquake occurrence and spatial anomaly of BT. The enhancement of BT radiation reflects changes in the regional stress field. The radiation anomalies of the Qinghai-Tibetan Plateau were generally consistent with stress conduction tendency on the tectonic evolution of the Qinghai-Tibetan Plateau. The BT anomalies developed from west to east and expanded its extent gradually. Meanwhile, it should be emphasized that the mechanism of the stress field and the BT variation is based on the inference of experimental results, a deep study of the stress filed goes behind the goal of this paper. In the anomaly development in 2020, the Hetian M6.4 and Nima M6.6 earthquakes occurred successively, and the Biru M6.1, Shuanghu M5.8, and Madoi M7.4 earthquakes occurred successively in 2021. In april 2021, BT anomalies extended into the Sichuan-Yunnan Block, and the Yangbi M6.4 occurred in the southwestern part of this block.
(2) A good correlation also exists between earthquake occurrence and the time series of BT. In the time series curve, covering 3 years, the phenomenon of exceeding the twofold standard deviation only occurred once in all the three blocks, and the BT anomalies in the blocks simultaneously began to rise from the beginning of the series in 2020. The BT anomalies of the Bayanhar and Qiangtang blocks exceeded the twofold standard deviation in October, and once again approached it in March 2021. The Sichuan-Yunnan Block exceeded the twofold standard deviation in april 2021, due to its location at the easternmost margin of stress development. The Hetian M6.4, Nima M6.6, Biru M6.1, and Shuanghu M5.8 earthquakes all occurred during the increase of time-series curves, whereas the Yangbi M6.4 and Madoi M7.4 earthquakes occurred during the decrease of the BT curves after they reached the maximum value.
(3) Regional BT anomalies disappear after the earthquakes and also the regional spatial BT anomalies simultaneously came to an end. Furthermore, the time series dropped to the normal range. Although the post-earthquake spatial and time series represent fluctuations on a small scale, they do not attain the abnormal standard, which might be caused by post-earthquake stress adjustment and annual variation.
(4) The occurrence of earthquakes could be in accordance with the distribution of the regional stress development. BT anomalies in space and time series reflect the development of regional stress. The time and location of earthquakes are consistent with the trend of the spatial BT anomalies and time series, indicating that the stress background of this earthquake may be consistent with that of the Qinghai-Tibetan Plateau.
Our study documents that the MODIS thermal infrared BT data is suitable to effectively obtain pre-earthquake anomalies, providing a new reference for the search of anomalies prior to earthquakes. The anomaly method, based on massive data accumulation over many years, is suitable for anomaly tracking. The results demonstrate that the study of the different parameters before earthquakes through satellites is highly promising for further research on earthquake detection.
Data Availability Statement
The original contributions presented in the study are included in the article/supplementary material, further inquiries can be directed to the corresponding author.
Author Contributions
XY, T-BZ, and QL: Software development, Methodology, Data processing, Visualization, Writing-Original draft preparation. XY, FL, M-JL, and W-WW: Data processing, Validation. XY, J-XW, and JW: Investigation.
Funding
This work is funded by the National Natural Science Foundation of China under Grant No. 42074082. This work is also supported by the Project of Science for Earthquake Resilience under Grant No. XH202302 and No. XH192305. This work is also supported by the Sichuan Science and Technology Project under Grant No.2020YJ0475.
Conflict of Interest
The authors declare that the research was conducted in the absence of any commercial or financial relationships that could be construed as a potential conflict of interest.
Publisher’s Note
All claims expressed in this article are solely those of the authors and do not necessarily represent those of their affiliated organizations, or those of the publisher, the editors and the reviewers. Any product that may be evaluated in this article, or claim that may be made by its manufacturer, is not guaranteed or endorsed by the publisher.
Acknowledgments
The authors are very grateful to NASA for providing the MODIS data. The authors would like to express gratitude to Professor Huang Fuqiong from China Earthquake Network Center(CENC) for applying to this special issue.
References
Bates, J. J., Wu, X., and Jackson, D. L. (1996). Interannual Variability of Upper-Troposphere Water Vapor Band Brightness Temperature. J. Clim. 9 (2), 427–438. doi:10.1175/1520-0442(1996)009<0427:ivoutw>2.0.co;2
Cervone, G., Kafatos, M., Napoletani, D., and Singh, R. P. (2004). Wavelet Maxima Curves of Surface Latent Heat Flux Associated with Two Recent Greek Earthquakes. Nat. Hazards Earth Syst. Sci. 4 (3), 359–374. doi:10.5194/nhess-4-359-2004
Cervone, G., Maekawa, S., Singh, R. P., Hayakawa, M., Kafatos, M., and Shvets, A. (2006). Surface Latent Heat Flux and Nighttime LF Anomalies Prior to the Mw=8.3 Tokachi-Oki Earthquake. Nat. Hazards Earth Syst. Sci. 6 (1), 109–114. doi:10.5194/nhess-6-109-2006
Cervone, G., Singh, R. P., Kafatos, M., and Yu, C. (2005). Wavelet Maxima Curves of Surface Latent Heat Flux Anomalies Associated with Indian Earthquakes. Nat. Hazards Earth Syst. Sci. 5 (1), 87–99. doi:10.5194/nhess-5-87-2005
Chen, L., Wang, H., Ran, Y., Sun, X., Su, G., Wang, J., et al. (2010). The M S7.1 Yushu Earthquake Surface Rupture and Large Historical Earthquakes on the Garzê-Yushu Fault. Chin. Sci. Bull. 55 (31), 3504–3509. doi:10.1007/s11434-010-4079-2
Chen, T., Li, L., Zhang, X. X., Ma, Q. M., Li, W., Ti, S., et al. (2021b). Near-epicenter Weather Conditions Several Hours before strong Earthquakes (Ms≥6). Nat. Hazards 110, 57–68. doi:10.1007/s11069-021-04907-2
Chen, T., Zhang, X. X., Zhang, X. M., Jin, X. B., Wu, H., Ti, S., et al. (2021a). Imminent Estimation of Earthquake hazard by Regional Network Monitoring the Near Surface Vertical Atmospheric Electrostatic Field. Chines J. Geophys. (In Chinese) 64 (4), 1145–1154. doi:10.6038/cig2021O0129
Chen, Y. T., Xu, L. S., Li, X., and Zhao, M. (1996). Source Process of the 1990 Gonghe, China, Earthquake and Tectonic Stress Field in the Northeastern Qinghai-Xizang (Tibetan) Plateau. Birkhäuser Basel 146, 697. doi:10.1007/978-3-0348-9200-1_16
Corradini, S., Merucci, L., Prata, F., and Piscini, A. (2010). Volcanic Ash and SO2 in the 2008 Kasatochi Eruption: Retrievals Comparison from Different IR Satellite Sensors. J. Geophys. Res. Space Phys. 115, 13634. doi:10.1029/2009jd013634
Cui, Y. J., Du, J. G., Chen, Z., Li, J., Xie, C., Zhou, X., et al. (2011). Remote Sensing Signals of Atmospheric Physics and Chemistry Related to 2010 Yushu Ms 7.1 Earthquake. Adv. Earth Sci. 26 (7), 787–794. doi:10.11867/j.issn.1001-8166.2011.07.0787
Dey, S., Sarkar, S., and Singh, R. P. (2004). Anomalous Changes in Column Water Vapor after Gujarat Earthquake. Adv. Space Res. 33 (3), 274–278. doi:10.1016/s0273-1177(03)00475-7
Eleftheriou, A., Filizzola, C., Genzano, N., Lacava, T., Lisi, M., Paciello, R., et al. (2015). Long-term RST Analysis of Anomalous TIR Sequences in Relation with Earthquakes Occurred in Greece in the Period 2004–2013. Pure Appl. Geophys. 173, 285. doi:10.1007/s00024-015-1116-8
Feng, J., Chauhan, A., Ramesh, P., and Prasanjit Dash, S. (2020). Changes in Atmospheric, Meteorological, and Ocean Parameters Associated with the 12 January 2020 Taal Volcanic Eruption. Remote Sensing 12 (6), 1026.
Freund, F. (2002). Charge Generation and Propagation in Igneous Rocks. J. Geodynamics 33 (4–5), 543–570. doi:10.1016/s0264-3707(02)00015-7
Freund, F. (2011). Pre-earthquake Signals: Underlying Physical Processes. J. Asian Earthquake Sci. 41 (4), 383–400. doi:10.1016/j.jseaes.2010.03.009
Freund, F. T. (2003). Rocks that Crackle and Sparkle and Glow: Strange Pre-earthquake Phenomena. J. Scientific Exploration 17 (1).
Freund, F. (2000). Time-resolved Study of Charge Generation and Propagation in Igneous Rocks. J. Geophys. Res. 105 (B5), 11001–11019. doi:10.1029/1999jb900423
Freund, F. T., Takeuchi, A., Lau, B., Al-Manaseer, A., and Ouzounov, D. (2006). Stimulated Infrared Emission from Rocks: Assessing a Stress Indicator. Eearth 2 (1). doi:10.5194/eed-1-97-2006
Gorny, V. I., Sal'Man, A. G., Tronin, A. A., and Shilin, B. V. (1988). Outgoing Infrared Radiation of the Earth as an Indicator of Seismic Activity. Doklady Akademii nauk SSSR 301, 67–69.
Gruber, A., and Krueger, A. F. (1984). The Status of the NOAA Outgoing Longwave Radiation Data Set. Bull. Amer. Meteorol. Soc. 65 (9), 958–962. doi:10.1175/1520-0477(1984)065<0958:tsotno>2.0.co;2
Hayer, C. S., Wadge, G., Edmonds, M., and Christopher, T. (2016). Sensitivity of OMI SO2 Measurements to Variable Eruptive Behaviour at Soufrière Hills Volcano, Montserrat. J. Volcanology Geothermal Res. 312, 1–10. doi:10.1016/j.jvolgeores.2016.01.014
He, L. M., Wu, L. X., De Santis, A., Liu, S. J., and Yang, Y. (2014). Is There a One-To-One Correspondence between Ionospheric Anomalies and Large Earthquakes along Longmenshan Faults? Ann. Geophys. 32 (2), 187–196. doi:10.5194/angeo-32-187-2014
Hui, Z., Gao, Y., Shi, Y. T., Liu, X. F., and Wang, Y. X. (2012). Tectonic Stress Analysis Based on the Crustal Seismic Anisotropy in the Northeastern Margin of Tibetan Plateau. Chin. J. Geophys. 55 (1), 95–104.
Kane, R. P. (2008). Spatial and Temporal Characteristics of Outgoing Longwave Radiation (OLR): an Update. Braz. J Geophys 26 (2), 227–236. doi:10.1590/s0102-261x2008000200009
Kobayashi, Y., Yasuoka, Y., Omori, Y., Nagahama, H., Sanada, T., Muto, J., et al. (2015). Annual Variation in the Atmospheric Radon Concentration in Japan. J. Environ. radioactivity 146, 110–118. doi:10.1016/j.jenvrad.2015.04.007
Liu, S., Xu, Z., Wei, J., Huang, J., and Wu, L. (2016). Experimental Study on Microwave Radiation from Deforming and Fracturing Rock under Loading Outdoor. IEEE Trans. Geosci. Remote Sensing 54, 5578–5587. doi:10.1109/tgrs.2016.2569419
Lu, X., Meng, Q. Y., Gu, X. F., Zhang, X. D., Xie, T., and Geng, F. (2016). Thermal infrared anomalies associated with multi-year earthquakes in the Tibet region based on China's FY-2e satellite data. Adv. Space Res. 58. doi:10.1016/j.asr.2016.05.038
Ouzounov, D., and Freund, F. (2004). Mid-infrared Emission Prior to strong Earthquakes Analyzed by Remote Sensing Data. Adv. Space Res. 33 (3), 268–273. doi:10.1016/s0273-1177(03)00486-1
Ouzounov, D., Liu, D., Kang, C., Cervone, G., Kafatos, M., and Taylor, P. (2007). Outgoing Long Wave Radiation Variability from Ir Satellite Data Prior to Major Earthquakes. Tectonophysics 431 (1-4), 211–220. doi:10.1016/j.tecto.2006.05.042
Panda, S. K., Choudhury, S., Saraf, A. K., and Das, J. D. (2007). MODIS Land Surface Temperature Data Detects thermal Anomaly Preceding 8 October 2005 Kashmir Earthquake. Int. J. Remote Sensing 28 (20), 4587–4596. doi:10.1080/01431160701244906
Pardini, F., Burton, M., de' Michieli Vitturi, M., Corradini, S., Salerno, G., Merucci, L., et al. (2017). Retrieval and Intercomparison of Volcanic SO2 Injection Height and Eruption Time from Satellite Maps and Ground-Based Observations. J. Volcanology Geothermal Res. 331, 79–91. doi:10.1016/j.jvolgeores.2016.12.008
Pulinets, S. A., Ouzounov, D., Ciraolo, L., Singh, R., Cervone, G., Leyva, A., et al. (2006). Thermal, Atmospheric and Ionospheric Anomalies Around the Time of the Colima m7.8 Earthquake of 21 January 2003. Ann. Geophys. 24 (3), 835–849. doi:10.5194/angeo-24-835-2006
Rawat, V., Saraf, A. K., Das, J., Sharma, K., and Shujat, Y. (2011). Anomalous Land Surface Temperature and Outgoing Long-Wave Radiation Observations Prior to Earthquakes in India and Romania. Nat. Hazards 59 (1), 33–46. doi:10.1007/s11069-011-9736-5
Saradjian, M. R., and Akhoondzadeh, M. (2011). Thermal Anomalies Detection before strong Earthquakes (M > 6.0) Using Interquartile, Wavelet and Kalman Filter Methods. Nat. Hazards Earth Syst. Sci. 11 (4), 1099–1108. doi:10.5194/nhess-11-1099-2011
Saraf, A. K., Rawat, V., Banerjee, P., Choudhury, S., Panda, S. K., Dasgupta, S., et al. (2008). Satellite Detection of Earthquake thermal Infrared Precursors in Iran. Nat. Hazards 47 (1), 119–135. doi:10.1007/s11069-007-9201-7
Shah, M., Khan, M., Ullah, H., and Ali, S. (2018). Thermal Anomalies Prior to the 2015 Gorkha (Nepal) Earthquake from Modis Land Surface Temperature and Outgoing Longwave Radiations. Geodin. Tektonofiz. 9 (1), 123–138. doi:10.5800/gt-2018-9-1-0341
Tapponnier, P., Zhiqin, X., Roger, F., Meyer, B., Arnaud, N., Wittlinger, G., et al. (2001). Oblique Stepwise Rise and Growth of the Tibet Plateau. Science 294 (5547), 1671–1677. doi:10.1126/science.105978
Theys, N., Hedelt, P., De Smedt, I., Lerot, C., Yu, H., Vlietinck, J., et al. (2019). Global Monitoring of Volcanic SO2 Degassing with Unprecedented Resolution from TROPOMI Onboard Sentinel-5 Precursor. Sci. Rep. 9 (9), 2643. doi:10.1038/s41598-019-39279-y
Tronin, A. A., Hayakawa, M., and Molchanov, O. A. (2002). Thermal in Satellite Data Application for Earthquake Research in Japan and China. J. Geodynamics 33 (4-5), 519–534. doi:10.1016/s0264-3707(02)00013-3
Tronin, A. A., Biagi, P. F., Molchanov, O. A., Khatkevich, Y. M., and Gordeev, E. I. (2004). Temperature Variations Related to Earthquakes from Simultaneous Observation at the Ground Stations and by Satellites in Kamchatka Area. Phys. Chem. Earth 29 (4-9), 501–506. doi:10.1016/j.pce.2003.09.024
Walia, V., Yang, T. F., Lin, S.-J., Kumar, A., Fu, C.-C., Chiu, J.-M., et al. (2013). Temporal Variation of Soil Gas Compositions for Earthquake Surveillance in Taiwan. Radiat. Measurements 50, 154–159. doi:10.1016/j.radmeas.2012.11.007
Wang, K., He, J., Schulzeck, F., Hyndman, R. D., and Riedel, M. (2015). Thermal Condition of the 27 October 2012 Mw 7.8 Haida Gwaii Subduction Earthquake at the Obliquely Convergent Queen charlotte Margin. Bull. Seismological Soc. America 105, 1290–1300. doi:10.1785/0120140183
Wang, M., and Shen, Z. K. (2020). Present-day Crustal Deformation of continental China Derived from GPS and its Tectonic Implications. J. Geophys. Res. Solid Earth 125 (2), e2019JB018774. doi:10.1029/2019jb018774
Weiyu, M., Xuedong, Z., Liu, J., Yao, Q., Zhou, B., Yue, C., et al. (2018). Influences of Multiple Layers of Air Temperature Differences on Tidal Forces and Tectonic Stress before, during and after the Jiujiang Earthquake. Remote Sensing Environ. 210 (210), 159–165. doi:10.1016/j.rse.2018.03.003
Wu, W., Long, F., Liang, M., Wei, Y., Sun, W., Chen, X., et al. (2020). Spatial and Temporal Variations in Earthquake Stress Drops between the 2008 Wenchuan and 2013 Lushan Earthquakes. Acta Geologica Sinica ‐ English Edition 94 (5), 1635–1650. doi:10.1111/1755-6724.14582
Wu, X., Bates, J. J., and khalsa, S. S. (2013). A Climatology of the Water Vapor Band Brightness Temperatures from NOAA Operational Satellites. J. Clim. 6 (7), 1282–1300.
Xiong, P., Shen, X. H., Bi, Y. X., Kang, C. L., and Chen, Y. (2010). Study of Outgoing Longwave Radiation Anomalies Associated with Haiti Earthquake. Nat. hazards earth Syst. Sci. 10 (10). doi:10.5194/nhess-10-2169-2010
Xu, Z., Jingsui, Y., and Zengqian, H. (2016). The Progress in the Study of continental Dynamics of the Tibetan Plateau[J]. Geology. China 43 (1), 1–42. (in Chinese with English abstract).
Zhang, P.-Z., Shen, Z., Wang, M., Gan, W., Bürgmann, R., Molnar, P., et al. (2004). Continuous Deformation of the Tibetan Plateau from Global Positioning System Data. Geol 32 (9), 809–812. doi:10.1130/g20554.1
Zhang, Y., Kang, C. L., Ma, W. Y., and Yao, Q. (2017). The Change in Outgoing Longwave Radiation before the Ludian Ms6.5 Earthquake Based on Tidal Force Niche Cycles. Earthq. Res. China 31, 422–430.
Keywords: MODIS, brightness temperature, radiation anomaly, spatial and temporal anomalies, time series analysis
Citation: Yang X, Zhang T-b, Lu Q, Long F, Liang M-j, Wu W-w, Gong Y, Wei J-x and Wu J (2022) Variation of Thermal Infrared Brightness Temperature Anomalies in the Madoi Earthquake and Associated Earthquakes in the Qinghai-Tibetan Plateau (China). Front. Earth Sci. 10:823540. doi: 10.3389/feart.2022.823540
Received: 27 November 2021; Accepted: 17 February 2022;
Published: 04 March 2022.
Edited by:
Giovanni Martinelli, National Institute of Geophysics and Volcanology, ItalyReviewed by:
Zheming Shi, China University of Geosciences, ChinaDedalo Marchetti, Jilin University, China
Copyright © 2022 Yang, Zhang, Lu, Long, Liang, Wu, Gong, Wei and Wu. This is an open-access article distributed under the terms of the Creative Commons Attribution License (CC BY). The use, distribution or reproduction in other forums is permitted, provided the original author(s) and the copyright owner(s) are credited and that the original publication in this journal is cited, in accordance with accepted academic practice. No use, distribution or reproduction is permitted which does not comply with these terms.
*Correspondence: Tie-bao Zhang, ODE2MjEyMTRAcXEuY29t