 Wenting Zhang
 Lingyun Ji
 Liangyu Zhu
 Chuanjin Liu
 Fengyun Jiang
 Xiaoxue Xu1,2
94% of researchers rate our articles as excellent or good
Learn more about the work of our research integrity team to safeguard the quality of each article we publish.
Find out more
ORIGINAL RESEARCH article
Front. Earth Sci., 15 February 2022
Sec. Solid Earth Geophysics
Volume 10 - 2022 | https://doi.org/10.3389/feart.2022.821761
This article is part of the Research TopicInSAR for Volcanoes and TectonicsView all 6 articles
The Ganzi-Yushu-Xianshuihe fault (GYXSF), a large strike-slip fault located on the east side of the Tibetan Plateau, has seen high seismic activity in recent years. However, despite the earthquake risk posed by this fault, there is a lack of high-resolution geodetic survey results regarding the current slip rate. We have used 4-track ascending and 5-track descending Sentinel-A/B SAR Interferometric Synthetic Aperture Radar (InSAR) data from 2014 to 2020, to obtain the current slip rate of the entire GYXSF within the radar’s line of sight (LOS), with high resolution. Both InSAR and published Global Positioning System (GPS) data were integrated to calculate a high-resolution three-dimensional deformation field and strain rate field of the GYXSF. We have also used the screw dislocation model to calculate current slip rates in the fault-parallel direction at 20 km intervals. The key findings of our study are as follows. (1) The current slip rate of the GYXSF is segmental: the slip rate of the Ganzi-Yushu fault (GYF) gradually increases from ∼1 to ∼6 mm/yr from the north-west to the southeast, while the slip rate of the Xianshuihe fault (XSF) increases from ∼8.5 to ∼12 mm/yr from the north-west to the southeast. (2) There are non-negligible post-earthquake deformations along the GYXSF, and our best fitting results show that an approximately 100 km long section of the GYF has undergone post-seismic after-slip in the 4–10 years since the 2010 Yushu M 6.9 earthquake, with a maximum creep of ∼2.2 mm/yr (3) The strain rate is dispersed in the GYF region but concentrated on the fault in the XSF region. There is also a measurable strain rate on secondary faults north of the GYXSF, implying the seismic hazard of these secondary faults cannot be ignored. (4) The continuous deformation and block-like models are the best models to explain the observations and deformation characteristics of the GYF and XSF, respectively.
The Ganzi-Yushu-Xianshuihe fault (GYXSF) is an approximately 1,000 km long Holocene left-lateral strike-slip fault system, obliquely aligned along the southern boundary of the Baynhar block (Figure 1). Part of the GYXSF is the left-lateral strike slip Ganzi-Yushu fault (GYF), which has a total length of nearly 770 km. It can be divided into five sections based on geological observations and characteristics of the faulted landform: the Fenghuoshan-Dangjiang, Yushu, Dengke, Manigange, and Ganzi sections (Zhou et al., 1996; Wen et al., 2003). The GYXSF also contains the Xianshuihe fault (XSF), which has a total length of nearly 350 km, and is formed when eastward movement of the Tibetan Plateau was resisted by the stable South China block, which resulted in the clockwise rotation of the internal sub-blocks. The XSF can also be divided into five sections: the Luhuo, Daofu, Qianning, Kangding, and Moxi sections (Li, 1997; Wen, 2000).
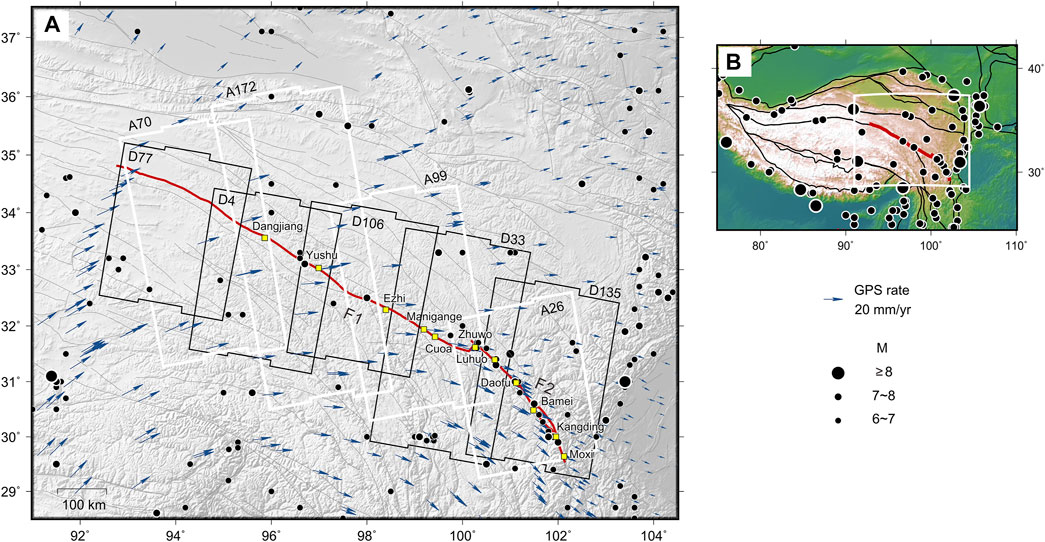
FIGURE 1. (A) Seismotectonic setting of the GYXSF. The red line is the GYXSF, with the GYF and XSF labeled F1 and F2, respectively. White and black rectangles indicate areas covered by ascending and descending Sentinel-1 images, respectively. Blue arrows indicate the horizontal velocity fields based on GPS (Gan et al., 2007; Han et al., 2019), gray lines represent fault lines mapped by (Xu et al., 2017). (B) Location of the GYXSF in relation to the Tibetan Plateau. The white box is the area shown in (A), with the GYXSF shown by the red line. The black lines are active block boundaries mapped by (Zhang et al., 2003). In both figures, the black circles are the locations of earthquakes ≥ M 7 that have occurred since 1900.
GYXSF is one of the most complex active structures in the Tibetan Plateau, and it is usually regarded as an important path for the southeastward exclusion of crustal material from the Indo-Eurasian collision zone (England and Houseman, 1986; Tapponnier et al., 2001; Zhang et al., 2004). Therefore, obtaining the current slip rate of each section of the GYXSF can be helpful for understanding the mechanisms underlying the eastward expansion of the Tibetan Plateau. The GYXSF is also one of the most seismically active intra-continental fault systems in China (Wen et al., 2008; Xu et al., 2017). Historical earthquake records and paleoseismic data reveal that the GYF and XSF have experienced more than 20 earthquakes > M 6.5 since A.D. 1700, including the 2010 M 6.9 Yushu earthquake (Zhou et al., 1997; Wen et al., 2003; Wen et al., 2008; Chevalier et al., 2018). Therefore, precise determination of the current slip rates of the GYXSF is of great importance for analyzing regional earthquake hazards.
Many studies have calculated the slip rate of the GYXSF using geological and geodetic methods (Figure 2). Geological studies suggest that the overall slip rate of GYF gradually increases from northwest to southeast, but the slip rates obtained by different studies differ greatly (Zhou et al., 1996; Wen et al., 2003; Xu et al., 2003; Peng et al., 2006; Lin et al., 2011; Wu et al., 2014; Shi et al., 2016; Xu et al., 2017; Chevalier et al., 2018), and the northwestern segment of the XSF has a higher slip rate than the southeastern segment in general (∼10–18 and 6–8 mm/yr, respectively) (eg., Tang and Huang, 1983; Molnar and Qidong, 1984; Qian et al., 1988; Allen et al., 1991; Li et al., 1995; Zhou et al., 1996; Li, 1997; Wang, 1998; Bai et al., 2021; Bai et al., 2018; Chen et al., 2008; Chevalier et al., 2018; Huang et al., 2015; Lin et al., 2011; Peng et al., 2006; Shi et al., 2016; Wen et al., 2003; Wu et al., 2017; Wu et al., 2014; Xu et al., 2003). However, GPS data suggests that the overall present-day slip rates of the GYF and XSF are approximately 4–16 and 7–16 mm/yr, respectively (eg., Gan et al., 2007; Guo et al., 2018; Jiang et al., 2015; Loveless and Meade, 2011; Shen et al., 2005; Wang and Shen, 2020; Wang et al., 2008; Wang et al., 2017; Wang et al., 2013; Zheng et al., 2017). Disagreement in the slip rate and incomplete data across the entire GYXSF are the two main limitations in the existing research. These limitations hinder the analysis of the kinematic characteristics of the GYXSF at the kilometer scale.
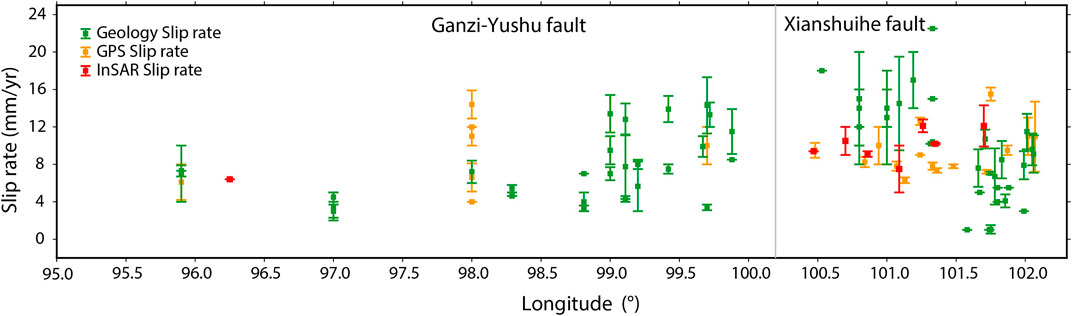
FIGURE 2. Strike-slip rates along the GYF and XSF. Green, orange, and red rectangles with error bars are slip rates from previous studies, estimated from geological, GPS, and InSAR data.
Compared to traditional geodetic methods, Interferometric Synthetic Aperture Radar (InSAR) can measure crustal deformation at a spatial resolution of tens of meters and an accuracy of millimeters per year, owing to its all-day operational, ability to penetrate clouds, and its high resolution (Elliott et al., 2016). Therefore, it has been routinely used to map interseismic deformation and strain accumulation rate over large regions (eg., Fattahi and Amelung, 2016; Hussain et al., 2016; Ji et al., 2020; Liu et al., 2018; Wang et al., 2009; Weiss et al., 2020; Zhu et al., 2021). Previous InSAR results in the study area show similar slip rates to GPS (Figure 2) but with higher resolution. However, these studies did not obtain the three-dimensional deformation of the fault due to the single-looked observation geometry of SAR satellites and the deformation field did not cover the entire GYXSF (eg., Ji et al., 2020; Jiang et al., 2015; Li and Bürgmann, 2021; Liu et al., 2011; Qiao and Zhou, 2021; Wang et al., 2009).
In this study, we have processed ascending and descending Sentinel-1 images from 2014 to 2020 InSAR, to obtain high-spatial-resolution deformation velocity data for the entire GYXSF. InSAR and recently published GPS data were integrated to calculate the high-resolution three-dimensional deformation field of the GYXSF. Subsequently, based on the integrated velocity field, the current slip rates along the GYXSF in the fault-parallel direction were estimated, and the strain rate field was calculated and analyzed. Finally, the current kinematic mode of the GYXSF is discussed based on observations.
We collected 877 Sentinel-1 Synthetic Aperture Radar (SAR) images from four ascending paths (70, 172, 99, and 26) and five descending paths (77, 4, 106, 33, and 135) covering the entire GYXSF. All of these images were located between 92.3 and 103.5°E and were taken between 2014 and 2020. Details on the processed data for each track are listed in Table 1.
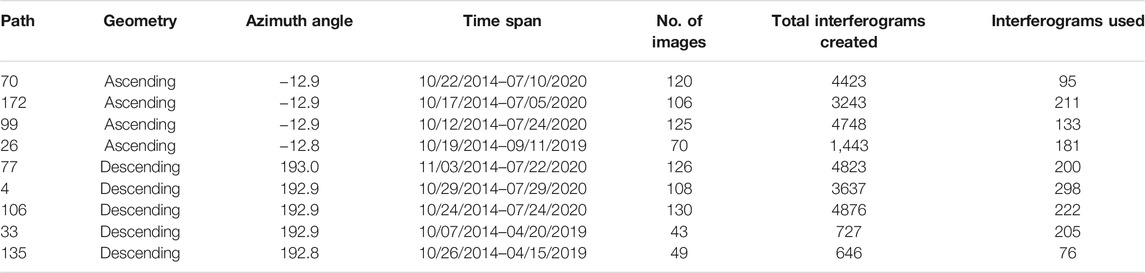
TABLE 1. Data coverage for each Sentinel-1 path used in this study.
Sentinel-1 images were processed using GAMMA software (Werner et al., 2000) and used to construct 28,566 interferograms. We used the Shuttle Radar Topography Mission Digital Elevation Model (SRTM DEM) to improve the co-registration accuracy of the SAR images and correct the interferograms for topographic contributions to the radar phase. To improve the interferometric coherence, interferograms were multi-looked with a factor of 120:30 and filtered using a weighted power spectrum filter (Goldstein and Werner, 1998). We then unwrapped the interferometric phase using a minimum cost flow algorithm, the chosen reference pixels were points with persistent coherent and close to the fault trace.
The local phase unwrapping ambiguity error was a significant issue during InSAR processing because of the dense vegetation in the study area. To eliminate the unwrapping errors we filtered the unwrapped phase in the spatial domain and identified pixels that had phases with large deviations (<−2.8 and >2.8 radians) compared to the unfiltered unwrapped phase. These pixels were labeled as badly unwrapped regions and an integer 2π phase ambiguity was added to or subtracted from them. The unwrapping errors could be effectively removed by iteratively performing the above steps.
Atmospheric contribution is the largest source of error in radar interferograms (Doin et al., 2009), especially for measuring low-rate interseismic deformation. In this study, we used the Generic Atmospheric Correction Online Service (GACOS) for the InSAR online weather model, to mitigate tropospheric errors (Yu et al., 2018). The residual atmospheric errors were identified and weakened through high- pass filtering in the temporal and spatial domains, respectively. From inspection, it was clear that some interferograms contained orbital errors in the form of a planar phase gradient across the image. To empirically remove these errors, based on the assumption that tectonic deformation only occurs close to the GYXSF, we masked data within a distance of 100 km from the fault (Walters et al., 2011). We then applied a quadratic polynomial fitting to estimate the best-fitting plane using the remaining data, and removed this from the InSAR velocities. To improve the signal-to-noise ratio of interseismic deformation, we selected interferograms based on four criteria. (1) Spatial baselines (separation between orbits) of less than 100 m were used to minimize geometric decorrelation due to the rough topography of the study region. (2) Image pairs with temporal baselines of more than 300 days were employed to maximize the deformation signal in the data. (3) Coseismic displacements close to the fault violate the assumption of linear deformation. Therefore, for paths 26 and 135, which cover the 2014 M 6.3 Kangding earthquake, we only selected SAR images acquired after 2015 for rate map calculation. This removed any trace of coseismic deformation. (4) We discarded interferograms that were severely affected by atmospheric contribution or unwrapping errors that could not be effectively mitigated. Based on the above constraints, we selected 1,619 differential interferograms for all 9 paths (Figure 3; Table 1).
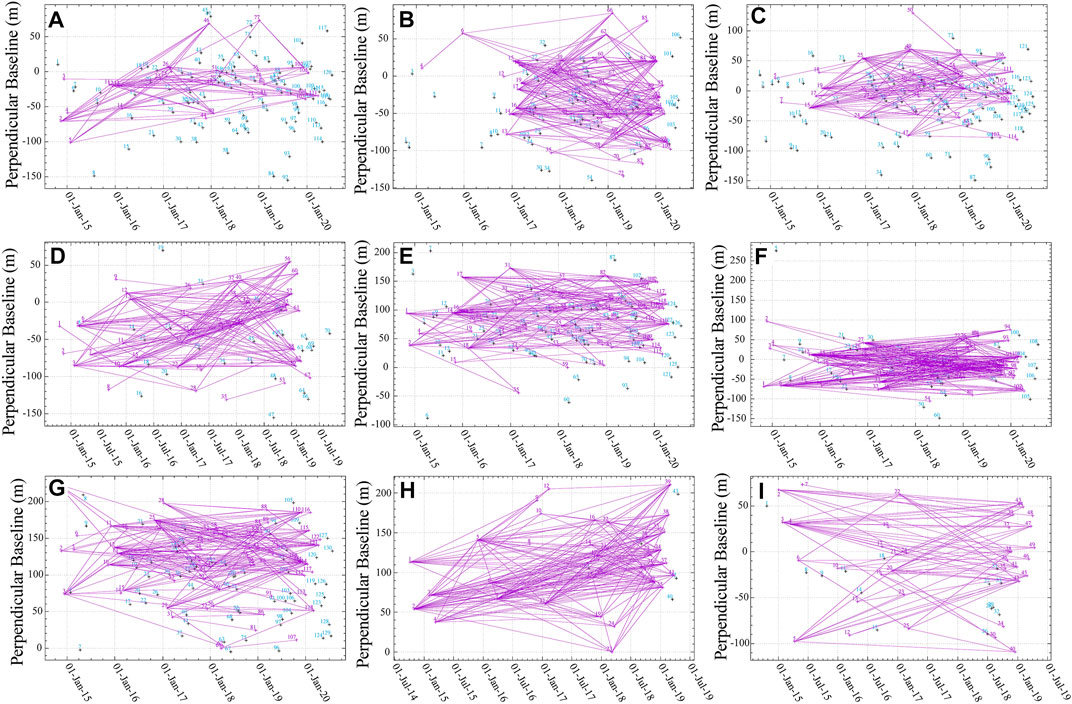
FIGURE 3. Distribution of temporal and spatial baselines of the interferograms. Crosses with purple labels represent images included in velocity calculations, whereas crosses with cyan labels represent images that were not included. Purple lines represent generated interferograms. (A) path 70; (B) path 172; (C) path 99; (D) path 26; (E) path 77; (F) path 4; (G) path 106; (H) path 33; (I) path 135.
Sentinel-1 SAR data usually only records the past 6 years of deformation. However, for large strike-slip faults, this may represent the current rate of strain accumulation, as these faults have a very low frequency of change in the velocity of interseismic deformation. Therefore, we assumed that the velocity was constant over the total time span of all our InSAR observations. To mitigate orbital and linear topographically-correlated atmospheric delay errors, we used the Poly-Interferogram Rate and Timeseries Estimator (π-RATE) software package developed by (Biggs et al., 2007; Elliott et al., 2008; Wang et al., 2009), to estimate the interseismic deformation rates for each path. The resulting ascending and descending InSAR rate maps in the radar’s line of sight (LOS) direction, are shown in Figure 4.
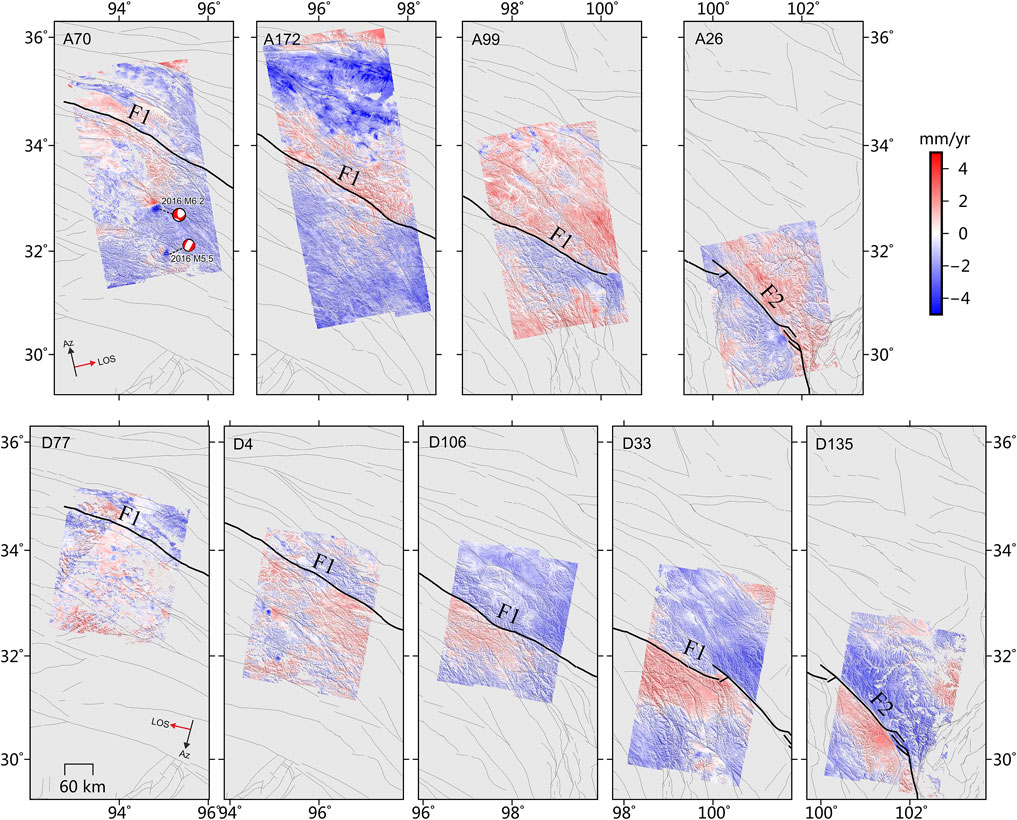
FIGURE 4. Ascending and descending LOS velocities of each path. Red and blue indicate motion away from and toward the satellite, respectively. Bold black lines indicate the GYXSF. F1 and F2 are the GYF and XSF, respectively.
Precise determination of the current slip rate of the GYXSF is of great importance for risk analysis of regional earthquake hazards, and can help to understand the eastward expansion mechanism of the Tibetan Plateau. However, InSAR observations can only obtain 1-dimensional LOS deformation. As a result, it is impossible to retrieve realistic three-dimensional deformation using only ascending and descending InSAR observations. While the GPS method can measure three-dimensional displacements at discrete locations with millimeter-level accuracy, the observations are too infrequent to capture the details of the three-dimensional deformation field. It is obvious that these two methods are complementary to each other, we therefore combined them for three-dimensional deformation monitoring with high spatial resolution. In this study, using software published by Shen and Liu (2020), we calculated our 4-track ascending and 5-track descending InSAR data, along with published GPS data (Wang and Shen, 2020) (Figure 1), to measure integrated three-dimensional velocities. The north-south velocities in the solution were constrained by the GPS data, east-west velocities were constrained by both InSAR and GPS data, and vertical velocities were constrained by the InSAR data.
To obtain the integrated three-dimensional deformation field, we first multi-looked the InSAR rate maps to reduce the data to 1-km spacings to improve the computational efficiency. In addition, we interpolated the point-based discrete GPS velocities to produce a continuous 3-D vector map at the same grid interval as the multi-looked InSAR data, based on the algorithm proposed previously (Shen et al., 2015), taking into account the GPS network density and configuration for data weighting. A Gaussian distance weighting function and a Voronoi cell spatial weighting function were used in the interpolation. We set the predetermined common weighting threshold parameter (W) to 5, and the smoothing constant (
InSAR LOS velocities usually have offsets between different tracks, owing to their relative measurement and selection of different reference points. To solve these offsets, GPS data and their interpolated values were used to stabilize the inversion. To improve the computational efficiency, GPS data from a reduced number of grid points were used in the solution, which were sufficient for the offset calculation. The components of the offsets were then calculated and removed from the InSAR LOS data. Finally, the three-dimensional velocity was solved for each grid cell by combining the GPS interpolated velocities and InSAR LOS rate data through least-squares regression. It should be noted that no GPS vertical data were used to constrain the final solution.
Our InSAR results cover the entire GYXSF, spanning a region of ∼1,000 km, and fill the gap of current slip rates in the western sections of the GYF. Figure 4 shows that there were significant large-scale tectonic motions along all nine paths during the investigated period. Combining these results with satellite observation geometry, we can see that both the ascending and descending InSAR results are consistent with established knowledge of left-lateral strike-slip interseismic motion. The main velocity discontinuities between the paths were due to changes in the incidence angle. The differential velocity between the southern and northern sides of the fault gradually increased from the GYF to XSF. The deformation can be characterized as an S-type arctangent curve with small differential motions in the near field and large differential motions in the far field. This is typical of a strike-slip fault (Savage and Burford, 1973). It should be noticed that the rate map of path70 shows two obvious coseismic deformation fields, corresponding to the 2016 M 6.2 Zaduo earthquake and the 2016 M 5.5 Dingqing earthquake, which are not well eliminated due to most of interferograms used in path70 cross the coseismic moments (Figure 3A).
As there are many error sources during InSAR processing, we should evaluate the accuracy of InSAR rate maps obtained above for further analysis. We first analyzed the internal accuracy by evaluating the agreement in the overlapping areas of neighboring rate maps, the histograms of the velocity differences derived from adjacent InSAR tracks were plotted in Figure 5, the red lines in the histograms are the best-fitting Gaussian curve. It should be noticed that there are un-negligible velocity differences in the overlapped areas of the rate maps due to variation in incidence angle between different rate maps. We corrected these differences based on the assumption of horizontal motion only, which was done by dividing the velocities by the sine of the local incidence angle and then multiplying by the sine of 39.5° (incidence at the center of each track). Statistic shows that the mean velocity difference in the seven histograms in Figure 5 vary from -2.02 (path 33–135) to 1.42 mm/yr (path 99–26). The standard deviation also varies from 0.41 (path 4–106) to 1.01 mm/yr (path 70–172). The standard deviation of each histogram in Figure 5 was considered to be an estimate of the
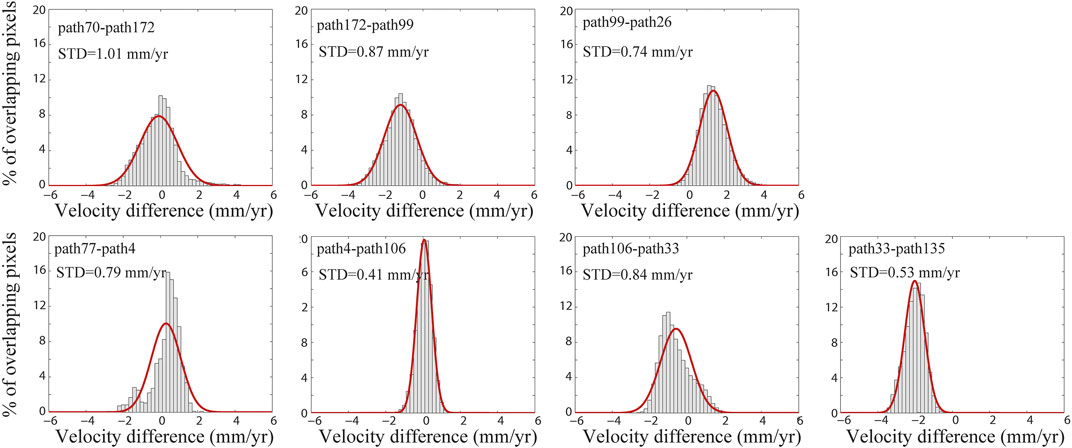
FIGURE 5. Histograms of velocity differences between overlapping rate map pairs. The red line on each histogram is the best fitting Gaussian. The mean velocity difference and standard deviation of the Gaussian (σ) is labeled at the top of each Histogram.
We also compared our InSAR results to published GPS data (Wang and Shen, 2020) to analyze the external accuracy of InSAR processing, assuming that there was no significant vertical velocity signal (Ji et al., 2020). We first converted the horizontal GPS data (north and east) to the LOS direction using Equation 1:
where dLOS is the LOS direction, deast and dnorth are the horizontal GPS data, θ is the variable incidence angle, and α is the azimuth angle. We then extracted the average value of InSAR LOS deformation within 1 km of the GPS points. Finally, the difference between InSAR and GPS LOS rates was calculated for each track to compensate the reference offset between them. The result shows that the standard deviation of our InSAR results compared to the corrected GPS data was 1.77 mm/yr, indicating the reliability of InSAR results A histogram of the difference between the two sets of results is shown in Figure 6.
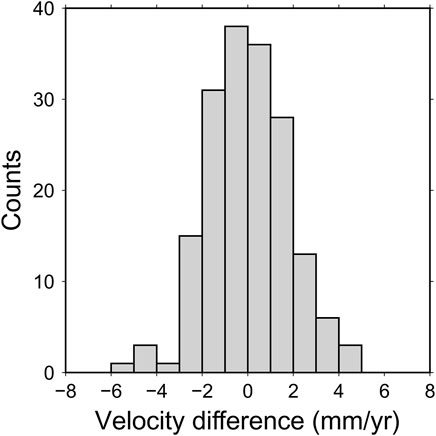
FIGURE 6. Histogram of velocity differences between InSAR and projected GPS LOS data.
InSAR-GPS Integrated horizontal velocity fields are shown in Figures 7A,B, and we also plotted the deformation field interpolated with GPS data alone in Figures 7C,D for comparison. It can be seen from Figure 7 the long-wavelength horizontal signal of the InSAR-GPS Integrated results are generally consistent with the GPS results, which are believed to be reliable at horizntal long wavelengths and can provide effective constraints for mid to long range horizontal deformation associated with tectonic deformation. In addition, the decomposed north-south component absorbed most of information from the GPS data for the InSAR results are generally not very sensitive to the north-south motion due to its near-polar orbits observations.
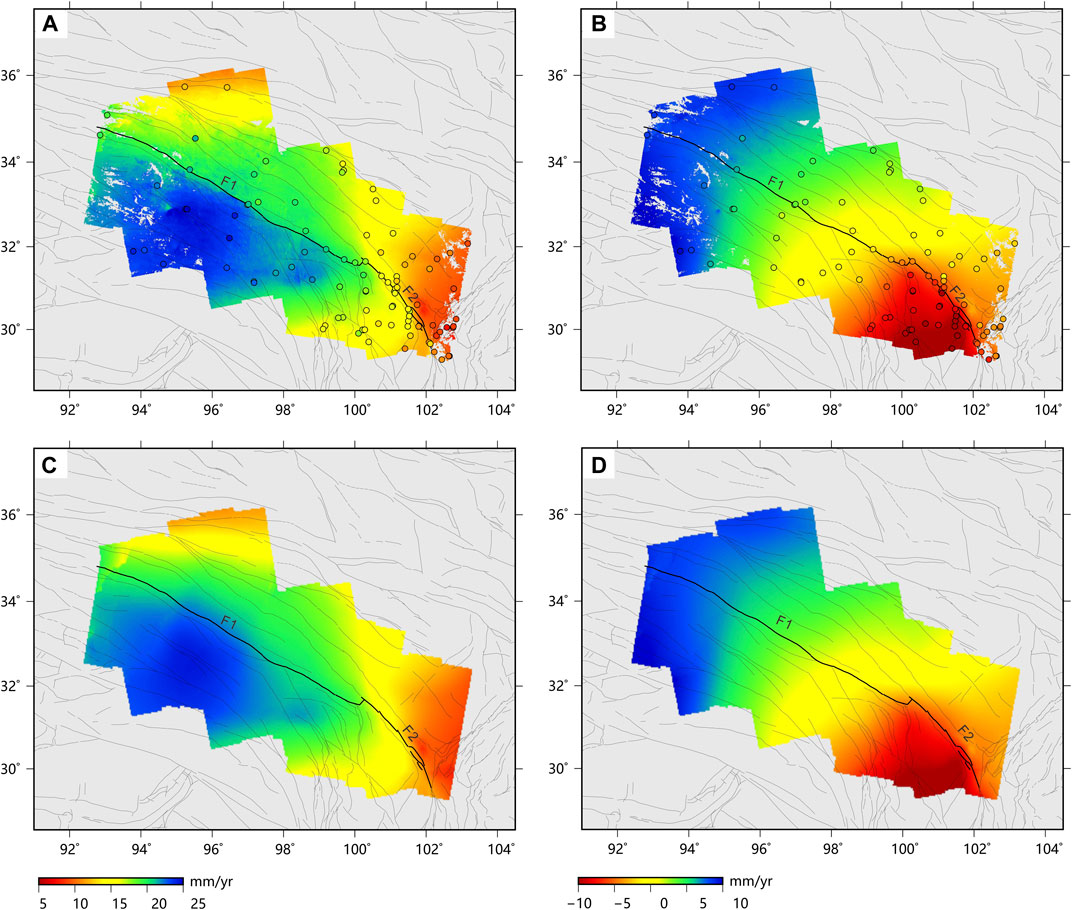
FIGURE 7. (A)
While the improvement of the integrated deformation fields are also obvious. On the one hand, the east-west velocity gradient across GYXSF is more sharp in the InSAR-GPS Integrated results than that in the GPS results owing to the integration of high resolution InSAR data, and many detailed deformation signals of the fault were first revealed, particularly for the east-west components, where InSAR contribute most. This improvement is more obvious in GYF where GPS stations are sparse. The InSAR-GPS Integrated results show that there were significant differential movements on both sides of the GYXSF during the study period, the overall velocity gradient of XSF is higher than that of GYF, and the GYF was mainly controlled by east-west movement, while the XSF was controlled by east-west and north-south movement. On the other hand, the high resolution vertical deformation field of the study area was revealed for the first time (Supplementary Figure S1) with the integration of InSAR data, which are mainly composed of non-tectonic deformation such as human activities and permafrost. In fact, for most area, there was little vertical motion across the GYXSF, indicating that the GYXSF was mainly controlled by horizontal motion. Vertical GPS components (relative to the stable north neighbor of the Tibetan Plateau) from a previous study (Liang et al., 2013) are plotted as colored circles in Supplementary Figure S1 and show that the relative velocities from GPS measurements were less than 2.5 mm/yr in the area covered by our InSAR data.
The current slip rate of the GYXSF and its spatial variations play an important role in understanding the eastward expansion mechanism of the Tibetan Plateau and analyzing regional earthquake hazards. In this study, we assumed that the deformation during the interseismic period are fault-parallel screw dislocations in an elastic half-space to investigate the current slip rate variation along GYXSF.
Eq. 2 shows the screw dislocation model (Savage and Burford, 1973) we used to fit the current slip rate, where
Compared with the original ascending/descending InSAR deformation field, the InSAR-GPS Integrated deformation field can directly calculate the movement in fault-parallel direction without assumptions and the result are more reliable, we therefore used the screw dislocation model to calculate the current slip rates along the GYXSF by fitting profiles extracted from the InSAR-GPS integrated deformation field. For comparison, slip rates were also estimated from the original GPS data (Wang and Shen, 2020).
Before slip rates estimation, it was necessary to convert the deformation fields to the fault-parallel direction. For the integrated 3-D deformation field, we can calculate the movement in fault-parallel direction directly using Equation 3:
where Vn is the component of northward motion, and Ve is the component of eastward motion, Dfault is the deformation field in the fault-parallel direction,

FIGURE 8. Along strike variation in fault slip rates. (A) locations of fault slip rate measurements along the fault. (B) Screw dislocation model fitting results using fault-parallel velocity profiles from the InSAR-GPS-integrated horizontal (black and red diamonds). The thick gray lines are estimated slip rates from GNSS velocities alone. Gray and triangles represent fault slip rates estimated from previous geological studies, and black triangles represent late Quaternary tectonic-geomorphology rates estimated by (Chevalier et al., 2018; Bai et al., 2021, Bai et al., 2018).
From Figure 8B, we can see that the slip rates obtained from the InSAR-GPS integrated deformation field are generally consistent with the GPS results, and can provide more details on slip rate variation along the GYXSF owing to the integration of high density of InSAR observations. In contrast, for most sections of GYXSF, the slip rates obtained from geological results are generally larger than that from geodetic results. this difference may be caused by the fact that geological rates span multiple seismic cycles while geodetic measurements spanning only a few years which corresponding to the current seismic period of the fault. We also noticed that for the Kangding section of XSF, many geological slip rates are significantly lower than that obtained by geodetic method, which may be explained by the fact that the Kangding section is composed of three parallel branches: Yalahe, Selaha and Zheduotang, and the geological method can only obtain slip rates of single branch fault, resulting in lower slip rates (Bai et al., 2021; Bai et al., 2018). In addition, uncertainties in geological and geodetic observations and models could produce differences in slip rate (Ji et al., 2020).
In summary, the InSAR-GPS integrated horizontal deformation field obtained in this study can describe the current deformation characteristics of the GYXSF more accurately and with high-resolution. We therefore analyzed the InSAR-GPS integrated horizontal deformation field in detail below to determine the current regional motion characteristics of the GYXSF.
Slip rates obtained from InSAR-GPS integrated deformation field show that the GYF is segmental, with slip rates that gradually increase from ∼1–6 mm/yr from the northwest to the southeast, with the lowest slip rates observed along the Fenghuoshan-Dangjiang section (0–2 mm/yr). The Yushu section has a higher total slip rate of ∼3–4 mm/yr, which is close to previous geological results, but significantly lower than the 6.4 mm/yr InSAR slip rate measured before the Yushu earthquake (Liu et al., 2011). The difference between these two results may be due to the inconsistent time period of SAR data. The slip rate of the Dengke section decreases from ∼4 to ∼2 mm/yr from the northeast to the southwest. In contrast, the slip rate of the Manigange section increases from ∼2 to ∼6 mm/yr from northeast to southwest.
For XSF, slip rates obtained from InSAR-GPS integrated deformation field indicate that the current slip rate is ∼8.5 mm/yr in the northwest and overall increases to ∼12 mm/yr in the southeast. The overall slip rate of the GYXSF increases from the XSF to the GYF. This increase is highest at Zhuwo, the junction between the two faults, where the slip rate increases from ∼6 to ∼8.5 mm/yr. A more detailed analysis of the slip rate of the XSF shows that from ∼8.5 mm/yr in the Luhuo section in the southeast, the slip rate decreases slightly to ∼7.5–8 mm/yr in the Daofu section. It then gradually increases to ∼9 mm/yr in the Qianning section, and ∼9.5 mm/yr in the Kangding section, before increasing rapidly to ∼11–12 mm/yr in the Moxi section, which is close to the late Quaternary tectonic-geomorphology rates (Bai et al., 2021) (black triangles in Figure 8B).
Creep behavior can occur on a fault during post- and interseismic periods, and can be detected by measuring the near-field displacement gradient across a fault (Ji et al., 2020). Previous studies indicate that creep along the XSF is predominantly post-seismic, and, over the past few decades, creep has been observed through fault-crossing short-baseline and short-level surveys in the northwestern segments of the XSF (eg., Allen et al., 1991; Du et al., 2010; Kato et al., 2007). Studies have also shown that the creep rate varies both spatially and temporally. Unlike previous observations, profiles of original single-looked InSAR data along the GYXSF from this study, show more obvious near-field local deformation in the Yushu, Qianning, and Kangding sections (red circles in Figure 8). This exactly corresponds to the three largest earthquakes in recent years, the 1981 M 6.9 Daofu, 2010 M 6.9 Yushu, and 2014 M 6.3 Kangding earthquakes. The deformation direction of these events is consistent with the direction of the relative coseismics (Jiang et al., 2015; Qu et al., 2013). We therefore believe that these near-field local deformations are creep, caused by the post-seismic after-slip mechanism.
Based on high-density near-field deformation data, we can estimate the kinematic parameters of creep. However, it is worth noting that our fault-parallel deformation results of the InSAR-GPS integrated data, only show significant creep characteristics in the Yushu section. No significant near-field deformation was observed in the Qianning or Kangding sections, which may be related to the insensitivity to the north-south motion of InSAR observations, and the fact that the decomposed north-south component is mainly controlled by the low-resolution GPS data. As a result, the creep characteristics were no longer significant after integration. Another possible reason is that the relatively large smoothing constraint used in the integration of InSAR and GPS may remove some relatively small-scale creep signals. Therefore, we only calculated the kinematic parameters of the creep observed in the Yushu section.
To investigate the pattern of creep observed in the horizontal deformation field, we modeled the fault-parallel velocity over the creep area as a combination of two signals. The first is a long-wavelength signal representing the interseismic loading at rate
The best fitting values of Equation 4 are shown in Figure 9. Our estimation of the fault creep rate reveals that in the 4–10 years since the 2010 M 6.9 Yushu earthquake, a ∼100 km portion of the GYF underwent post-seismic after-slip that reached the ground surface, and that the maximum creep reached 2.2 mm/yr. Therefore, we infer that the middle-lower part of the seismogenic layer on the rupture of the 2010 Yushu earthquake was not fully locked. It can also be seen that the current sliding rates estimated by the model considering creep (Equation 4), are slightly higher than those estimated by the classical screw dislocation (Equation 2).
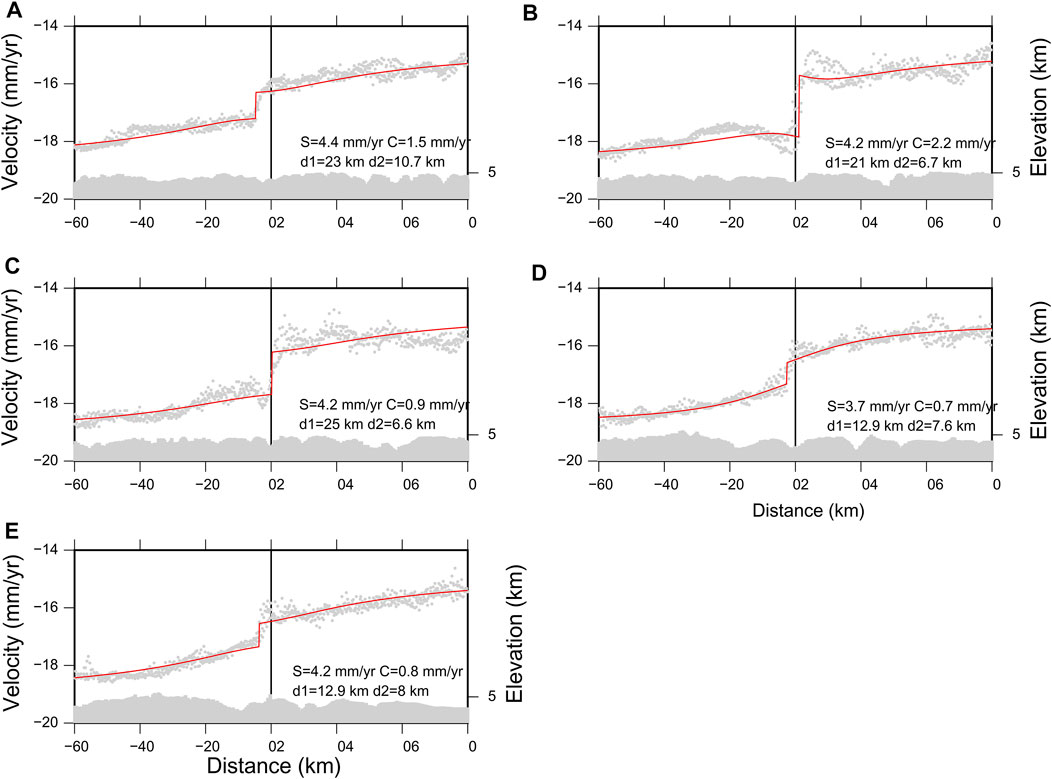
FIGURE 9. A-E show profiles through the fault-parallel velocities along the Yushu section (five red circles from west to east in Figure 8A), respectively. Gray points are InSAR observations, and red lines are the best-fitting solutions. The best-fitting model parameters are labeled on each figure.
Strain accumulation rate during the interseismic stage is a major feature of large strike-slip faults (Wright et al., 2013). It can be used to identify where the strain rate is accumulating most rapidly, and thus where earthquakes are most likely to occur (Bird et al., 2010; Wang et al., 2019). Observations of crustal deformation can be used to map a high-precision tectonic strain accumulation rate during the interseismic period. However, because of the low density of existing GPS observations (Wang and Shen 2020), the spatial resolution of the calculated strain rate map is too low to illustrate strain distributions in detail. The degree to which strain rate is concentrated or dispersed along the GYXSF and in its surrounding areas is therefore not clear. The high spatial-resolution InSAR-GPS integrated horizontal velocity field obtained in this study makes it possible to calculate the strain accumulation rate of the GYXSF with high resolution. Therefore, we interpolated the horizontal integrated velocity field, to derive a continuum strain rate field based on the Velocity Interpolation for Strain Rate (VISR) code proposed by (Shen et al., 2015). It should be noted that we masked out the area affected by the 2016 M 6.0 Zaduo earthquake from the input velocity field, as it occurred in our study area during the observation period (Figure 7A) and may have polluted the strain rate field. The current seismic period of the fault will also affect the strain distribution around the fault, in addition to the current tectonic loading, due to the short observations times of our results. Therefore, the strain accumulation rate near the GYXSF may also include the after-slip effects of frequent earthquakes along the GYXSF in recent decades.
Figure 10 shows the maximum shear strain rate (
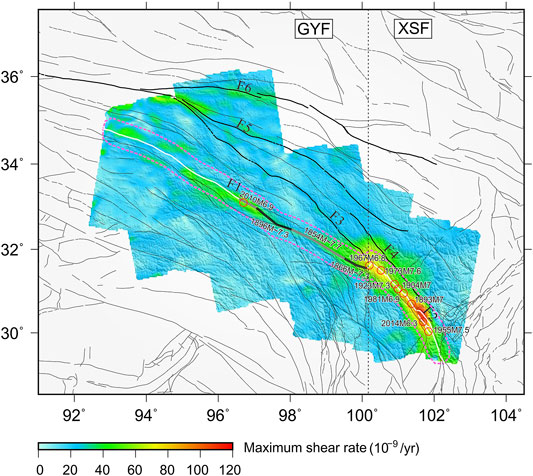
FIGURE 10. Maximum shear strain rate along the GYXSF, derived from InSAR-GPS integrated data. The thick black and gray lines on the GYF represent the historical earthquake surface ruptures of the 2010 M 6.9 Yushu earthquake, as well as earthquakes in 1896, 1866, and 1854 (Chen et al., 2010). Red circles indicate M 6.3 earthquakes between 1893 and 2019, labeled by year of occurrence and magnitude. The pink dotted line represents the buffer range constructed by the GYXSF. The vertical black dashed line at ∼100° separates the GYF region (left) from the XSF region (right). F1–Ganzi-Yushu fault; F2–Xianshuihe fault; F3–Wudaoliang-Changshagongma fault; F4–Yuke fault; F5–Dari fault; F6–East Kunlun fault.
The dilatation rate (
To quantitatively analyze the relationship between the GYXSF and the strain accumulation rate, we created a 30 km spatial buffer on both sides of the fault, and determined the maximum shear strain rate distribution inside and outside the buffer (Savage et al., 2001). Considering the differences in strain distribution between the GYF and XSF, we divided the research area into two regions, one for each fault. The GYF region is to the left of the vertical black dashed line at ∼100° in Figure 10, while the XSF region is to the right of the line. The statistical histograms in Figure 11 show the frequency of maximum shear rates inside and outside of the 30 km buffer zones for the GYF and XSF. The results show that the mean value of the maximum shear strain rate inside and outside of the GYF zone is 2.92 × 10⁻⁸ and 1.89 × 10⁻⁸ yr−1, respectively. This indicates that the strain rate is dispersed in this region rather than concentrated on the GYF. For the XSF region, the mean value of the maximum shear strain rate inside and outside the XSF zone is 5.77 × 10⁻⁸ and 2.11 × 10⁻⁸ yr−1. The significantly higher strain rate inside the zone indicates that the strain rate is concentrated on the XSF rather than dispersed.
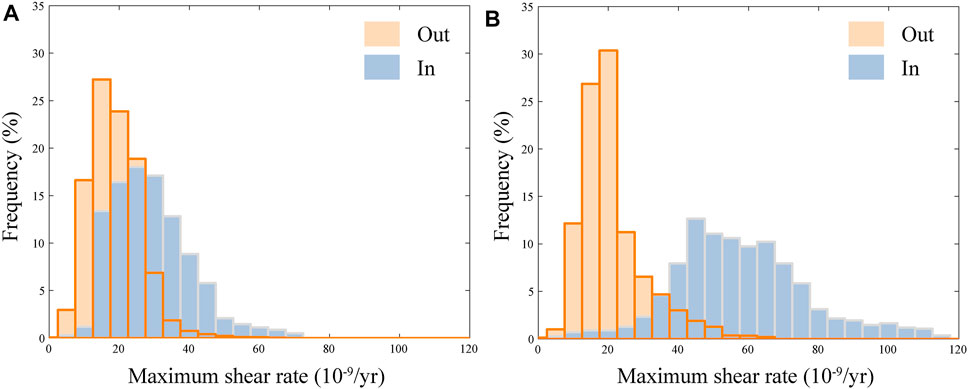
FIGURE 11. Histograms of maximum shear strain rate inside and outside of the 30 km buffer zones for (A) the GYF and (B) the XSF.
Velocity solutions with a high spatial resolution and consistency have been widely used to determine deformation patterns of continents which were previously not clear. These include the “block like model” and “continuum model,” which correspond to different characteristics of the surface deformation. The block like model requires a high slip rate and concentrated strain rate on the main fault, but negligible deformation inside the block (Tapponnier et al., 1982). In contrast, the continuum model requires relatively low slip rates on a large fault, and continuous strain distribution throughout the region (Tapponnier et al., 1982).
The results and observations from this study show that the current slip rates (Figure 8) and strain rate distributions (Figure 10) of the GYXSF are not uniform. Therefore, using only one deformation model can’t explain our observations completely satisfactory. This is phenomenon has been considered normal when considering the complicated deformation process of the eastward extrusion of the Tibetan plateau. In fact, different models may not be mutually exclusive, and could come together to explain the entire collision process and mechanical evolution of the Tibetan plateau (Gan et al., 2007; Han et al., 2019). Therefore, we divided the research area into the GYF and XSF regions (Figure 10). The GYF region has relatively low slip rates (∼1–6 mm/yr) and smaller strain rate concentrations (Figure 11A), whereas the XSF region has a significantly higher slip rate (∼8.5–12 mm/yr) and higher strain rate concentration (Figure 11B). Based on this, the continuous deformation model is a good fit to the GYF, while the block like deformation model fits the XSF.
To further investigate the mechanism of the current deformation model of the GYXSF, we divided the research area into four regions, namely north GYF, south GYF, north XSF and south XSF (Figure 12). We calculated the uniform strain rate in each of these sections (crosses in Figure 12). The general strain rate shows that both the north and south sides of the GYF are undergoing NW-SE tension and NE-SE extension due to the eastward extrusion of the Tibetan plateau, while both sides of the XSF are undergoing E-W shortening and S-N extension. According to the general strain rate, we believe there are two explanations for the current deformation model of GYXSF: (1) The Longmenshan (LMS) and Longriba (LFS) fault systems (Figure 12) block the eastward flow of materials in the plateau on the north side of the GYXSF. This results in the E-W shortening of the XSF region, and causes the deformation velocity on the north side of the GYXSF to decline faster than that on the south side. This leads to a lower left-lateral relative motion across the GYF than across the XSF (Figure 12). (2) The XSF region is subject to a southerly force, resulting in the significant S-N extension, which further increases the XSF strike slip rate.
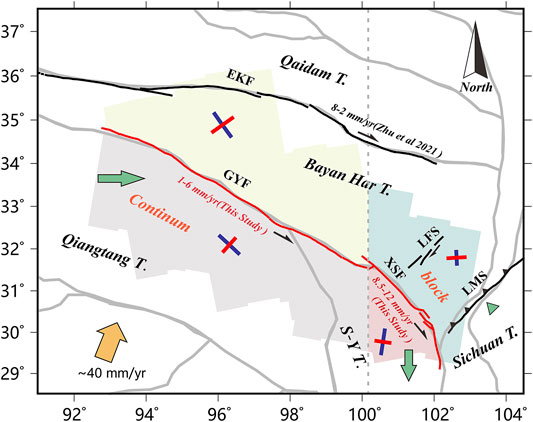
FIGURE 12. Simplified current deformation model map of the GYXSF and the uniform strain-rates (blue axis: extension; red axis: compression) in the different sections. Thick solid lines indicate the dominating faults. The green arrow at the western end of the fault shows the eastward extrusion of the Tibetan plateau along the GYXSF. The green arrow to the south east of the fault represents the southward extrusion of the plateau material. The green triangle represents the barrier of the LMS. EKF, East Kunlun Fault; GYF, Ganzi–Yushu Fault; XSF, Xianshuihe Fault; LMS, Longmenshan Fault System; LFS, Longriba Fault System, S-Y T: Sichuan-Yunnan Terrace.
In this study, we used 4-track ascending and 5-track descending Sentinel-A/B SAR data from 2014 to 2020, to obtain high-resolution velocity fields in the LOS direction of the GYXSF, based on InSAR technology. Both InSAR and published GPS data were integrated to calculate the high-resolution three-dimensional deformation field and strain rate field of the GYXSF, this deformation field is more detailed than the deformation field created using only GPS data. The current slip rates in the fault-parallel direction along the GYXSF were also estimated at 20 km intervals, based on the screw dislocation model. The conclusions of our observations can be summarized as follows:
1) The current slip rate obtained by the InSAR-GPS integrated velocity field shows that current activity along the GYXSF is segmental. The slip rate of the GYF gradually increases from ∼1 to ∼6 mm/yr from the northwest to the southeast. Similarly, the slip rate of the XSF increases from ∼8.5 to ∼12 mm/yr from the northwest to the southeast. The greatest difference between the slip rates where the two faults meet, occurs in Zhuwo.
2) Post-earthquake deformation along the GYXSF is negligible, which results in rapid near-fault slip in the deformation field and a high strain accumulation rate. For the Yushu section of the GYF, the most significant post-seismic deformation area on the GYXSF, our fitting results reveal ∼100 km of slip in the 4–10 years since the 2010 Yushu M 6.9 earthquake, with a maximum creep of 2.2 mm/yr.
3) The strain rate is dispersed in the GYF region but is significantly concentrated on the fault in the XSF region. The strain accumulation rates is also distributed to different degrees on faults north of the GYXSF, including the Wudaoliang-Changsha Gongma, Yuke, and Dari faults. The seismic hazards of these faults cannot be ignored as many recent earthquakes have occurred on secondary or previously unidentified faults.
4) Based on the observations in this study, we believe the continuous and block-like deformation models can explain the current deformation characteristics of the GYF and XSF, respectively. This deformation mode may be attributed to the blocking effect of the LMS and LFS on the eastward extrusion of the Tibetan plateau and the drag of a southward force on the XSF.
The original contributions presented in the study are included in the article/Supplementary Material, further inquiries can be directed to the corresponding author.
WZ and LJ conceived this research. WZ processed the InSAR data and wrote the manuscript. LZ conducted the detailed explanation. CL assisted with the InSAR data processing. FJ and XX conducted the use of Software. All authors reviewed and supervised the manuscript and approved it for publication.
This study was funded by the National Key Research and Development Program of China (2017YFC1500501), the National Natural Science Foundation of China (41904007 and 42104061), the Spark Programs of Earthquake Sciences granted by the China Earthquake Administration (XH20083 and XH20081Y), Jilin Changbaishan Volcano National Observation and Research Station (NORSCBS20-01), and the Earthquake Situation Tracking Orientation Tasks (2021010202).
The authors declare that the research was conducted in the absence of any commercial or financial relationships that could be construed as a potential conflict of interest.
All claims expressed in this article are solely those of the authors and do not necessarily represent those of their affiliated organizations, or those of the publisher, the editors, and the reviewers. Any product that may be evaluated in this article, or claim that may be made by its manufacturer, is not guaranteed or endorsed by the publisher.
Sentinel 1A images were provided free by ESA’s Sentinels Scientific Data Hub.
The Supplementary Material for this article can be found online at: https://www.frontiersin.org/articles/10.3389/feart.2022.821761/full#supplementary-material
Allen, C. R., Zhuoli, L., Hong, Q., Xueze, W., Huawei, Z., and Weishi, H. (1991). Field Study of a Highly Active Fault Zone: The Xianshuihe Fault of Southwestern China. Geol. Soc. Am. Bull. 103 (9), 1178–1199. doi:10.1130/0016-7606(1991)103<1178:fsoaha>2.3.co;2
Bai, M., Chevalier, M.-L., Pan, J., Replumaz, A., Leloup, P. H., Métois, M., et al. (2018). Southeastward Increase of the Late Quaternary Slip-Rate of the Xianshuihe Fault, Eastern Tibet. Geodynamic and Seismic hazard Implications. Earth Planet. Sci. Lett. 485, 19–31. doi:10.1016/j.epsl.2017.12.045
Bai, M., Chevalier, M. L., Leloup, P. H., Li, H., Pan, J., Replumaz, A., et al. (2021). Spatial Slip Rate Distribution along the SE Xianshuihe Fault, Eastern Tibet, and Earthquake hazard Assessment. Tectonics 40, e2021TC006985. doi:10.1029/2021TC006985
Biggs, J., Wright, T., Lu, Z., and Parsons, B. (2007). Multi-interferogram Method for Measuring Interseismic Deformation: Denali Fault, Alaska. Geophys. J. Int. 170 (3), 1165–1179. doi:10.1111/j.1365-246X.2007.03415.x
Bird, P., Kreemer, C., and Holt, W. E. (2010). A Long-Term Forecast of Shallow Seismicity Based on the Global Strain Rate Map. Seismological Res. Lett. 81 (2), 184–194. doi:10.1785/gssrl.81.2.184
Chen, G. H., Xu, X. W., Wen, X. Z., and Wang, Y. L. (2008). Kinematical Transformation and Slip Partitioning of Northern to Eastern Active Boundary belt of Sichuan-Yunnan Block. Seismology Geology. 30 (01), 58–85. doi:10.3969/j.issn.0253-4967.2008.01.005
Chen, L. C., Wang, H., Ran, Y. K., Sun, X. Z., Su, G. W., Wang, J., et al. (2010). The Ms7.1 Yushu Earthquake Surface Ruptures and Historical Earthquakes. Sci. China 55 (13), 1200–1205. doi:10.1007/s11434-010-4079-2
Chevalier, M.-L., Leloup, P. H., Replumaz, A., Pan, J., Métois, M., and Li, H. (2018). Temporally Constant Slip Rate along the Ganzi Fault, NW Xianshuihe Fault System, Eastern Tibet. Bulletin 130 (3-4), 396–410. doi:10.1130/B31691.1
Doin, M.-P., Lasserre, C., Peltzer, G., Cavalié, O., and Doubre, C. (2009). Corrections of Stratified Tropospheric Delays in SAR Interferometry: Validation with Global Atmospheric Models. J. Appl. Geophys. 69 (1), 35–50. doi:10.1016/j.jappgeo.2009.03.010
Du, F., Wen, X. Z., and Zhang, P. Z. (2010). Post-seismic Slip and Deformation on the Luhuo Segement of the Xianshuihe Fault Zone. Chin. J. Geophys. 53 (10), 12. doi:10.3969/j.issn.0001-5733.2010.10.009
Elliott, J. R., Biggs, J., Parsons, B., and Wright, T. J. (2008). InSAR Slip Rate Determination on the Altyn Tagh Fault, Northern Tibet, in the Presence of Topographically Correlated Atmospheric Delays. Geophys. Res. Lett. 35 (12), L12309. doi:10.1029/2008GL033659
Elliott, J. R., Walters, R. J., and Wright, T. J. (2016). The Role of Space-Based Observation in Understanding and Responding to Active Tectonics and Earthquakes. Nat. Commun. 7 (1), 1–16. doi:10.1038/ncomms13844
England, P., and Houseman, G. (1986). Finite Strain Calculations of continental Deformation: 2. Comparison with the India-Asia Collision Zone. J. Geophys. Res. 91 (B3), 3664–3676. doi:10.1029/JB091iB03p03664
Fattahi, H., and Amelung, F. (2016). InSAR Observations of Strain Accumulation and Fault Creep along the Chaman Fault System, Pakistan and Afghanistan. Geophys. Res. Lett. 43 (16), 8399–8406. doi:10.1002/2016GL070121
Gan, W., Zhang, P., Shen, Z.-K., Niu, Z., Wang, M., Wan, Y., et al. (2007). Present-day Crustal Motion within the Tibetan Plateau Inferred from GPS Measurements. J. Geophys. Res. 112 (B8), B08416. doi:10.1029/2005JB004120
Goldstein, R. M., and Werner, C. L. (1998). Radar Interferogram Filtering for Geophysical Applications. Geophys. Res. Lett. 25 (21), 4035–4038. doi:10.1029/1998GL900033
Guo, R., Zheng, Y., Tian, W., Xu, J., and Zhang, W. (2018). Locking Status and Earthquake Potential hazard along the Middle-South Xianshuihe Fault. Remote Sensing 10 (12), 2048. doi:10.3390/rs10122048
Han, S., Li, H., Pan, J., Lu, H., Zheng, Y., Liu, D., et al. (2019). Co-seismic Surface Ruptures in Qiangtang Terrane: Insight into Late Cenozoic Deformation of central Tibet. Tectonophysics 750, 359–378. doi:10.1016/j.tecto.2018.11.001
Huang, X., Du, Y., He, Z., Ma, B., and Xie, F. (2015). Late Quaternary Slip Rate of the Batang Fault and its Strain Partitioning Role in Yushu Area, central Tibet. Tectonophysics 653, 52–67. doi:10.1016/j.tecto.2015.03.026
Hussain, E., Hooper, A., Wright, T. J., Walters, R. J., and Bekaert, D. P. S. (2016). Interseismic Strain Accumulation across the central North Anatolian Fault from Iteratively Unwrapped InSAR Measurements. J. Geophys. Res. Solid Earth 121 (12), 9000–9019. doi:10.1002/2016JB013108
Hussain, E., Wright, T. J., Walters, R. J., Bekaert, D. P., Lloyd, R., and Hooper, A. (2018). Constant strain accumulation rate between major earthquakes on the North Anatolian Fault. Nat. Commun. 9 (1), 1–9. doi:10.1038/s41467-018-03739-2
Ji, L., Zhang, W., Liu, C., Zhu, L., Xu, J., and Xu, X. (2020). Characterizing Interseismic Deformation of the Xianshuihe Fault, Eastern Tibetan Plateau, Using Sentinel-1 SAR Images. Adv. Space Res. 66, 378–394. doi:10.1016/j.asr.2020.03.043
Jiang, G., Xu, X., Chen, G., Liu, Y., Fukahata, Y., Wang, H., et al. (2015). Geodetic Imaging of Potential Seismogenic Asperities on the Xianshuihe-Anninghe-Zemuhe Fault System, Southwest China, with a New 3-D Viscoelastic Interseismic Coupling Model. J. Geophys. Res. Solid Earth 120 (3), 1855–1873. doi:10.1002/2014JB011492
Kato, N., Lei, X., and Wen, X. (2007). A Synthetic Seismicity Model for the Xianshuihe Fault, Southwestern China: Simulation Using a Rate- and State-dependent Friction Law. Geophys. J. Int. 169 (1), 286–300. doi:10.1111/j.1365-246X.2006.03313.x
Li, M. F., Xing, C. Q., Cai, C. X., Guo, W. X., Wu, S. X., Yuan, Z. Z., et al. (1995). Research on Activity of Yushu Fault. Seismology Geology. 17 (03), 218–224.
Li, T. T. (1997). The Active Xianshuihe Fault Zone and its Seismic Risk Assessment. Chengdu: Chengdu Cartographic.
Li, Y., and Bürgmann, R. (2021). Partial Coupling and Earthquake Potential along the Xianshuihe Fault, China. J. Geophys. Res. Solid Earth 126 (7), e2020J–e21406J. doi:10.1029/2020JB021406
Liang, S., Gan, W., Shen, C., Xiao, G., Liu, J., Chen, W., et al. (2013). Three-dimensional Velocity Field of Present-Day Crustal Motion of the Tibetan Plateau Derived from GPS Measurements. J. Geophys. Res. Solid Earth 118 (10), 5722–5732. doi:10.1002/2013JB010503
Lin, A., Jia, D., Rao, G., Yan, B., Wu, X., and Ren, Z. (2011). Recurrent Morphogenic Earthquakes in the Past Millennium along the Strike-Slip Yushu Fault, central Tibetan Plateau. Bull. Seismological Soc. America 101 (6), 2755–2764. doi:10.1785/0120100274
Liu, C., Ji, L., Zhu, L., and Zhao, C. (2018). InSAR-Constrained Interseismic Deformation and Potential Seismogenic Asperities on the Altyn Tagh Fault at 91.5-95°E, Northern Tibetan Plateau. Remote Sensing 10 (6), 943. doi:10.3390/rs10060943
Liu, Y., Xu, C., Li, Z., Wen, Y., and Forrest, D. (2011). Interseismic Slip Rate of the Garze-Yushu Fault belt in the Tibetan Plateau from C-Band InSAR Observations between 2003 and 2010. Adv. Space Res. 48 (12), 2005–2015. doi:10.1016/j.asr.2011.08.020
Loveless, J. P., and Meade, B. J. (2011). Partitioning of Localized and Diffuse Deformation in the Tibetan Plateau from Joint Inversions of Geologic and Geodetic Observations. Earth Planet. Sci. Lett. 303 (1-2), 11–24. doi:10.1016/j.epsl.2010.12.014
Molnar, P., and Qidong, D. (1984). Faulting Associated with Large Earthquakes and the Average Rate of Deformation in central and Eastern Asia. J. Geophys. Res. 89 (B7), 6203–6227. doi:10.1029/JB089iB07p06203
Peng, H., Ma, X. M., Bai, J. Q., and Du, D. P. (2006). Characteristics of Quaternary Activities of the Garzê-Yushu Fault Zone. J. Geomechanics 12 (03), 295–304. doi:10.3969/j.issn.0253-4967.2013.01.004
Qian, H., Allen, C. R., Luo, Z. L., Wen, X. Z., Zhou, H. W., and Huang, W. S. (1988). The Active Characteristics of Xianshuihe Fault in Holocene. Earthquake Res. China 4 (02), 11–20.
Qiao, X., and Zhou, Y. (2021). Geodetic Imaging of Shallow Creep along the Xianshuihe Fault and its Frictional Properties. Earth Planet. Sci. Lett. 567, 117001. doi:10.1016/j.epsl.2021.117001
Qu, C. Y., Zhang, G. F., Shan, X. J., Zhang, G. H., Liu, Y. H., and Song, X. G. (2013). Coseismic and Postseismic Deformation fields of the 2010 Yushu, Qinghai MS7.1 Earthquake and Their Evolution Processes. Chin. J. Geophys. 56 (7), 2280–2291. doi:10.6038/cjg20130715
Savage, J. C., and Burford, R. O. (1973). Geodetic Determination of Relative Plate Motion in central California. J. Geophys. Res. 78 (5), 832–845. doi:10.1029/JB078i005p00832
Savage, J. C., Gan, W., and Svarc, J. L. (2001). Strain Accumulation and Rotation in the Eastern California Shear Zone. J. Geophys. Res. 106 (B10), 21995–22007. doi:10.1029/2000JB000127
Shen, Z.-K., Lü, J., Wang, M., and Bürgmann, R. (2005). Contemporary Crustal Deformation Around the Southeast Borderland of the Tibetan Plateau. J. Geophys. Res. 110 (B11), B11409. doi:10.1029/2004JB003421
Shen, Z. K., and Liu, Z. (2020). Integration of GPS and InSAR Data for Resolving 3‐Dimensional Crustal Deformation. Earth Space Sci. 7 (4), e1036E–e2019E. doi:10.1029/2019EA001036
Shen, Z. K., Wang, M., Zeng, Y., and Wang, F. (2015). Optimal Interpolation of Spatially Discretized Geodetic Data. Bull. Seismological Soc. America 105 (4), 2117–2127. doi:10.1785/0120140247
Shi, F., He, H., Densmore, A. L., Li, A., Yang, X., and Xu, X. (2016). Active Tectonics of the Ganzi-Yushu Fault in the southeastern Tibetan Plateau. Tectonophysics 676, 112–124. doi:10.1016/j.tecto.2016.03.036
Tang, R. C., and Huang, Z. Z. (1983). The Basic Characteristics and Research Status of Xianshuihe Fault Zone. Recent Dev. World Seismology 03, 1–4.
Tapponnier, P., Peltzer, G., Le Dain, A. Y., Armijo, R., and Cobbold, P. (1982). Propagating Extrusion Tectonics in Asia: New Insights from Simple Experiments with Plasticine. Geol 10 (12), 611–616. doi:10.1130/0091-7613(1982)10<611:petian>2.0.co;2
Tapponnier, P., Zhiqin, X., Roger, F., Meyer, B., Arnaud, N., Wittlinger, G., et al. (2001). Oblique Stepwise Rise and Growth of the Tibet Plateau. Science 294 (5547), 1671–1677. doi:10.1126/science.105978
Walters, R. J., Holley, R. J., Parsons, B., and Wright, T. J. (2011). Interseismic Strain Accumulation across the North Anatolian Fault from Envisat InSAR Measurements. Geophys. Res. Lett. 38 (5), L05303. doi:10.1029/2010GL046443
Walters, R. J., Parsons, B., and Wright, T. J. (2014). Constraining Crustal Velocity fields with InSAR for Eastern Turkey: Limits to the Block-like Behavior of Eastern Anatolia. J. Geophys. Res. Solid Earth 119 (6), 5215–5234. doi:10.1002/2013JB010909
Wang, E. (1998). Late Cenozoic Xianshuihe-Xiaojiang, Red River, and Dali Fault Systems of Southwestern Sichuan and central Yunnan. China: Geological Society of America.
Wang, H., Wright, T. J., and Biggs, J. (2009). Interseismic Slip Rate of the Northwestern Xianshuihe Fault from InSAR Data. Geophys. Res. Lett. 36 (3), L03302. doi:10.1029/2008GL036560
Wang, H., Wright, T. J., Liu‐Zeng, J., and Peng, L. (2019). Strain Rate Distribution in South‐Central Tibet from Two Decades of InSAR and GPS. Geophys. Res. Lett. 46 (10), 5170–5179. doi:10.1029/2019GL081916
Wang, M., Shen, Z., Gan, W., Liao, H., Li, T., Ren, J., et al. (2008). GPS Monitoring of Temporal Deformation of the Xianshuihe Fault. Sci. China Ser. D-earth Sci. 51 (05), 1259–1266. doi:10.1007/s11430-008-0095-3
Wang, M., and Shen, Z. K. (2020). Present‐Day Crustal Deformation of Continental China Derived from GPS and its Tectonic Implications. J. Geophys. Res. Solid Earth 125 (2), e2019J–e18774J. doi:10.1029/2019JB018774
Wang, W., Qiao, X., Yang, S., and Wang, D. (2017). Present-day Velocity Field and Block Kinematics of Tibetan Plateau from GPS Measurements. Geophys. J. Int. 208 (2), 1088–1102. doi:10.1093/gji/ggw445
Wang, Y., Wang, M., Shen, Z.-K., Ge, W., Wang, K., Wang, F., et al. (2013). Inter-seismic Deformation Field of the Ganzi-Yushu Fault before the 2010 Mw 6.9 Yushu Earthquake. Tectonophysics 584, 138–143. doi:10.1016/j.tecto.2012.03.026
Weiss, J. R., Walters, R. J., Morishita, Y., Wright, T. J., Lazecky, M., Wang, H., et al. (2020). High‐Resolution Surface Velocities and Strain for Anatolia from Sentinel‐1 InSAR and GNSS Data. Geophys. Res. Lett. 47 (17), e2020G–e87376G. doi:10.1029/2020GL087376
Wen, X., Ma, S., Xu, X., and He, Y. (2008). Historical Pattern and Behavior of Earthquake Ruptures along the Eastern Boundary of the Sichuan-Yunnan Faulted-Block, Southwestern China. Phys. Earth Planet. Interiors 168 (1-2), 16–36. doi:10.1016/j.pepi.2008.04.013
Wen, X. Z. (2000). Character of Rupture Segmentation of the XianshuiheAnninghe-Zemuhe Fault Zone, Western Sichuan. Seismology Geology. 22 (03), 239–249. doi:10.3969/j.issn.0253-4967.2000.03.005
Wen, X. Z., Xu, X. W., Zheng, R. Z., Xie, Y. Q., and Wan, C. (2003). Average Slip-Rate and Recent Large Earthquake Ruptures along the Garzê-Yushu Fault. Sci. China (Series: D). 46 (S1), 199–208. doi:10.3969/j.issn.1674-7240.2003.z1.022
Werner, C., Wegmüller, U., Strozzi, T., and Wiesmann, A. (2000). “Gamma SAR and Interferometric Processing Software,” in Proceedings of the ERS-Envisat Symposium, Gothenburg, Sweden, October 16–20, 2000.
Wright, T. J., Elliott, J. R., Wang, H., and Ryder, I. (2013). Earthquake Cycle Deformation and the Moho: Implications for the Rheology of continental Lithosphere. Tectonophysics 609 (1), 504–523. doi:10.1016/j.tecto.2013.07.029
Wu, J. W., Huang, X. M., and Xie, F. R. (2017). Late Quaternary Slip Rate of the Garzê Yushu Fault Zone (Dangjiang Segement). Chin. J. Geophys. 60 (10), 3872–3888. doi:10.6038/cjg20171017
Wu, Z. H., Zhou, C. J., Feng, H., Zhang, K. Q., Li, J. C., Ye, P. S., et al. (2014). Active Faults and Earthquake Around Yushu in Eastern Tibetan Plateau. Geol. Bull. China 33, 419–469. doi:10.3969/j.issn.1671-2552.2014.04.003
Xu, X. W., Wen, X. Z., Zheng, R. Z., Ma, W. T., Song, F. M., and Yu, G. H. (2003). Pattern of Latest Tectonic Motion and its Dynamics for Active Blocks in Sichuan-Yunnan Region. Sci. China (Series: D). 33 (S1), 151–162. doi:10.3969/j.issn.1674-7240.2003.z1.017
Xu, X. W., Wu, X. Y., Yu, G. H., Tan, X. B., and Li, K. (2017). Seismo-Geological Signatures for Identifying M≥7. 0 Earthquake Risk Areas and Their Premilimary Application in Mainland China. Seismology Geology. 39 (02), 219–275. doi:10.3969/j.issn.0253-4967.2017.02.001
Yu, C., Li, Z., Penna, N. T., and Crippa, P. (2018). Generic Atmospheric Correction Model for Interferometric Synthetic Aperture Radar Observations. J. Geophys. Res. Solid Earth 123 (10), 9202–9222. doi:10.1029/2017JB015305
Zhang, P. Z., Deng, Q. D., Zhang, G. M., Ma, J., Gan, W. J., Min, W., et al. (2003). Active Tectonic Blocks and strong Earthquakes in the Continent of China. Sci. China (Series: D). 33 (S1), 12–20. doi:10.3969/j.issn.1674-7240.2003.z1.002
Zhang, P.., Shen, Z., Wang, M., Gan, W., Burgmann, R., Molnar, P., et al. (2004). Continuous deformation of the Tibetan Plateau from global positioning system data. Geology 32 (09), 809–812. doi:10.1130/G20554.1
Zheng, G., Wang, H., Wright, T. J., Lou, Y., Zhang, R., Zhang, W., et al. (2017). Crustal Deformation in the India-Eurasia Collision Zone from 25 Years of GPS Measurements. J. Geophys. Res. Solid Earth 122 (11), 9290–9312. doi:10.1002/2017JB014465
Zhou, R. J., Ma, S. H., and Cai, C. X. (1996). Late Quaternary Activie Features of the Ganzi-Yushu Fault Zone. Earthquake Res. China 12 (03), 250–260.
Zhou, R. J., Wen, X. Z., Cai, C. X., and Ma, S. H. (1997). Recent Earthquakes and Assessment of Seismic Tendency on the Ganzi-Yushu Fault Zone. Seismology Geology. 19 (02), 20–29.
Keywords: Ganzi-Yushu-Xianshuihe fault, InSAR, GPS, 3-D Velocity Field, slip rate, strain rate field
Citation: Zhang W, Ji L, Zhu L, Liu C, Jiang F and Xu X (2022) Current Slip and Strain Rate Distribution Along the Ganzi-Yushu-Xianshuihe Fault System Based on InSAR and GPS Observations. Front. Earth Sci. 10:821761. doi: 10.3389/feart.2022.821761
Received: 24 November 2021; Accepted: 27 January 2022;
Published: 15 February 2022.
Edited by:
Hua Wang, Guangdong University of Technology, ChinaReviewed by:
Yongsheng Li, Ministry of Emergency Management, ChinaCopyright © 2022 Zhang, Ji, Zhu, Liu, Jiang and Xu. This is an open-access article distributed under the terms of the Creative Commons Attribution License (CC BY). The use, distribution or reproduction in other forums is permitted, provided the original author(s) and the copyright owner(s) are credited and that the original publication in this journal is cited, in accordance with accepted academic practice. No use, distribution or reproduction is permitted which does not comply with these terms.
*Correspondence: Lingyun Ji, amlsaW5neXVuQHNtYWMuYWMuY24=
Disclaimer: All claims expressed in this article are solely those of the authors and do not necessarily represent those of their affiliated organizations, or those of the publisher, the editors and the reviewers. Any product that may be evaluated in this article or claim that may be made by its manufacturer is not guaranteed or endorsed by the publisher.
Research integrity at Frontiers
Learn more about the work of our research integrity team to safeguard the quality of each article we publish.