 Yaming Tang1
 Zizheng Guo
94% of researchers rate our articles as excellent or good
Learn more about the work of our research integrity team to safeguard the quality of each article we publish.
Find out more
ORIGINAL RESEARCH article
Front. Earth Sci., 07 February 2022
Sec. Geohazards and Georisks
Volume 10 - 2022 | https://doi.org/10.3389/feart.2022.821735
This article is part of the Research TopicAdvances in Modeling, Assessment, and Prevention of Geotechnical and Geological DisastersView all 44 articles
Various risk management measures have been applied to reduce risks associated with the debris flow; however, only a few studies have adopted the economic benefit to evaluate measure effectiveness. The present study sought to explore debris flow risks at a catchment scale and establish the appropriate risk-reducing measures. The Chengbei Gully debris flow in Shanxi province (China) was selected for the case study. High-resolution topographic data of the drainage basin were obtained using the airborne LiDAR technology. FLO-2D software was used to simulate the debris flow process to perform hazard zonation. Vulnerability was estimated based on the location of elements at risk within the hazard zones and the field survey. Several structural and non-structural measures for controlling risks were proposed based on the risk assessment results, and the benefit–cost ratio was used to analyze their effectiveness. The findings indicated that the rainfall event triggering the Chengbei Gully debris flow had an 80-year return period. The total risk under this rainfall condition was 2.3 × 10⁵ $, which was an unacceptable level according to the criteria of tolerance risk. The findings showed that the engineering measure was the best mitigation approach for the Chengbei Gully debris flow with a benefit of 1.35 million $ and a benefit–cost ratio of 6.43.
Debris flows are among the most dangerous mass movements worldwide, especially in the alpine environment (Glade, 2005; Hürlimann et al., 2014; Tiranti et al., 2018; Li et al., 2021). Most debris flows are characterized by large magnitudes, high velocities, and a mixture flow of sediment and water, thus posing potential significant threats to residents and infrastructures (Jakob, 2005; Gregoretti and Fontana, 2008; Gregoretti et al., 2016). Therefore, it is imperative to explore debris flow risks and propose professional mitigation measures based on risk mapping (van Westen et al., 2006; Qing et al., 2020).
The risk of natural hazards can be assessed through qualitative or quantitative methods based on the quantity and quality of datasets. Previously adopted approaches mainly involved expert-based and statistical methods (Guzzetti, 2000; Chen et al., 2016; Rossi et al., 2019) which mainly require a long and accurate landslide catalog. Results obtained using these procedures were relatively coarse and could not be compared to other areas in the form of numerical values (e.g., Guzzetti, 2000). Quantitative risk assessment is gradually being conducted at different scales (Dai et al., 2002; Remondo et al., 2005; Erener and Düzgün, 2013), owing to the requirement for risk mapping with a better quality and advances in development of GIS and RS techniques. To estimate the direct risks of natural hazards on elements at risk, studies have adopted statistical theories, such as the magnitude–frequency curve (Hungr et al., 2008; Corominas and Moya, 2010). In addition, previous studies explored quantitative risks based on the event tree analysis (Budetta, 2002; Mineo et al., 2017). In most cases, risk quantification was based on the product of hazard, vulnerability, and the value of elements at risk. Regarding the risk assessment of debris flows, two measurable components are mainly used including the following: 1) the temporal and spatial probability of one event occurrence and 2) the magnitude of harm that the event may result (Chen and Wu, 2016). Some attempts have been made for quantitative risk assessment of debris flows. For instance, Calvo and Savi (2009) proposed a method based on the Monte Carlo procedure for formal risk analysis in debris flow–prone areas. Jaiswal et al. (2011) presented a quantitative procedure for estimating the debris slide risk to life and property and applied it to estimate the risk of potential debris slides in a mountainous area in the Nilgiri hills of southern India. Lin et al. (2011) simulated the flow conditions of typhoon-triggered debris flows and generated risk mapping under different scenarios.
Notably, most case studies regarding the landslide risk assessment only analyzed the initiation area, whereas studies on the risk assessment by incorporating the runout distance are limited (Jaiswal et al., 2011; Guo et al., 2020). However, debris flows are a type of fast mass movements compared with slow-moving landslides; thus, there is a need to perform runout analysis to explore the potential inundation areas and establish actual risks (McDougall, 2017). A few solutions have been developed for this purpose, including constitutive methods and numerical models, based on fundamental assumption simulations (single-phase or multi-phase) (Baum and Godt, 2010; Gan and Zhang, 2019). Numerical modeling is one of the most efficient tools. Relevant approaches such as the DAN3D analysis (Salvatici et al., 2017), smoothed particle hydrodynamic (SPH) method (Wang et al., 2016; Han et al., 2019), particle flow code (PFC) (Lo et al., 2018), and depth-averaged material point method (DAMPM) (Abe and Konagai, 2016) have received wide applications. The two-dimensional water flood and mudflow simulation program FLO-2D is a useful tool, and it has been successfully applied for the runout analysis of debris flows in several areas worldwide (e.g., Lin et al., 2011; Gomes et al., 2013). FLO-2D can predict important parameters during the movement processes (such as the runout distance, volume of accumulation, flow velocity, and depth), which are critical for estimating the debris flow intensity. Therefore, FLO-2D is an appropriate method for hazard assessment.
Vulnerability assessment is a frequent conceptual and operational challenge in the risk framework (Fuchs et al., 2011; Jaiswal and van Westen, 2013). Although multiple components (e.g., elements at risk and capacity) and various parameters (e.g., information on people and infrastructures) are required for accurate assessment, most cases lack sufficient data. This explains why the methods for vulnerability assessment are generally qualitative or semi-quantitative. Previous studies developed quantitative models; however, most are used for buildings exposed to natural hazards and are primarily based on physical tests or empirical theory. For example, Uzielli et al. (2008), Li et al. (2010), and Peduto et al. (2017) explored the vulnerability estimation function or the curve for the scenario-based landslide hazards. A unified quantitative method for vulnerability estimation is yet to be proposed; thus, a semi-quantitative method was adopted in the present study.
The final result of risk assessment is mainly expressed by the expected losses resulting from a hazardous event of a given intensity. Studies thus use different indicators to show the risk distribution of hillslopes subjected to natural hazards, including the non-dimensional risk level (Bell and Glade, 2004; Arksey and VanDine, 2008), direct economic damage (Vranken et al., 2013), indirect damage (Jaiswal et al., 2010), and the total number of casualties (Guzzetti et al., 2005). Moreover, some studies applied the index of annual risk to assess the risk within 1 year; thus, the results for different cases and scales can be compared directly (Chen and Wu, 2016). In addition to mapping the risk zonation, the obtained risk results can be used for further objectives. For instance, parameters of existing models can be calibrated using the results of past events, to make them more accurate in predicting the risk under future scenarios (Bertolo and Wieczorek, 2005). Some studies used risk results as a reminder to the local authorities and residents to understand the potential threats (Graff, 2014). The quantitative risk assessment mainly seeks to provide the basis for the design and implementation of mitigating measures (Holcombe et al., 2012; Vranken et al., 2013). Although several measures can effectively reduce the risk, their time or economic cost is unacceptable for organizations and individuals faced with the risks. Studies on risk management show that risk mitigation measures are not primarily geared towards risk elimination but to maintain the risk to an acceptable level. Therefore, it is necessary to evaluate and compare the social or economic effects of the potential measures to select suitable measures (Peila and Guardini, 2008). Unfortunately, the present case studies on this topic (e.g., Chen and Wu, 2016; Guo et al., 2020) are limited and should be updated, especially regarding fast mass movements.
The current study sought to perform a test to provide a basis for making the decision of risk mitigation measures through cost–benefit analysis. The specific objectives include the following: 1) Simulation of the runout process of the debris flow using remote sensing DEM data and FLO-2D software; 2) Vulnerability estimation based on field survey data and the semi-quantitative method; 3) Application of the procedure to the Chengbei Gully of Shanxi province (China) (approximately 1 km2), to calculate the risk level in a given rainfall scenario; and 4) Proposing several measures as potential choices for risk reduction and comparing their effectiveness from an economic point of view.
The Chengbei Gully is located in the Lvliang mountainous area to the east of Loess plateau (China), a well-known geohazard-prone region (Juang et al., 2019). The Chengbei Gully administratively belongs to Ji County in Shanxi province, and its coordinates are E110°40′25″, N36°6′14″ (Figure 1). A heavy rainfall event with an accumulated value above 100 mm and a maximum hourly rainfall of 54.6 mm was recorded in this area on July 3rd of 2013 (Wang et al., 2016). After the rains, rain water mixed with soil particles, rubbles, and stones flowed along the gully downstream and destroyed courtyards and residents’ houses (Figures 2A,B). Additionally, the surface land cover was also affected much. As seen in Figure 2C, the remote sensing image showed the impact of the event on the land cover in the channel up to April 2014.
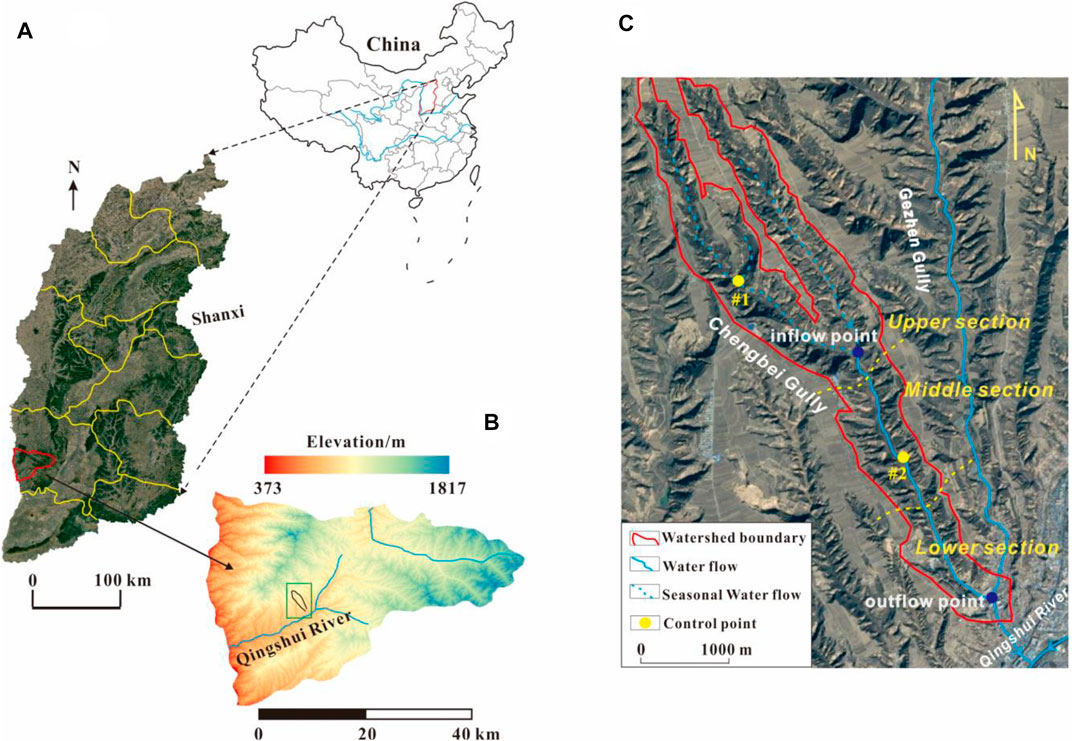
FIGURE 1. Location of the Chengbei Gully: (A) location of Shanxi Province, (B) location of the Chengbei Gully in Ji County, and (C) topography map of the Chengbei Gully obtained from remote sensing images.
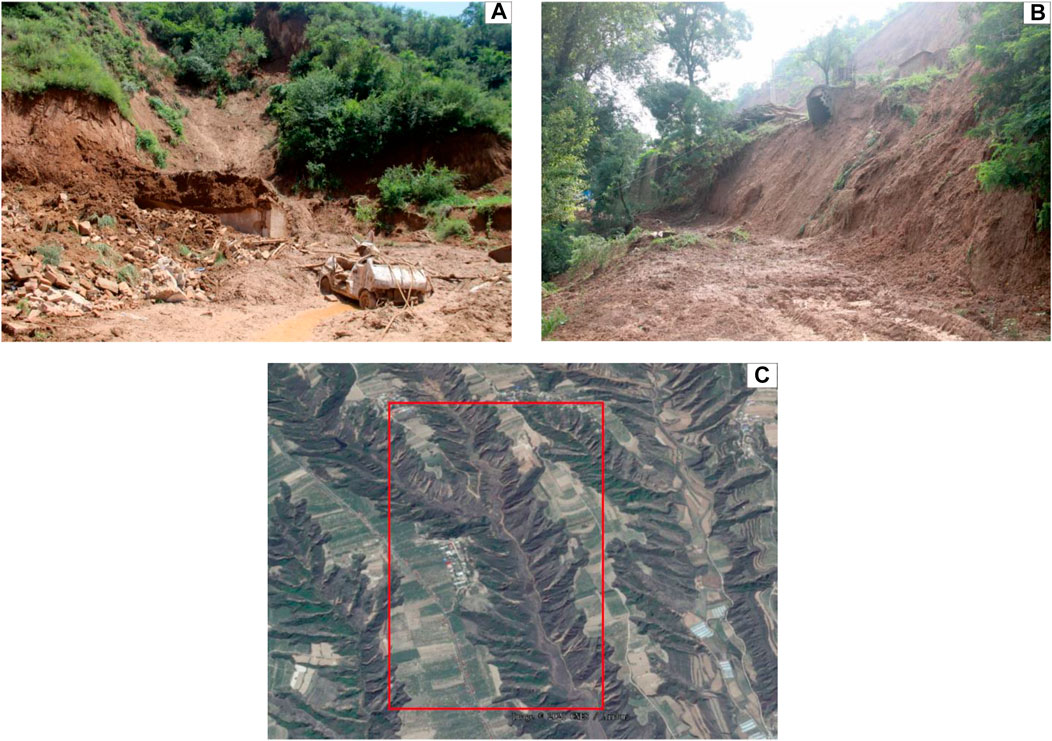
FIGURE 2. Some pictures and images after the debris flow event: (A) a small vehicle submerged by the mixture of soil and rocks, (B) a house damaged by the flowing material in the channel, and (C) the remote sensing image of the channel in April 2014 from Google Earth (access at August 10). The red rectangle shows the location of the channel.
As defined by Hungr et al. (2014), the debris flow is very rapid to the extremely rapid surging flow of saturated debris in a steep channel and strong entrainment of material and water from the flow path. Meanwhile, the rainfall and intensity in the study area are similar with some other debris flow events reported in China (260 mm for total rainfall and 60 mm for maximum daily rainfall in Wei et al., 2018). Hence, the event observed on the Chengbei Gully on July 3rd of 2013 was considered as a debris flow triggered by an extreme rainfall.
The drainage area at the upper stream of the basin covers approximately 3.39 km2 and is 6.76 km long. The average slope of the initiation area at the channel is approximately 30° with an elevation difference of 289 m. Geomorphologically, the entire gully can be categorized into three sections (Figure 3). The upper part has two branch channels with the transverse sections exhibiting a typical “V” shape, with steep slopes at both sides (∼45°). A channel with a gentle valley bottom and relatively narrow width occurs at the middle section. The middle section is 1,600 m long. The lower section is the widest and gentlest part of the gully with a relatively high discharge, and water flows into the Qingshui River which is a branch of the Yellow River. The geological setting of the Chengbei Gully mainly comprises Quaternary loess deposits with an average thickness of 100∼200 m. Notably, silty clay and rubbles loosely accumulate at the toe of slopes. These materials provide good sources for debris flows. A field investigation reported that the total volume of these materials was approximately 1 × 10⁵ m3. Studies show that no humans have settled in the upper and middle stream areas; however, there is a small village with a few residential houses in the lower stream.
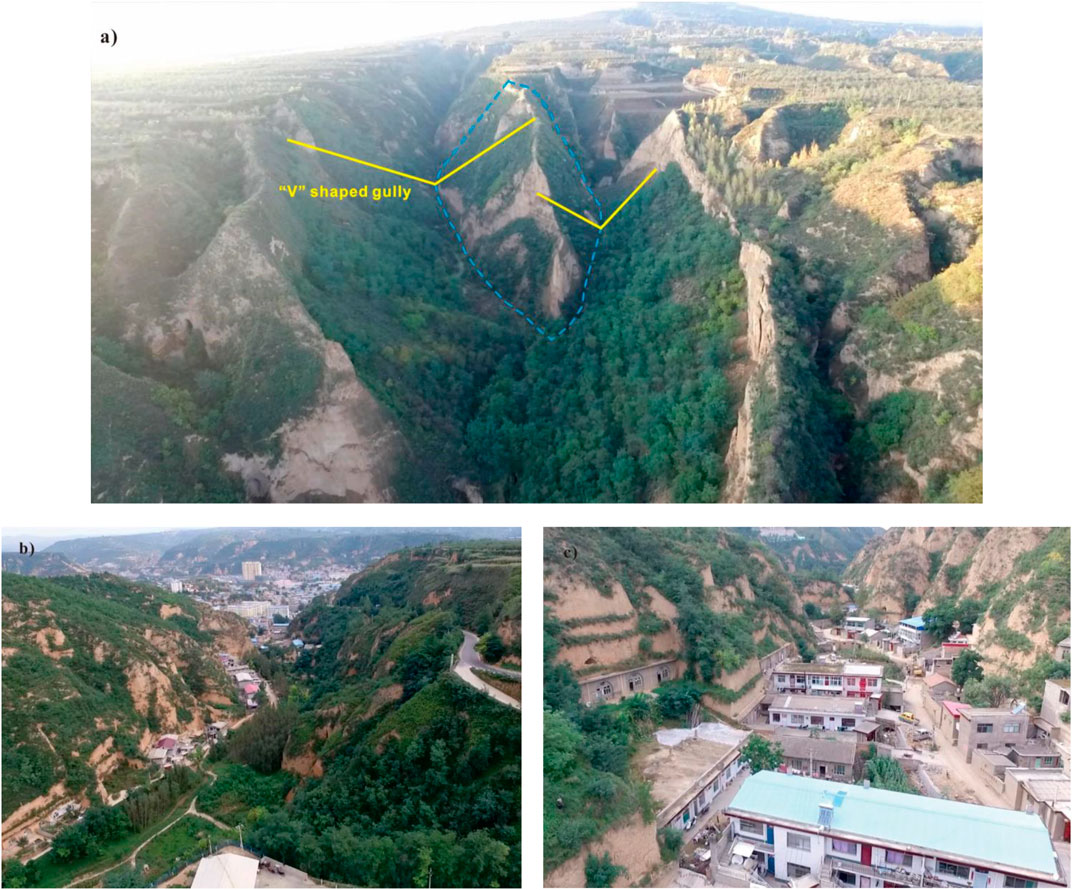
FIGURE 3. Photographs showing the topography of different parts of the Chengbei Gully: (A) the steep gully on the upper section, (B) the relatively wide and gentle channel of the middle section, and (C) the settlement constructed on the lower section of the gully.
Light detection and ranging (LiDAR) sensors can generate high-resolution three-dimensional (3D) coordinates of objects. Height information (that is Z values) can be used to characterize the topography of an area (Wu et al., 2021). The Chengbei Gully is not a large-scale area; therefore, a high-resolution digital elevation model (DEM) is important for subsequent simulations. In the current study, the manned airborne LiDAR (Figure 4A) was used to obtain the DEM data.
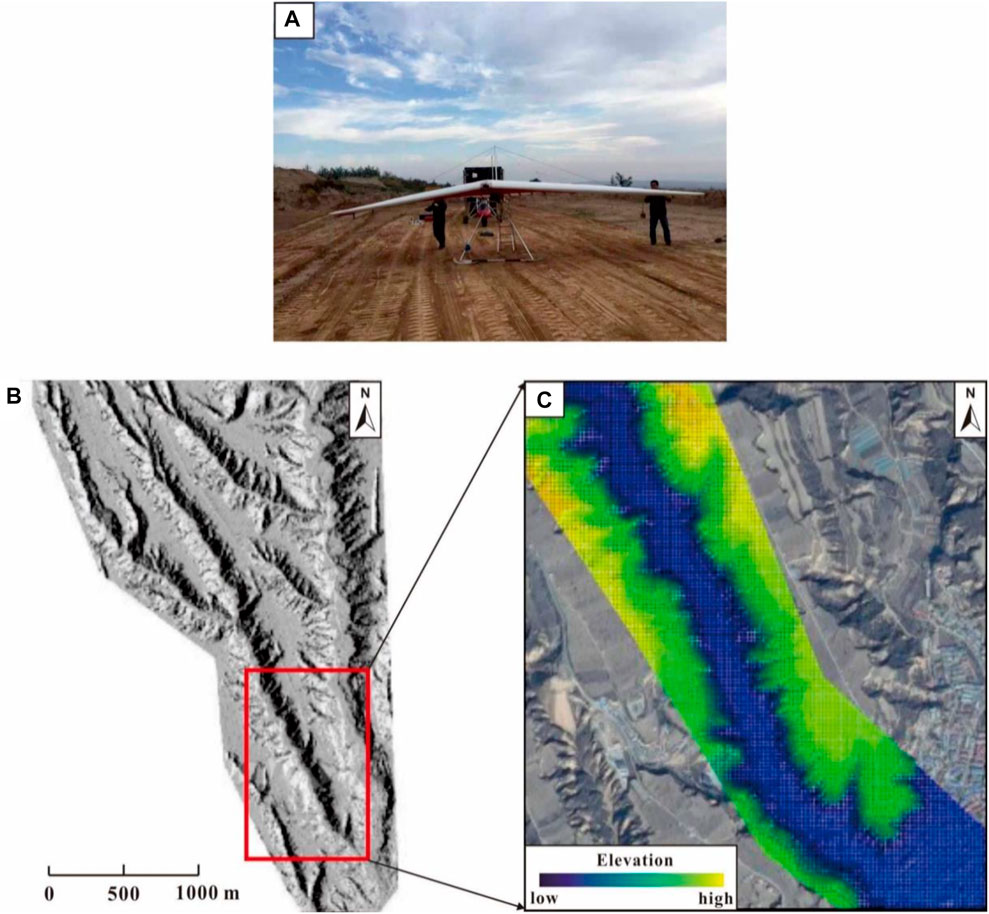
FIGURE 4. Topography data of the Chengbei Gully region: (A) the manned airborne LiDAR used in this study, (B) hill shade map calculated using 1 m DEM, and (C) elevation map of the zoomed area, with the remote sensing images as the base map.
LiDAR mapping was conducted on July 2017 using the biplane DJI F550 purchased from Da-Jiang Innovations Science and Technology Co., Ltd. (DJI), Shenzhen, China. The biplane comprised laser-scan systems in near-infrared sensors. The load capacity of the biplane was 3 kg, and the flight lasted for approximately 40 min. The overflight was planned and operated by a professional employee of the China Geological Survey (CGS). The path was roughly rectangular in shape with a length of 4 km and a width of 2 km. The flight altitude and velocity were fixed to ensure a relatively consistent overlap between images. Retrieved LiDAR data were processed by Terrasolid software (Terrasolid Ltd., Helsinki, Finland). Point clouds were generated in a LAS format and subsequently converted to DEM data through ArcGIS software with a resolution of 1 m (Figures 4B,C). As seen in Figure 1C, two control points were used to evaluate the data quality. The accurate elevations of the two control points obtained from the contour line were 908 m (point #1) and 842 m (point #2) asl, respectively. Their elevations revealed in the LiDAR DEM were 908.2 and 842.1 m asl, respectively.
The field survey was conducted between July and October 2017. Targets of the survey mainly included 1) investigating and recording deformation and movement of materials during the debris flow by engaging with residents; 2) obtaining information on the vulnerability of the elements at risk (population, constructions, and local price level); 3) exploring information on geological settings (e.g., topography, materials, and geological structures), to have a deeper insight on risk reduction; and 4) collecting soil samples to perform laboratory tests to determine the physical parameters for numerical simulation.
The following laboratory tests of soil samples were performed in the Xi’an Center of China Geological Survey: 1) the soil unit weight test; 2) the strain-controlled test to determine soil viscosity; and 3) the soil bulk concentration test. All these followed the national criteria in China (MOHURD, 2019).
The general procedure of this study includes the following: 1) risk calculation, 2) analysis of the risk level based on the tolerance criteria, and 3) specific designs of risk mitigation measures and effectiveness analysis. Figure 5 outlines the research design. The principles for the methods used in the current study are described in the following sections.
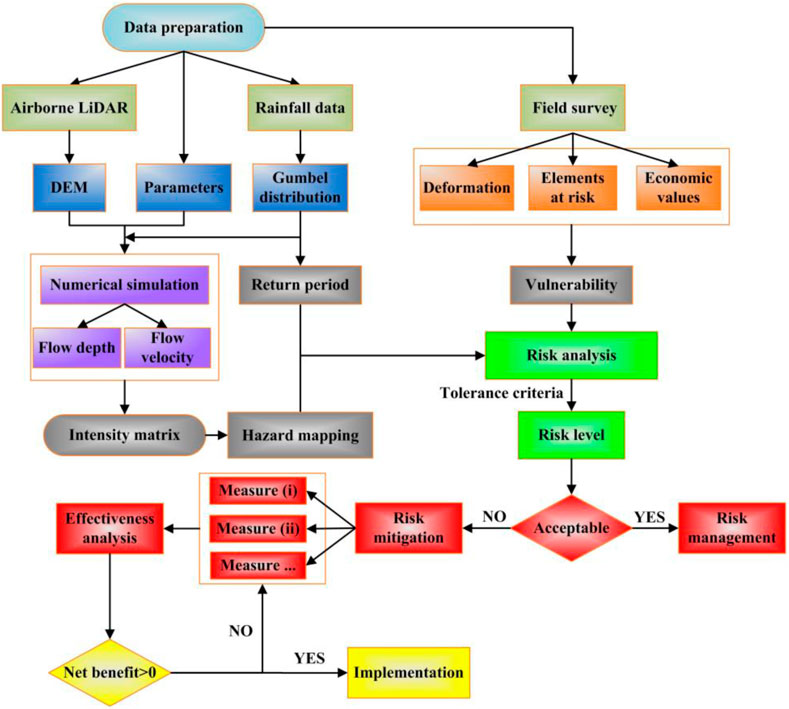
FIGURE 5. Research strategy.
The movement process of the Chengbei Gully debris flow was simulated by FLO-2D software, a two-dimension numerical model developed by O’Brien et al. (1993). The software adopts the quadratic rheological model which allows simulations for various conditions ranging from clear water to sediment flows. The FLO- 2D modeling is controlled by the terrain and is based on the continuity equation and dynamic wave equation (Lin et al., 2011; Gomes et al., 2013).
In this study, DEM data were used as the input for the FLO-2D BASE environment to obtain topographic attributes and to develop the geological model. Rheological parameters defined by the FLO-2D manual (O’Brien, 2007) were determined by laboratory tests (section 2.2) and empirical values. In order to reveal the inherent uncertainties in these parameters, a potential range for these parameters was also provided (O’Brien, 2007; Gomes et al., 2013; Haas and Woerkom, 2016). The range can also be used to ensure that the future structural countermeasure for risk reduction would work as planned.
As seen in Figure 1C, the junction of two branches in the upper stream area was used as the inflow point for the catchment model. The grid with the lowest position in the watershed served as the outflow point, where the water flows confluence with the water from another gully. Data on rainfall events, including cumulative rainfall and maximum hourly rainfall, were also required. The grid size was set to 2 m because the simulation duration under this condition was about 3 h, which was similar to the duration of the event. The parameters used are presented in Table 1. These parameters are static, and the software uses them to analyze the flowing process. Some key indicators in the flowing process are the output results of it, including the flowing depth and velocity, which we will describe in following parts.
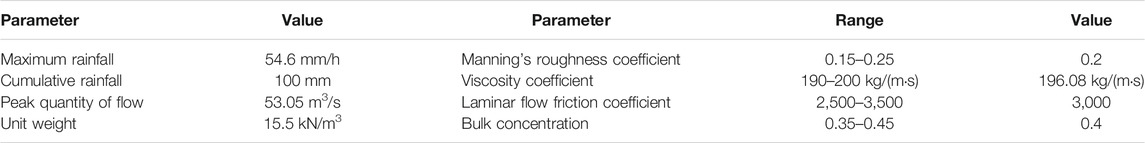
TABLE 1. Parameters used in numerical simulation by FLO-2D.
The Manning’s roughness coefficient was set at 0.2 because forest was the main land use in this area (see Figure 3). According to Brater and King (1976) and Montes (1998), this type of land use has a significantly higher value of n. The value used in this study was higher than that used in most cases [e.g., Liu et al. (2013); Haas and Woerkom (2016)] but close to the value reported by Cui et al. (2011).
A hazard can be defined as the degree of debris flow damage within a given period in a specific area. It is mainly associated with various parameters, including the probability of occurrence and intensity (; Corominas et al., 2014). In this study, the probability of occurrence of the debris flow under the given rainfall condition was 1; therefore, the main task was to determine the intensity. In practical application, qualitative methods are mainly used to assess the intensity, based on two crucial parameters (flow depth and flow velocity) in the movement process of debris flows. A three-degree hazard matrix was defined for the Chengbei Gully debris flow based on a few examples of reclassification of the intensity proposed in previous studies (Hürlimann et al., 2006; Tang and Okimura, 2006; Chen et al., 2010) (Figure 6). Most buildings in the area had a floor height of ∼2.5 m; therefore, this value was used as a threshold of flow depth that can significantly damage the buildings. At a flow depth lower than 0.5 m, people can breathe even if they are caught by the deposits; thus, this was considered as a relatively safe depth. However, it should be noted that some studies consider that breathability cannot be used as a measure in a debris flow disaster, so the depth of 0.5 m may also be fatal (e.g., Raetzo et al., 2002; Hürlimann et al., 2006). Most residents living on the slope were adults aged between 40 and 60; thus, they can escape from debris flow with a velocity of 0.5 m/s. However, if the flow velocity is faster than 1 m/s, ordinary people can hardly escape.
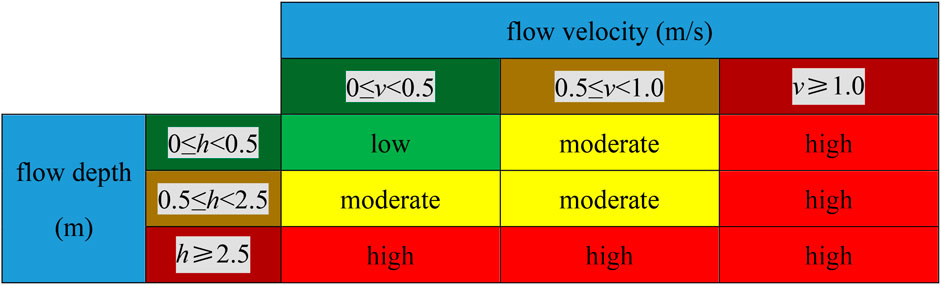
FIGURE 6. Intensity matrix for the debris flow.
Every risk scenario can be attributed to triggering events with a specific return period (Zêzere et al., 2008). Therefore, it is imperative to determine the return period when assessing the temporal probability of the risk or predicting and modeling different future scenarios (e.g., Guo et al., 2020). An extreme value type I (i.e., Gumbel distribution) method was used to fit the rainfall events to explore the rainfall frequency. This statistical approach is widely applied in analysis and prediction of hydrological events, including flooding events (Onen and Bagatur, 2017). The cumulative distribution function of Gumbel distribution is expressed as shown below (Gumbel, 1941; Matti et al., 2016):
where X is a random variable, x is a possible value of X, ξ and α are the location parameter and scale parameter, respectively, which are calculated as follows (Gumbel, 1941; Matti et al., 2016):
where μX and σ2X are the mean and variance of the dataset, respectively. To explore changes in rainfall events over the entire recording period, the Gumbel distribution, fitting to daily rainfall peaks for every rainy season in 50 years (from 1964 to 2013), was performed using the MATLAB tool.
Two types of elements at risk, including property and life, are considered when determining the debris flow (Corominas et al., 2014). Vulnerability of these elements varies with the hazard intensity and resistance to the debris flow and requires several indicators for evaluation. However, total quantitative vulnerability estimation is not performed in most cases due to lack of sufficient damage data (Fell et al., 2008; Jaiswal et al., 2011). In this study, a semi-quantitative estimation based on hazard mapping and information from the fieldwork was used to determine the vulnerability. The hazard intensity was evaluated using the acquired information mainly based on the depth and the velocity of the debris flow reported in section 3.1. In addition, information from the fieldwork was used to explore the resistance of elements at risk. For constructions, the impact force was the direct indicator associated with the hazard intensity. High values of flow depth and velocity imply a larger impact force of the debris flow, resulting in higher vulnerability of the building. The main factors contributing to resistance of constructions include height and materials. Hence, the relationship between the building height and flow depth is important for vulnerability estimation. For estimation of vulnerability of people, the model must account for indicators such as the age, healthy state, and the implementation of early warning systems within the community (Du et al., 2016; Guo et al., 2020).
Risk assessment determines whether the present risk level is tolerable to the society or existing mitigation measures are adequate. There is a need to evaluate whether alternative control measures can be implemented if the risk is not tolerable and if mitigation measure are not effective. Life risk is the main indicator of the social risk tolerance criteria, for analysis of the number of people threatened in a disaster and the probability of death. Although some risk tolerance criteria have been proposed and implemented (e.g., Bottelberghs, 2000; AGS, 2007), the findings are controversial. Therefore, the criterion developed by Hong Kong Geotechnical Engineering Office (1998) was adopted in the present study. The criterion determines the tolerable social risk based on the F-N curve, where N represents the number of fatalities and F represents the frequency of N or more fatalities per year. The curve (Figure 7) comprises four parts with different risk levels, including the acceptable risk, unacceptable risk, intense scrutiny region, and the “as low as reasonably practicable” (ALARP) region. Hence, if the risk level of a given scenario is unacceptable or is at the ALARP level, measures to reduce and mitigate risks must be considered. This implies that a measure is considered reasonable when it reduces the risk from the unacceptable or ALARP level to an acceptable level.
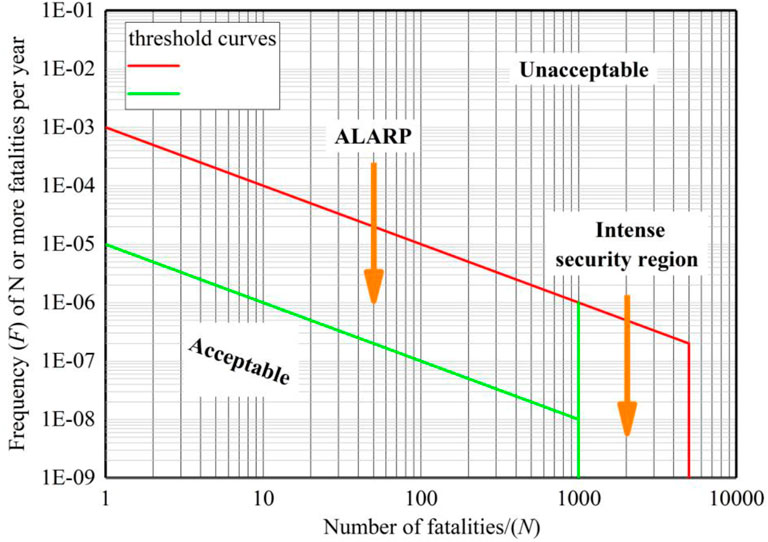
FIGURE 7. Social risk criteria for the debris flow [according to Hong Kong Geotechnical Engineering Office (1998)].
The risk can be calculated using the formula below (Fell et al., 2008; Corominas et al., 2014):
where R is the total risk, and P(L) is the occurrence probability of the debris flow, which is reciprocal of the return period of the triggering rainfall. P(T:L) is the possibility of the debris flow reaching a specific point. If an element at risk is located at the inundation area of the debris flow, this value is 1. P(S:T) is the temporal-spatial probability of the elements being at a certain point when the debris flow occurs. The P(S:T) for the constructions at risk in the inundation area obtained from the runout analysis is 1. Analysis of the people residing at the area showed that their time at home was approximately 10 h per day; therefore, the P(S:T) was set at 0.42. E is the economic value of the elements at risk or the number of people. Values for E were assigned to every property based on their type (constructions or indoor possessions), local price level (The people’s Government of Shanxi Province, 2020), and field survey. The simple classification method used and the specific values obtained are shown in Table 2. This study was carried out for economic decision-making; thus, the values for life (Ei) were estimated using the method described by Shang (2012) as follows:
where g represents the average gross domestic product per person per year, e denotes the average expected lifetime of people, and w denotes the ratio of working time to leisure time. The National Bureau of Statistics of China (2020) reports that g is 10,280 $/year, e is 77 years old, and w is approximately 0.2 in villages. Therefore, the total economic risk posed by the Chengbei Gully can be expressed as follows:
where RT is the total economic risk of the Chengbei Gully and Rp and RL represent the property risk and population risk, respectively.
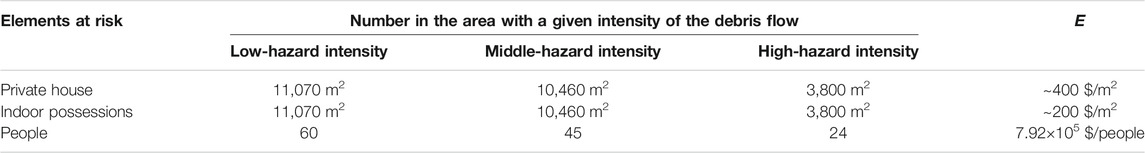
TABLE 2. Values of E for the elements at risk.
Potential measures considered for risk mitigation of the debris flow generally can be categorized into structural and non-structural approaches. The structural approach mainly decreases the hazard intensity (or failure probability), whereas the non-structural approach improves vulnerability (or the resilience capacity) of elements at risk. Structural measures comprise two aspects: 1) Reducing the probability of the debris flow occurrence. This can be achieved by reducing the amount of sediment source to relieve the occurrence of debris flows. 2) Reducing the probability of the debris flow reaching the elements at risk. Considering the aforementioned two aspects , structural measures may include constructing blocking dams in the upper or middle stream, drainage channel in the lower stream, and fence walls at the back of houses.
Non-structural measures include the following options: 1) Implementation of early warning systems, which involves professional monitoring, real-time warning, and a public broadcasting system. These measures can help residents to timely evacuate from dangerous places, thus decreasing the spatial-temporal probability of elements at risk. 2) Community-based public education can improve disaster awareness and the response ability of people to reduce vulnerability of the elements at risk. 3) Relocation of residents in new settlements can reduce the number of the elements at risk.
In this study, considering the available information before the debris flow occurrence and the potential space that can be used for structures, building blocking dams in the mainstream of the channel is a suitable structural measure. For the non-structural measures, early warning systems, community-based public education, and resident relocation are feasible.
Hence, four single categories of measures were selected for the risk mitigation of the Chengbei Gully debris flow. Moreover, community-based public education, which is a non-engineering measure, is often implemented together with engineering measures or early warning systems. Therefore, the two measures, namely, community-based public education + early warning system and community-based public education + dam were also included.
A detailed design on these measures is described in the section below.
Two dams were designed to block the debris flow and were located in the middle and downstream of the channel. The total volume of solid materials carried by the debris flow was used to calculate the standard storage capacity of the dam. The relationship between the volume of the solid materials and total materials of the debris flow was determined as follows (China Ministry of Land and Resources (CMLR), 2004; China Ministry of Land and Resources (CMLR), 2006):
where QS is the total volume of solid materials, Q is the volume of all materials, γc is the unit weight of the debris flow, γS is the unit weight of solid materials, and γw is the unit weight of water. Q can be obtained as follows:
where T is the continual time of the debris flow, and K is an empirical coefficient which is proposed as 0.202 in the guidebook. Qc is the peak quantity discharge of the debris flow and is expressed by
where φ is the amendment coefficient for the unit weight of the debris flow, Qp is the peak quantity of the water flow with a given return period, and Dc is the blockage coefficient of the debris flow which is set to 1.5. φ is calculated as follows:
Geometrical characteristics of the dams designed based on Eqs 8–10 are presented in Figure 8. The lengths of dam 1# and dam 2# were 25 and 45 m, respectively. The dam type was selected as the rubble gravity dam, owing to the low cost and easily acquired materials.
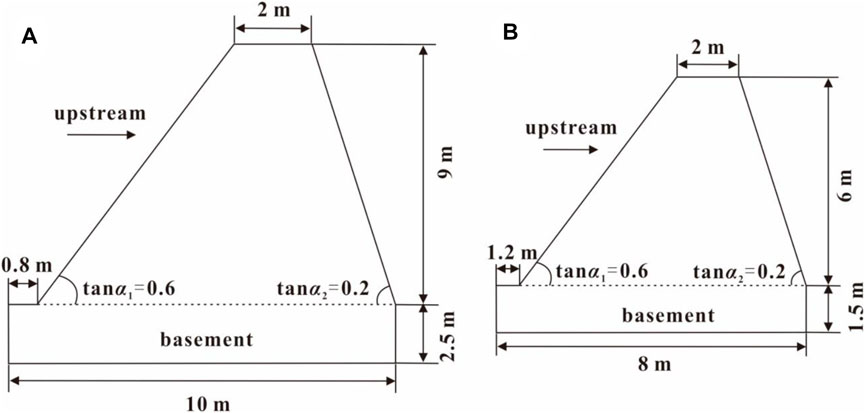
FIGURE 8. Design of cross section of the dams for blocking the debris flow: (A) dam 1# located in the upper stream and (B) dam 2# located in the middle stream.
The main components in the early warning system include the following: 1) Monitoring of rainfall. Three rain gauges were installed in the channel, two in branches upstream, and one downstream. The gauges provide an alert in case of heavy rainfall exceeding the given threshold (Wei et al., 2017). 2) Monitoring of infrasonic signals. Low-frequency infrasonic waves emitted by movement of the debris flow can be detected over a kilometer radius (Liu et al., 2015). Hence, installation of a monitoring device in the upper stream can be used for remote monitoring. 3) Monitoring of maximum depth. A set of wires stretched and fixed across the channel can continuously measure the distance between the detector and the flow surface. If the maximum depth of the debris flow increases to a detectable level, then the alert is made. 4) Video monitoring. Three cameras were installed in the upper, middle, and lower stream separately to record and monitor the movement of flows 24 h per day.
This measure has been validated and is effective in some natural hazard-prone areas of China (Liu et al., 2016; Guo et al., 2019; Guo et al., 2020). Hence, it was also considered alone in this study. This measure mainly includes 1) posters which present and advertise the benefit of risk mitigation, 2) brochures for residents, 3) classes on disaster prevention to young students in school, and 4) professional lectures to adults given by experts in this field.
This measure involves relocation of residents from the inundation area of the debris flow. The local authority is responsible for the relocation and construction of new settlements. The new settlement area should accommodate the relocated families as per the principle of average distribution (Guo et al., 2020).
Specific implementation and locations of all potential measures are shown in Figure 9.
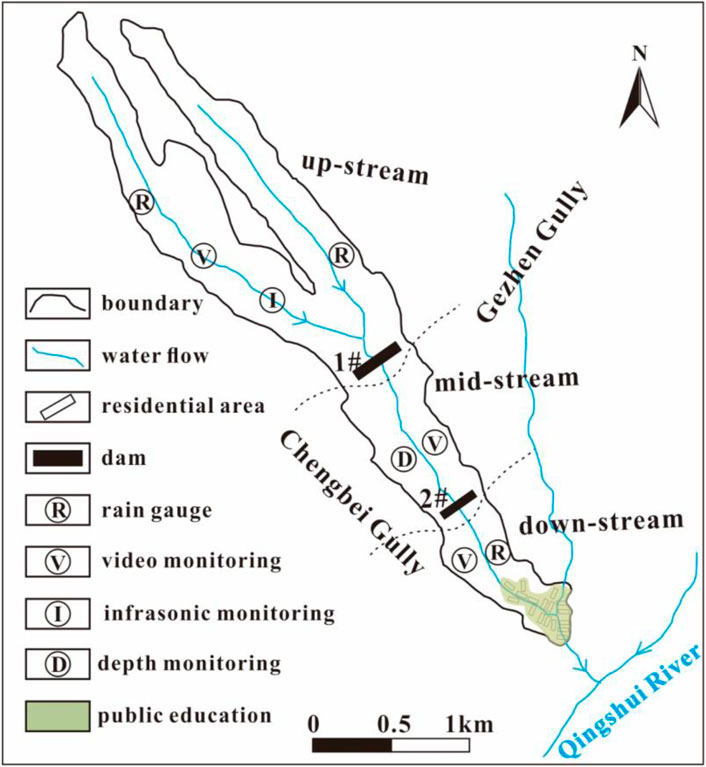
FIGURE 9. Implementation of potential risk mitigation measures for the Chengbei debris flow.
The total cost of each measure (TC1) must be evaluated in the first step as shown below:
where T1, T2, and Tn represent the total cost of the 1st, 2nd, and nth item, respectively. P1, P2, and Pn represent the unit price of the 1st, 2nd, and nth item, respectively, whereas N1, N2, and Nn represent the number needed for the 1st, 2nd, and nth item, respectively. All prices are estimated according to the price level as of 2015∼2020 in Shanxi province (National Bureau of Statistics of China, 2020). All the items and their unit prices included in every measure are presented in Table 3.
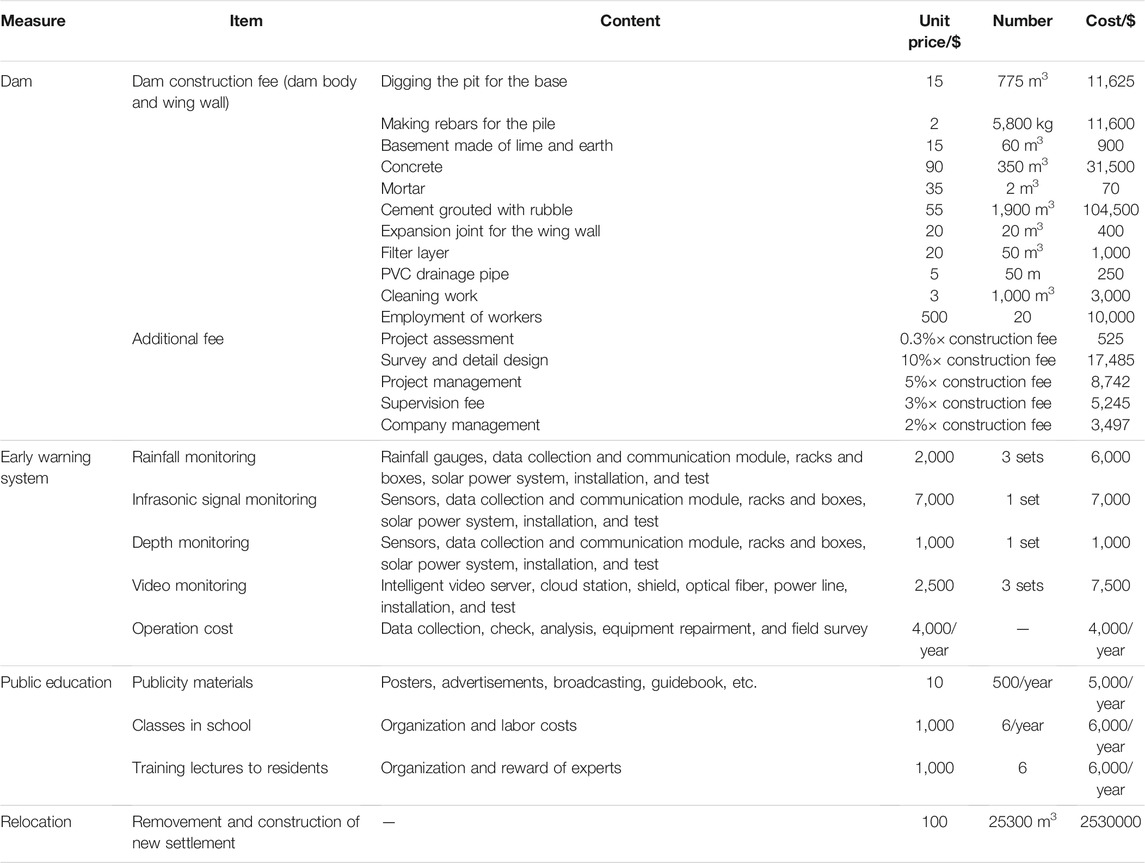
TABLE 3. Estimation for the total cost of risk mitigation measures.
Although most of these costs are paid for at present, a few items will be acquired in the future (e.g., operation cost of the early warning system and public education); therefore, it is necessary to convert them into present economic values (TPC) as following:
where C1, C2, … Cn are the single-year cost for future 1, 2, … , n years, n is the life cycle of the measure, and i is the annual interest rate. Hence, the total present economic cost (TC) for a specific measure can be denoted as follows:
Effectiveness of measures is a crucial decision-making index because it can help determine the measures that reduce the risk at the largest level at a relatively small cost. Reduced total risk achieved by mitigation measures can be considered beneficial since effectiveness of the measure is expressed as the benefit–cost ratio (Fuchs et al., 2007; Jaiswal and van Westen, 2013). A higher ratio indicates a more effective measure.
The structural measures have a life cycle, and their discounting is applied to convert the future benefit to present economic values. Therefore, different effectiveness of measures can be compared. The total present value of the benefit of a specific measure (TB) can be calculated as follows (Chen and Wu, 2016):
where B1, B2, … Bn are the single-year benefit for future 1, 2, … , n years, n is the life cycle of the measure, and i is the annual interest rate. Hence, the effectiveness of the measure (Ef) is denoted as following:
Simulation results obtained from FLO-2D, including the flow depth and flow velocity maps, are shown in Figure 10. The results showed that the area inundated by the debris flow under the rainfall condition in this study was approximately 1.6 × 10⁵ m2. The area with the flow depth less than 1 m accounted for 40% of the inundation area, with the area of depth from 1 to 3 m accounting for 48%, and the area of depth more than 3 m accounted for only 12% of the area inundated by the debris flow. Two places with relatively large flow depths were identified. The first place was at the boundary between middle and down streams with 6.73 m as the maximum flow depth. This area was characterized by a wider and gentler valley which provided a favorable terrain for the deposition. The second place was at the mouth of the gulley with a flow depth of exceeding 4 m. Moreover, an accumulated alluvial fan took this place as the center covering an area of 4 × 10⁴ m2. Analysis of the flow velocity showed that its distribution presented a similar characteristic to the flow depth. As a whole, the middle of the channel had larger velocities than that of its edge whereas the overall velocity in the upstream and middle stream was higher than the velocity downstream. This finding was associated with the terrain. For instance, the gully channel was narrow and relatively steep in the upper part but wider at the lower part. The average flow velocity of the whole gully was approximately 1.2 m/s, whereas the maximum velocity was approximately 4.0 m/s and was close to the boundary of middle and down streams. The hazard map (Figure 10C) of the debris flow was obtained based on the criteria outlined in Figure 6. High-level hazard areas were mostly located in the middle of the channel in the upstream and middle stream. Moreover, the mouth of the gully was another important high-level hazard area. Areas of high, moderate, and low hazard levels accounted for 30, 40,, and 30% of the total area, respectively.
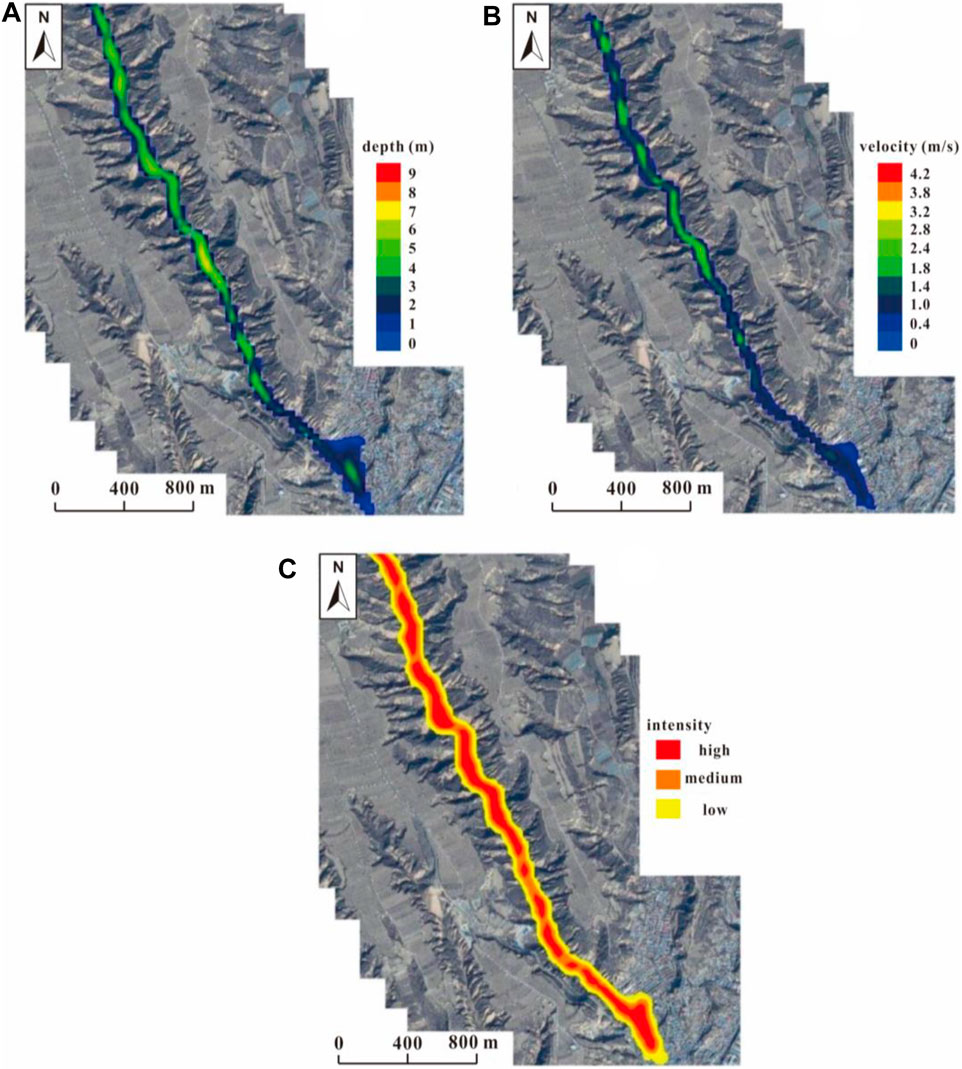
FIGURE 10. Hazard map of the Chengbei Gully debris flow: (A) flow depth map and (B) flow velocity map calculated from FLO-2D and (C) hazard intensity map.
It should be noted that there may be a certain relationship between the flow depth and velocity, but it should depend on the actual terrain that the debris flow occurs (Shu et al., 2018). In this study, the overall distribution of the flow depth and velocity in the channel is similar, but some specific characteristics vary. For instance, at the bottom of the gully, the depth in the middle of the channel is larger than surrounding places, but the velocity values of these places do not have much difference. Additionally, the upper section of the channel has continuous relative large depths while the velocity of this part has values with different levels.
Settlement of residents was distributed on the lower part of the gully; thus, the current study only described the vulnerability of this area (Figure 11). Previous studies (Fuchs et al., 2007; Jakob et al., 2012; Mavrouli et al., 2014) mainly expressed vulnerability as a function of either flow velocity or deposit depth. However, vulnerability significantly increases at a deposit thickness over 2 m or the velocity above 4 m/s. The vulnerability value of a property in the high-vulnerability area was set as 0.9, whereas the values for middle- and low-vulnerability areas were 0.6 and 0.1, respectively, based on the processes of hazard zonation. The findings on the vulnerability of people showed that most of the people in the settlements were adults between 40 and 60 years (the middle level on physical function). In addition, some aspects which can reduce vulnerability were lacking, such as implementation of early warning systems, training on emergency responses, and public education. Hence, the vulnerability for the people in the area with a high-level hazard was set to 0.6, whereas the vulnerability for the other two areas was set to 0.3 and 0.1, respectively. Vulnerability of the current study was slightly higher than those reported by Fuchs et al. (2007) and Guo et al. (2020); however, it was lower than the value reported by Solari et al. (2020). Analysis of the distribution of the elements at risk showed that the total area of settlements in high-, medium-, and low-hazard intensities was 3,775 m2, 10,460 m2, and 11,070 m2, respectively. The total number of residents living in the three areas was 24 (high-hazard intensity), 45 (middle-hazard intensity), and 60 (low-hazard intensity), respectively.
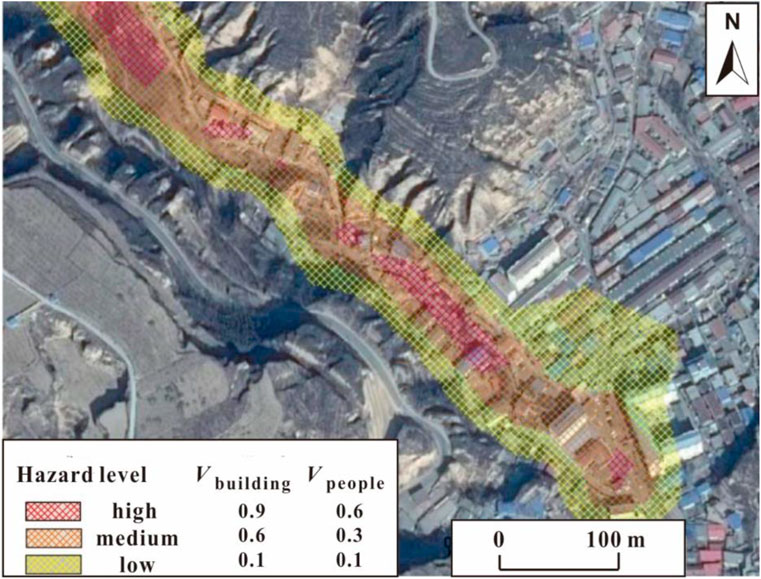
FIGURE 11. A map showing the vulnerability of the elements at risk located at the lower part of the gully. Vbuilding: vulnerability of buildings; Vpeople: vulnerability of people.
The rainfall data in the study area are shown in Figure 12. The results showed that the triggering rainfall of the Chengbei Gully debris flow had a return period of 80 years; thus, the temporal probability of the debris flow was 0.0125. The total risk of the Chengbei Gully debris flow (Table 4) was obtained according to Eq. 4. The total economic risk for the property and population was 8.9 × 10⁴ $ and 1.4 × 10⁵ $, respectively. Analysis of spatial distribution showed that the risk distribution was similar to that of the hazard distribution. This is because the elements at risk with the same hazard intensity were assigned the same vulnerability values. Although the middle-hazard intensity area had the largest total property risk, the average risk for each house was medium due to a larger total area of elements at risk. Notably, some areas with a high hazard had low-risk levels owing to very few elements at risk located mainly at the boundary between middle and downstreams. Hazard and risk levels at the mouth of the gully were high because it was close to the community settlements.
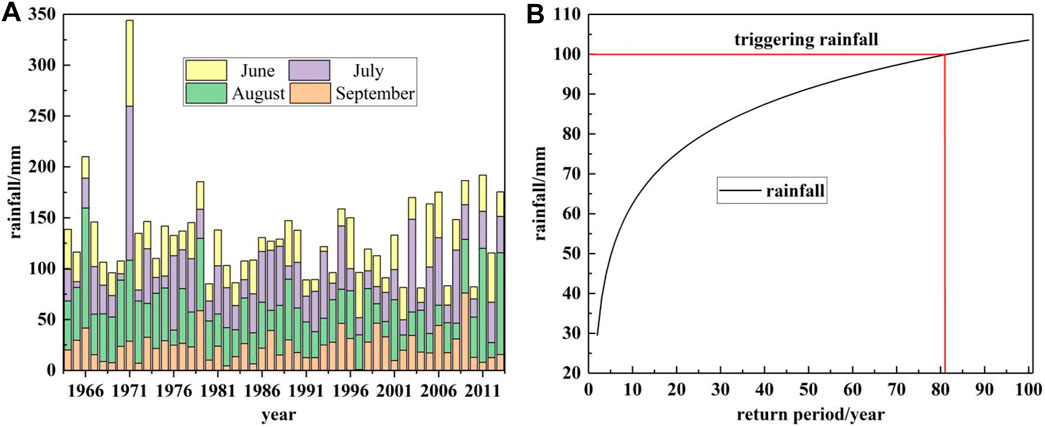
FIGURE 12. Return period of the triggering rainfall event: (A) daily rainfall peaks in every rainy season from 1964 to 2013 and (B) rainfall values vs. the return period of the study area.
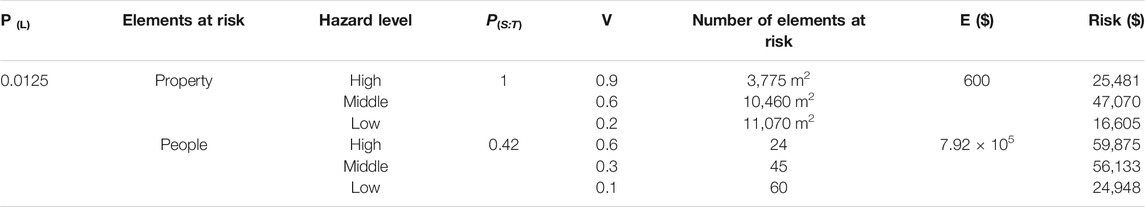
TABLE 4. Calculation of risk for the Chengbei Gully debris flow.
The risk levels in the areas with three hazard intensities (low, moderate, and high) were then calculated according to Eq. 4. If 5% of the total population was considered as the number of fatalities (Petley, 2012; Guo et al., 2020), the corresponding frequency was calculated as historical data on the number of fatalities caused by the debris flow were not available. As seen in Figure 13, the risk levels of all three areas were unacceptable when evaluated by the risk tolerance criteria, thus indicating the risk mitigation measures must be considered and implemented to reduce the total risk of the Chengbei Gully.
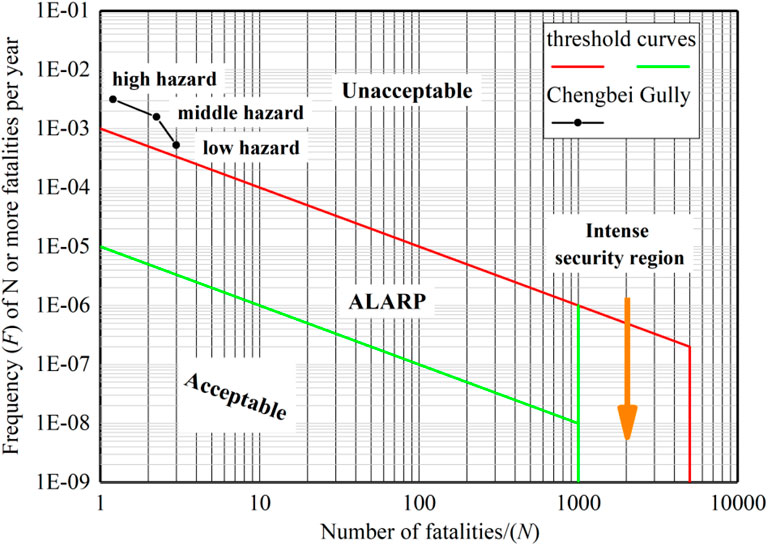
FIGURE 13. Calculation of the risk level for the Chengbei Gully debris flow using the risk tolerance criteria.
Analysis of the cost measure showed that the cost on dam construction and the overall relocation were incurred only once whereas other measures (early warning system and public education) comprised the future investment. The life cycle of public education was approximately 5 years (Chen et al., 2010). The life cycle of the early warning system was estimated to 20 years owing to its association with the service life of the piece of equipment. The annual interest rate i ranges from 0 to 0.12 (Staats, 1969) and was estimated as 0.05 for the Chengbei Gully. This value was higher than the value reported in Europe (e.g., i = 0.016 in Ferlisi et al., 2021) and slightly smaller than the value used in Taiwan, China (e.g., i = 0.06 in Chen and Wu, 2016).
The single-year benefit (B in Eq. 14) can be estimated by the annual benefit rate. The annual benefit rate of each measure was determined by the semi-quantitative estimation method. Previous studies (e.g., 40% in Salbego, 2014; 30% in Salbego et al., 2015; 40% in Guo et al., 2020) report that the benefit of structural measures accounts for approximately 30∼40% of the total cost; thus, the annual benefit rate of the dam construction was determined as 30%. The early warning system and public education are under the scope of community-based disaster reduction, so both were considered to have similar effectiveness for risk mitigation. China began implementing these two measures from 2005. Based on the saved lives by these measures and number of deaths caused by geohazards since 2005, the annual benefit rate of these measures has been estimated as 2% (Guo et al., 2020). Because the life cycle of the early warning system was designed as 20 years, its annual benefit rate from the 21st year was set as 1%. Relocation removes the elements at risk from the submerged area of the debris flow, thus eliminating the risk (the benefit rate is 100%).
Therefore, the effectiveness of each measure can be obtained, as shown in Table 5, according to Eqs 11–15, Table 2, and Table 3. Analysis of the four single measures showed that the total cost ranged from 7.37 × 10⁴ $ to 2.53 × 10⁶ $. Relocation had the largest budget, followed by construction of the dam, the early warning system, and public education. Regarding the total benefit, relocation is the highest, higher than dam + public education, followed by the dam. The other measures have lower benefits than these three measures. Analysis of the effectiveness showed that the benefit–cost ratios of all measures were greater than 1. The total benefit was higher than the total cost, thus indicating that all these measures were cost-effective. Specifically, the dam construction had the best effectiveness with the benefit–cost ratio of 6.43, followed by dam + public education (the benefit–cost ratio was 5.07). The benefit–cost ratio of these two measures was evidently higher than the other measures. The relocation had the highest total cost and total benefit at the same time, so its effectiveness was not outstanding. To sum up all the aspects, the dam and dam + public education had good benefits (ranking second and third, respectively) and the highest benefit–cost ratio. Hence, these two measures can be the best options for risk reduction in this study.
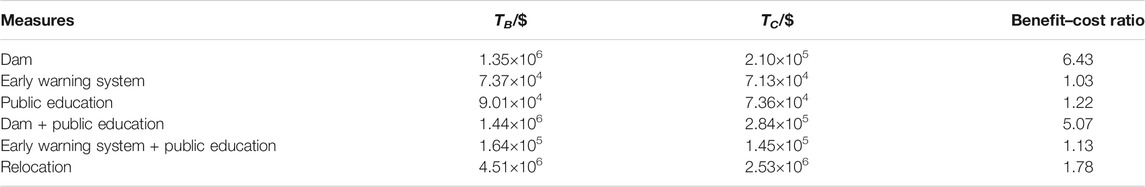
TABLE 5. Effectiveness analysis of the designed measures for Chengbei Gully risk reduction.
Definition of the debris flow intensity is rather controversial owing to the several factors that have to be considered. However, sufficient data are not available in the case of the Chengbei Gully. Flow velocity is perhaps an appropriate choice because it can significantly represent the impact forces caused by debris flows. The flow depth was also considered in the current study in addition to flow velocity. Hence, the three-degree intensity matrix was defined by combining these two indicators. Given that there is no agreement on this topic, we determined the thresholds between every two degrees according to the literature data, characteristics of elements at risk, and our experiences obtained from the mountainous areas of China. The final intensity matrix was similar to matrices used in engineering practices of other mountainous areas in China and can be considered for comparison with other criteria developed in other countries (e.g., Hürlimann et al., 2006). However, the intensity matrix should be combined with the probability of occurrence to obtain the final hazard matrix. In the current study, the triggering condition has been fixed, and the probability of occurrence for the debris flow is 1 under this condition. The matrix can be replicated in other debris flow catchments, owing to its simplicity and relatively low time cost of the intensity matrix. Furthermore, the thresholds in the matrix can be changed to adapt to new situations.
Flow velocity and flow depth within a specific point were determined using the FLO-2D algorithm, which could also simulate initiation of the debris flow and identify the inundation areas. This enables analysis of the risk in these areas. However, simulation depends significantly on the quality of input data. In this study, the digital terrain model used the data with a high spatial resolution obtained from airborne LiDAR whereas rheological parameters were mainly obtained from the FLO-2D manual. Hence, inaccuracies of results would be mainly attributed to uncertainties of the rheological parameters owing to lack of the parameter calibration. However, according to Table 1, the potential range of parameters can be roughly determined from the laboratory tests and the literature, which can be used to ensure that the structural countermeasure would work as planned. On the other hand, the robustness of the mitigation measure with respect to the uncertainty linked with the debris flow rheology can be estimated from the parameter range. Although the estimation for the robustness is not quantitative, it can provide an insight for the reliability of the measures.
Additionally, poor validation of the FLO-2D model was a limitation of this study because calculation of flow velocity and flow depth was the basis for assessing debris flow risk. Although some examinations on the morphological aspect in the field after the event revealed some similarities between actual and simulation values, it does not effectively prove the model accuracy. However, it has been clarified in the literature that uncertainties introduced by the topography may be much larger than uncertainties in other information (e.g., Luppichini et al., 2019). The uncertainty level from the modeling process is, thus, acceptable in this analysis. Notably, the past event can provide useful data and experience for future studies in the parameter calibration and accuracy validation, which will benefit the risk prediction of a given scenario (Cai et al., 2021).
Uncertainty analysis is an important issue in quantitative risk estimation, given its inherent existence in every input factor (components). A preliminary analysis on uncertainties in this study included the uncertainty level, the reason for uncertainties, and potential measures to improve the issue (Table 6). The highest uncertainty in the procedure exists in the vulnerability estimation, as reported in many previous studies (e.g., Jaiswal and van Westen, 2013; Guo et al., 2020). A semi-quantitative model was used to analyze the resistance of elements at risk against the disaster which was close to an empirical method because a high subjectivity was included. A potential solution for this issue is to develop physical models based on vulnerability curves. Some efforts have been made on this topic (e.g., Peduto et al., 2017), but most of them are with regard to vulnerability of constructions and should be validated by a series of laboratory tests. Other studies performed vulnerability calculation using various indicators such as the structure type, foundation depth, and maintenance condition. However, this type of model requires detailed field survey and sufficient information on elements at risk. A high uncertainty level on the risk results implies that risk mapping should be treated as a relative result and not absolute. Similarly, in this study, the results are not refuted but highlighted the importance of uncertainty analysis. As Bell and Glade (2004) reported, although some improvements can be performed, uncertainty in risk analyses will always occur. Therefore, honestly informing the user of the associated limitations is important, instead of ignoring them. The present procedure provides a relatively simple approach to handle risk assessment, especially in the case of insufficient data. This modified procedure presents a relative risk level of elements at risk to users and the local authorities. Furthermore, resultant mapping is a fundamental task for economic evaluation for all potential measures of risk mitigation. The main objective of the current study was to compare and determine risk mitigation measures; thus, this present procedure of risk assessment is appropriate from the economic viewpoint.
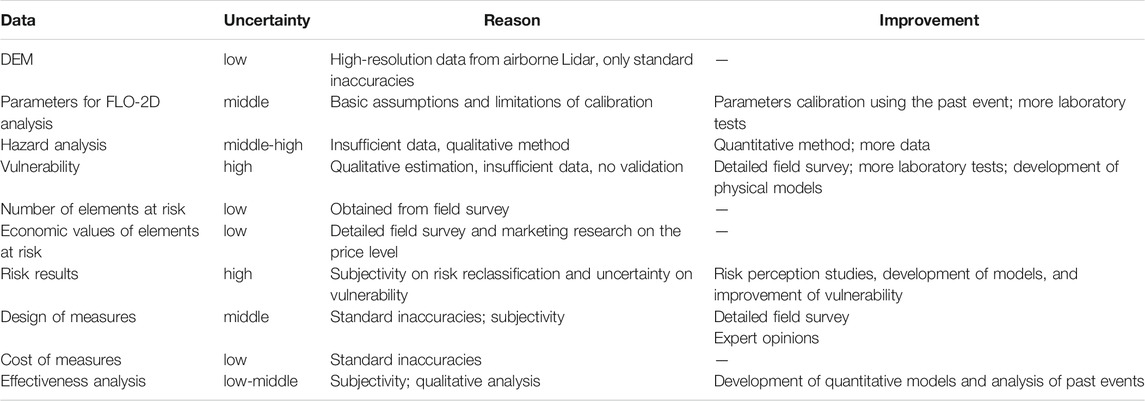
TABLE 6. Uncertainty analysis for input data.
Uncertainty also exists in the analysis of the risk reduction measures. For example, the dam was set to intercept all the solid material; however, the total solid material is hard to be accurately determined. Besides, if the dam was used to decline the peak discharge once the flow would not threat citizens in the downstream, the dam could be much lower, and the cost could also decrease. However, it should be noted that this kind of uncertainty is related with engineering practices, which is acceptable for users. Moreover, the cost and benefit will change with the dam design at the same time, so the final effectiveness will not be affected much.
The variation of risk values of a debris flow risk map within a given area under a particular rainfall condition is influenced by intensity, spatial probability reaching a specific point, vulnerability of elements at risk, and temporal probability. The findings from the current study indicate that if mitigation measures are not considered from the beginning, the risks posed by the debris flow to the constructions and lives may be significantly high. Notably, the risk of the Chengbei Gully debris flow was at an unacceptable level, as shown by the tolerance criteria. Risk mitigation measures can, thus, be implemented through reduction of the values of the aforementioned four aspects. In the current study, potential measures were mainly taken based on three components in the risk, namely, temporal and spatial probability of the debris flow reaching a specific point and vulnerability of elements at risk. The subsequent analysis showed effectiveness of these measures; Here, the proposed measures decreased the risk by 1/3 of its original risk. Although the absolute value of the risk reduction was not ascertained, the risk posed by the investigated event was significantly decreased. The findings imply that elements at risk can be well protected. The aforementioned results showed that it is difficult to eliminate the risk, but mitigation measures can reduce the unacceptable risk to an acceptable level to avoid significant losses. However, local authorities must be aware that new risks still may be caused by future extreme scenarios; therefore, continuous and systematic solutions must be included in the long-term plan of risk management and control.
Overall, the risk assessment of the debris flow is a multidisciplinary procedure where quantitative analysis and qualitative analysis inherently coexist (Glade, 2005; Hürlimann et al., 2006). However, the focus of this study is on the global understanding of the present approach and the experiences acquired during the case of the Chengbei Gully debris flow. Hence, the abovementioned exhaustive discussion already presented the uncertainties in this study and can help readers to better understand the rigor of the article.
In this study, numerical modeling based on FLO-2D software and the semi-quantitative vulnerability estimation was performed to assess the debris flow risk in the Chengbei Gully of central China. Remote sensing and in situ field data were used to derive a high-resolution DEM and to obtain parameters for FLO-2D modeling. Key indicators during the movement process including the runout distance, flow velocity, and flow depth were simulated to determine the hazard map based on the debris flow event in July 2013 in this region. The findings showed that the rainfall event triggering the Chengbei Gully debris flow had a return period of 80 years. Under this rainfall condition, the total risk of the Chengbei Gully debris flow was 2.3 × 10⁵ $. Notably, the risk level of the lower part of the gully was the highest due to the existing community settlement. The risk level in the study area was unacceptable since the risk level obtained from the risk tolerance criterion method was greater than the standard curve.
Four single mitigation measures and two mixed measures were considered and designed for risk reduction, including construction of the masonry gravity dam, implementation of the early warning system, community-based public education, and overall relocation of the residents. Cost-benefit analysis for these measures showed that the economic benefits varied from 7.37 × 10⁴ to 4.51 × 10⁶ $, whereas the benefit–cost ratio varied from 1.03 to 6.43. Benefit–cost ratios of all measures were above 1, implying that the current measures had larger benefits than the costs and were cost-effective. Although the total cost of the dam construction was not the smallest, it had the greatest economic benefit–cost ratio; thus, it was a better choice for risk reduction of the Chengbei Gully.
In summary, the present study indicates that effectiveness analysis for the risk mitigation measures should evaluate the absolute value of benefit or risk reduction and should also focus on the benefit–cost ratio obtained. In addition, it is difficult to eliminate the risk from debris flow events completely if the mitigation measures are not designed and performed on time. Therefore, measures to control the total risk to an acceptable level are important. The present modeling procedure allows users to implement the quantitative risk assessment during a short time as a basis for analysis of potential mitigation measures and economic decision. The quantity and quality of datasets in this study are at the normal level; thus, the entire process can be easily replicated and applied in other areas with similar settings. However, the uncertainty level of the obtained risk results may be significant, especially the estimation of vulnerability and damage.
The raw data supporting the conclusion of this article will be made available by the authors, without undue reservation.
YT was responsible for data curation, methodology, software, and writing of the original draft. ZG contributed to the conceptualization, methodology, supervision, and writing of the original draft. LW carried out the methodology, software, visualization, and validation. BH assisted with software, visualization, and reviewing and editing of the manuscript. WF helped with the visualization and supervision. XS carried out the methodology and reviewing and editing of the manuscript. ZL was responsible for methodology and software. YZ helped with reviewing and editing of the manuscript.
This research was financed by the China Geological Survey project “Geo-hazards investigation in Hequ-Hancheng zone in JinShan loess plateau” (No. DD20190642) and the China Shaanxi Province key research program (No. 2019ZDLSF07-07-02).
Author LW was employed by the company Shanxi Province Communications Planning Surveying and Designing Institute Co., Ltd.
The remaining authors declare that the research was conducted in the absence of any commercial or financial relationships that could be construed as a potential conflict of interest.
All claims expressed in this article are solely those of the authors and do not necessarily represent those of their affiliated organizations, or those of the publisher, the editors, and the reviewers. Any product that may be evaluated in this article, or claim that may be made by its manufacturer, is not guaranteed or endorsed by the publisher.
Abe, K., and Konagai, K. (2016). Numerical Simulation for Runout Process of Debris Flow Using Depth-Averaged Material point Method. Soils and Foundations 56 (5), 869–888. doi:10.1016/j.sandf.2016.08.011
AGS (2007). Practice Note Guidelines for Landslide Risk Management 2007. Aust. Geomech. 42 (1), 64–114.
Arksey, R., and VanDine, D. (2008). Example of a Debris-Flow Risk Analysis from Vancouver Island, British Columbia, Canada. Landslides 5, 121–126. doi:10.1007/s10346-007-0105-0
Baum, R. L., and Godt, J. W. (2010). Early Warning of Rainfall-Induced Shallow Landslides and Debris Flows in the USA. Landslides 7 (3), 259–272. doi:10.1007/s10346-009-0177-0
Bell, R., and Glade, T. (2004). Quantitative Risk Analysis for Landslides ‒ Examples from Bíldudalur, NW-Iceland. Nat. Hazards Earth Syst. Sci. 4 (1), 117–131. doi:10.5194/nhess-4-117-2004
Bertolo, P., and Wieczorek, G. F. (2005). Calibration of Numerical Models for Small Debris Flows in Yosemite Valley, California, USA. Nat. Hazards Earth Syst. Sci. 5, 993–1001. doi:10.5194/nhess-5-993-2005
Bottelberghs, P. H. (2000). Risk Analysis and Safety Policy Developments in the Netherlands. J. Hazard. Mater. 71 (1-3), 59–84. doi:10.1016/S0304-3894(99)00072-2
Brater, E. F., and King, H. W. (1976). Handbook of Hydraulics for the Solution of Hydraulic Engineering Problems. New York: McGraw Hill Book Company.
Budetta, P. (2002). Risk Assessment from Debris Flows in Pyroclastic Deposits along a Motorway, Italy. Bull. Eng. Geology. Environ. 61, 293–301. doi:10.1007/s10064-002-0161-6
Calvo, B., and Savi, F. (2009). A Real-World Application of Monte Carlo Procedure for Debris Flow Risk Assessment. Comput. Geosciences 35 (5), 967–977. doi:10.1016/j.cageo.2008.04.002
Chen, L., van Westen, C. J., Hussin, H., Ciurean, R. L., Turkington, T., Chavarro-Rincon, D., et al. (2016). Integrating Expert Opinion with Modelling for Quantitative Multi-hazard Risk Assessment in the Eastern Italian Alps. Geomorphology 273, 150–167. doi:10.1016/j.geomorph.2016.07.041
Chen, S.-C., and Wu, C.-Y. (2016). Annual Landslide Risk and Effectiveness of Risk Reduction Measures in Shihmen Watershed, Taiwan. Landslides 13, 551–563. doi:10.1007/s10346-015-0588-z
Chen, S. C., Wu, C. Y., and Huang, B. T. (2010). The Efficiency of a Risk Reduction Program for Debris-Flow Disasters - a Case Study of the Songhe Community in Taiwan. Nat. Hazards Earth Syst. Sci. 10, 1591–1603. doi:10.5194/nhess-10-1591-2010
China Ministry of Land and Resources (CMLR) (2004). DZ/T0239-2004 Design Specifications for Debris Flow Prevention and Control Engineering. Beijing: Geological Publishing House.
China Ministry of Land and Resources (CMLR) (2006). DZT0220-2006 Investigation Specifications of Debris Flow Disaster Prevention and Control Engineering. Beijing: Geological Publishing House.
Corominas, J., and Moya, J. (2010). Contribution of Dendrochronology to the Determination of Magnitude-Frequency Relationships for Landslides. Geomorphology 124, 137–149. doi:10.1016/j.geomorph.2010.09.001
Corominas, J., van WestenFrattini, C. P., Frattini, P., Cascini, L., Malet, J.-P., Fotopoulou, S., et al. (2014). Recommendations for the Quantitative Analysis of Landslide Risk. Bull. Eng. Geol. Environ. 73, 209–263. doi:10.1007/s10064-013-0538-8
Cui, P., Hu, K., Zhuang, J., Yang, Y., and Zhang, J. (2011). Prediction of Debris-Flow Danger Area by Combining Hydrological and Inundation Simulation Methods. J. Mt. Sci. 8, 1–9. doi:10.1007/s11629-011-2040-8
Dai, C., Li, W., Wang, D., Lu, H., Xu, Q., and Jian, J. (2021). Active Landslide Detection Based on Sentinel-1 Data and InSAR Technology in Zhouqu County, Gansu Province, Northwest China. J. Earth Sci. 32 (5), 1092–1103. doi:10.1007/s12583-020-1380-0
Dai, F. C., Lee, C. F., and Ngai, Y. Y. (2002). Landslide Risk Assessment and Management: an Overview. Eng. Geology. 64, 65–87. doi:10.1016/S0013-7952(01)00093-X
De Graff, J. V. (2014). Improvement in Quantifying Debris Flow Risk for post-wildfire Emergency Response. Geoenviron Disasters 1, 5. doi:10.1186/s40677-014-0005-2
Du, J., Yin, K., Wang, Y., and Wu, Y. (2016). “Quantitative Vulnerability Evaluation of Individual Landslide: Application to the Zhaoshuling Landslide, Three Gorges Reservoir, China,” in Proceeding of 12th International Symposium on landslides, Napoli, Italy, June 12th-19th, 2016. doi:10.1201/b21520-100
Erener, A., and Düzgün, H. B. S. (2013). A Regional Scale Quantitative Risk Assessment for Landslides: Case of Kumluca Watershed in Bartin, Turkey. Landslides 10, 55–73. doi:10.1007/s10346-012-0317-9
Fell, R., Corominas, J., Bonnard, C., Cascini, L., Leroi, E., and Savage, W. Z. (2008). Guidelines for Landslide Susceptibility, hazard and Risk Zoning for Land-Use Planning. Eng. Geology. 102 (3-4), 99–111. doi:10.1016/j.enggeo.2008.03.014
Ferlisi, S., Marchese, A., and Peduto, D. (2021). Quantitative Analysis of the Risk to Road Networks Exposed to Slow-Moving Landslides: a Case Study in the Campania Region (Southern Italy). Landslides 18, 303–319. doi:10.1007/s10346-020-01482-8
Fuchs, S., Heiss, K., and Hübl, J. (2007). Towards an Empirical Vulnerability Function for Use in Debris Flow Risk Assessment. Nat. Hazards Earth Syst. Sci. 7, 495–506. doi:10.5194/nhess-7-495-2007
Fuchs, S., Kuhlicke, C., and Meyer, V. (2011). Editorial for the Special Issue: Vulnerability to Natural Hazards-The challenge of Integration. Nat. Hazards. 58, 609–619. doi:10.1007/s11069-011-9825-5
Gan, J., and X. Zhang, Y. (2019). Numerical Simulation of Debris Flow Runout Using Ramms: A Case Study of Luzhuang Gully in China. Comput. Model. Eng. Sci. 121 (3), 981–1009. doi:10.32604/cmes.2019.07337
Geotechnical Engineering Office (1998). Landslides and boulder Falls from Natural Terrain: Interim Risk Guidelines. GEO Report No.75. Geotechnical Engineering Office, The government of the Hong Kong Special Administrative Region.
Glade, T. (2005). Linking Debris-Flow hazard Assessments with Geomorphology. Geomorphology 66, 189–213. doi:10.1016/j.geomorph.2004.09.023
Gomes, R., Guimarães, R., de Carvalho, Júnior, O., Fernandes, N., and do Amaral Júnior, E. (2013). Combining Spatial Models for Shallow Landslides and Debris-Flows Prediction. Remote Sensing 5 (5), 2219–2237. doi:10.3390/rs5052219
Gregoretti, C., Degetto, M., Bernard, M., Crucil, G., Pimazzoni, A., De Vido, G., et al. (2016). Runoff of Small Rocky Headwater Catchments: Field Observations and Hydrological Modeling. Water Resour. Res. 52 (10), 8138–8158. doi:10.1002/2016WR018675
Gregoretti, C., and Fontana, G. D. (2008). The Triggering of Debris Flow Due to Channel-Bed Failure in Some alpine Headwater Basins of the Dolomites: Analyses of Critical Runoff. Hydrol. Process. 22 (13), 2248–2263. doi:10.1002/hyp.6821
Gumbel, E. J. (1941). Probability-interpretation of the Observed Return-Periods of Floods. Trans. AGU 22 (3), 836–850. doi:10.1029/TR022i003p00836
Guo, Z., Chen, L., Yin, K., Shrestha, D. P., and Zhang, L. (2020). Quantitative Risk Assessment of Slow-Moving Landslides from the Viewpoint of Decision-Making: A Case Study of the Three Gorges Reservoir in China. Eng. Geology. 273, 105667. doi:10.1016/j.enggeo.2020.105667
Guo, Z., Yin, K., Gui, L., Liu, Q., Huang, F., and Wang, T. (2019). Regional Rainfall Warning System for Landslides with Creep Deformation in Three Gorges Using a Statistical Black Box Model. Sci. Rep. 9, 8962. doi:10.1038/s41598-019-45403-9
Guzzetti, F. (2000). Landslide Fatalities and the Evaluation of Landslide Risk in Italy. Eng. Geology. 58 (2), 89–107. doi:10.1016/S0013-7952(00)00047-8
Guzzetti, F., Stark, C. P., and Salvati, P. (2005). Evaluation of Flood and Landslide Risk to the Population of Italy. Environ. Manage. 36, 15–36. doi:10.1007/s00267-003-0257-1
Haas, T. D., and Woerkom, T. V. (2016). Bed Scour by Debris Flows: Experimental Investigation of Effects of Debris‐flow Composition. Earth Surf. Process. Landforms 41, 1951–1966. doi:10.1002/esp.3963
Han, Z. B., Su, B., Li, Y., Wang, W., Wang, W., Huang, J., et al. (2019). Numerical Simulation of Debris-Flow Behavior Based on the SPH Method Incorporating the Herschel-Bulkley-Papanastasiou Rheology Model. Eng. Geology. 255, 26–36. doi:10.1016/j.enggeo.2019.04.013
Holcombe, E., Smith, S., Wright, E., and Anderson, M. G. (2012). An Integrated Approach for Evaluating the Effectiveness of Landslide Risk Reduction in Unplanned Communities in the Caribbean. Nat. Hazards. 61, 351–385. doi:10.1007/s11069-011-9920-7
Hungr, O., Leroueil, S., and Picarelli, L. (2014). The Varnes Classification of Landslide Types, an Update. Landslides 11, 167–194. doi:10.1007/s10346-013-0436-y
Hungr, O., McDougall, S., Wise, M., and Cullen, M. (2008). Magnitude-frequency Relationships of Debris Flows and Debris Avalanches in Relation to Slope Relief. Geomorphology 96 (3-4), 355–365. doi:10.1016/j.geomorph.2007.03.020
Hürlimann, M., Abancó, C., Moya, J., and Vilajosana, I. (2014). Results and Experiences Gathered at the Rebaixader Debris-Flow Monitoring Site, Central Pyrenees, Spain. Landslides 11 (6), 939–953. doi:10.1007/s10346-013-0452-y
Hürlimann, M., Copons, R., and Altimir, J. (2006). Detailed Debris Flow hazard Assessment in Andorra: A Multidisciplinary Approach. Geomorphology 78 (3-4), 359–372. doi:10.1016/j.geomorph.2006.02.003
Jaiswal, P., van Westen, C. J., and Jetten, V. (2011). Quantitative Estimation of Landslide Risk from Rapid Debris Slides on Natural Slopes in the Nilgiri hills, India. Nat. Hazards Earth Syst. Sci. 11, 1723–1743. doi:10.5194/nhess-11-1723-2011
Jaiswal, P., and Westen, C. J. (2013). Use of Quantitative Landslide hazard and Risk Information for Local Disaster Risk Reduction along a Transportation Corridor: a Case Study from Nilgiri District, India. Nat. Hazards. 65 (1), 887–913. doi:10.1007/s11069-012-0404-1
Jaiswal, P., Westen, C. J. v., and Jetten, V. (2010). Quantitative Assessment of Direct and Indirect Landslide Risk along Transportation Lines in Southern India. Nat. Hazards Earth Syst. Sci. 10, 1253–1267. doi:10.5194/nhess-10-1253-2010
Jakob, M. (2005). A Size Classification for Debris Flows. Eng. Geology. 79 (3-4), 151–161. doi:10.1016/j.enggeo.2005.01.006
Jakob, M., Stein, D., and Ulmi, M. (2012). Vulnerability of Buildings to Debris Flow Impactflow Impact. Nat. Hazards. 60, 241–261. doi:10.1007/s11069-011-0007-2
Juang, C. H., Dijkstra, T., Wasowski, J., and Meng, X. (2019). Loess Geohazards Research in China: Advances and Challenges for Mega Engineering Projects. Eng. Geology. 251, 1–10. doi:10.1016/j.enggeo.2019.01.019
Li, Q., Huang, D., Pei, S., Qiao, J., and Wang, M. (2021). Using Physical Model Experiments for Hazards Assessment of Rainfall-Induced Debris Landslides. J. Earth Sci. 32 (5), 1113–1128. doi:10.1007/s12583-020-1398-3
Li, Z., Nadim, F., Huang, H., Uzielli, M., and Lacasse, S. (2010). Quantitative Vulnerability Estimation for Scenario-Based Landslide Hazards. Landslides 7, 125–134. doi:10.1007/s10346-009-0190-3
Lin, J.-Y., Yang, M.-D., Lin, B.-R., and Lin, P.-S. (2011). Risk Assessment of Debris Flows in Songhe Stream, Taiwanflows in Songhe Stream, Taiwan. Eng. Geology. 123, 100–112. doi:10.1016/j.enggeo.2011.07.003
Liu, D.-l., Leng, X.-p., Wei, F.-q., Zhang, S.-j., and Hong, Y. (2015). Monitoring and Recognition of Debris Flow Infrasonic Signals. J. Mt. Sci. 12, 797–815. doi:10.1007/s11629-015-3471-4
Liu, J., Nakatani, K., and Mizuyama, T. (2013). Effect Assessment of Debris Flow Mitigation Works Based on Numerical Simulation by Using Kanako 2D. Landslides 10, 161–173. doi:10.1007/s10346-012-0316-x
Liu, Y., Yin, K., Chen, L., Wang, W., and Liu, Y. (2016). A Community-Based Disaster Risk Reduction System in Wanzhou, China. Int. J. Disaster Risk Reduction 19, 379–389. doi:10.1016/j.ijdrr.2016.09.009
Lo, C.-M., Feng, Z.-Y., and Chang, K.-T. (2018). Landslide hazard Zoning Based on Numerical Simulation and hazard Assessment. Geomatics, Nat. Hazards Risk 9 (1), 368–388. doi:10.1080/19475705.2018.1445662
Luppichini, M., Favalli, M., Isola, L., Nannipieri, L., Giannecchini, R., and Bini, M. (2019). Influence of Topographic Resolution and Accuracy on Hydraulic Channel Flow Simulations: Case Study of the Versilia River (Italy). Remote Sensing 11 (13), 1630. doi:10.3390/rs11131630
Matti, B., Dahlke, H. E., and Lyon, S. W. (2016). On the Variability of Cold Region Flooding. J. Hydrol. 534, 669–679. doi:10.1016/j.jhydrol.2016.01.055
Mavrouli, O., Fotopoulou, S., Pitilakis, K., Zuccaro, G., Corominas, J., Santo, A., et al. (2014). Vulnerability Assessment for Reinforced concrete Buildings Exposed to Landslides. Bull. Eng. Geol. Environ. 73, 265–289. doi:10.1007/s10064-014-0573-0
McDougall, S. (2017). 2014 Canadian Geotechnical Colloquium: Landslide Runout Analysis - Current Practice and Challenges. Can. Geotech. J. 54, 605–620. doi:10.1139/cgj-2016-0104
Mineo, S., Pappalardo, G., D’Urso, A., and Calcaterra, D. (2017). Event Tree Analysis for rockfall Risk Assessment along a Strategic Mountainous Transportation Route. Environ. Earth Sci. 76, 620. doi:10.1007/s12665-017-6958-1
National Bureau of Statistics of China (2020). China Statistical Yearbook-2020. Beijing: China Statistics Press. Available at: http://www.stats.gov.cn/tjsj/ndsj/2020/indexch.htm.
O’Brien, J. S., Julien, P. Y., and Fullerton, W. T. (1993). Two‐Dimensional Water Flood and Mudflow Simulation. J. Hydraul. Eng. 119 (2), 244. doi:10.1061/(asce)0733-9429(1993)119:2(244)
Onen, F., and Bagatur, T. (2017). Prediction of Flood Frequency Factor for Gumbel Distribution Using Regression and GEP Model. Arab. J. Sci. Eng. 42, 3895–3906. doi:10.1007/s13369-017-2507-1
Peduto, D., Ferlisi, S., Nicodemo, G., Reale, D., Pisciotta, G., and Gullà, G. (2017). Empirical Fragility and Vulnerability Curves for Buildings Exposed to Slow-Moving Landslides at Medium and Large Scales. Landslides 14, 1993–2007. doi:10.1007/s10346-017-0826-7
Peila, D., and Guardini, C. (2008). Use of the Event Tree to Assess the Risk Reduction Obtained from rockfall protection Devices. Nat. Hazards Earth Syst. Sci. 8, 1441–1450. doi:10.5194/nhess-8-1441-2008
Petley, D. (2012). Global Patterns of Loss of Life from Landslides. Geology 40 (10), 927–930. doi:10.1130/G33217.1
Qing, F., Zhao, Y., Meng, X., Su, X., Qi, T., and Yue, D. (2020). Application of Machine Learning to Debris Flow Susceptibility Mapping along the China-Pakistan Karakoram Highway. Remote Sensing 12 (18), 2933. doi:10.3390/rs12182933
Raetzo, H., Lateltin, O., Bollinger, D, and Tripet, J. (2002). Hazard Assessment in Switzerland - Codes of Practice for Mass Movements. Bull. Eng. Geology. Environ. 61, 263–268. doi:10.1007/s10064-002-0163-4
Remondo, J., Bonachea, J., and Cendrero, A. (2005). A Statistical Approach to Landslide Risk Modelling at basin Scale: from Landslide Susceptibility to Quantitative Risk Assessment. Landslides 2, 321–328. doi:10.1007/s10346-005-0016-x
Rossi, M., Guzzetti, F., Salvati, P., Donnini, M., Napolitano, E., and Bianchi, C. (2019). A Predictive Model of Societal Landslide Risk in Italy. Earth-Science Rev. 196, 102849. doi:10.1016/j.earscirev.2019.04.021
Salbego, G. (2014). A Study on Landslides Forecasting in the Marosticano Area (Vicenza Province) Aimed to an Effective Cost-Benefit Analysis on Preventive Actions, Master’s Thesis in Geology and Technical Geology. Padua, Italy: Dept. of Geosciences.
Salbego, G., Floris, M., Busnardo, E., Toaldo, M., and Genevois, R. (2015). Detailed and Large-Scale Cost/benefit Analyses of Landslide Prevention vs. post-event Actions. Nat. Hazards Earth Syst. Sci. 15, 2461–2472. doi:10.5194/nhess-15-2461-2015
Salvatici, T., Morelli, S., Pazzi, V., Frodella, W., and Fanti, R. (2017). Debris Flow hazard Assessment by Means of Numerical Simulations: Implications for the Rotolon Creek valley (Northern Italy). J. Mt. Sci. 14, 636–648. doi:10.1007/s11629-016-4197-7
Shang, Z. H. (2012). Comprehensive Risk Assessment and Acceptable Risk Study of Debris Flow hazards. PhD Thesis. Guangzhou: Sun Yat-Sen University.
Shu, H., Ma, J., Yu, H., Hürlimann, M., Zhang, P., Liu, F., et al. (2018). Effect of Density and Total Weight on Flow Depth, Velocity, and Stresses in Loess Debris Flows. Water 10, 1784. doi:10.3390/w10121784
Solari, L., Bianchini, S., Franceschini, R., Barra, A., Monserrat, O., Thuegaz, P., et al. (2020). Satellite Interferometric Data for Landslide Intensity Evaluation in Mountainous Regions. Int. J. Appl. Earth Observation Geoinformation 87, 102028. doi:10.1016/j.jag.2019.102028
Staats, E. B. (1969). “Survey of Use by Federal Agencies of the Discounting Technique in Evaluating Future Programs,” in Program Budgeting and Benefit–Cost Analysis. Goodyear. Editors H Hinricks, and G Taylor (Pacific Palisades, CA).
Tang, C., and Okimura, T. (2006). Integrated Assessment of Urban Debris Flow Hazards Using RS/GIS: A Case Study of Dongchuan Urban Area, Kunming City, China. J. Geogr. Sci. 44, 1–22.
The people’s Government of Shanxi Province (2020). Shanxi Statistical Yearbook-2020. Beijing: China Statistics Press. Available at: http://www.shanxi.gov.cn/sj/tjnj/.
Tiranti, D., Crema, S., Cavalli, M., and Deangeli, C. (2018). An Integrated Study to Evaluate Debris Flow Hazard in Alpine Environment. Front. Earth Sci. 6, 60. doi:10.3389/feart.2018.00060
Uzielli, M., Nadim, F., Lacasse, S., and Kaynia, A. M. (2008). A Conceptual Framework for Quantitative Estimation of Physical Vulnerability to Landslides. Eng. Geology. 102 (3-4), 251–256. doi:10.1016/j.enggeo.2008.03.011
van Westen, C. J., Van Asch, T. W. J., and Soeters, R. (2006). Landslide hazard and Risk Zonation-Why Is it Still So Difficult? Bull. Eng. Geol. Environ. 65, 167–184. doi:10.1007/s10064-005-0023-0
Vranken, L., Van Turnhout, P., Van Den Eeckhaut, M., Vandekerckhove, L., and Poesen, J. (2013). Economic Valuation of Landslide Damage in Hilly Regions: A Case Study from Flanders, Belgium. Sci. Total Environ. 447, 323–336. doi:10.1016/j.scitotenv.2013.01.025
Wang, X., Zhao, G., and Li, F. (2016). Analysing Effect of Variational Data Assimilation of Satellite Radiance on a Regional Heavy Rain in Shanxi Province. J. Arid. Meteorol. 34 (3), 522–532. doi:10.11755/j.issn.1006-7639(2016)-03-0522
Wei, Z.-l., Xu, Y.-P., Sun, H.-y., Xie, W., and Wu, G. (2018). Predicting the Occurrence of Channelized Debris Flow by an Integrated Cascading Model: A Case Study of a Small Debris Flow-Prone Catchment in Zhejiang Province, China. Geomorphology 308, 78–90. doi:10.1016/j.geomorph.2018.01.027
Wei, Z., Shang, Y., Zhao, Y., Pan, P., and Jiang, Y. (2017). Rainfall Threshold for Initiation of Channelized Debris Flows in a Small Catchment Based on In-Site Measurement. Eng. Geology. 217, 23–34. doi:10.1016/j.enggeo.2016.12.003
Wu, Q., Zhong, R., Dong, P., Mo, Y., and Jin, Y. (2021). Airborne LiDAR Intensity Correction Based on a New Method for Incidence Angle Correction for Improving Land-Cover Classification. Remote Sensing 13 (3), 511. doi:10.3390/rs13030511
Keywords: debris flow, risk assessment, run-out analysis, FLO-2D, mitigation measure, benefit–cost analysis
Citation: Tang Y, Guo Z, Wu L, Hong B, Feng W, Su X, Li Z and Zhu Y (2022) Assessing Debris Flow Risk at a Catchment Scale for an Economic Decision Based on the LiDAR DEM and Numerical Simulation. Front. Earth Sci. 10:821735. doi: 10.3389/feart.2022.821735
Received: 24 November 2021; Accepted: 13 January 2022;
Published: 07 February 2022.
Edited by:
Zetian Zhang, Sichuan University, ChinaReviewed by:
Jinfeng Liu, Institute of Mountain Hazards and Environment (CAS), ChinaCopyright © 2022 Tang, Guo, Wu, Hong, Feng, Su, Li and Zhu. This is an open-access article distributed under the terms of the Creative Commons Attribution License (CC BY). The use, distribution or reproduction in other forums is permitted, provided the original author(s) and the copyright owner(s) are credited and that the original publication in this journal is cited, in accordance with accepted academic practice. No use, distribution or reproduction is permitted which does not comply with these terms.
*Correspondence: Zizheng Guo, Y3VnZ3p6QGN1Zy5lZHUuY24=
Disclaimer: All claims expressed in this article are solely those of the authors and do not necessarily represent those of their affiliated organizations, or those of the publisher, the editors and the reviewers. Any product that may be evaluated in this article or claim that may be made by its manufacturer is not guaranteed or endorsed by the publisher.
Research integrity at Frontiers
Learn more about the work of our research integrity team to safeguard the quality of each article we publish.