 Hok Sum Fok
 Yutong Chen
 Linghao Zhou
- 1School of Geodesy and Geomatics, Wuhan University, Wuhan, China
- 2Key Laboratory of Geospace Environment and Geodesy, Ministry of Education, Wuhan University, Wuhan, China
- 3School of Electronic and Information Engineering, Beihang University, Beijing, China
Basin-scale hydropower operation and water resource allocation rely on in situ river discharge measured at a river mouth, which is referred to as runoff. Due to labor intensiveness and tight financial constraints, satellite hydrological variables have been advocated for reconstructing monthly runoff via regressing with nearby measured monthly river discharge over the past two decades. Nevertheless, daily runoff reconstruction by regressing with upstream satellite hydrological variables on a daily scale has yet to be examined. A data standardization approach is proposed for daily runoff reconstructed using satellite hydrological data upstream of the Mekong Basin. It was found that the accuracy of reconstructed and predicted daily runoff against in situ runoff was substantially increased, in particular, the troughs (peaks) during dry (wet) seasons, respectively, when compared to that of the direct linear regression. The backwater impact on the runoff accuracy is negligible after standardization, implying the possibility of choosing the basin exit at the entrance of the river delta. Results generated from the data standardization via neural network–based models do not improve consistently or even a bit worse than that of the linear regression. The best forecasted runoff, yielding the lowest relative error of 8.6%, was obtained from the upstream standardized water storage index. Detrended cross-correlation analysis indicated that the reconstructed and forecasted runoff from the data standardization yielded a cross-correlation larger than 0.8 against in situ data within most window sizes. Further improvement lies in the methodology for mitigating the influence due to climate variability and extreme events.
1 Introduction
Basin-scale water allocation and management require in situ discharge time series measured at a river mouth, which is termed runoff when divided by the basin area. Its recorded extreme values are useful for predicting hazards that potentially occur around nearby-affected regions. The declining number of global discharge stations has promoted the usage of remotely sensed (RS) data products for discharge reconstruction since the 1990s (Sneeuw et al., 2014), owing to its near-global coverage.
Localized passive RS data, such as vegetation index, temperature (Yue et al., 2007), estuary dimension (Smith, 1997; Gleason and Smith, 2014), and flood extent mapping (Pan and Nichols, 2013), correlate nearby discharge data directly. Nonetheless, the weaknesses of these localized passive RS data are 1) unevenly sampled with a low temporal resolution, 2) susceptible to land surface materials, and 3) no direct causation with discharge data. As a result, satellite hydrological variables (e.g., precipitation) having evenly sampled on a daily basis with direct causation to discharge are more suitable than the localized passive RS data in reconstructing discharge at a basin scale.
Precipitation, stage, and water storage are the hydrological variables that can be calculated from the Global Precipitation Measurement–Tropical Rainfall Measurement Mission (GPM-TRMM) and its follow-on satellite (Huffman et al., 2007) and satellite altimetry (Frappart et al., 2006) and gravimetry (Wahr et al., 2004), respectively. For instance, the GPM-TRMM recorded monthly precipitation has been utilized for hydrologic prediction (Su et al., 2008; He et al., 2018), hydrologic extremes (Harris et al., 2007; Naumann et al., 2012; Mutuga et al., 2014; Tekeli and Fouli, 2016) and their climatic variabilities (Yan et al., 2020), and in situ precipitation assessment (Li et al., 2013; Yan et al., 2014; Tao et al., 2016). Nonetheless, the potential usage of daily GPM-TRMM precipitation data is yet to be explored (Su et al., 2011; Shirmohammadi-Aliakbarkhani and Akbari, 2020), let alone its potential for reconstructing daily runoff time series.
Stage and water storage time series are, respectively, recorded by satellite altimetry (e.g., Sentinel, Envisat, and Jason-3) and gravimetry [e.g., gravity recovery and climate experiment (GRACE)]. This altimetric-derived stage has been utilized to monitor inland water surface in small rivers in Indonesia (Sulistioadi et al., 2015), global lakes (Calmant et al., 2008), and Mekong Basin (MB)’s reservoirs (Liu et al., 2016). A power function fitting of the altimetric-derived stage with the in-situ runoff (Beven, 2001; Tourian et al., 2013) allows runoff reconstruction (Birkinshaw et al., 2010). A similar procedure applies to runoff relating to basin-averaged monthly water storage (Riegger and Tourian, 2014; Sproles et al., 2015). Runoff can also be determined through the water balance equation, with precipitation and evapotranspiration given (Syed et al., 2009; Chen et al., 2019). However, the potential usage of daily GRACE water storage data relating to daily runoff remains elusive. It is of note that unless data assimilation has been considered, direct daily GRACE data generation is not feasible without the tradeoff between spatial and temporal resolution.
In general, there are three types of hydrological models: conceptual models [e.g., Hydrologiska Byrans Vattenavdelning (HBV) model (Grillakis et al., 2010) and topography-based hydrological model (TOPMODEL) (Beven et al., 1984)], physically-based models [e.g., MIKE Système Hydrologique Européen (SHE) (Singh et al., 1999) and Soil and Water Assessment Tool (SWAT) (Easton et al., 2010)], and empirical models [e.g., linear regression, hydraulic functions, time series model, and neural network–based (NNB) model (Wang et al., 2009)]. The first two types of hydrological models require a significant amount of data within the basin, including runoff, precipitation, digital elevation model, drainage locations, and soil moisture, to mention a few (Devia et al., 2015). They are also computationally expensive (Reggiani and Rientjes, 2005). Several iterations are needed to get the parameters fine-tuned. Therefore, the empirical models are more suitable in hydrological practice due to their simplicity that is derived from input (e.g., precipitation and water storage) and output (e.g., runoff) time series only. The linear regression and hydraulic functions for reconstructing runoff have been described earlier. For instance, the in-situ runoff relates to GPM-TRMM precipitation data via linear regression (Zhou et al., 2019), whereas in situ runoff relates to the monthly basin-averaged water storage (or stage) via a hydraulic functional fitting (e.g., the power function) (Riegger and Tourian, 2014; Sproles et al., 2015).
Time series and NNB models are also ubiquitously employed. NNB model always generates a more accurate forecasted discharge than that from other methods (Wang et al., 2009). Nevertheless, most studies employing time series and NNB models used the in-situ discharge data as input rather than RS data or satellite hydrologic variables. Furthermore, data containing potential biases are not considered in advance while directly input into the model in different orders to train various numerical results. Hence, a method that generates a unique numerical result with a potential reduction of hidden biases is highly desirable.
Data standardization is a technique to detect hidden biases by subtracting the raw time series from the averaged one (Jones and Hulme, 1996; Ferreira et al., 2018). The regression between two standardized data variables should reduce potentially-hidden biases partially, in particular, in extreme conditions (Fok and He, 2018). This method is utilized in this research.
The reconstructed and forecasted runoff based on data standardization is expected to reduce the discrepancies of the peak and trough values against the in-situ one in this study. This is because a cascade effect is generated due to all artificial reservoir operations along the basin that distorts the in-situ runoff on a seasonal basis (Räsänen et al., 2017). This was found to be systematic for each season every year (Hecht et al., 2019). Hence, this effect can be partly reduced by data standardization, highlighting potential biases for a particular data time period (Fok and He, 2018). Notably, most reliable satellite hydrological variables were available only after 2002, in particular, GRACE water storage, avoiding the necessity for comparing the changes of reconstructed runoff before and after that time.
Given the presence of a time-lagged relationship between the upstream hydrological variables and the downstream water level (Biancamaria et al., 2011) and/or runoff (Hirpa et al., 2013), this study aims at regressing standardized satellite hydrological variables obtained at the MB upstream with the standardized in situ runoff on a daily scale. To demonstrate the improvement of the proposed approach, their accuracies are compared with the results generated from the direct linear regression and the NNB models. Comparison between the runoff reconstructed at and far away from the estuary also allows us to assess the backwater impact on reconstructing and forecasting runoff. Our results are finally compared with the best published daily (Tourian et al., 2017) relative error in the recent literature.
2 Study area
Across different latitudes, Mekong Basin is separated into upstream (i.e., Lancang river in China) and downstream (i.e., exit at Jinghong to river delta) (Figure 1) with distinct climate zones. Yunnan province appears as an important transition between upstream and downstream that shares a similar wet season driven by the Indian monsoon to that of the downstream (Colin et al., 2010; Tang et al., 2014). Climate variability [e.g., El Niño Southern Oscillation (ENSO)] abruptly alter the spatiotemporal precipitation pattern for the entire basin, consequently affecting the amount of runoff discharged into the ocean (Xue et al., 2011; Räsänen and Kummu, 2013).
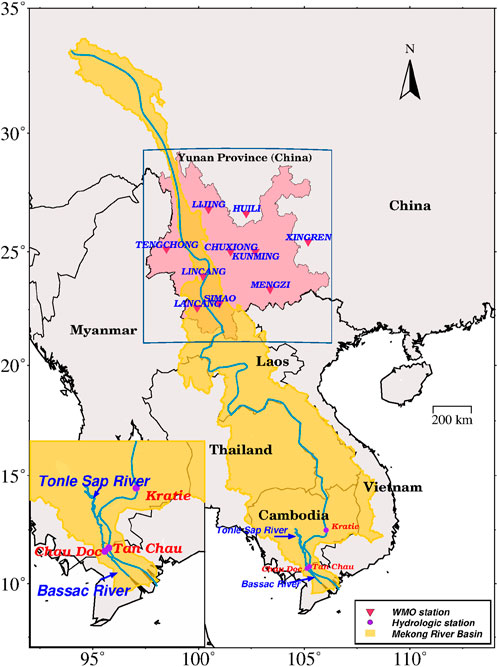
FIGURE 1. The Mekong Basin (yellow area) overlaying Yunnan, China (pink area), with World Meteorological Organization (WMO) meteorological stations (red triangle) along with hydrologic stations within the river delta (purple dot).
The natural settings of the basin are also critical to runoff temporal variability. For instance, Tonle Sap Lake, as a natural reservoir, provides storage water discharged into the ocean during the dry season (Chang et al., 2020) while storing water itself during the wet season. In addition, the backwater from the ocean substantially contaminates the pure hydrological signals of the water level and runoff measured at Mekong estuary channels (Peng et al., 2020).
The artificial settings of the basin are attributed to human activities. These activities, including dam operation, dikes construction, groundwater extraction, and sand mining (Loc et al., 2021), also speed up the backwater from the ocean (Eslami et al., 2019). Among all these activities, dam operation is the main reason for the apparent shift of the long-term seasonal runoff before and after 2002, owing to a drastic increase in dam construction during the 1990s (Cochrane et al., 2014; Lu et al., 2014; Li et al., 2017).
3 Data
3.1 In situ discharge and precipitation data
Three in situ discharge gauge stations (i.e., Tan Chau, Chau Doc, and Kratie), bought from the website of Mekong River Commission at http://www.mrcmekong.org, were employed in this study. Stations located at different distances from the estuary mouth allow an assessment of the ocean tidal backwater effect. Tan Chau and Chau Doc stations are located at Tien River and Han River, respectively, whereas Kratie station is located at the main stream. Tan Chau and Chau Doc (called TC-CD hereinafter) stations’ time series were added up correspondingly so as to approximate the basin runoff. It is of note that the Butterworth filter was used to suppress short-period ocean tidal signals (e.g., diurnal or semidiurnal) for the TC-CD time series (Peng et al., 2020) in order to minimize the tidal backwater effect in the river delta (Arias et al., 2012; Gugliotta et al., 2019). To generate daily discharge of the TC-CD station (in the unit of millimeters per day), the daily TC-CD discharge (in the unit of cubic meters per second) is divided by the total basin area. No pre-processing step was applied to the Kratie station time series, except for the dividing basin area excluding the Cambodia plain.
Daily runoff time series for the Kratie and TC-CD stations are displayed, with highly unstable maximum and minimum values from 2009 to 2014 (Figure 2). It is of note that the TC-CD time series is not continuous due to instrument upgrades during 2007–2008. Therefore, the daily runoff and the satellite hydrological variables were consistently used for time lag determination during 2003–2006, while used for the reconstruction (forecast) during 2009–2012 (2013–2014), respectively.
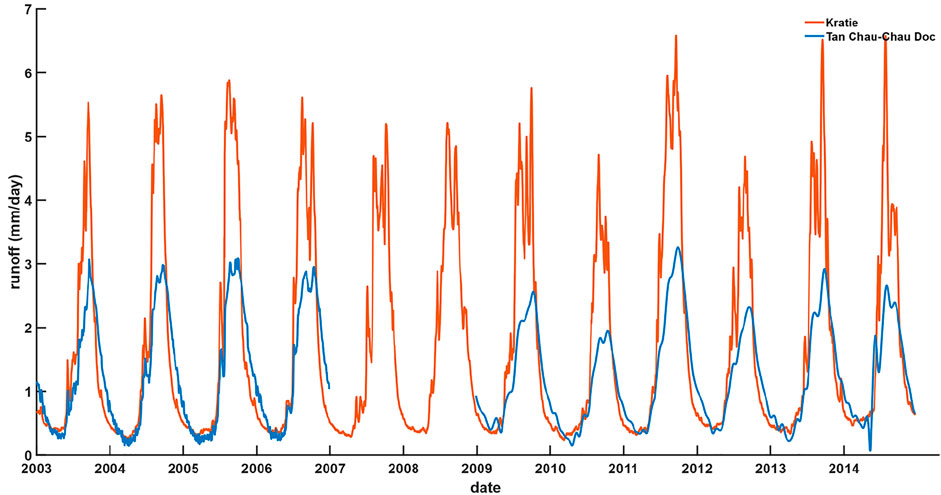
FIGURE 2. Runoff time series of the TC-CD and Kratie stations.
Nine in situ precipitation data, obtained from World Meteorological Organization (WMO) stations available at https://www.ncei.noaa.gov/maps/daily/, were averaged over Yunnan to evaluate the precipitation data from GPM-TRMM. No apparent offset was observed; therefore, no calibration is required in this study (Figure 3). It was found that the averaged in situ precipitation data against that of GPM-TRMM quantitatively revealed a good consistency, with a Pearson correlation coefficient of 0.695 and an RMS error of 3.53 mm/day.
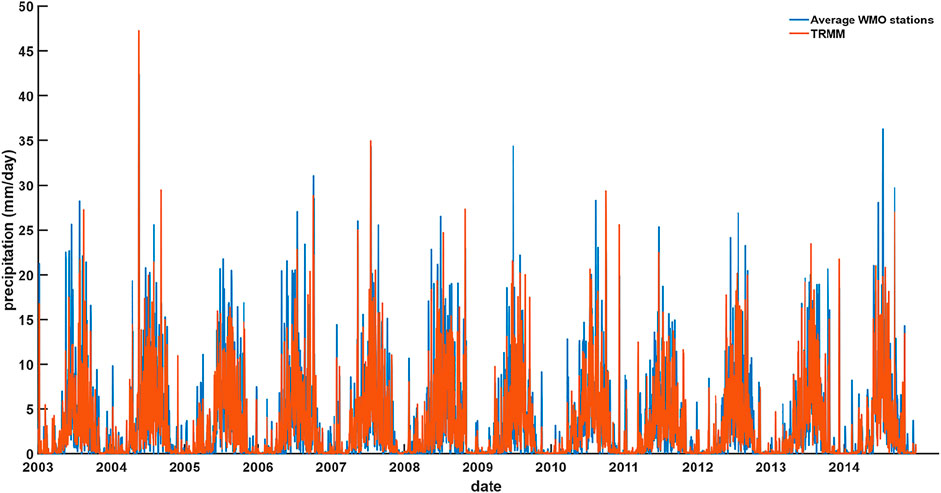
FIGURE 3. Time series of GPM-TRMM daily precipitation averaged over Yunnan Province against the average precipitation of nine in-situ WMO stations during 2003–2014.
3.2 Two satellite hydrological variables
Daily precipitation time series map gridded at
3.3 ENSO index
ENSO events cause hydrological extremes in the Mekong Basin (Räsänen and Kummu, 2013). The warm (cold) phase representing El Niño (La Niña) can be distinguished by pressure difference and sea surface temperature anomalies (Kiem and Franks, 2001). Oceanic Niño Index and Multivariate ENSO Index, available at https://www.esrl.noaa.gov/psd/data/climateindices/list/, were served to qualitatively examine whether the indices were correlated substantially with the runoff, especially for the extended La Niña duration during 2010–2011 (Figure 4).
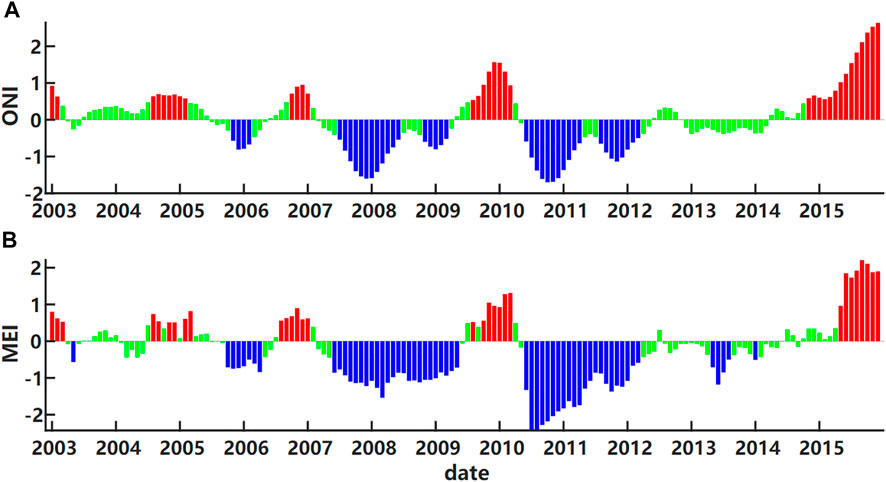
FIGURE 4. The (A) Oceanic Nino Index and (B) Multivariate ENSO Index time series, indicating the neutral (green bar), La Niña (blue bar), and El Niño (red bar) events.
4 Methodology
4.1 Overview
Figure 5 describes the flow of the methodology, which includes: 1) post-processing steps (i.e., spatial averaging over Yunnan, time lag analysis, and temporal averaging process); 2) data standardization; 3) reconstructed and forecasted runoff via linear regression and NNB models; and 4) validation.
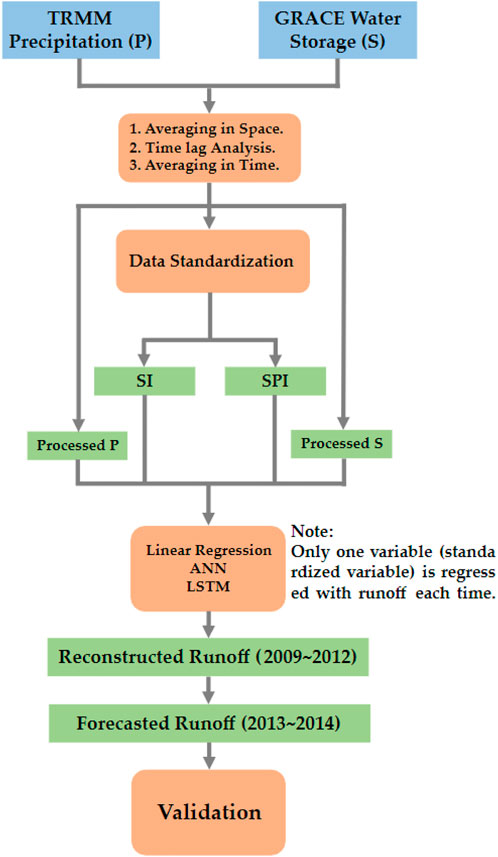
FIGURE 5. Flowchart describing the whole methodology of this study.
4.2 Data pre- and post-processing
While no data preprocessing for GPM-TRMM daily data is required, GRACE daily data preprocessing is needed. The GPM-TRMM daily data are resampled at
For data post-processing steps, all satellite hydrological variables within the boundary of Yunnan were averaged per day in space to produce an individual time series for each hydrological variable. Then, a 55-day and a 5-day moving averaging process were applied to TRMM precipitation and GRACE water storage, respectively, followed by shifting a lagged time between the upstream satellite hydrological variables and in situ runoff, owing to the presence of hysteretic properties among the hydrological variables influenced by climate, hydrogeology, and topography (Sproles et al., 2015). The time lag was determined via a cross-correlation analysis (Oppenheim, 1999). Finally, the runoff reconstruction and forecast via the direct linear regression between the satellite hydrological variables and runoff were performed. These results served as benchmarks against the proposed data standardization.
Precipitation is discrete, following non-normal statistical distribution. McKee et al. (1993)’s standardization process was used. This process transforms the GPM-TRMM daily data during 1998–2014 into a standardized form, called standardized precipitation index (SPI), that follows a normal distribution (Naresh Kumar et al., 2009). A 3-month (i.e., 90 days) time scale of SPI was selected (Lloyd-Hughes and Saunders, 2002). However, water storage on land should be continuous. Therefore, conventional data standardization was used for GRACE water storage data, except that the median values every day were adopted to standardize the water storage (Fok and He, 2018), which is written as
where
4.3 Linear regression model
Previous research studies have found that runoff lagged the upstream GPM-TRMM precipitation (Zhang et al., 2007; Du et al., 2020) and GRACE water storage (Riegger and Tourian, 2014) by a month or more. Thus, the time lag between the upstream GPM-TRMM precipitation (GRACE water storage) and the runoff must be determined before further calculation. To calculate the time lag, a cross-correlation analysis was conducted during 2003–2006. This is performed by shifting the time that maximizes the correlation coefficient between the GPM-TRMM precipitation (GRACE water storage) and the runoff.
A simple model that linearly relates the upstream GPM-TRMM precipitation (or GRACE water storage),
where
To regress the upstream SPI and SI inferred from GPM-TRMM and GRACE, the standardization of in situ runoff is achieved through
similar to Eq. 1. The analogous
4.4 NNB models
The result from our proposed approach was then compared to that of artificial neural network (ANN) (Hassoun, 1995) and long short-term memory (LSTM) models (Rumelhart et al., 1986) in order to further evaluate our approach. No matter short- or long-term discharge forecast, previous research studies showed that the results from these NNB models outperform that from the linear regression and conceptual and time series models (Wang et al., 2009; Sahoo et al., 2019; Samantaray and Ghose, 2019).
Regarding the settings of NNB models, the neural network structure of LSTM and ANN was set the same with two hidden layers because Cybenko (1989) stated that two hidden layers were sufficient for a continuous time series. By choosing a scaled exponential linear unit (Klambauer et al., 2017) as an activation function and assigning upstream GPM-TRMM precipitation and GRACE water storage (or SPI and SI) as input and in situ runoff as output, training was performed using adaptive moment (i.e., Adam) optimizer (Kingma and Ba, 2014). The two abovementioned models were trained ten times in which mean value was used for each time epoch because random initial weights and the validation set members render numerical values differently.
4.5 Assessment metrics
To evaluate the performance in a relative manner, normalized root-mean-square error (NRMSE) (Fok et al., 2020), Nash–Sutcliffe efficiency model coefficient (NSEMC) (Nash and Sutcliffe, 1970), Pearson correlation coefficient (PCC) (Pearson, 1920), detrended fluctuation analysis (DFA) (Peng et al., 1994) scale factor, and detrended cross-correlation analysis (DCCA) (Podobnik and Stanley, 2008) exponent were served as the assessment metrics. They were employed for assessing reconstructed and forecasted runoff against in situ datasets.
Defining the in situ and reconstructed (or forecasted) runoff at day k as
The NSEMC, ranging from
The PCC, ranging between −1 and 1, assesses temporal consistency between two time-varying variables, which is written as
DFA and DCCA were also used to test the stationarity of a time series and the long-term memory between two non-stationary time series, respectively. During the DFA, the in-situ runoff time series
where
DCCA was further used to examine the cross-correlation between two non-stationary time series. For instance, the detrended co-fluctuation function of
where
The
5 Results
Through cross-correlation analysis, lagged time between the in-situ runoff at the TC-CD (and Kratie) station and the upstream GPM-TRMM precipitation (or GRACE water storage) during 2003–2006 was determined, respectively (Figure 6), through the obtained maximum PCC between them. The lagged time was found to be −64 days (or 0 day), while the lagged time for that of the Kratie station was found to be −43 days (or 15 days), respectively. This implies the fundamental difference between the Kratie and TC-CD station locations chosen as runoff because the TC-CD stations’ pair recorded an additional regulation influence due to the natural reservoir—Tonle Sap Lake. However, GRACE water storage is synchronized with (15 days’ lag) in-situ runoff at the TC-CD (Kratie) station, which might be attributable to regionalized smoothing in the pre-processing steps. Nonetheless, all lagged time calculated results were used to shift the time series against the in-situ runoff for reconstructing runoff.
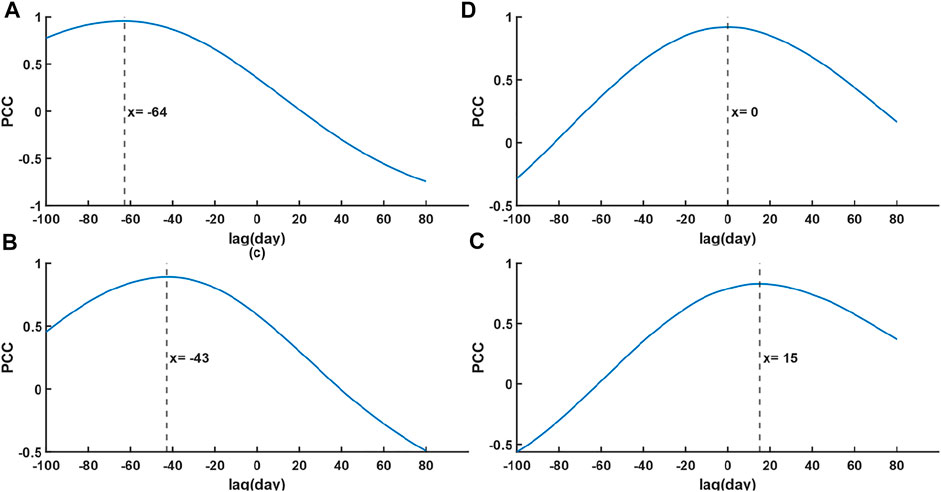
FIGURE 6. PCC between (A) GPM-TRMM precipitation or (B) GRACE water storage bounded by Yunnan and the in-situ TC-CD runoff and between (C) GPM-TRMM precipitation or (D) GRACE water storage bounded by Yunnan and the in situ Kratie runoff.
The fluctuation pattern of the upstream GPM-TRMM precipitation and GRACE water storage are largely in agreement with the in-situ runoff (Figure 7). However, a lagged time is exhibited between the upstream GRACE water storage and in situ runoff during the dry season. This may be potentially due to different storage-runoff properties between the upstream and the total basin runoff, resulting in a slower decrease in storage against the runoff. Furthermore, an even more obvious lagged shift of water storage is apparent in 2014, potentially attributed to the end-of-commission of GRACE when the occurrence of the data quality degradation.
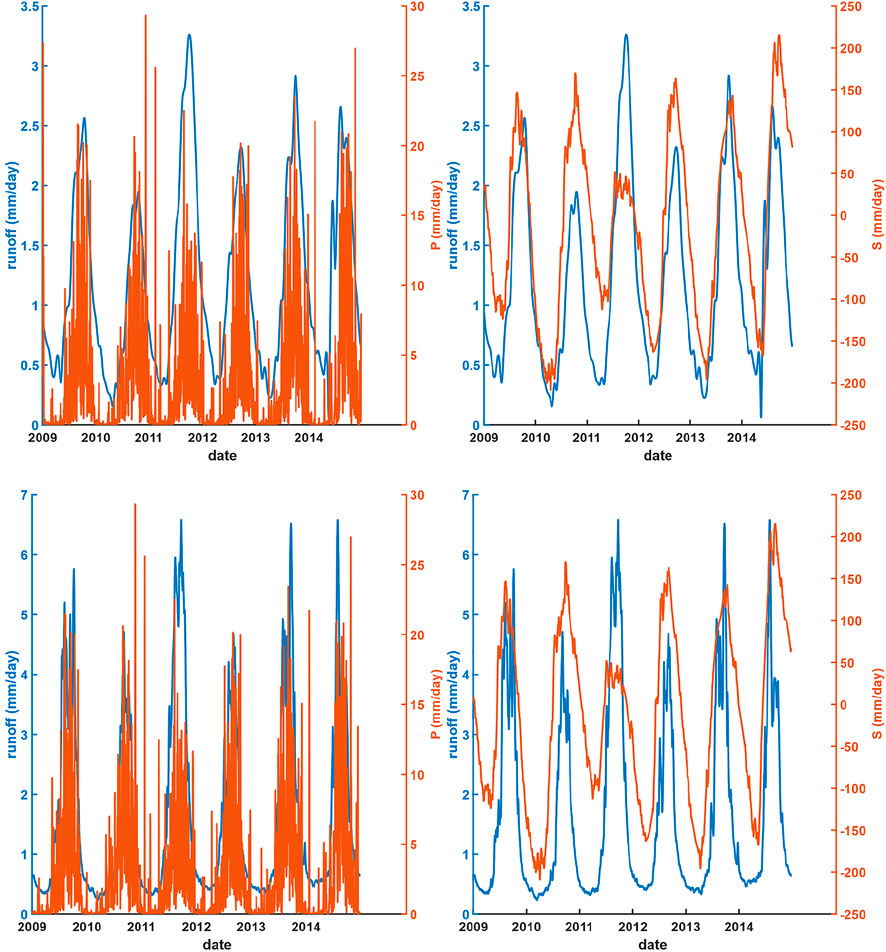
FIGURE 7. Spatially averaged time series of the upstream GPM-TRMM precipitation (left) and GRACE water storage (right) against in situ runoff at the TC-CD (upper) and Kratie (lower) stations.
The accuracies and performances of the reconstructed (from 2009 to 2012) and forecasted (from 2013 to 2014) runoff are then assessed using the upstream GPM-TRMM precipitation, GRACE water storage, and their standardizations, generated from the linear regression, ANN, and LSTM models (Figures 8, 9). We observed that the runoff reconstructed and forecasted at the TC-CD station using the upstream GPM-TRMM precipitation performed similarly among different models (Figure 8), while it performed differently at the Kratie station. Those runoff time series generated from NNB models performed better than that of linear regression, particularly capturing the troughs better against in situ runoff at Kratie station during the dry season (Figures 8D–F). Nevertheless, no runoff among the models captured the peaks very well. This is particularly apparent in 2011, 2013, and 2014. This should be attributable to La Niña events in 2011, 2013, and 2014 (Figure 3) that might potentially alter the usual hydrological conditions between the upstream and the downstream. This is further discussed qualitatively in the next section.
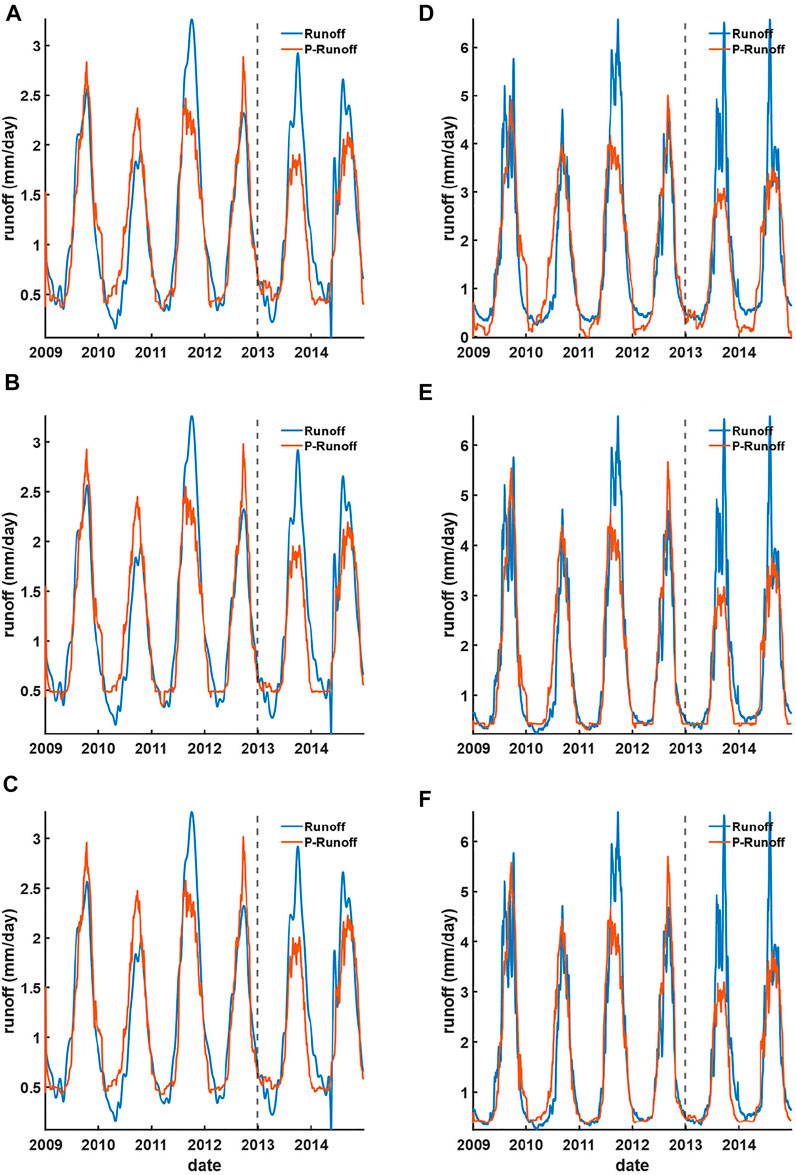
FIGURE 8. Reconstructed (during 2009–2012) and forecasted (during 2013–2014) runoff using the upstream GPM-TRMM precipitation based on (A) linear regression, (B) ANN, and (C) LSTM models against the TC-CD station and (D) linear regression, (E) ANN, and (F) LSTM models against the Kratie station.
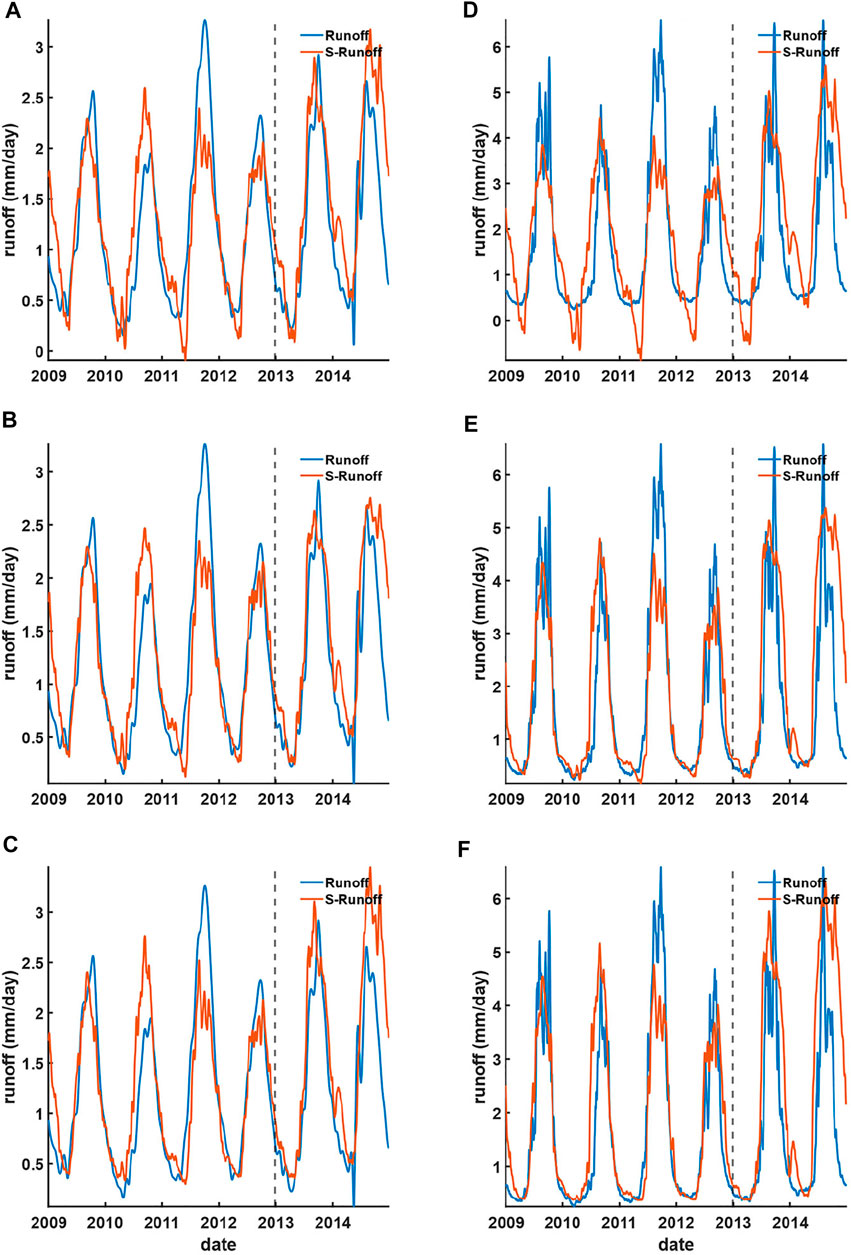
FIGURE 9. Reconstructed (during 2009–2012) and forecasted (during 2013–2014) runoff using the upstream GRACE water storage based on (A) linear regression, (B) ANN, and (C) LSTM models against the TC-CD station and (D) linear regression, (E) ANN, and (F) LSTM models against the Kratie station.
The runoff generated using GRACE water storage (Figure 9) yields a similar result but appears better in capturing the peaks visually than that of GPM-TRMM precipitation. This might be attributable to the well-known hydraulic relationship between water storage and runoff on land. However, in terms of the accuracy evaluation statistics (Tables 1, 2), the overall consistency of runoff generated using GRACE water storage is still a bit worse than that of GPM-TRMM precipitation. This might be caused by a moderately strong spatiotemporal smoothing in the GRACE data preprocessing, making GRACE-reconstructed runoff able to visually capture the rise and fall during the dry and wet season time period but unable to capture the extreme peaks and troughs at an accurate timing on a daily scale.

TABLE 1. Evaluation of runoff reconstruction and forecast at the TC-CD stations.
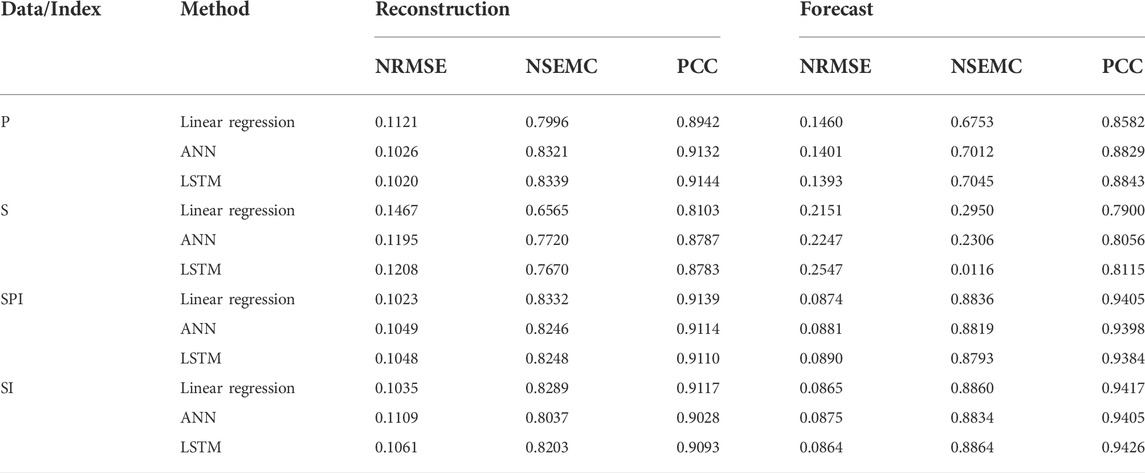
TABLE 2. Evaluation of runoff reconstruction and forecast at the Kratie station.
From the concept, the runoff reconstructed at the Kratie station should be better than that of the TC-CD station, since the location of the Kratie station should be less influenced by backwater due to the long distance away from the estuary. However, comparing the runoff reconstructed and forecasted at the TC-CD station with that at the Kratie station in terms of accuracy evaluation statistics, the runoff reconstructed at the Kratie station is worse than that of the TC-CD station. It is of note that the Butterworth filter was applied to suppress the short-period tidal backwater effect in the river delta (Peng et al., 2020), which might improve the overall accuracy. Another reason is that the Kratie station does not really represent the entire Mekong Basin due to ignorance of the Cambodian plain area where Tonle Sap Lake is located. In addition, mountainous areas with steep slopes located around the Kratie station might be another error source. It is also of note that the runoff peaks at the Kratie station are highly fluctuated compared to those of the TC-CD station. This might be caused by a cascade of inconsistent dam operations by humans among different countries and places during summer. These fluctuating peaks cannot be observed from the relatively smoothed satellite hydrological variables by nature and, hence, result in lower relative accuracy.
In any occasion, runoff reconstructed and forecasted using GPM-TRMM precipitation and GRACE water storage yield the PCC (NRMSE) of 0.92 (∼10%) and 0.85 (∼13%), respectively, no matter at the TC-CD and Kratie stations (Tables 1, 2). Overall, the abovestated resulting evaluation statistics are comparable to the best published daily relative error of 12% by Tourian et al. (2017).
The reconstructed runoff using standardized data is better than that generated from the satellite hydrological variables directly via linear regression (Tables 1 and 2). This is manifested from the runoff reconstructed from SPI and SI, yielding a better agreement in the wet and dry seasons against in situ runoff, no matter in the TC-CD and Kratie stations (Figures 10, 11).
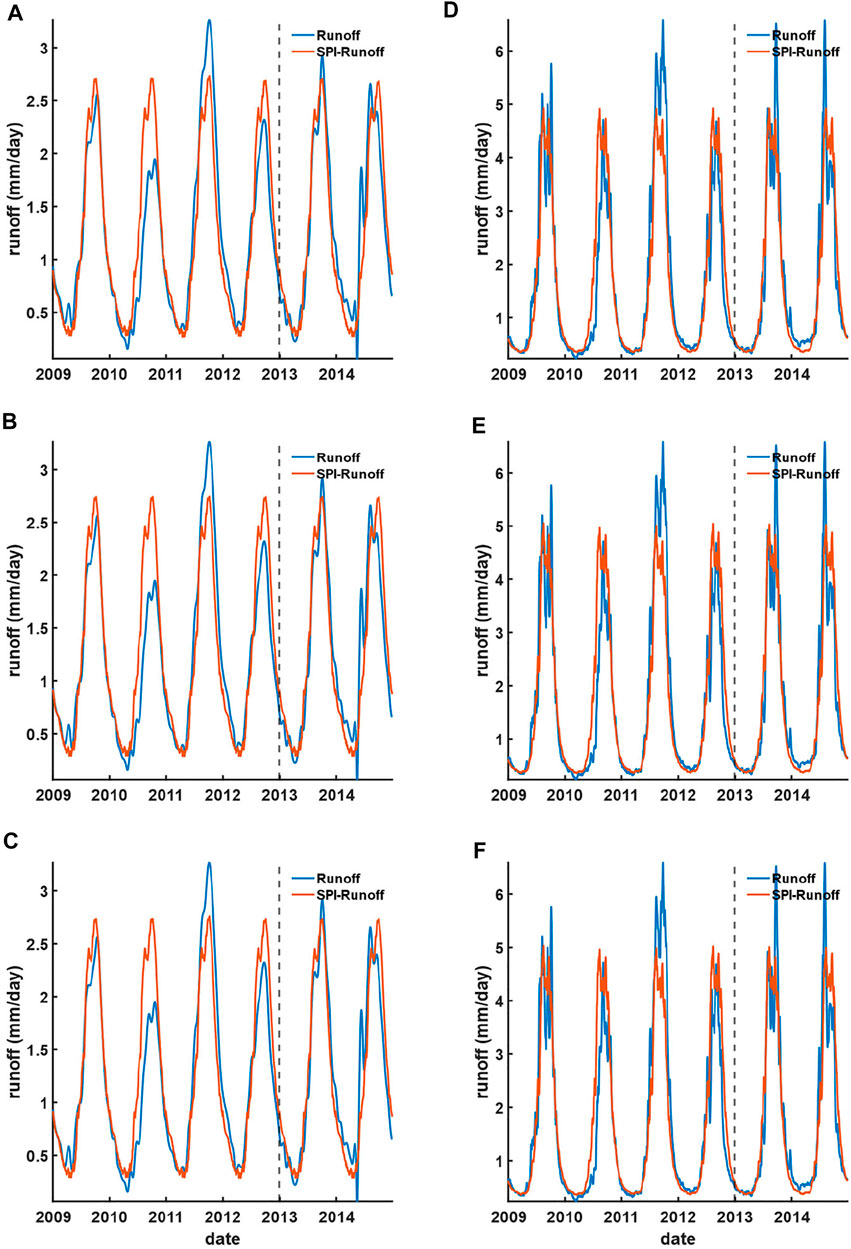
FIGURE 10. Reconstructed (from 2009 to 2012) and forecasted (from 2013 to 2014) runoff using the upstream GPM-TRMM SPI against in situ runoff at the TC-CD and Kratie stations based on (A and D) linear regression, (B and E) ANN, and (C and F) LSTM models, respectively.
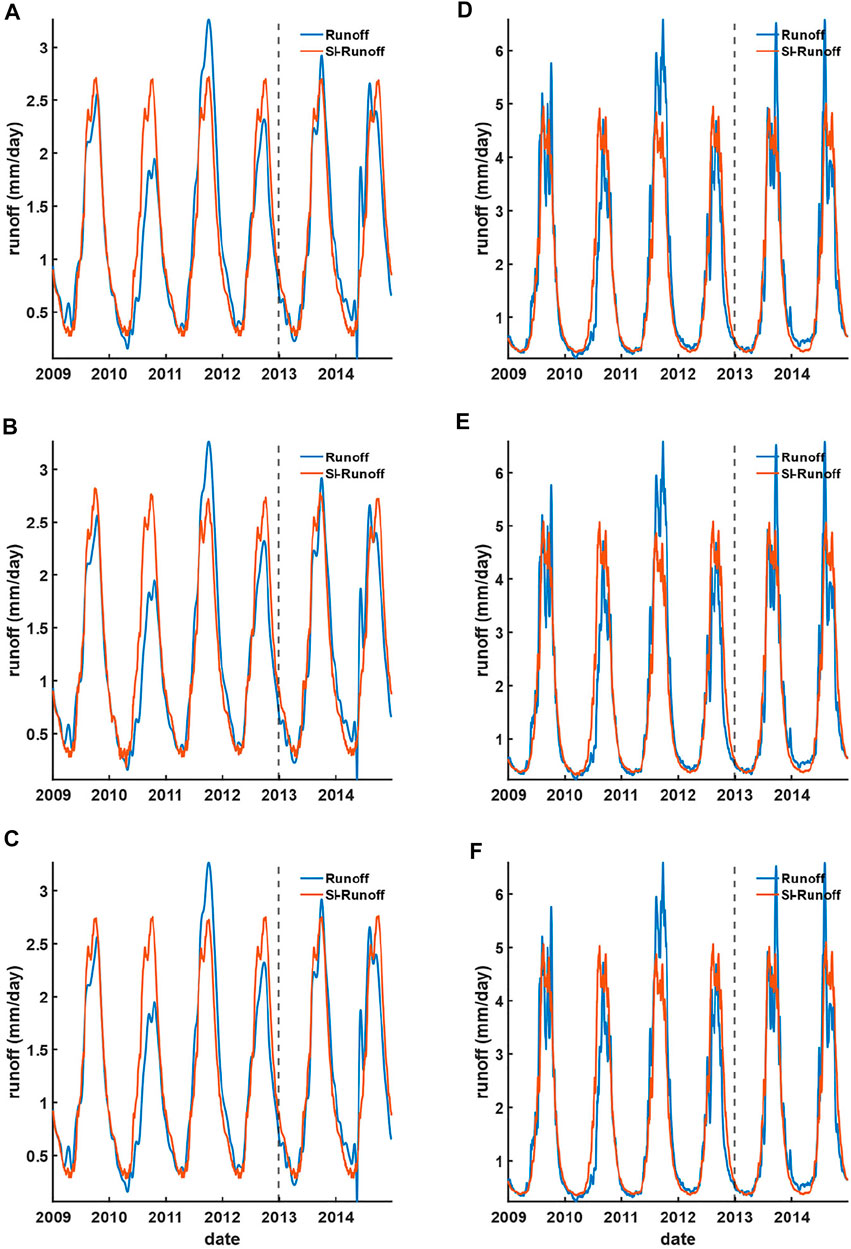
FIGURE 11. Reconstructed (from 2009 to 2012) and forecasted (from 2013 to 2014) runoff using the upstream GRACE SI against in situ runoff at the TC-CD and Kratie stations based on (A and D) linear regression, (B and E) ANN, and (C and F) LSTM models, respectively.
Compared to the runoff generated directly using upstream GPM-TRMM precipitation against in situ TC-CD and Kratie stations, the reconstructed runoff based on SPI is worsened (improved) at most by 0.9% (1%), respectively, while that of the forecasted runoff is improved by 5% consistently (Tables 1 and 2). For the resulting runoff using GRACE water storage against in situ TC-CD and Kratie stations, the reconstructed runoff based on SI is consistently improved at most by 3% and 4%, respectively, while that of the forecasted runoff is improved at most by 10% and 16%, respectively. This indicates that systematic influences can be minimized via data standardization (Ferreira et al., 2018), while the improvement for the standardized GRACE water storage (i.e., SI) is significantly better than that of SPI. Assessing the relative accuracy (in terms of NRMSE), both the reconstructed and forecasted runoffs’ relative accuracies are presented with less than 11%. Those are slightly better than the best relative accuracy published in the recent literature (i.e., 12%) (Tourian et al., 2017). Notably, no matter reconstructed using SPI and SI at the TC-CD or Kratie stations, the relative accuracy in terms of NRMSE for the forecasted runoff is still ∼9%, indicating that the backwater effect on TC-CD should be further minimized after the data standardization process. In other words, the basin exit can be chosen as close as the estuary mouth, such that the runoff could best represent the total discharge of the entire basin.
To test the stationarity of different hydrological variables, their logarithmic fluctuation functions versus logarithmic window size is shown in Figure 12 and Supplementary Figures S1 and S2, with the scale factor
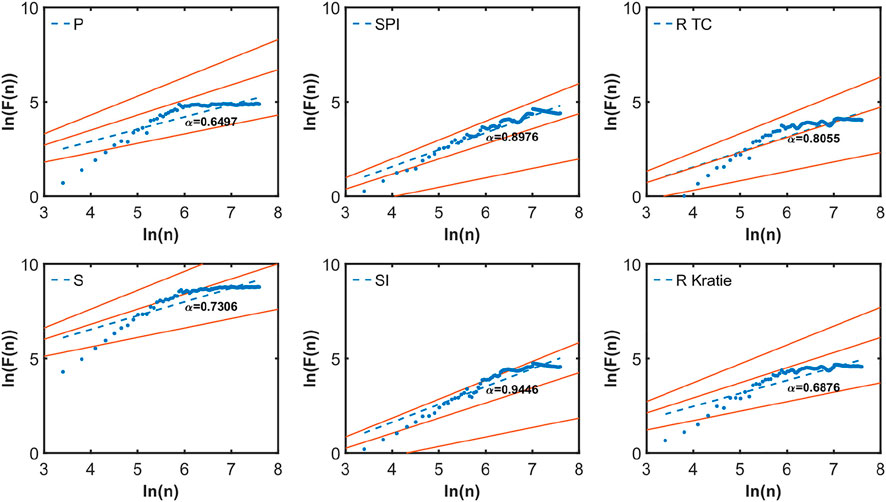
FIGURE 12. Double logarithmic plots of the fluctuation functions of DFA versus window-size n derived from P, S, SPI, SI, and in-situ runoff at the TC-CD and Kratie stations. The slopes of dashed blue lines represent the fitted
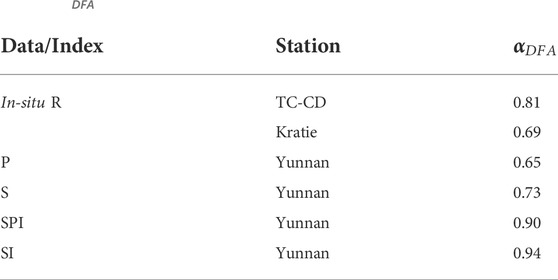
TABLE 3.
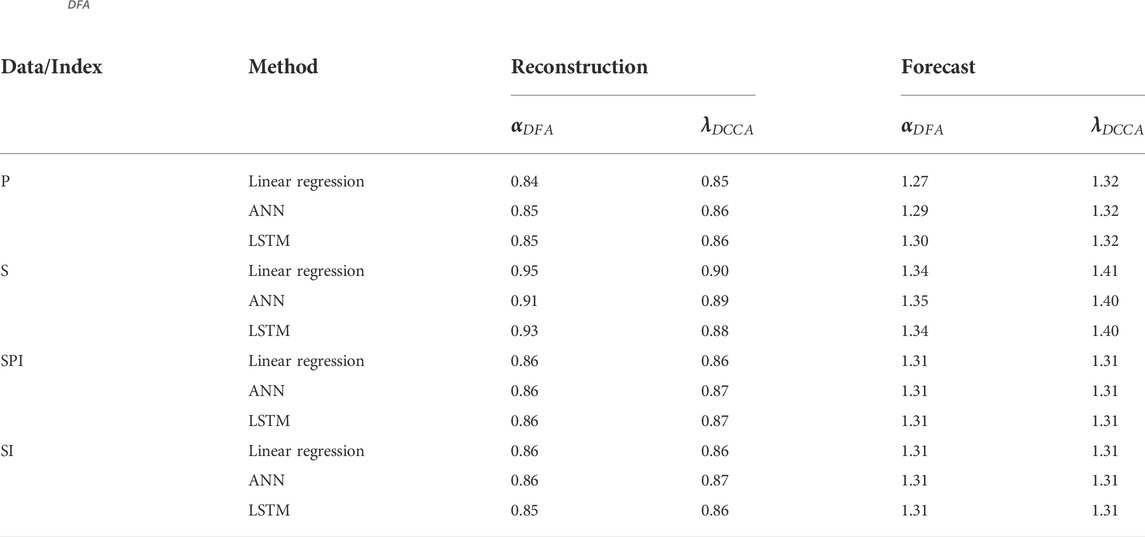
TABLE 4.
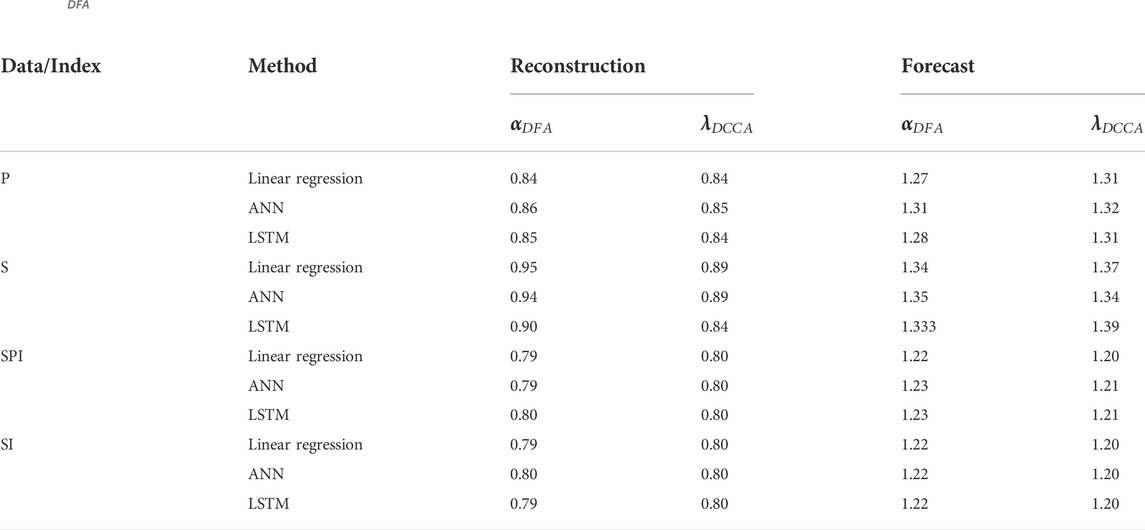
TABLE 5.
To examine the long-term cross-correlation between our reconstructed (forecasted) and in-situ runoff, the exponent
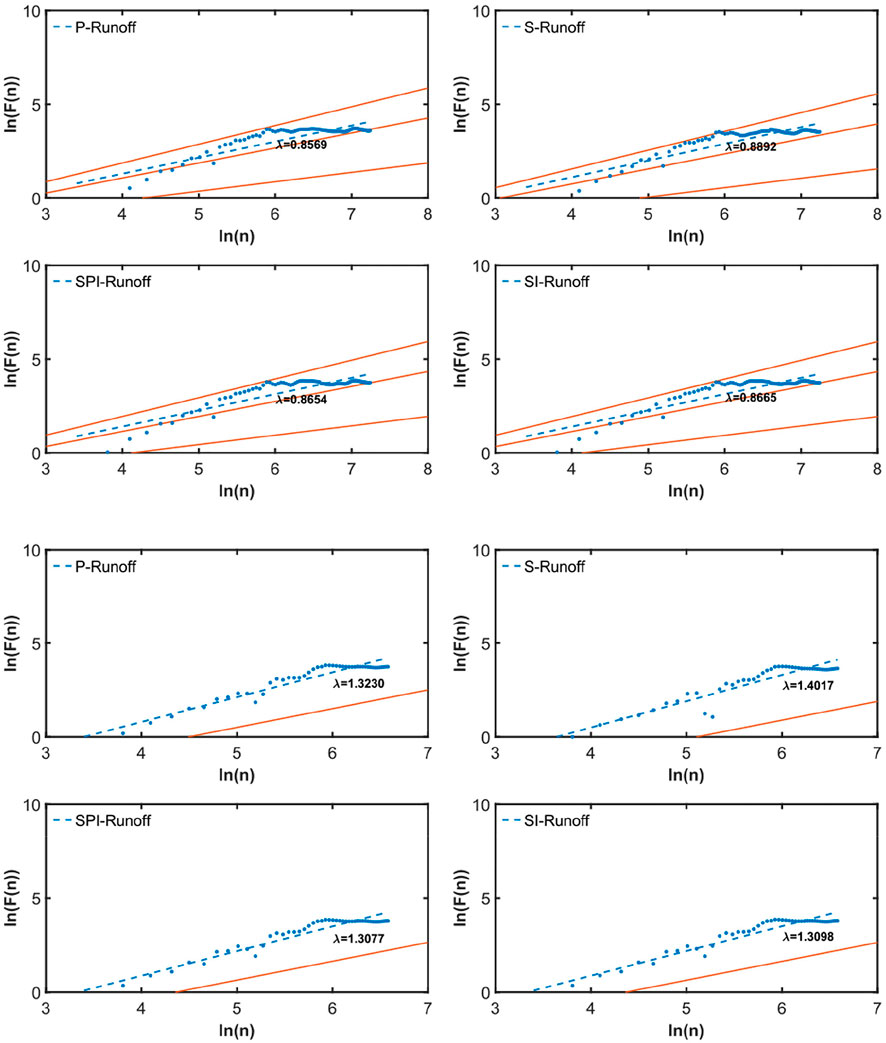
FIGURE 13. Power-law cross-correlations between ANN-reconstructed (upper four subplots) and ANN-forecasted (lower four subplots) runoff and in-situ TC-CD runoff. The slopes of dashed blue lines represent the fitted
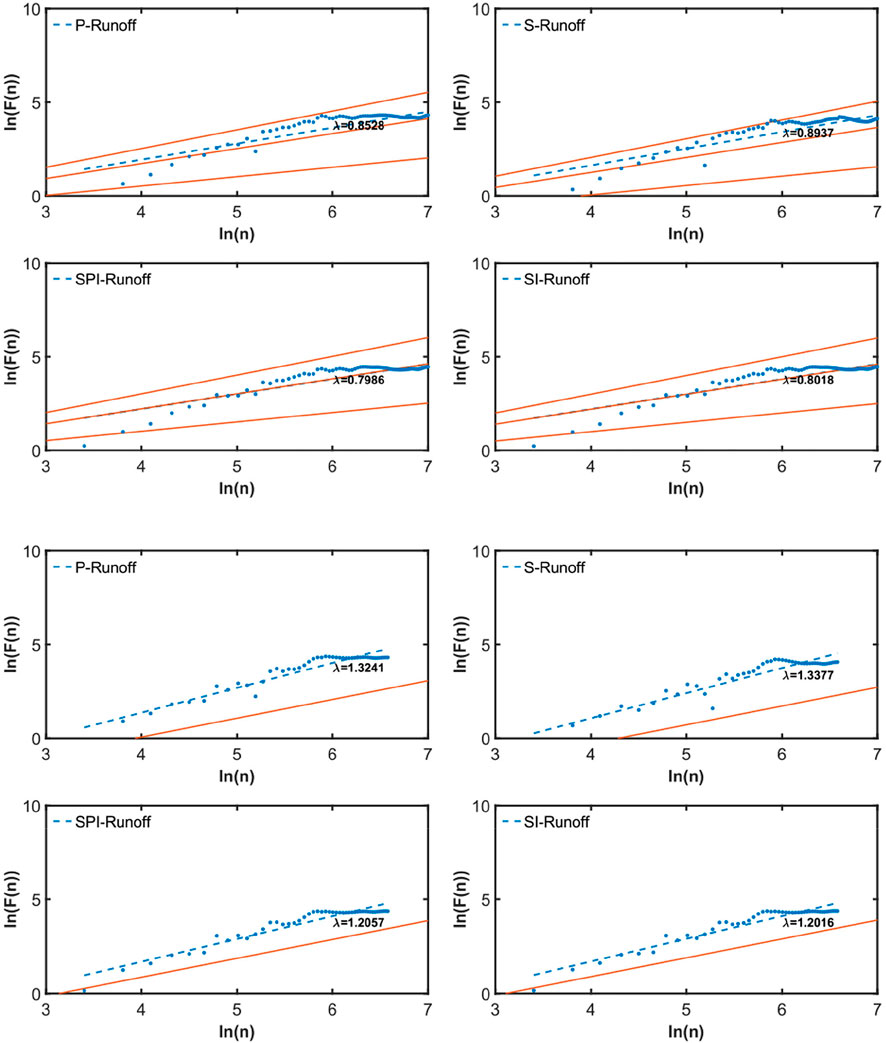
FIGURE 14. Power-law cross-correlations between ANN-reconstructed (upper four subplots) and ANN-forecasted (lower four subplots) runoff and in-situ Kratie runoff. The slopes of dashed blue lines represent the fitted
For further quantifying the cross-correlations between reconstructed (forecasted) and in-situ runoff, the DCCA cross-correlation coefficients
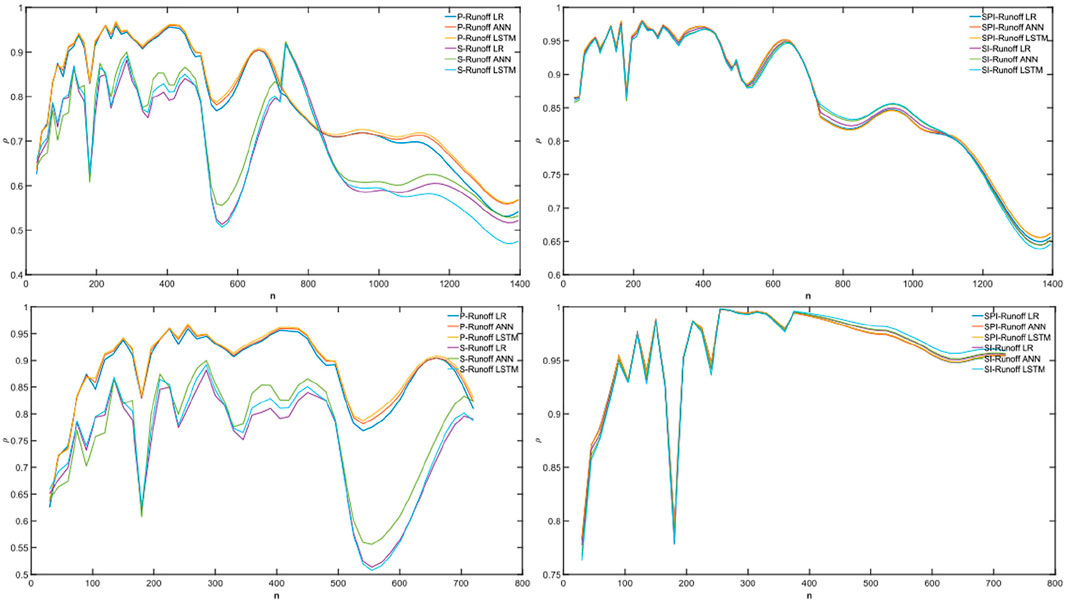
FIGURE 15.
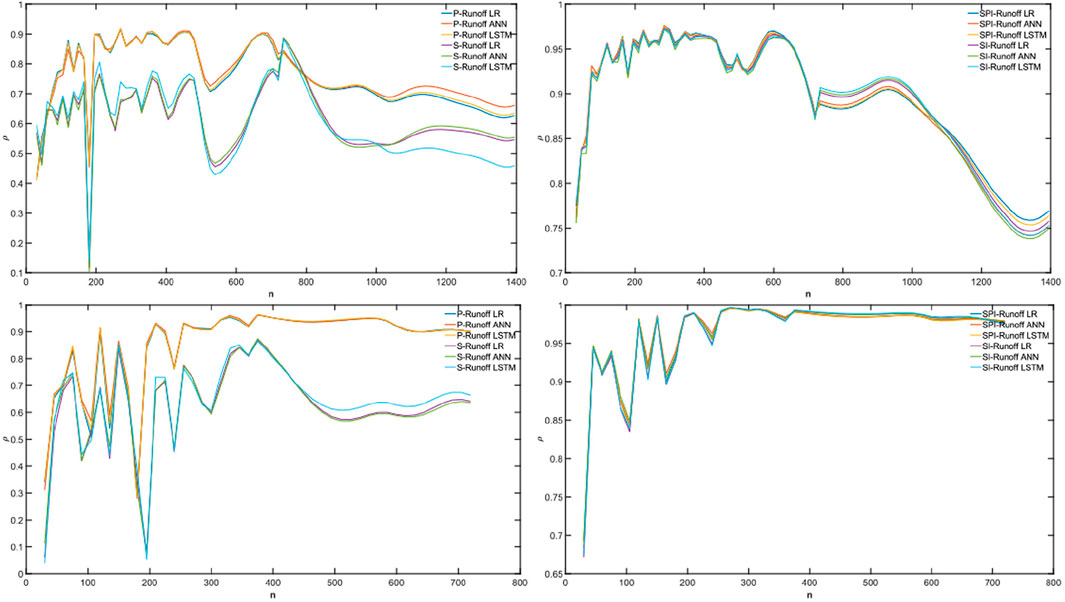
FIGURE 16.
6 Discussion
Even though the SPI- and SI-reconstructed runoff yield substantial improvements in capturing the peaks (troughs) during wet (dry) seasons against the in-situ runoff, substantial discrepancies during the wet season still exist. We analyze the SPI and SI during 2009–2014 against the standardized in situ runoff for potential reasons (Figure 17).
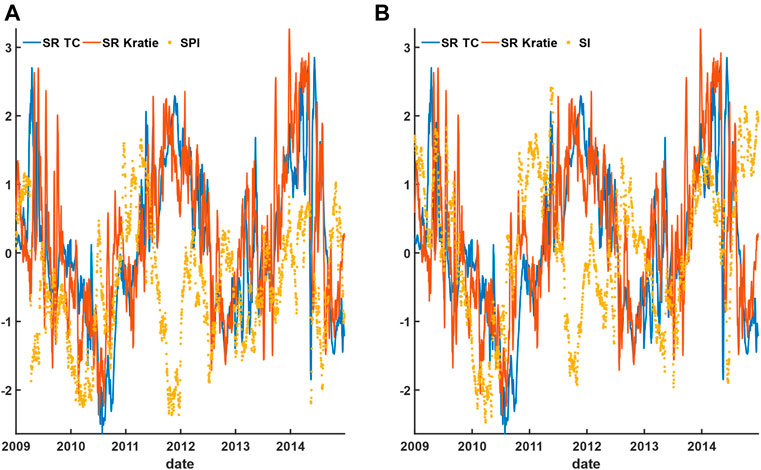
FIGURE 17. Upstream (A) SPI from GPM-TRMM and (B) SI from GRACE against the standardized runoff at the TC‐CD station.
Plotting the SPI and SI with the in-situ SR at the TC-CD and Kratie stations, Figure 17 both the SPI and SI time series display fluctuation patterns irregularly when compared to the in-situ SR. It is of note that the lagged time has been applied. We found the presence of the reverse pattern of SPI and SI when compared to SR during different time periods within 2009–2014. The time duration sessions for the reverse pattern of SPI and SI are basically the same, which are June–September 2010, January–April 2011, July 2011–February 2012, September–December 2012, and June-December 2014.
For the period between June–September 2010 and January–April 2011, the reverse patterns of these periods should be caused by the presence of the strongly alternating El Niño and La Niña events during 2009–2010 and 2010–2011, respectively. It is of note that the moderately strong ENSO events should take 6–9 months before the start of runoff response in the Mekong Basin (Fok et al., 2018). Those reverse patterns indicate the downstream was relatively wet while the upstream was dry during 2009–2011. Apparently, the normal precipitation and water storage patterns were distorted, making the hydrological conditions between the downstream and the downstream more distinguishable (Biancamaria et al., 2011).
Though ENSO indices can be speculated to be incorporated into the linear regression model for a better runoff reconstruction and forecast, the reverse patterns between September–December 2012 and June–December 2014 are not shown to be related to ENSO (Figure 17). We speculate that the reverse patterns between September–December 2012 and June–December 2014 might be due to the regional climate of the Mekong Basin. Monsoon indices, such as the Indian summer monsoon index and the western North Pacific monsoon index, can be potentially utilized to explain these anomalies. In addition, the SPI and SI appear to have an offset against SR, indicating the chosen mean (or median) value of each day within the year for the entire time series would have a substantial impact on the interpretation as well. The abovestated result and discussion detailed the limitations of this study.
7 Conclusion
Daily runoff in the Mekong Basin was reconstructed and forecasted via direct linear regression and neural network–based models, using upstream daily satellite hydrological variables (i.e., precipitation from GPM-TRMM and water storage from GRACE) and their respective standardized forms (i.e., SPI and SI). Our proposed standardization approach further reduces the discrepancy for the peaks and troughs during wet and dry seasons, respectively, when compared to the direct correlation between the in-situ runoff and individual satellite hydrological variables.
Comparing the runoff from our proposed approach against the in-situ runoff at the TC-CD and Kratie stations, we found that the backwater effect on the TC-CD station can be negligible so long as the low-pass filter has been applied to the in-situ time series in order to suppress the short-period ocean tides. This implies it is possible to choose the basin exit as close as the entrance of the river delta, such that the runoff could best represent the total discharge of the entire basin. For instance, the neglect of the Cambodian plain area would render an incomplete description of the entire Mekong Basin. Moreover, the runoff reconstructed and forecasted from neural network–based models using the standardized data does not guarantee improvement over that from the direct linear regression. This implies the standardized input and output, potentially including exogenic variables, might be unfavorable to explore the full capabilities of neural network–based models in reconstructing and forecasting runoff. In summary, the reconstructed and forecasted runoff based on standardized data can be improved at most by 5% and 16%, respectively. The runoff forecasted from the SI resulted in the lowest NRMSE (i.e., 0.086 or 8.6%). Results from DFA and DCCA also indicated that the standardization process would increase the consistency of reconstructed and forecasted runoff among different methods by minimizing the systematic errors of observed hydrological variables (i.e., P and S).
Nonetheless, substantial discrepancies are still obvious using our proposed approach. The chosen median standardized values should be one of the potential reasons to be further investigated. Relating ENSO and monsoon index (e.g., the Indian summer monsoon index and the western North Pacific monsoon index) quantitatively to the standardized runoff, SPI and SI should help discover the potential for further improvement in the reconstructed and forecasted runoff during abnormal conditions. This further improvement should lie in the methodology for mitigating the climate variability in both the satellite hydrological variables and in situ runoff.
Data availability statement
Publicly available datasets were analyzed in this study. The corresponding links were given in Section 3.
Author contributions
Conceptualization: HF; methodology: HF and LZ; software: LZ and YC; validation: HF, YC, and LZ; formal analysis: HF; investigation: HF; resources: HF; data curation: LZ; writing—original draft preparation: HF; writing—review and editing: HF and YC; visualization: YC; supervision: HF; project administration: HF; funding acquisition: HF. All authors have read and agreed to the published version of the manuscript.
Funding
This study was financially supported by the National Natural Science Foundation of China (NSFC) (Grant Nos. 41974003, 41674007, and 41374010).
Acknowledgments
The Mekong River Commission river discharge data (http://www.mrcmekong.org) were purchased using NSFC Grant No. 41374010, the GPM-TRMM multi-satellite precipitation analysis datasets from https://disc.gsfc.nasa.gov/, and the daily GRACE data calculated by the Institute of Geodesy, Graz University of Technology, available at http://icgem.gfz-potsdam.de/series. We also thank Zhongtian Ma for guiding the stationarity test.
Conflict of interest
The authors declare that the research was conducted in the absence of any commercial or financial relationships that could be construed as a potential conflict of interest.
Publisher’s note
All claims expressed in this article are solely those of the authors and do not necessarily represent those of their affiliated organizations, or those of the publisher, the editors, and the reviewers. Any product that may be evaluated in this article, or claim that may be made by its manufacturer, is not guaranteed or endorsed by the publisher.
Supplementary material
The Supplementary Material for this article can be found online at: https://www.frontiersin.org/articles/10.3389/feart.2022.821592/full#supplementary-material
References
Arias, M. E., Cochrane, T. A., Piman, T., Kummu, M., Caruso, B. S., and Killeen, T. J. (2012). Quantifying changes in flooding and habitats in the Tonle Sap Lake (Cambodia) caused by water infrastructure development and climate change in the Mekong Basin. J. Environ. Manage. 112, 53–66. doi:10.1016/j.jenvman.2012.07.003
Beven, K. J., Kirkby, M. J., Schofield, N., and Tagg, A. F. (1984). Testing a physically based flood forecasting model (TOPMODEL) for three UK catchments. J. Hydrol. X. 69, 119–143. doi:10.1016/0022-1694(84)90159-8
Beven, K. J. (2001). Rainfall-runoff modelling: The primer. Hoboken, NJ, USA: John Wiley Sons Chichester.
Biancamaria, S., Hossain, F., and Lettenmaier, D. P. (2011). Forecasting transboundary river water elevations from space. Geophys. Res. Lett. 38 (11). doi:10.1029/2011GL047290
Birkinshaw, S. J., O’donnell, G. M., Moore, P., Kilsby, C. G., Fowler, H. J., and Berry, P. A. M. (2010). Using satellite altimetry data to augment flow estimation techniques on the Mekong River. Hydrol. Process. 24, 3811–3825. doi:10.1002/hyp.7811
Bogachev, M. I., and Bunde, A. (2012). Universality in the precipitation and river runoff. EPL Europhys. Lett. 97 (4), 48011. doi:10.1209/0295-5075/97/48011
Bunde, A., Bogachev, M. I., and Lennartz, S. (2012). Precipitation and river flow: Long-term memory and predictability of extreme events. Extreme events Nat. hazards Complex. perspective 196, 139–152. doi:10.1029/2011GM001112
Calmant, S., Seyler, F., and Cretaux, J. F. (2008). Monitoring continental surface waters by satellite altimetry. Surv. Geophys. 29, 247–269. doi:10.1007/s10712-008-9051-1
Chang, C. H., Lee, H., Kim, D., Hwang, E., Hossain, F., Chishtie, F., et al. (2020). Hindcast and forecast of daily inundation extents using satellite SAR and altimetry data with rotated empirical orthogonal function analysis: Case study in Tonle Sap Lake Floodplain. Remote Sens. Environ. 241, 111732. doi:10.1016/j.rse.2020.111732
Chen, Y., Fok, H. S., Ma, Z., and Tenzer, R. (2019). Improved remotely sensed total basin discharge and its seasonal error characterization in the yangtze river basin. Sensors 19 (15), 3386. doi:10.3390/s19153386
Cochrane, T. A., Arias, M. E., and Piman, T. (2014). Historical impact of water infrastructure on water levels of the Mekong River and the Tonle Sap system. Hydrol. Earth Syst. Sci. 18, 4529–4541. doi:10.5194/hess-18-4529-2014
Colin, C., Siani, G., Sicre, M.-A., and Liu, Z. (2010). Impact of the East Asian monsoon rainfall changes on the erosion of the Mekong River basin over the past 25, 000 yr. Mar. Geol. 271, 84–92. doi:10.1016/j.margeo.2010.01.013
Cybenko, G. (1989). Approximation by superpositions of a sigmoidal function. Math. Control. Signals, Syst. 2 (4), 303–314.
Devia, G. K., Ganasri, B. P., and Dwarakish, G. S. (2015). A review on hydrological models. Aquat. procedia 4, 1001–1007. doi:10.1016/j.aqpro.2015.02.126
Du, H., Fok, H. S., Chen, Y., and Ma, Z. (2020). Characterization of the recharge-storage-runoff process of the yangtze river source region under climate change. Water 12 (7), 1940. doi:10.3390/w12071940
Easton, Z. M., Fuka, D. R., White, E. D., Collick, A. S., Biruk Ashagre, B., McCartney, M., et al. (2010). A multi basin SWAT model analysis of runoff and sedimentation in the Blue Nile, Ethiopia. Hydrol. Earth Syst. Sci. 14, 1827–1841. doi:10.5194/hess-14-1827-2010
Eslami, S., Hoekstra, P., Trung, N. N., Kantoush, S. A., Van Binh, D., Quang, T. T., et al. (2019). Tidal amplification and salt intrusion in the Mekong Delta driven by anthropogenic sediment starvation. Sci. Rep. 9 (1).
Ferreira, V. G., Montecino, H. C., Ndehedehe, C. E., Heck, B., Gong, Z., de Freitas, S. R. C., et al. (2018). Space-based observations of crustal deflections for drought characterization in Brazil. Sci. Total Environ. 644, 256–273. doi:10.1016/j.scitotenv.2018.06.277
Fok, H. S., and He, Q. (2018). Water level reconstruction based on satellite gravimetry in the yangtze river basin. ISPRS Int. J. Geoinf. 7, 286. doi:10.3390/ijgi7070286
Fok, H. S., He, Q., Chun, K. P., Zhou, Z., and Chu, T. (2018). Application of ENSO and drought indices for water level reconstruction and prediction: A case study in the lower Mekong River estuary. Water 10, 58. doi:10.3390/w10010058
Fok, H. S., Zhou, L., Liu, Y., Tenzer, R., Ma, Z., and Zou, F. (2020). Water balance standardization approach for reconstructing runoff using GPS at the basin upstream. Remote Sens. (Basel). 12 (11), 1767. doi:10.3390/rs12111767
Frappart, F., Minh, K. D., L'Hermitte, J., Cazenave, A., Ramillien, G., Le Toan, T., et al. (2006). Water volume change in the lower Mekong from satellite altimetry and imagery data. Geophys. J. Int. 167 (2), 570–584. doi:10.1111/j.1365-246X.2006.03184.x
Gleason, C. J., and Smith, L. C. (2014). Toward global mapping of river discharge using satellite images and at-many-stations hydraulic geometry. Proc. Natl. Acad. Sci. U. S. A. 111 (13), 4788–4791. doi:10.1073/pnas.1317606111
Grillakis, M. G., Tsanis, I. K., and Koutroulis, A. G. (2010). Application of the HBV hydrological model in a flash flood case in Slovenia. Nat. Hazards Earth Syst. Sci. 10, 2713–2725. doi:10.5194/nhess-10-2713-2010
Gugliotta, M., Saito, Y., Nguyen, V. L., Ta, T. K. O., and Tamura, T. (2019). Sediment distribution and depositional processes along the fluvial to marine transition zone of the Mekong River delta, Vietnam. Sedimentology 66, 146–164. doi:10.1111/sed.12489
Harris, A., Rahman, S., Hossain, F., Yarborough, L., Bagtzoglou, A. C., and Easson, G. (2007). Satellite-based flood modeling using TRMM-based rainfall products. Sensors 7 (12), 3416–3427. doi:10.3390/s7123416
He, Q., Fok, H. S., Chen, Q., and Chun, K. P. (2018). Water level reconstruction and prediction based on space-borne sensors: A case study in the Mekong and yangtze river basins. Sensors 18, 3076. doi:10.3390/s18093076
Hecht, J. S., Lacombe, G., Arias, M. E., Dang, T. D., and Piman, T. (2019). Hydropower dams of the Mekong River basin: A review of their hydrological impacts. J. Hydrol. X. 568, 285–300. doi:10.1016/j.jhydrol.2018.10.045
Hirpa, F. A., Hopson, T. M., De Groeve, T., Brakenridge, G. R., Gebremichael, M., and Restrepo, P. J. (2013). Upstream satellite remote sensing for river discharge forecasting: Application to major rivers in South Asia. Remote Sens. Environ. 131, 140–151. doi:10.1016/j.rse.2012.11.013
Huffman, G. J., Adler, R. F., Bolvin, D. T., Gu, G., Nelkin, E. J., Bowman, K. P., et al. (2007). The TRMM multisatellite precipitation analysis (TMPA): Quasi-global, multiyear, combined-sensor precipitation estimates at fine scales. J. Hydrometeorol. 8, 38–55. doi:10.1175/JHM560.1
Jones, P. D., and Hulme, M. (1996). Calculating regional climatic time series for temperature and precipitation: Methods and illustrations. Int. J. Climatol. 16, 361–377. doi:10.1002/(SICI)1097-0088(199604)16:4<361::AID-JOC53>3.0.CO;2-F
Kantelhardt, J. W., Koscielny‐Bunde, E., Rybski, D., Braun, P., Bunde, A., and Havlin, S. (2006). Long-term persistence and multifractality of precipitation and river runoff records. J. Geophys. Res. 111 (D1), D01106. doi:10.1029/2005JD005881
Kiem, A. S., and Franks, S. W. (2001). On the identification of ENSO-induced rainfall and runoff variability: A comparison of methods and indices. Hydrological Sci. J. 46, 715–727. doi:10.1080/02626660109492866
Kingma, D. P., and Ba, J. (2014). Adam: A method for stochastic optimization. arXiv preprint 2014, arXiv:1412.6980.
Klambauer, G., Unterthiner, T., Mayr, A., and Hochreiter, S. (2017). Self-normalizing neural networks. arXiv preprint 2017, arXiv:1706.02515.
Koscielny-Bunde, E., Kantelhardt, J. W., Braun, P., Bunde, A., and Havlin, S. (2006). Long-term persistence and multifractality of river runoff records: Detrended fluctuation studies. J. Hydrology 322 (1-4), 120–137. doi:10.1016/j.jhydrol.2005.03.004
Kvas, A., Behzadpour, S., Ellmer, M., Klinger, B., Strasser, S., Zehentner, N., et al. (2019). ITSG‐Grace2018: Overview and evaluation of a new GRACE‐only gravity field time series. J. Geophys. Res. Solid Earth 124, 9332–9344. doi:10.1029/2019JB017415
Li, X., Zhang, Q., and Ye, X. (2013). Dry/wet conditions monitoring based on TRMM rainfall data and its reliability validation over Poyang Lake Basin, China. Water 5, 1848–1864. doi:10.3390/w5041848
Li, X., Liu, J. P., Saito, Y., and Nguyen, V. L. (2017). Recent evolution of the Mekong Delta and the impacts of dams. Earth. Sci. Rev. 175, 1–17. doi:10.1016/j.earscirev.2017.10.008
Liu, K. T., Tseng, K., Shum, C. K., Liu, C. Y., Kuo, C. Y., Liu, G., et al. (2016). Assessment of the impact of reservoirs in the upper Mekong River using satellite radar altimetry and remote sensing imageries. Remote Sens. (Basel). 8 (5), 367. doi:10.3390/rs8050367
Lloyd-Hughes, B., and Saunders, M. A. (2002). A drought climatology for Europe. Int. J. Climatol. 22, 1571–1592. doi:10.1002/joc.846
Loc, H. H., Van Binh, D., Park, E., Shrestha, S., Dung, T. D., Son, V. H., et al. (2021). Intensifying saline water intrusion and drought in the Mekong delta: From physical evidence to policy outlooks. Sci. Total Environ. 757, 143919. doi:10.1016/j.scitotenv.2020.143919
Lu, X. X., Li, S., Kummu, M., Padawangi, R., and Wang, J. J. (2014). Observed changes in the water flow at Chiang Saen in the lower Mekong: Impacts of Chinese dams? Quat. Int. 336, 145–157. doi:10.1016/j.quaint.2014.02.006
McKee, T. B., Doesken, N. J., and Kleist, J. (1993). “The relationship of drought frequency and duration to time scales,” in Proceedings of the 8th Conference on Applied Climatology, Anaheim, CA, USA, 17–22 January 1993 (American Meteorological Society). Boston, MA, USA.
Mutuga, K. J., Nyadawa, M. O., and Home, P. G. (2014). Use of downscaled tropical rainfall measuring mission data for meteorological drought monitoring: Case study of Narumoru catchment. Int. J. Adv. Eng. Technol. 7, 1375–1385.
Naresh Kumar, M., Murthy, C. S., Sesha Sai, M. V. R., and Roy, P. S. (2009). On the use of Standardized Precipitation Index (SPI) for drought intensity assessment. Mater. Apps. 16, 381–389. doi:10.1002/met.136
Nash, J. E., and Sutcliffe, J. V. (1970). River flow forecasting through conceptual models part I—a discussion of principles. J. Hydrol. X. 10, 282–290. doi:10.1016/0022-1694(70)90255-6
Naumann, G., Barbosa, P., Carrao, H., Singleton, A., and Vogt, J. (2012). Monitoring drought conditions and their uncertainties in Africa using TRMM data. J. Appl. Meteorol. Climatol. 51, 1867–1874. doi:10.1175/JAMC-D-12-0113.1
Pan, F., and Nichols, J. (2013). Remote sensing of river stage using the cross-sectional inundation area-river stage relationship (IARSR) constructed from digital elevation model data. Hydrol. Process. 27, 3596–3606. doi:10.1002/hyp.9469
Pearson, K. (1920). Notes on the history of correlation. Biometrika 13 (1), 25–45. doi:10.1093/biomet/13.1.25
Peng, C. K., Buldyrev, S. V., Havlin, S., Simons, M., Stanley, H. E., and Goldberger, A. L. (1994). Mosaic organization of DNA nucleotides. Phys. Rev. E 49 (2), 1685–1689. doi:10.1103/PhysRevE.49.1685
Peng, H., Fok, H. S., Gong, J., and Wang, L. (2020). Improving stage–discharge relation in the Mekong River Estuary by remotely sensed long-period ocean tides. Remote Sens. (Basel). 12 (21), 3648. doi:10.3390/rs12213648
Podobnik, B., and Stanley, H. E. (2008). Detrended cross-correlation analysis: A new method for analyzing two nonstationary time series. Phys. Rev. Lett. 100 (8), 084102. doi:10.1103/PhysRevLett.100.084102
Räsänen, T. A., and Kummu, M. (2013). Spatiotemporal influences of ENSO on precipitation and flood pulse in the Mekong River Basin. J. Hydrol. X. 476, 154–168. doi:10.1016/j.jhydrol.2012.10.028
Räsänen, T. A., Someth, P., Lauri, H., Koponen, J., Sarkkula, J., and Kummu, M. (2017). Observed river discharge changes due to hydropower operations in the Upper Mekong Basin. J. Hydrol. X. 545, 28–41. doi:10.1016/j.jhydrol.2016.12.023
Reggiani, P., and Rientjes, T. H. M. (2005). Flux parameterization in the representative elementary watershed approach: Application to a natural basin. Water Resour. Res. 41. doi:10.1029/2004wr003693
Riegger, J., and Tourian, M. J. (2014). Characterization of runoff-storage relationships by satellite gravimetry and remote sensing. Water Resour. Res. 50, 3444–3466. doi:10.1002/2013WR013847
Rumelhart, D. E., Hinton, G. E., and Williams, R. J. (1986). Learning representations by back-propagating errors. Nature 323, 533–536. doi:10.1038/323533a0
Sahoo, A., Samantaray, S., and Ghose, D. K. (2019). Stream flow forecasting in Mahanadi River Basin using artificial neural networks. Procedia Comput. Sci. 157, 168–174. doi:10.1016/j.procs.2019.08.154
Samantaray, S., and Ghose, D. K. (2019). “Dynamic modelling of runoff in a watershed using artificial neural network,” in Smart intelligent computing and applications (Singapore: Springer), 561–568.
Shirmohammadi-Aliakbarkhani, Z., and Akbari, A. (2020). Ground validation of diurnal TRMM 3B42 V7 and GPM precipitation products over the northeast of Iran. Theor. Appl. Climatol. 142 (3), 1413–1423. doi:10.1007/s00704-020-03392-0
Singh, R., Subramanian, K., and Refsgaard, J. C. (1999). Hydrological modelling of a small watershed using MIKE SHE for irrigation planning. Agric. Water Manag. 41, 149–166. doi:10.1016/s0378-3774(99)00022-0
Smith, L. C. (1997). Satellite remote sensing of river inundation area, stage, and discharge: A review. Hydrol. Process. 11 (10), 1427–1439. doi:10.1002/(sici)1099-1085(199708)11:10<1427::aid-hyp473>3.0.co;2-s
Sneeuw, N., Lorenz, C., Devaraju, B., Tourian, M. J., Riegger, J., Kunstmann, H., et al. (2014). Estimating runoff using hydro-geodetic approaches. Surv. Geophys. 35, 1333–1359. doi:10.1007/s10712-014-9300-4
Sproles, E. A., Reager, J. T., Leibowitz, S. G., Wigington, P. J., Famiglietti, J. S., and Patil, S. D. (2015). GRACE storage-runoff hystereses reveal the dynamics of regional watersheds. Hydrol. Earth Syst. Sci. 19, 3253–3272. doi:10.5194/hess-19-3253-2015
Su, F., Gao, H., Huffman, G. J., and Lettenmaier, D. P. (2011). Potential utility of the real-time TMPA-RT precipitation estimates in streamflow prediction. J. Hydrometeorol. 12 (3), 444–455. doi:10.1175/2010JHM1353.1
Su, F., Hong, Y., and Lettenmaier, D. P. (2008). Evaluation of TRMM multisatellite precipitation analysis (TMPA) and its utility in hydrologic prediction in the La plata basin. J. Hydrometeorol. 9, 622–640. doi:10.1175/2007JHM944.1
Sulistioadi, Y. B., Tseng, K. H., Shum, C. K., Hidayat, H., Sumaryono, M., Suhardiman, A., et al. (2015). Satellite radar altimetry for monitoring small rivers and lakes in Indonesia. Hydrol. Earth Syst. Sci. 19, 341–359. doi:10.5194/hess-19-341-2015
Syed, T. H., Famiglietti, J. S., and Chambers, D. P. (2009). GRACE-based estimates of terrestrial freshwater discharge from basin to continental scales. J. Hydrometeorol. 10, 22–40. doi:10.1175/2008JHM993.1
Tang, J., Yin, X. A., Yang, P., and Yang, Z. F. (2014). Assessment of contributions of climatic variation and human activities to streamflow changes in the Lancang River, China. Water Resour. manage. 28, 2953–2966. doi:10.1007/s11269-014-0648-5
Tao, H., Fischer, T., Zeng, Y., and Fraedrich, K. (2016). Evaluation of TRMM 3B43 precipitation data for drought monitoring in Jiangsu Province, China. Water 8, 221. doi:10.3390/w8060221
Tekeli, A. E., and Fouli, H. (2016). Evaluation of TRMM satellite-based precipitation indexes for flood forecasting over Riyadh City, Saudi Arabia. J. Hydrol. X. 541, 471–479. doi:10.1016/j.jhydrol.2016.01.014
Tourian, M. J., Schwatke, C., and Sneeuw, N. (2017). River discharge estimation at daily resolution from satellite altimetry over an entire river basin. J. Hydrol. X. 546, 230–247. doi:10.1016/j.jhydrol.2017.01.009
Tourian, M. J., Sneeuw, N., and Bárdossy, A. (2013). A quantile function approach to discharge estimation from satellite altimetry (ENVISAT). Water Resour. Res. 49, 4174–4186. doi:10.1002/wrcr.20348
Wahr, J., Swenson, S., Zlotnicki, V., and Velicogna, I. (2004). Time‐variable gravity from GRACE: First results. Geophys. Res. Lett. 31 (11), L11501. doi:10.1029/2004GL019779
Wang, W. C., Chau, K. W., Cheng, C. T., and Qiu, L. (2009). A comparison of performance of several artificial intelligence methods for forecasting monthly discharge time series. J. Hydrol. X. 374, 294–306. doi:10.1016/j.jhydrol.2009.06.019
Xue, Z., Liu, J. P., and Ge, Q. (2011). Changes in hydrology and sediment delivery of the Mekong River in the last 50 years: Connection to damming, monsoon, and ENSO. Earth Surf. Process. Landf. 36, 296–308. doi:10.1002/esp.2036
Yan, N., Wu, B., Chang, S., and Bao, X. (2014). Evaluation of TRMM precipitation product for meteorological drought monitoring in hai basin. IOP Conf. Ser. Earth Environ. Sci. 17, 012093. doi:10.1088/1755-1315/17/1/012093
Yan, Y., Wu, H., Gu, G., Huang, Z., Alfieri, L., Li, X., et al. (2020). Climatology and interannual variability of floods during the TRMM era (1998–2013). J. Clim. 33 (8), 3289–3305. doi:10.1175/JCLI-D-19-0415.1
Yue, W., Xu, J., Tan, W., and Xu, L. (2007). The relationship between land surface temperature and NDVI with remote sensing: Application to shanghai landsat 7 ETM+ data. Int. J. Remote Sens. 28 (15), 3205–3226. doi:10.1080/01431160500306906
Zebende, G. F. (2011). DCCA cross-correlation coefficient: Quantifying level of cross-correlation. Phys. A Stat. Mech. its Appl. 390 (4), 614–618. doi:10.1016/j.physa.2010.10.022
Zhang, S., Liu, C., Yao, Z., and Guo, L. (2007). Experimental study on lag time for a small watershed. Hydrol. Process. 21 (8), 1045–1054. doi:10.1002/hyp.6285
Keywords: daily runoff estimate, Mekong Basin, GRACE water storage, GPM-TRMM precipitation, ENSO
Citation: Fok HS, Chen Y and Zhou L (2022) Daily runoff and its potential error sources reconstructed using individual satellite hydrological variables at the basin upstream. Front. Earth Sci. 10:821592. doi: 10.3389/feart.2022.821592
Received: 24 November 2021; Accepted: 22 September 2022;
Published: 01 November 2022.
Edited by:
Vladan Babovic, National University of Singapore, SingaporeReviewed by:
Sandeep Samantaray, Odisha University of Technology and Research, IndiaVagner Ferreira, Hohai University, China
Mikhail I. Bogachev, Saint Petersburg State Electrotechnical University, Russia
Qing He, Huazhong University of Science and Technology, China
Copyright © 2022 Fok, Chen and Zhou. This is an open-access article distributed under the terms of the Creative Commons Attribution License (CC BY). The use, distribution or reproduction in other forums is permitted, provided the original author(s) and the copyright owner(s) are credited and that the original publication in this journal is cited, in accordance with accepted academic practice. No use, distribution or reproduction is permitted which does not comply with these terms.
*Correspondence: Hok Sum Fok, eHNoaHVvQHNnZy53aHUuZWR1LmNu