 Yanbo Zhu
 Futong Li1
 Hengxing Lan
- 1College of Geological Engineering and Geomatics, Chang’an University, Xi’an, China
- 2Institute of Geographic Sciences and Natural Resources Research, CAS, Beijing, China
The progressive failure of earthen check dams triggered by upstream flow is common in loess gullies on the Loess Plateau of China. However, studies on the formation mechanism of progressive failure are still unclear. To investigate the failure modes and progressive failure process of earthen check dams, a physical model test on an earthen dam influenced by upstream flow was conducted by monitoring and analyzing hydrologic and mechanical parameters, including water content, pore water pressure, soil stress, and displacement. The test results indicate that the progressive failure process of earthen dams is induced by seepage water discharged on the downstream slope, including slope slide and overtopping. Continuous seepage results in the occurrence of creep at the toe, gradually driving the deformation and sliding of the dam slope. The progressive failure begins in the downstream slopes, and this study focuses on analyzing the initiation mechanism of slope slide. The slope failure presents retrogressive sliding, including four repeated slip failures, and each sliding presents a long-time progressive process. This physical model test reproduces the entire life cycle of earthen check dams and reveals the traction sliding mechanism of dams, which is consistent with field observation. The aforementioned results provide an important reference for understanding the failure mechanism of earthen check dams triggered by upstream flow.
1 Introduction
The Chinese Loess Plateau is the most severely eroded area in the world (Hessel, 2006; Fu et al., 2017), and check dams are important and effective measures for erosion control in plateau catchments that experience torrents (Romero et al., 2012; Conesa and Lenzi, 2013; Zhao et al., 2017). Up to 2020, nearly 163,000 check dams have been built, mainly on tributary channels under the project “Gully Land Consolidation” (GLC) (Jin et al., 2019). However, because of low design standards, most check dams built without flood discharge facilities or spillways had relatively short lives as they rapidly filled with sediment or were breached by extreme flood events (Zhao et al., 2017; Fang et al., 2019). For example, 516 check dams in Yan’An city, China, were damaged by the “7.26” extreme rainstorm on July 26, 2017 (Yang et al., 2020). Therefore, understanding check dam failure is crucial for risk assessment and decision-making.
The failure modes of dams generally include overtopping, piping, and slope failure (Okeke and Wang, 2016; Rifai et al., 2017; Zhu et al., 2020; Kouzehgar et al., 2021). These modes are affected by many factors such as construction materials, geometry of the dam, upstream flow, and channel bed conditions (Gregoretti et al., 2010; Chen et al., 2015; Jiang et al., 2020a). Check dams on the Loess Plateau are most likely to be destroyed by inflow corresponding to extreme rainstorms (Yang et al., 2020). Approximately 53% of check dam accidents there are caused by permeability damage due to upstream inflow (Foster et al., 2000; Xu et al., 2019). Therefore, it is necessary to study the seepage failure modes of check dams.
The dam failure process is a complex interaction between water and sediment, involving hydraulics, soil mechanics, and sediment movement mechanics (Li et al., 2020). Most dams experienced a suite of quantitative and qualitative changes prior to failure (Wang et al., 2018). Seepage is usually observed during impounding (Jiang et al., 2020b), and seepage flow could cause a progressive variation of the internal structure of the dam, leading to dam failure (Dunning et al., 2006; Richard and Reddy, 2007; Wang et al., 2018). Many model tests (Gregoretti et al., 2010; Chen et al., 2015; Zhu et al., 2019), along with field observation (Xu et al., 2019; Zhang et al., 2019) and numerical simulation (Calamak et al., 2020; Marti et al., 2020), have been used to study the seepage failure progress and mechanism of dam-breaks worldwide. However, research studies on the progressive failure of check dams in the Loess Plateau are limited.
The progressive failure process of check dams caused by seepage failure on the plateau is complex due to the particularity of loess, the special structure of check dams, extreme rainfall, and unqualified construction and management (2014; Xu et al., 2019; Yang et al., 2020). Unfortunately, because most of the check dam controlled areas on the Loess Plateau contain no hydrometeorological stations (Li et al., 2016), the research on the failure of check dams is mainly through field investigation and remote sensing before and after the dam failure (Xu et al., 2019; Zhang et al., 2019). Furthermore, real-life dam failure events in the plateau have been poorly documented because there were few eyewitnesses or lack of field monitoring, so the details of progressive failure are unclear, for example, the hydraulic evolution and the erosion characteristics in progressive failure mode are still unknown (Wu et al., 2011). The aforementioned research on check dam failure, whether by field investigation or numerical simulation, must be verified by physical experiments to better understand the spectrum of failure processes and mechanisms (Zhang et al., 2019). The progressive failure mechanism of natural dams is mainly seepage and overtopping erosion (Cao et al., 2011), but the seepage and the induced instability of the downstream slope were less mentioned (Jiang et al., 2019), especially for the progressive slope failure mode of natural dams (Jiang et al., 2020a).
Therefore, in this study, we conducted a physical model test to study the failure process of earthen check dams triggered by upstream flow based on a scaled prototype. To achieve this objective, variations in water content, pore water pressure, soil stress, and displacement of the model dam were monitored during the experiment. Based on these data, we explored and analyzed the characteristics of the progressive failure process and the failure mechanism of earthen check dams. The results of this study provide valuable insights into the failure process of earthen check dams and thus are useful for preventing future failures.
2 Materials and Methods
2.1 Dam Break Event
The study area is located in a small watershed called Xingshuyaozi in Yan’An city, Shaanxi Province. Earthen check dam #19 that failed due to seepage in this watershed, as shown in Figure 1, was chosen as the experimental prototype in the present model test. The natural dam crest width and the height of check dam #19 are 3.8 and 6.0 m, respectively. The length of the dam was about 37 m, with upstream and downstream slopes of 50° and 45°, respectively. A small reservoir with a depth of 5 m formed at the back of the dam from upstream runoff because the check dam had no spillway or other drainage capabilities. This natural dam was built in the winter of 2017 under the “Gully Land Consolidation” project, and it broke on April 30, 2018, due to seepage. Notably, the failure of the downstream slope is a progressive process accompanied by four sliding events, which were observed by cameras (Figure 2). The continuous seepage resulted in the first sliding of the dam on April 30, 2018 (Figure 2A). With continuous creep of the dam, the second, third, and fourth failures of the dam occurred on June 30, July 29, and August 13, 2018, respectively (Figures 2B–D). Finally, the overtopping occurred due to the four successive slides (Figure 2E). Each dam breach event is a slow creep process.
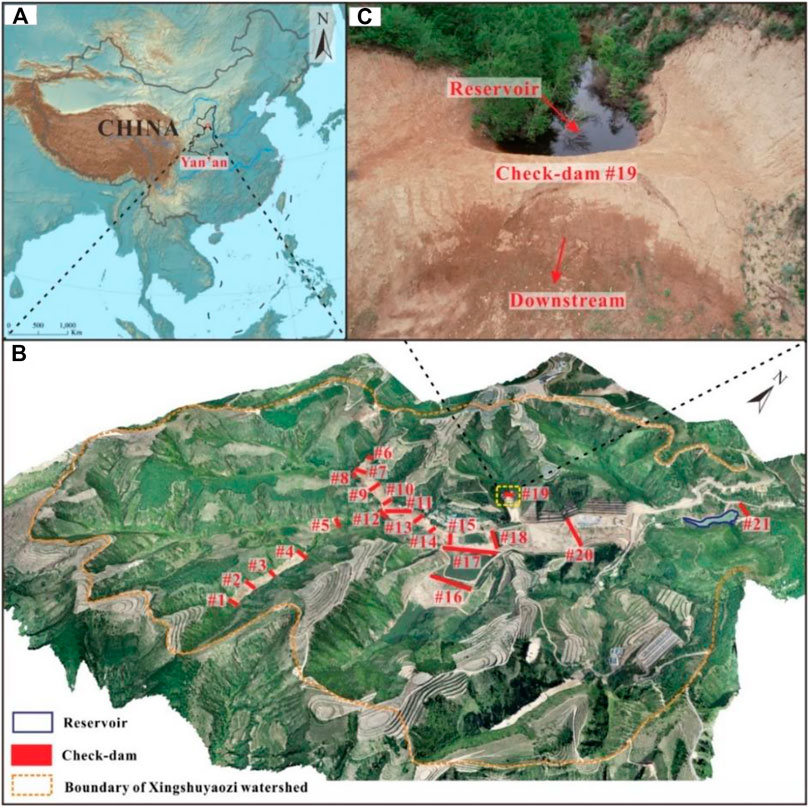
FIGURE 1. Location of research area and studying check dam. (A) Research location, (B) remote sensing image of research watershed based on UAV, and (C) research check dam.
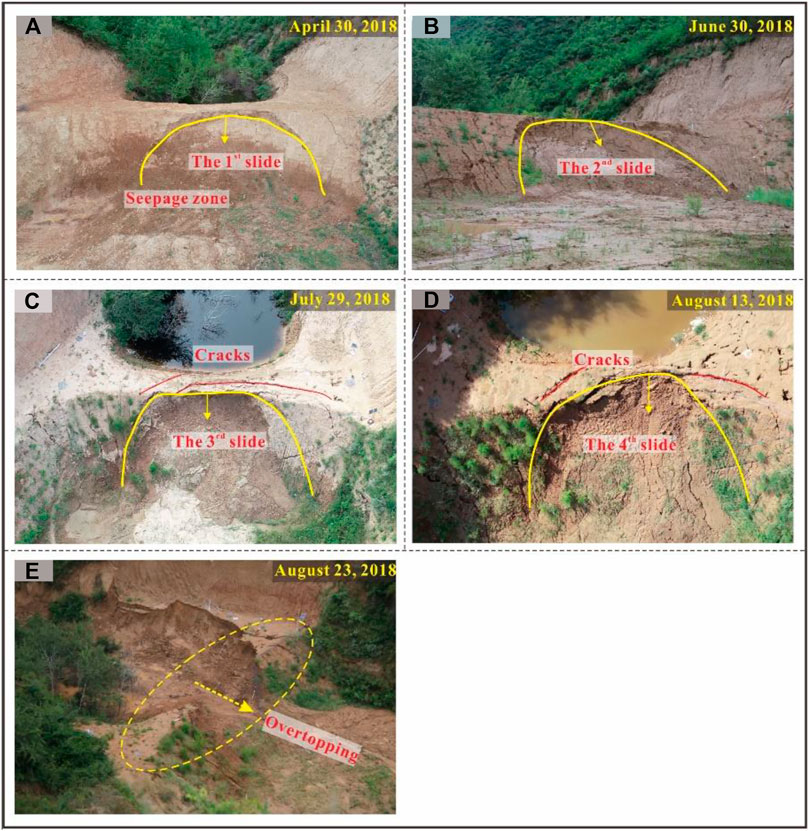
FIGURE 2. Progressive failure process of prototype dam. (A) First slide, (B) second slide, (C) third slide, (D) fourth slide, and (E) overtopping.
2.2 Model Design and Model Materials
To study the mechanism of progressive failure of natural check dams, we designed a physical model test based on a prototype dam. According to earthen check dam design data, the size of the chamber, and topographic features of the dam site, the geometric proportion of this experiment was determined to be 1:10. Based on geometrical similarity, the height and crest width of the earthen check dam model were set at 0.6 and 0.38 m, respectively. The upstream and downstream slopes of the model dam were set at 50° and 45°, respectively, the same as the prototype dam. In order to simulate the hydrologic conditions of the prototype dam as much as possible in the model test, we set the height of water storage behind the model dam at 0.5 m, referring to the ratio of water storage height on-site to the prototype dam height. The model material is consistent with the natural dam material, which is homogeneous compacted loess. The grain size distribution curve of the dam material is shown in Figure 3, indicating that the dam material consists of clay (particle diameter less than 0.005 mm), silt (particle diameter between 0.005 and 0.075 mm), and sand (particle diameter greater than 0.075 mm), with contents of 29.62, 69.01, and 1.37%, respectively. According to the particle size distribution test, the median diameters d50, the coefficient of non-uniformity, and the coefficient of curvature of the soil material are 0.025 mm, 12.71, and 1.83, respectively. The physical parameters of the material are obtained at 29.29% of the liquid limit and 16.46% of the plastic limit. The compaction density of the test model is consistent with the dry density of the natural check dam body, which is 1.51 g/cm3. The initial moisture content of the compacted model material is configured at 15%. Under this moisture content, the strength parameters of the model material such as cohesion and friction angle are 22.52 kPa and 24.03°, respectively; and the permeability coefficient is 1.46
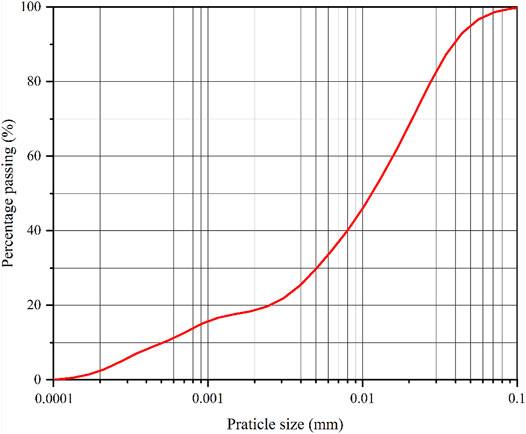
FIGURE 3. Particle size distribution of dam material.
2.3 Experimental Apparatus and Procedures
The physical model test was carried out by a specially designed chamber in the Geological Hazard Simulation Laboratory at Chang’an University (Figure 4A). The chamber was 3.6 m in length, 1.2 m in width, and 1.35 m in height. The gradient of the bottom of the model chamber made of welded steel was zero. On clear reinforced glass installed on both sides of the model chamber, 5 × 5-cm grids were drawn to assist in the observation of the phreatic line and dam deformation. The back and bottom of the model chamber were sealed with a steel disc, while the top and front sides remained open. Therefore, the bottom, left, and right sides of the model container formed impermeable boundaries. We located a storage tank with a length of 0.6 m, a width of 1.2 m, and a depth of 1.35 m at the head of the chamber. Water can be poured into it, and we can read the level of water from a liquid level indicator installed on the side of the tank. The collection pool, with a length of 1.4 m, a width of 1.2 m, and a depth of 1.0 m, was positioned at the toe of the model chamber to store water and mud exiting from upstream.
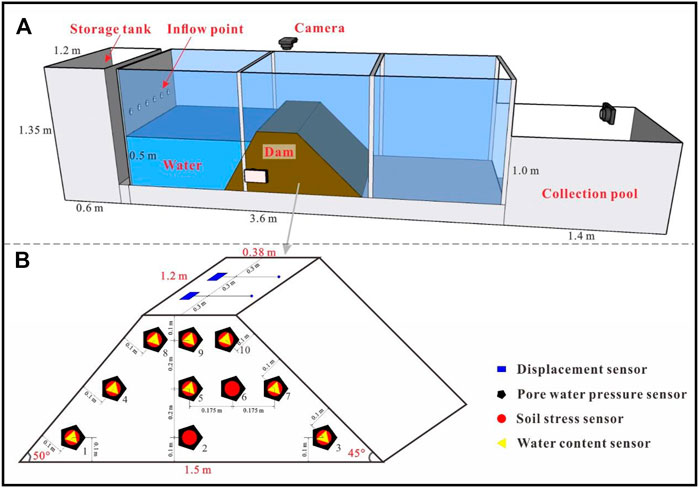
FIGURE 4. Schematic diagram of the experimental setup. (A) Developed model test chamber and (B) sensors layout in the test model.
First, we drew an outline of the model dam on the glass of the chamber according to its proposed shape and size. Then, we applied a density-controlled method to build the model dam. To ensure structural homogeneity, six layers of soil, each with a thickness of 10 cm, were compacted into the model container. Prior to packing, the soil samples were successively tedded, crushed, broken, and sieved through 2-mm sieves. The sieved soil samples were subsequently spread evenly in the model container and compacted with a dry density of 1.50 g/cm3 and a water content of 15%. After finishing each layer, the interfaces between each layer were roughed to minimize the boundary influence on the experimental results. It should be noted that a 10-cm-thick cushion with a water content of 15% and a density of 2.0 g/cm3 was laid at the bottom of the model container to avoid the generation of concentrated seepage at the contact between the metal plate and the model dam. After construction, the dam model (Figure 4A) was allowed to stand for 72 h. During the experiment, water can be discharged quickly from the water tank to simulate the upstream flow, and a small reservoir forms at the rear of the model dam. In addition, the valve behind the storage tank can be adjusted to keep the water level at the rear of the dam constant during testing.
2.4 Measurements
We monitored various hydrologic and mechanical parameters, including water content, pore water pressure, soil stress, and displacement of the model dam. Ten monitoring points were arranged fully inside the model dam, and all but two displacement sensors were located on the central axis of the dam; the locations of the sensors are shown in Figure 4B. Each monitoring point contained one pore water pressure sensor (ATJ-6007, with a measurement range of 0–20 kPa, accuracy = ±0.5%), one soil stress sensor (ATJ-7002, with a measurement range of 0–200 kPa, accuracy = ±0.5%), and one water content sensor (EC-5, with a measurement range of 0–100%, accuracy = ±0.25%). Besides, there were two displacement sensors (MPS-S-2000MM-V1, with a measurement range of 0–2000 mm, accuracy = ±0.1%) at the crest of the model dam, which monitored the generation and evolution of crevices at the dam crest. All sensors have factory calibrations that give us the needed conversion formulas. Sensors automatically send pore water pressure, soil stress, water content, and displacement through an iDAQ-1800 dynamic data acquisition instrument. The data acquisition rate was five per second. All of the sensors connected to the corresponding data acquisition instruments were calibrated before the test. To capture the deformation evolution of the check dam, three digital video cameras collected side, front, and vertical views, as shown in Figure 4A. Based on the images of the dam morphology change, the deformation strain field of the model dam can be analyzed by the image processing technique DIC (He et al., 2020).
3 Results
3.1 General Features
The failure progress of the test model lasted 258.2 h from seepage to dam breach. Three significant features of the progressive failure were observed: seepage on the downstream slope, sliding of the downstream slope, and overtopping (Figure 5). The seepage stage lasted 24 h. The slope sliding stage began at the 24 h mark and lasted 232 h until the final overtopping at 256 h. Figure 5A shows that in the seepage stage, water was driven by hydrodynamic force under the upstream slope, causing the soil there to reach the saturation point. At this point, the toe of the downstream slope begins to creep, generating tension cracks in the middle part of the downstream slope extending to both sides (Figure 5B). Crack formation announces the arrival of the sliding stage, also a complex progressive process. Figure 5B depicts views of four different sliding events, which lasted 21, 35, 70, and 106 h, respectively. Note that the volume of each slide gradually increases and shows an obvious retrogressive tendency, that is, the slope progressively fails from toe to crest. After the multiple sliding of the downstream slope, the height of the dam decreases, and water behind quickly overflows the crest, forming a breach and rapidly destroying the dam (Figure 5C).
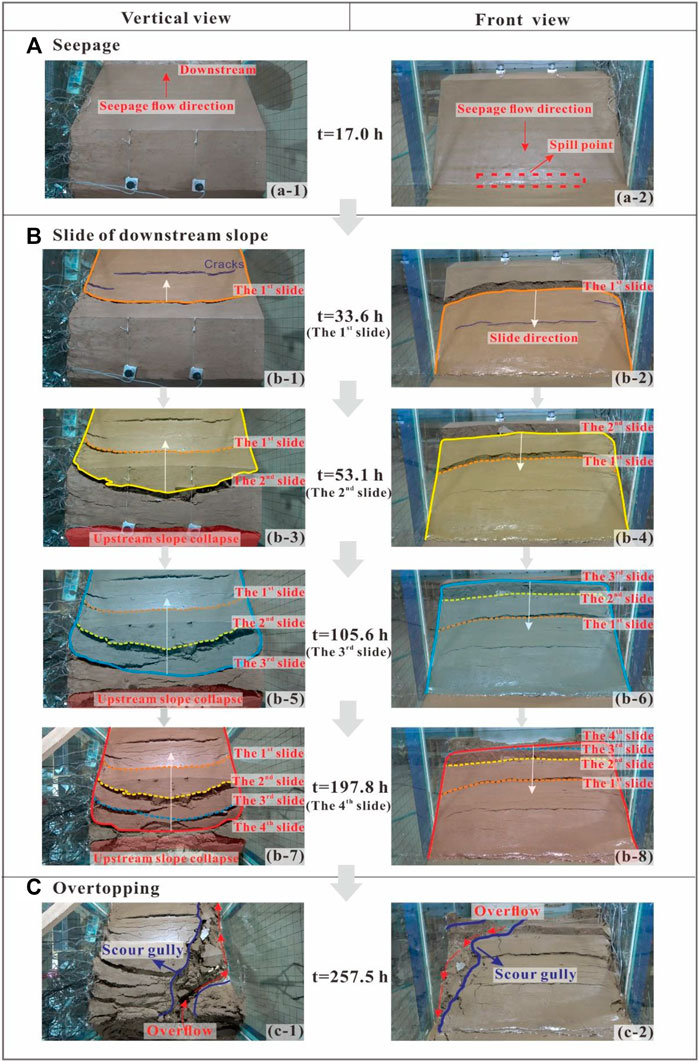
FIGURE 5. Progressive failure process of model dam by vertical view and front view. (A) Seepage, (B) slide of downstream slope, and (C) overtopping.
3.2 Characteristics of Progressive Failure
The progressive failure process of the model dam is comprehensively reflected by the morphological changes of the dam slope and the variations monitored by the sensors in the dam body. The detailed progressive characteristics of each stage are analyzed in the following section.
3.2.1 Characteristics of Seepage Flow
Figure 6A plots the evolution line of capillary flows inside the dam at different moments obtained by the camera. The capillary flow line started upstream and gradually moved downstream in a vertical shape. The basic water level, along with the trapezoidal dam shape and significant capillarity of compacted loess, induced the aforementioned features of the capillary flow evolution. Note that the capillary flow line in the dam crest is distributed above the static water level because of the strong capillarity of compacted loess (see area affected by capillarity in Figure 6A). With the development of the phreatic line, the spill point of the seepage gradually moved upward toward the dam crest, causing the soil below the spill point to become saturated and softened, resulting in the reduction of its strength. Then, the seepage flow leads to the creep deformation of the downstream slope. The strain field during seepage processed by DIC is shown in Figure 6B, which indicates that the displacement, which is reflected by the concentrated strain at the toe, gradually moved upstream. This continuous creep at the toe of the dam contributed to the instability of the downstream slope.
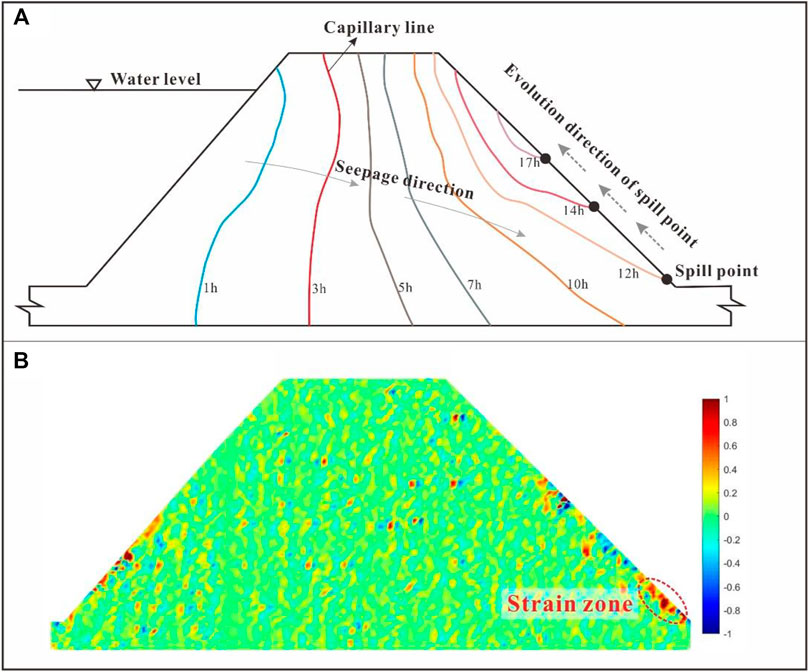
FIGURE 6. Evolution of the capillary line inside the dam. (A) Positions of the capillary line at different times during seepage process and (B) strain field of model dam during seepage from side view by DIC.
The responses of water content, pore water pressure, and soil stress can better reveal the seepage process described earlier (Figure 7). Figure 7A shows the variation of water content response to seepage with a range of 15–45%. Notably, three variations of water content behavior are evident: 1) The water content increases to the maximum value in a short period of time after the capillary line reaches the monitoring sensors and then remains constant (e.g., W-1 and W-4); 2) the water content gradually increases to the maximum value and then remains constant (e.g., W-9 and W-10); and 3) the variation of the water content shows a hysteresis reflection with different sensors. This hysteresis reflection of water content relates to the distance between the moisture sensor and the water storage behind the dam. It is precisely because of the different sensor positions that a lag in content water evolution was observed. According to Figure 7A, the water content response sequence was, in turn, upstream sensors (W-1, W-4, and W-8), then middle (W-5 and W-9), and downstream sensors (W-3, W-7, and W-10). This hysteresis reflection of water content corresponds to the evolution process of the seepage flow (see Figure 6A and Figure 7A).
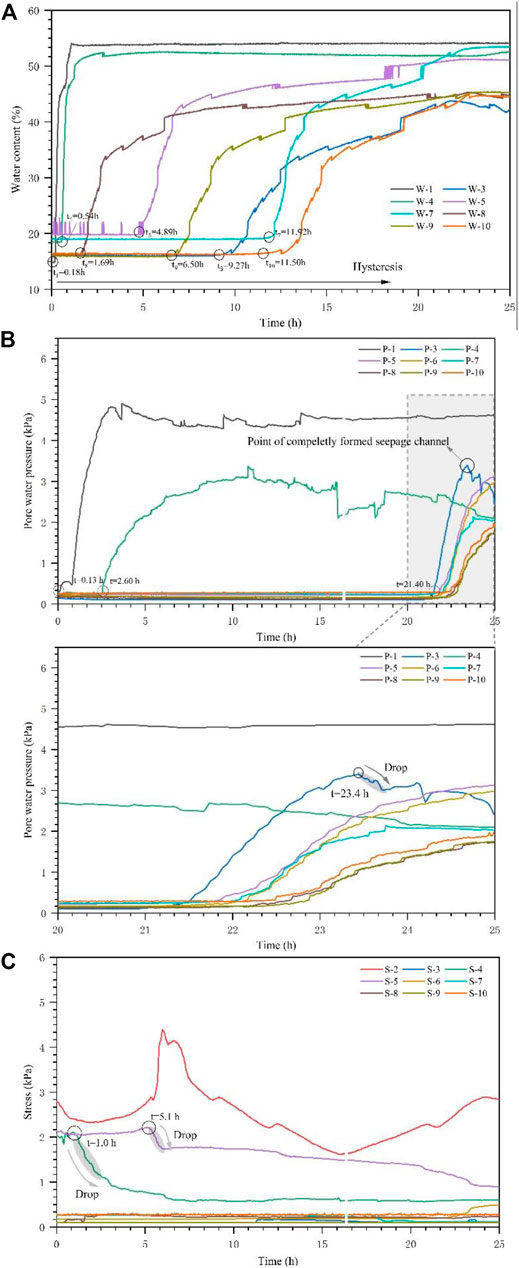
FIGURE 7. Variation of water content, pore water pressure and soil stress during seepage process. (A) Water content, (B) pore water pressure, and (C) soil stress.
Figure 7B illustrates the variation of pore water pressure with time during seepage. Obviously, the pore water pressure is a time-dependent value with a range of 0.1–4.9 kPa. Once the seepage reaches the sensor position, the pore water pressure increases rapidly. For example, the pore water pressure at P-1 has the largest value of 4.9 kPa because the P-1 sensor is closest to the reservoir and at the lowest position. Notably, as the seepage channel completely formed at the bottom of the dam, the pore water pressure dissipated. For example, the pore water pressure at position P-3 dropped to 0.40 kPa. The pore water pressure is also a position-dependent value. Compared to sensors inside the upstream dam, the pore water pressure of sensors inside the downstream dam showed a hysteresis reflection due to the long seepage distance (see Figure 7B). For example, the pore water pressure of the sensors P-1 and P-4 responded first, with a sharp increase at 0.13 and 2.60 h, respectively. The sensors located at the downstream toe of the slope responded in turn at the time of 21.40 h.
The soil stress of some sensors has an obvious response to seepage flow (Figure 7C), such as the fluctuation change of soil stress at the sensors S-2, S-4, and S-5 that corresponds to the changes in the moisture content and pore water pressure. For example, the soil stress of the sensors S-4 and S-5 drops sharply at 1.0 and 5.1 h, respectively, and then decreases continuously with time. The decrease in soil stress corresponds to the rise in water content because when the seepage flow reaches these positions, the increase in the water content reduces the cohesion of the soil, resulting in a sharp drop in the lateral pressure. The soil stress of the sensor S-2 located at the bottom of the dam recorded fluctuating, increasing, and decreasing trends. This is because the continuous seepage leads to a reduction in soil strength, and thus, the lateral pressure between the dam and soil changes constantly.
In general, during the seepage stage, the capillary line continues to spread downstream and the water content of the dam soil rises gradually, resulting in an increase in pore water pressure and a drop in soil stress. Continuous seepage leads to creep deformation of the downstream slope, which in turn leads to eventual slope sliding.
3.2.2 Development of Slope Failure
3.2.2.1 Variation of Dam Morphology
The progressive slope failure process of the model dam lasted about 232 h, during which four sliding events occurred, namely, the first slide, second slide, third slide, and fourth slide. Every slide event was progressive and long-lasting, with a gradually increasing volume, which can be seen from the position of the edge of the sliding body. Figure 8 shows the progressive development of the first slide from front and vertical views. The first slide was a progressive failure process that lasted for 21 h, including the creep of the slope toe, crack initiation and penetration in the dam, and slope sliding. Ongoing seepage softened the dam soil at the slope toe (Figures 8A–1), and the slope there showed obvious creep behavior. This creep behavior generated displacement of the slope toe, which can be identified by the strain zones representing extrusion deformation processed by DIC (Figures 8A–2). With continuous creep deformation, the deformation zone at the slope toe expanded (Figures 8B–1), and some tensile cracks formed on the downstream slope surface due to the stress concentration (Figures 8B–2). Then the tensile cracks penetrated into the dam with a maximum width of 1.5 cm (Figures 8C–1). The increased strain zones extending on the entire downstream slope surface warns the emergence of the large sliding deformation of the slope (Figures 8C–2). Finally, with further creep, the sliding zone formed, causing the first slide (Figures 8D–1 and Figures 8D–2). After sliding, the maximum tension crack width at the rear edge is about 9 cm (Figures 8D–1).
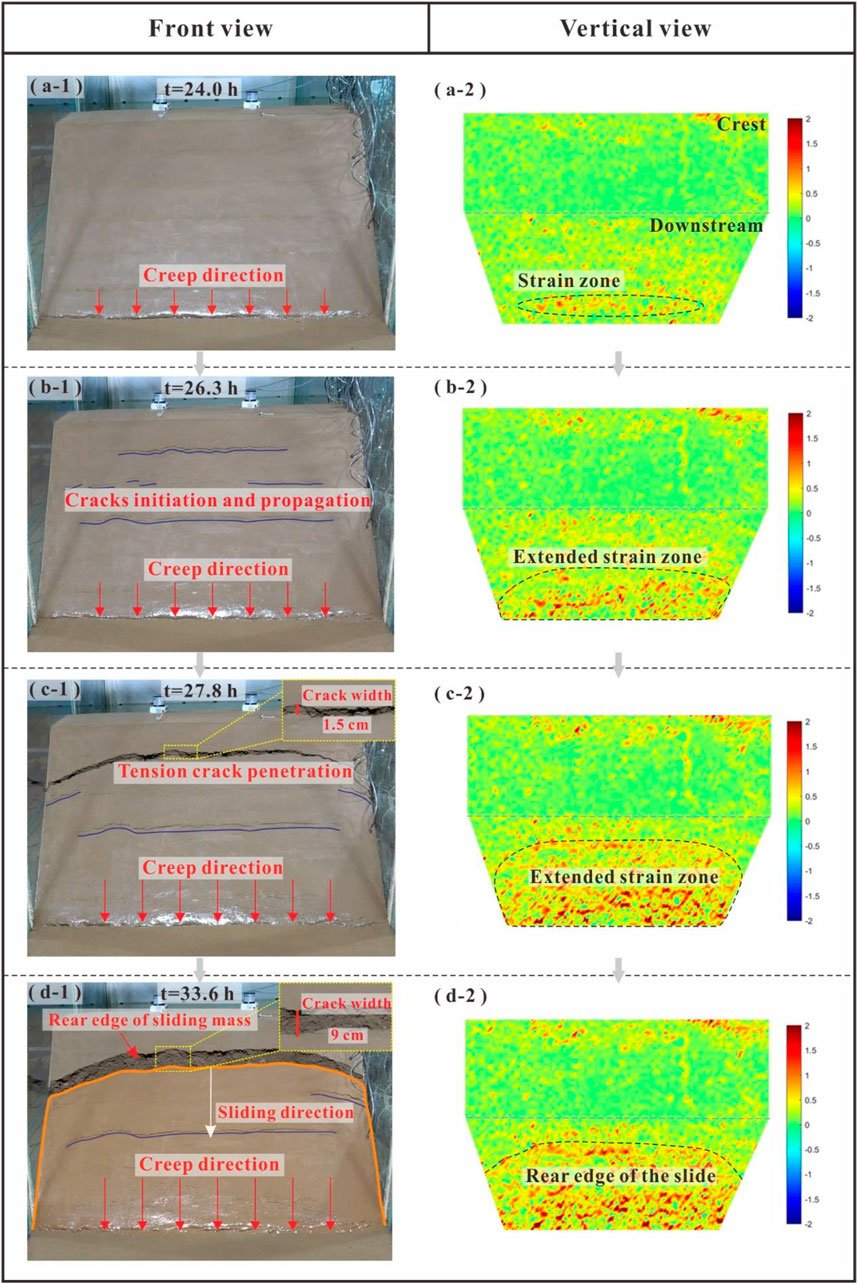
FIGURE 8. Progressive process of the first slide from front view and vertical view. (A) Creep at the dam toe, (B) crack initiation and propagation, (C) crack penetration, and (D) sliding.
Figure 9 shows the progressive development of the second slide from the vertical view. The second slide is also a creep-controlled process that lasted for 35 h, including crack initiation, crack propagation, crack penetration in the dam, and slope sliding. After the first slide, continuous seepage caused the dam body to continue to deform downstream (Figures 9A–1), shown as the red strain area in Figures 9A–2. The continuous creep of the dam body initiated tensile cracks in the back wall of the first sliding body. With further creep, the crack on the dam crest continued to expand (Figures 9B–1A) and a large strain concentration appeared on the crest of the dam (Figures 9B–2). Then, with the tension cracks on the top of the dam body penetrating (Figures 9C–1), the multiple cracks gradually developed internally, forming an arc-shaped sliding surface (Figures 9D–1). Finally, the second slide occurred at 53.1 h. The red strain zone on the dam body represents the sliding body, and the red strain band on the dam crest top represents the edge of the second slide (Figures 9C–2 and Figures 9D–2). The third slide and fourth slide also show a creep-controlled sliding process, including crack initiation, crack propagation, crack penetration, and slope sliding following in a similar fashion as the first slide and second slide. Each sliding evolution process can not only be observed from the above macroscopic morphological changes but also from the quantitative data, such as pore water pressure, soil stress, and displacement, obtained from the monitoring sensors.
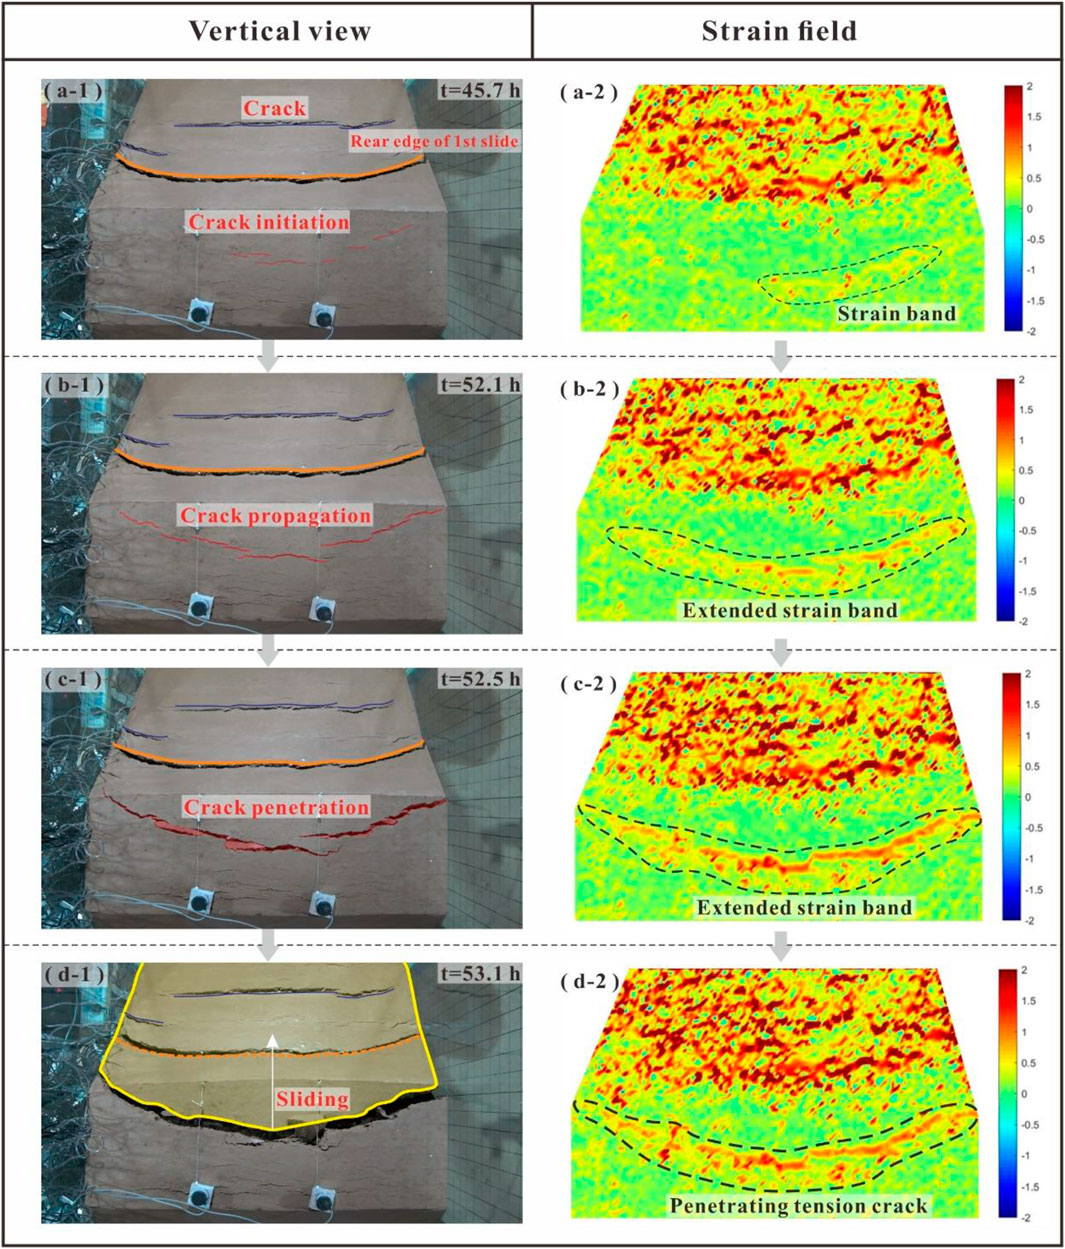
FIGURE 9. Progressive process of the second slide from the vertical view. (A) Crack initiation, (B) crack propagation, (C) crack penetration, and (D) sliding.
3.2.2.2 Variation of Pore Water Pressure
We select the sensors P-3, P-6, and P-9 located inside the sliding body and the sensor P-5 located outside the sliding body as examples to analyze pore water pressure and soil stress during sliding, as shown in Figure 10A. It is obvious that the changes in pore water pressure are different before and after sliding due to their different positions. The pore water pressure of the sensors P-3, P-6, and P-9 showed four fluctuations corresponding to the four slides (see the gray ellipse in Figure 10A), that is, the pore water pressure increased sharply before sliding and decreased sharply after sliding. This actually reflects the accumulation and release of the pore water pressure inside the dam body, which is related to the opening and closing of the dominant seepage channel formed during sliding. The reduction of the pore water pressure during the first slide is the largest. This is mainly related to the release of pore water pressure caused by the reduction in the seepage path length of the rear dam during sliding. In the second slide stage, the pore water pressure is maintained at a low level until it surges to a higher level after the third and fourth slides. This is because the accumulation of the seepage flow in the preferential seepage channel formed during sliding results in an increase in the pore water pressure. However, the pore water pressure of the sensor of P-5 has obvious response only in the third and fourth slide stages, that is, the pore water pressure drops sharply after sliding. This is because the sensor of P-5 is located at the rear side of the sliding surface, and the later slides release the seepage pressure in the part of the dam behind the sliding body.
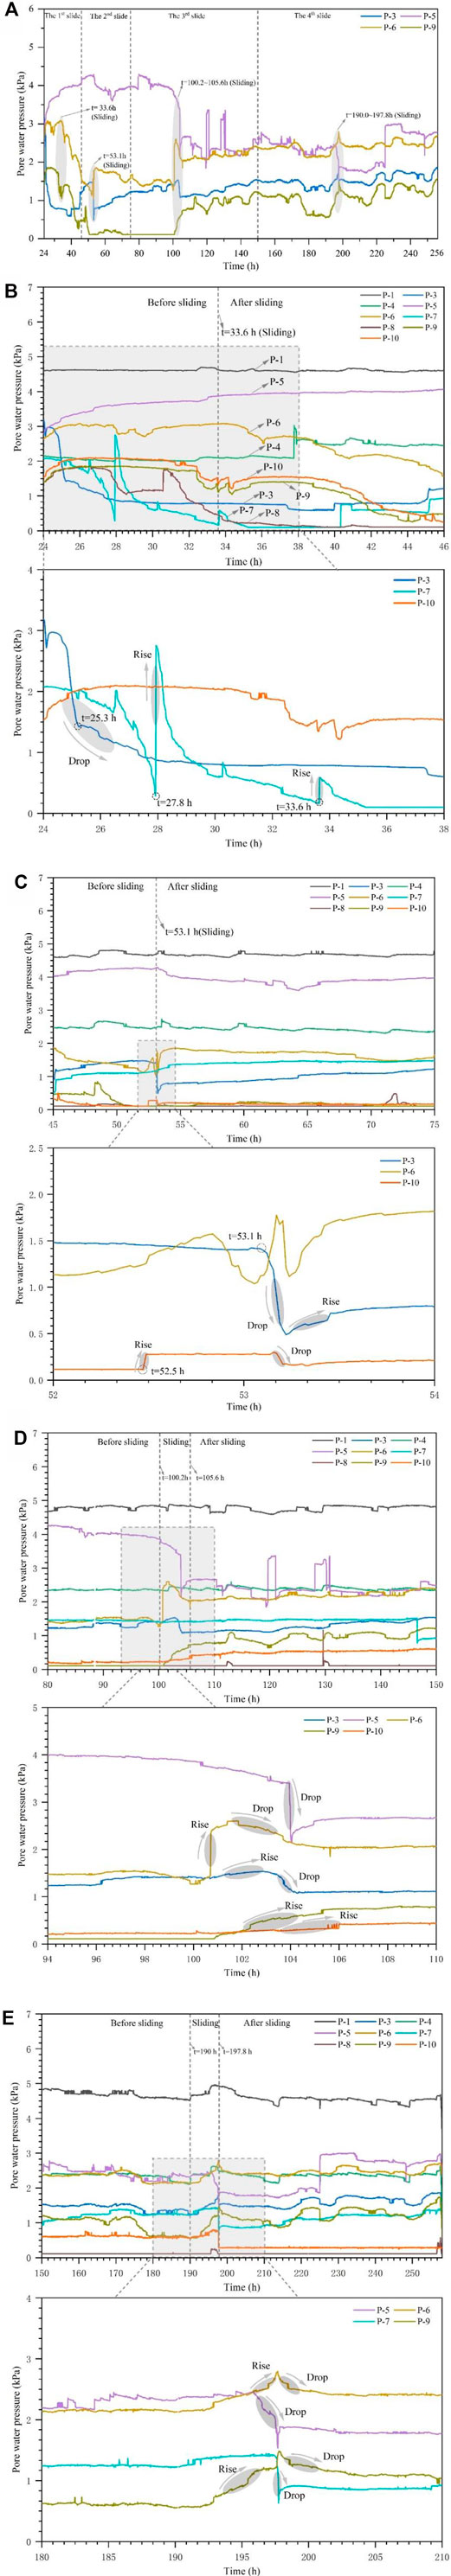
FIGURE 10. Variation of pore water pressure during slope failure. (A) Pore water pressure during the whole sliding, (B) pore water pressures during the 1st slide, (C) pore water pressure during the 2nd slide, (D) pore water pressure during the 3rd slide, and (E) pore water pressure during the 4th slide.
From the previous discussion, it can be seen that various sensors respond to each sliding, so we can analyze each progressive sliding in combination with more sensors in detail. During the first slide, the pore water pressures at the sensors P-3, P-6, P-7, P-8, P-9, and P-10 changed greatly (Figure 10B) because these sensors are located near the dam slope surface and thus are sensitive to the slope sliding. Figure 10B plots the response of the pore water pressure of the sensors P-3, P-7, and P-10. As evident from the data, the pore water pressures vary due to their different locations. With the seepage channel forming at the bottom of the dam, the pore water pressure of the sensor P-3 decreased sharply between 24 and 25.3 h. Meanwhile, the pore water pressure of the sensor P-7 also declined, indicating the formation of some new seepage channels in the middle part of the dam body. At 27.8 h, the pore water pressure at P-7 increased sharply at first and then decreased gradually. This is because the seepage flow poured into the tensile crack formed at the rear edge of the sliding body (Figures 8C–1), resulting in the increasing pore water pressure first, and then with continuous seepage, the pore water pressure dissipated finally. With the gradual formation of the sliding surface (at 33.6 h), a preferential seepage channel is formed. Thus, the pore water pressure at P-7 increased first and then decreased due to the generation and dissipation of the pore water pressure in the aforementioned preferential seepage channel during sliding. After sliding, the leading edge of the sliding body squeezed and blocked the original seepage channel, resulting in a slight increase in the pore water pressure of the sensors of P-3 and P-7 at 40.3 and 45.1 h, respectively. Figure 10B shows that the response of the pore water pressure of the sensor P-10 decreased after sliding, that is, the pore water pressure at P-10 dropped sharply before sliding (at 33.6 h). This is because this sensor is located above the sliding body, and the continuous penetration of cracks in the slope provides the seepage channels the opportunity for the release of pore water pressure. After sliding, the pore water pressure of P-10 decreased slowly to less than 1 kPa. A change in the seepage path at the dam crest is caused by the first slide, resulting in these pressure reductions. Figure 10C displays the variation of the pore water pressure during the second slide. The sensors P-3, P-6, and P-10 located near the slip surface responded strongly; especially at a sliding time of 53.1 h, the pore pressures at P-3, P-6, and P-10 fluctuated sharply. The pore water pressure at P-3, located at the front part of the sliding body, dropped sharply after sliding. This is because the seepage flowed out from the sliding surface, reducing the pore water pressure in the sliding body. Then, the pore water rose slightly due to the continuous re-entry of the seepage into the sliding dam body. For the sensor at P-6, located at the back part of the sliding body, the pore water pressure decreased first before the sliding and then increased during the sliding. This is because the development of cracks inside the dam before sliding provided some preferential seepage channels for the seepage flow, resulting in the reduction in the pore water pressure; during sliding, the seepage channel was blocked due to the squeezing of the sliding body, resulting in an increase in the pore water pressure. The pore water pressure of the sensor P-10, located at the rear edge of the sliding body, rose sharply before sliding (at 52.5 h) and dropped after sliding (at 53.5 h) (Figures 9B–2 and Figure 10C). In this case, the tensile cracks on the dam crest concentrated the seepage flow before sliding, thus the pore water pressure increased first. After sliding, seepage water in the cracks dissipated, resulting in a reduction in the pore water pressure.
In the third and fourth slides, the pore water stress sensor responds to each sliding noticeably, such as the sharp increase and decrease in the pore water pressure before and after the sliding, in a similar fashion as with the previous two sliding (Figures 10D,E). However, the difference is that the progressive failure process of the third slide and fourth slide lasts longer, and the sliding volume body gets larger. Accordingly, the sensor also presents some different characteristics from those in the previous two slides. All sensors respond during the last two slidings, and the monitored data fluctuates greatly, indicating that the sliding volume is larger. In addition, the fluctuation of the monitored data lasts longer, indicating that the sliding process is longer. For example, in the third slide and fourth slide stages, the sliding process lasts for about 5–8 h, during which the pore water pressure and soil pressure continuously rise and drop (Figures 10D,E).
3.2.2.3 Variation of Displacement
The sensors that monitor the displacement of the dam crest respond only during the second slide, as shown in Figure 11. The sliding process is divided into four stages, including crack initiation, propagation in the dam, sliding, and stable stage. At the initiation stage (before 52.3 h), the cracks on the dam crest nucleated at low speed, and there was no obvious displacement on the dam crest. At the crack propagation stage (52.3–53.1 h), the cracks at the dam crest expanded gradually, resulting in an increasing displacement with a slow rate of increase. Then, the displacement of the dam crest increased sharply, with a maximum growth range of 33.8 mm in only 0.2 h, marking the occurrence of the sliding. After sliding (after 53.1 h), the changes in the two displacement sensors tend to be stable, with a maximum displacement of 46.5 mm, indicating the end of the sliding.
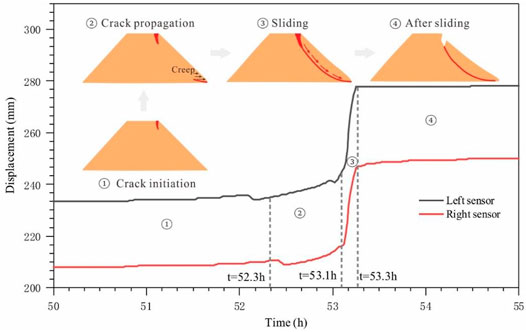
FIGURE 11. Variation of displacement on the dam crest during the second slide.
3.2.2.4 Variation of Soil Stress
Figure 12A shows the response of the sensors S-3, S-5, and S-6 representing the soil stress in the sliding body, at the sliding surface, and at the back of the sliding body, respectively. The soil stress of the sensors S-3 and S-6 shows fluctuating changes in response to each sliding, especially during the second slide. The soil stress of sensor S-5 shows a decreasing trend in the first two slides and increases in the third slide and fourth slide stages. This is because the lateral stress in the dam soil decreases due to the first two slides, resulting in a reduction in soil stress. After the third and fourth slides, the massive sliding caused a loss of support at the rear of the dam, resulting in an increase in the lateral soil stress inside the dam. Therefore, the soil stress pressure of the dam shows an increasing trend. Figure 12B shows the variation of soil stress during the first slide. Because the sliding volume is small, the soil stress changes little. The soil was soaked at the back of the dam for a long time, so the soil stress values at S-4 and S-8 fluctuate only slightly. During the second slide, the soil stress at S-6 rises sharply at 53.1 h with the occurrence of sliding (Figure 12C). This is because the sliding made the rear of the dam lose its front support, resulting in an increase in the lateral soil stress. During the third and fourth slides, the sliding process lasts for about 5–8 h, during which the pore water pressure and soil pressure continuously rise and drop (Figures 12D,E).
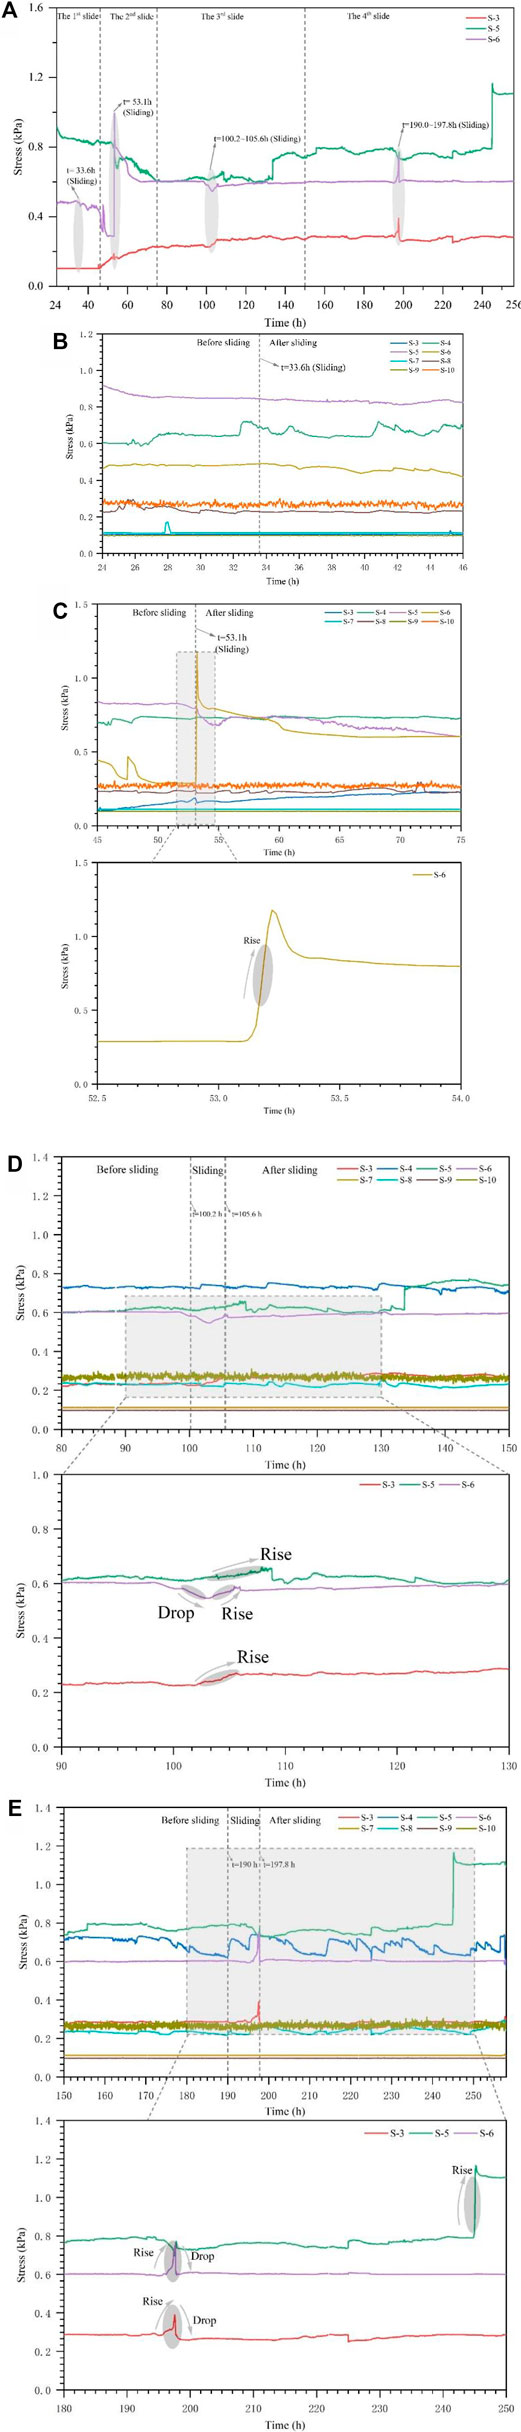
FIGURE 12. Variation of soil stress during slope failure. (A) Soil stress during the whole sliding, (B) soil stress during 1st slide, (C) soil stress during the 2nd slide, (D) soil stress during the 3rd slide, and (E) soil stress during the 4th slide.
3.2.3 Erosion Characteristics of Overtopping
The multi-sliding of the downstream slope caused sufficient structural damage to the dam and overtopping occurred at 256 h. Figure 13 shows the overtopping process from vertical and side views. The sliding of the downstream slope reduced the height of the dam crest, and overflowing water gradually eroded the dam crest (Figures 13A–1). As the soil material on the dam crest constantly eroded away (Figures 13A–2), some slender overflow channels appeared there, and the slope beside the overflow channel collapsed under the action of erosion (Figures 13B–1). The scour base plane continued to develop downward, and different flow velocities in gullies led to the stepped multi-level scarps, as shown in Figures 13B–2. Continuous erosion deepened and widened the initial crest breach as well as the overflow channel (Figures 13C–1). When the water flowed through the scarp, a waterfall torrent was formed, which quickly cut down and eroded the upstream, forming a still larger scarp (Figures 13C–2). Then, the gully deepened continually, and the dam soil on the sides collapsed and was washed away by the water flow (Figures 13D–1). The erosion flows exacerbated the undercutting of the upstream, making the scour base plane develop rapidly to the bottom of the model container. With the decline of the reservoir water level, the overtopping process stopped gradually. Figures 13D–2 show the final shape of the broken dam.
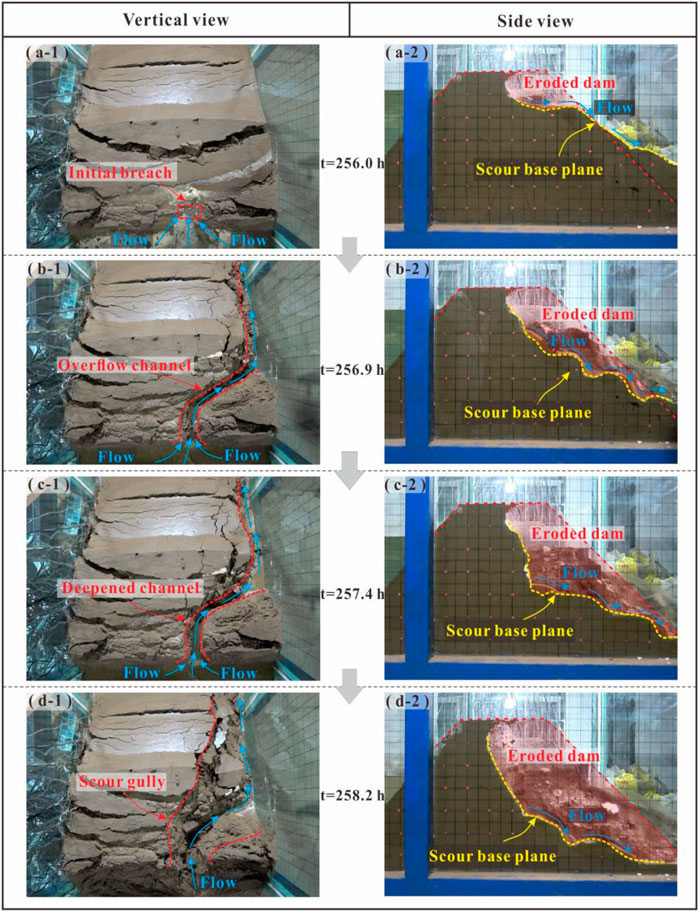
FIGURE 13. Progressive process of overtopping from vertical view and side view.
4 Discussion
This model test revealed the whole life cycle of the check dam satisfactorily and showed that the complex failure process of an earthen dam consists of seepage on the downstream slope, sliding of the downstream slope, and overtopping, which are consistent with the aforementioned field observations, especially for the progressive multi-stage slope sliding. A dam is prone to slope failure due to seepage when it has steep upstream and downstream faces and suffers high pour water pressure (Costa and Shuster, 1988; Jiang et al., 2018). Distinct from the progressive process of non-cohesive natural dams (Gregoretti et al., 2010) that suffer collapse due to gradual soil particle migration (Jiang et al., 2020b), our model failure included four progressive sliding events. This is caused by the strong seepage in the homogeneous, fine-grained dam material.
Due to the upstream flow, the seepage flow gradually shifted from upstream to downstream. The seepage movement in the dam can be observed through the “capillary line” and “phreatic line.” The arrival of the capillary front marks the beginning of the transition from dry to wet soil, and the movement of the capillary front can be captured by cameras (Figure 6A) and moisture sensors (Figure 7A) in the model test. As the capillary front reached the position of the moisture content sensor, the moisture content of the soil immediately increased. The arrival of the phreatic front marks the saturation of the soil, and the movement of the phreatic front is reflected by the pore water sensors (Figure 7B). As the phreatic front reaches the position of the moisture content sensor, the soil moisture content reaches its maximum value and the pore water pressure of the soil immediately increases. The area between the capillary front and the phreatic front is called the capillary zone. The area behind the phreatic front is called the saturated zone. Figure 14A shows the arrival time of the capillary front and phreatic front at different positions of the water content sensor, corresponding to the moisture content sensor positions in the dam. Obviously, the capillary front arrives earlier than the phreatic front, and the closer the location of the water content sensor is to the upstream water level (such as the monitoring sensors of W-1, W-4, and W-8), the earlier the capillary front arrives. Figure 6A shows that the capillary flow moves mostly perpendicular to the bottom of the dam in the early seepage stage and parallel to the downstream slope in the later seepage stage. Notably, the capillary flow line is higher than the upstream flow water level, indicating that the capillary phenomenon in the dam material is inevitable due to its loose structure. The arrival time of the phreatic front is at about 20–25 h, which shows that the high permeability of the dam material leads to the rapid evolution of seepage. It should be noted that the arrival time of the phreatic front is greater than that of the capillary front, indicating that the strong capillary phenomenon of the dam material is due to its loose structure.
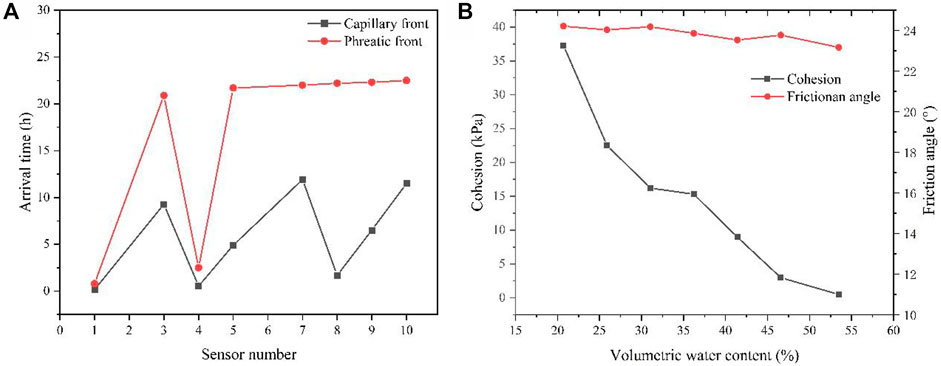
FIGURE 14. Variation of capillary front, phreatic front, and shear strength parameters of dam material during seepage. (A) Arrival time of capillary front and phreatic front at the positions of water content sensors. (B) Shear strength parameters of dam material with different water content.
With seepage, increasing the water content of the dam material reduces its shear strength. Figure 14B shows the reduction of the shear strength index of the dam material with increasing water content. It can be seen that the cohesion of the dam material is reduced by 98.7%, and the cohesion of the dam material in the saturated state is only 0.49 kPa. Combined with the seepage force, the soil at the slope toe of the dam begins to deform by creep (Figure 15A). The creep region expands further due to the seepage force and softening of the strength of the saturated soil (Figure 15B). The creep at the toe of the slope drives the deformation of the whole slope, and some tensile cracks appear on the dam slope. Deformation is the most significant external manifestation of the change in slope stability and slope failure (Xu et al., 2016). As the tensile cracks penetrate, they cause the first slide (Figure 15C). Once one part of the slope fails, it becomes increasingly difficult for the remaining parts of the slope to hold together. Thus, after the first slide, the dam body loses the anti-sliding support from the front part of the dam (Figure 15D), which furthers reduces dam stability. Meanwhile, the cracks generated by the sliding form new preferential seepage channels, and water flows into the cracks, leading to increased seepage force. Influenced by the double action of the seepage force and the softening of the strength of the saturated soil, cracks at the dam crest extend more deeply and widely, causing the second slide (Figure 15E), then the third and fourth slides follow in a similar fashion (Figures 15F–I). Finally, overtopping occurs after the fourth slide (Figure 15J). It should be noted that each sliding is a long-time creep process, and the creep at the foot of the dam slope drives each slope sliding. The slope slide of the dam presents a retrogressive sliding mechanism, and each slope sliding drives the next sliding, especially the first sliding, which plays an important role in the entire process of slope sliding. The discussion above indicates that the loose dam material, high permeability of dam material, the large width of the dam, and high seepage force caused by the water storage upstream are the controlling factors behind the complex progressive failure of the model dam.
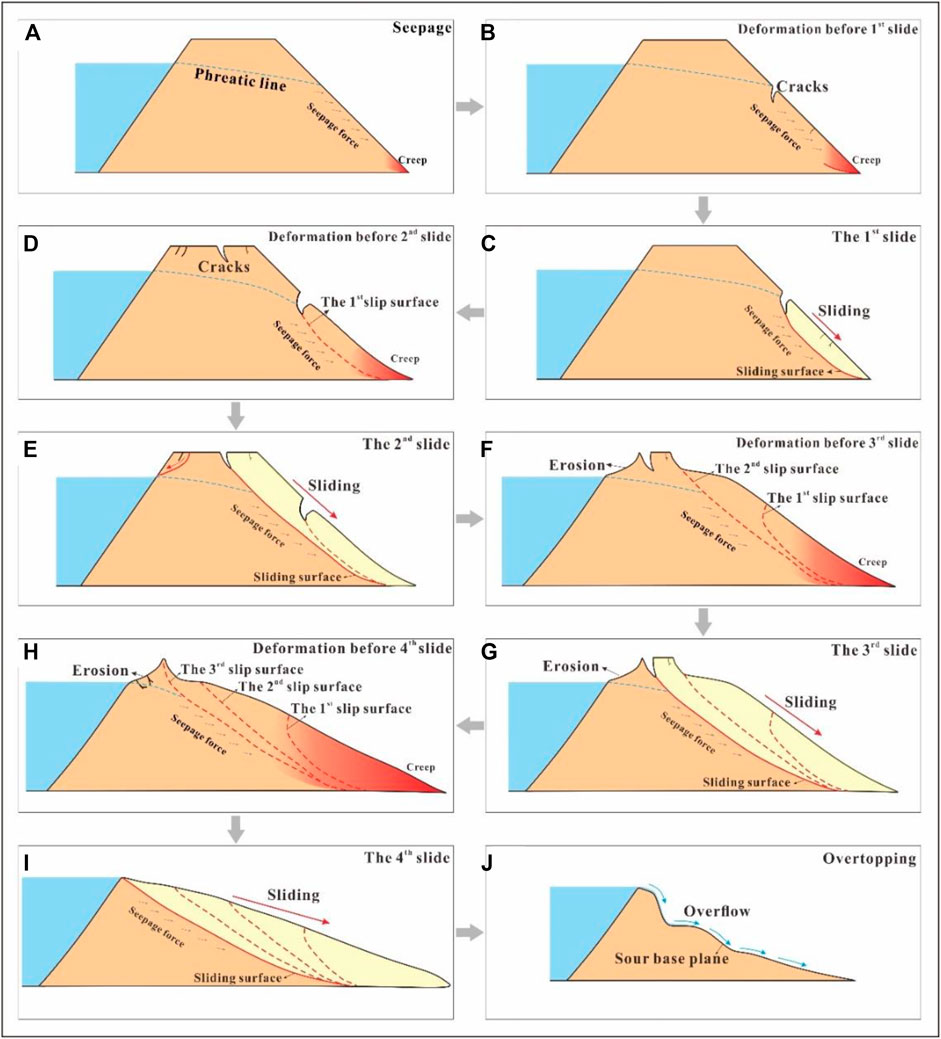
FIGURE 15. Formation mechanism of the progressive failure of model dam. (A) Seepage, (B) deformation before the 1st slide, (C) 1st slide; (D) deformation before the 2nd slide, (E) 2nd slide, (F) deformation before the 3rd slide, (G) 3rd slide, (H) deformation before the 4th slide, (I) 4th slide, and (J) overtopping.
Overall, our model test reveals the progressive failure process of check dams, which has great significance in understanding the failure mechanism of check dams with the slope failure mode. It should be noted that there are some shortcomings in this model that need to be improved. For example, due to the establishment of the scale model in this study, the capillary phenomenon of the compacted dam material is more obvious, making the whole dam soaked, which is slightly different from the prototype check dam. Furthermore, the overtopping does not occurs in the middle of the model dam but along the boundary between the reinforced glass and the model dam. Thus, the boundary effect between the dam and reinforced glass should be noted.
5 Conclusion
By using the physical mode test, the failure mode and failure process of the check dam triggered by steady upstream flow were investigated. Then the mechanism causing the progressive failure of the check dam was analyzed based on the variation of dam hydrologic and mechanical conditions. Finally, the physical model test results were compared with field observation to verify the reliability of this study. The main conclusions are as follows:
1) Progressive failure is a major failure mode for natural check dams subjected to seepage, which was recreated in laboratory tests. In this experiment, the failure mode of a model dam triggered by upstream flow is investigated, which involves multi-stage slope slides and overtopping. The progressive failure process of a check dam presents three specific features: seepage on the downstream slope, slide of the downstream slope, and overtopping.
2) During seepage, the capillary line starts from upstream and gradually moves downstream with a vertical shape due to the high permeability of the model materials. With continuous seepage, the seepage overflow at the dam slope toe occurs, which softens the dam material and reduces its strength. Combined with the seepage force of the seepage flow, the soil at the slope toe of the dam begins to deform by creep.
3) Continuous creep deformation of the downstream slope leads to eventual slope sliding. The slope failure of the check dam presents a progressive sliding process that lasts for about 232 h, during which four sliding events occur on the downstream slope. Every slide event is progressive, long lasting, with a gradually increasing volume. Notably, the slope sliding of the entire dam body presents a retrogressive sliding mechanism; the seepage flow is the main factor that triggers the progressive slope failure.
4) The physical model test reproduces the failure process of the check dam throughout its life cycle, which is consistent with the field observations, especially the failure modes and the progressive failure process. The progress failure is the consequence of factors, such as the well-graded dam material, high permeability of dam material, large width of dam, and high water storage upstream.”
Data Availability Statement
The original contributions presented in the study are included in the article/Supplementary Material, further inquiries can be directed to the corresponding authors.
Author Contributions
FY,WT and YuZ conducted model tests. YaZ and FL wrote the paper. YaZ and FL made figures. HL provided article revision.
Funding
This study was financially supported by the National Natural Science Foundation of China (Grant Nos. 41877247, 41790443, and 42041006).
Conflict of Interest
The authors declare that the research was conducted in the absence of any commercial or financial relationships that could be construed as a potential conflict of interest.
Publisher’s Note
All claims expressed in this article are solely those of the authors and do not necessarily represent those of their affiliated organizations, or those of the publisher, the editors, and the reviewers. Any product that may be evaluated in this article, or claim that may be made by its manufacturer, is not guaranteed or endorsed by the publisher.
References
Calamak, M., Larocque, L. A., and Chaudhry, M. H. (2020). Numerical Modelling of Seepage through Earthen Dams with Animal Burrows: a Case Study. J. Hydraulic Res. 59 (3), 488–499. doi:10.1080/00221686.2020.1780502
Cao, Z., Yue, Z., and Pender, G. (2011). Landslide Dam Failure and Flood Hydraulics. Part I: Experimental Investigation. Nat. Hazards 59 (2), 1003–1019. doi:10.1007/s11069-011-9814-8
Chen, S.-C., Lin, T.-W., and Chen, C.-Y. (2015). Modeling of Natural Dam Failure Modes and Downstream Riverbed Morphological Changes with Different Dam Materials in a Flume Test. Eng. Geology. 188, 148–158. doi:10.1016/j.enggeo.2015.01.016
C. C. Conesa, and M. A. Lenzi (Editors) (2013). Check Dams, Morphological Adjustments and Erosion Control in Torrential Streams. New York, NY: Nova Science.
Costa, J. E., and Schuster, R. L. (1988). The Formation and Failure of Natural Dams. Geol. Soc. Am. Bull., 100, 1054–1068. doi:10.3133/ofr87392
Dunning, S. A., Rosser, N. J., Petley, D. N., and Massey, C. R. (2006). Formation and Failure of the Tsatichhu Landslide Dam, Bhutan. Landslides 3 (2), 107–113. doi:10.1007/s10346-005-0032-x
Fang, N. F., Zeng, Y., Ni, L. S., and Shi, Z. H. (2019). Estimation of Sediment Trapping behind Check Dams Using High-Density Electrical Resistivity Tomography. J. Hydrol. 568, 1007–1016. doi:10.1016/j.jhydrol.2018.11.062
Foster, M., Fell, R., and Spannagle, M. (2000). The Statistics of Embankment Dam Failures and Accidents. Can. Geotech. J., 37. , 1000–1024. doi:10.1139/t00-030
Fu, B., Wang, S., Liu, Y., Liu, J., Liang, W., and Miao, C. (2017). “Hydrogeomorphic Ecosystem Responses to Natural and Anthropogenic Changes in the Loess Plateau of China,” Annu. Rev. Earth Planet. Sci. Editors R. Jeanloz, and K. H. Freeman, 45, 223–243. doi:10.1146/annurev-earth-063016-020552
Garcia, C., and Mario, M. (2010). Check Dams, Morphological Adjustments and Erosion Control in Torrential Streams. Scitech Book News 34 (4).
Gregoretti, C., Maltauro, A., and Lanzoni, S. (2010). Laboratory Experiments on the Failure of Coarse Homogeneous Sediment Natural Dams on a Sloping Bed. J. Hydraul. Eng. 136 (11), 868–879. doi:10.1061/(asce)hy.1943-7900.0000259
He, L. P., Yu, J. Y., Hu, Q. J., Cai, Q. J., Qu, M. F., and He, T. J. (2020). Study on Crack Propagation and Shear Behavior of Weak Muddy Intercalations Submitted to Wetting-Drying Cycles. Bull. Eng. Geol. Environ. 79 (9), 4873–4889. doi:10.1007/s10064-020-01842-7
Hessel, R. (2006). Consequences of Hyperconcentrated Flow for Process-Based Soil Erosion Modelling on the Chinese Loess Plateau. Earth Surf. Process. Landforms 31 (9), 1100–1114. doi:10.1002/esp.1307
Jiang, X., Wei, Y., Wu, L., Hu, K., Zhu, Z., Zou, Z., et al. (2019). Laboratory Experiments on Failure Characteristics of Non-cohesive Sediment Natural Dam in Progressive Failure Mode. Environ. Earth Sci. 78 (17), 538. doi:10.1007/s12665-019-8544-1
Jiang, X., Wei, Y., Wu, L., and Lei, Y. (2018). Experimental Investigation of Failure Modes and Breaching Characteristics of Natural Dams. Geomatics, Nat. Hazards Risk 9 (1), 33–48. doi:10.1080/19475705.2017.1407367
Jiang, X., Wörman, A., Chen, P., Huang, Q., and Chen, H. (2020a). Mechanism of the Progressive Failure of Non-cohesive Natural Dam Slopes. Geomorphology 363, 107198. doi:10.1016/j.geomorph.2020.107198
Jiang, X., Zhanyuan, Z., Chen, H., Deng, M., Niu, Z., Deng, H., et al. (2020b). Natural Dam Failure in Slope Failure Mode Triggered by Seepage. Geomatics, Nat. Hazards Risk 11 (1), 698–723. doi:10.1080/19475705.2020.1746697
Jin, Z., Guo, L., Wang, Y., Yu, Y., Lin, H., Chen, Y., et al. (2019). Valley Reshaping and Damming Induce Water Table Rise and Soil Salinization on the Chinese Loess Plateau. Geoderma 339, 115–125. doi:10.1016/j.geoderma.2018.12.048
Kouzehgar, K., Hassanzadeh, Y., Eslamian, S., Yousefzadeh Fard, M., and Babaeian Amini, A. (2021). Physical Modeling into Outflow Hydrographs and Breach Characteristics of Homogeneous Earthfill Dams Failure Due to Overtopping. J. Mt. Sci. 18 (2), 462–481. doi:10.1007/s11629-020-6177-1
Li, X., Wei, X., and Wei, N. (2016). Correlating Check Dam Sedimentation and Rainstorm Characteristics on the Loess Plateau, China. Geomorphology 265, 84–97. doi:10.1016/j.geomorph.2016.04.017
Li, Y., Chen, A., Wen, L., Bu, P., and Li, K. (2020). Numerical Simulation of Non-cohesive Homogeneous Dam Breaching Due to Overtopping Considering the Seepage Effect. Eur. J. Environ. Civil Eng. 25, 1–15. doi:10.1080/19648189.2020.1744481
Martí, J., Riera, F., and Martínez, F. (2020). Interpretation of the Failure of the Aznalcóllar (Spain) Tailings Dam. Mine Water Environ., 40, 189–208. doi:10.1007/s10230-020-00712-8
Okeke, A. C.-U., and Wang, F. (2016). Hydromechanical Constraints on Piping Failure of Landslide Dams: an Experimental Investigation. Geoenviron Disasters 3 (1), 4. doi:10.1186/s40677-016-0038-9
Richards, K. S., and Reddy, K. R. (2007). Critical Appraisal of Piping Phenomena in Earth Dams. Bull. Eng. Geol. Environ. 66 (4), 381–402. doi:10.1007/s10064-007-0095-0
Rifai, I., Erpicum, S., Archambeau, P., Violeau, D., Pirotton, M., El Kadi Abderrezzak, K., et al. (2017). Overtopping Induced Failure of Noncohesive, Homogeneous Fluvial Dikes. Water Resour. Res. 53 (4), 3373–3386. doi:10.1002/2016wr020053
Romero-Díaz, A., Marín-Sanleandro, P., and Ortiz-Silla, R. (2012). Loss of Soil Fertility Estimated from Sediment Trapped in Check Dams. South-Eastern Spain. Catena 99, 42–53. doi:10.1016/j.catena.2012.07.006
Wang, F., Okeke, A. C.-U., Kogure, T., Sakai, T., and Hayashi, H. (2018). Assessing the Internal Structure of Landslide Dams Subject to Possible Piping Erosion by Means of Microtremor Chain Array and Self-Potential Surveys. Eng. Geology. 234, 11–26. doi:10.1016/j.enggeo.2017.12.023
Wu, W. M., Altinakar, M. S., Al-Riffai, M., Bergman, N., Bradford, S. F., Cao, Z. X., et al. (2011). Earthen Embankment Breaching. J. Hydraulic Eng. 137 (12), 1549–1564. doi:10.1061/(ASCE)HY.1943-7900.0000498
Xu, J., Wei, W., Bao, H., Zhang, K., Lan, H., Yan, C., et al. (2019). Failure Models of a Loess Stacked Dam: a Case Study in the Ansai Area (China). Bull. Eng. Geol. Environ. 79 (2), 1009–1021. doi:10.1007/s10064-019-01605-z
Xu, Q., Liu, H., Ran, J., Li, W., and Sun, X. (2016). Field Monitoring of Groundwater Responses to Heavy Rainfalls and the Early Warning of the Kualiangzi Landslide in Sichuan Basin, Southwestern China. Landslides 13 (6), 1555–1570. doi:10.1007/s10346-016-0717-3
Yang, Y., Fu, S., Liu, B., Sun, B., Liu, C., Wang, Z., et al. (2020). Damage of Check Dams by Extreme Rainstorms on the Chinese Loess Plateau: A Case Study in the Chabagou Watershed. J. Soil Water Conservation 75 (6), 746–754. doi:10.2489/jswc.2020.00138
Zhang, F., Yan, B., Feng, X., Lan, H., Kang, C., Lin, X., et al. (2019). A Rapid Loess Mudflow Triggered by the Check Dam Failure in a Bulldoze Mountain Area, Lanzhou, China. Landslides 16 (10), 1981–1992. doi:10.1007/s10346-019-01219-2
Zhao, T.-y., Yang, M.-y., Walling, D. E., Zhang, F.-b., and Zhang, J.-q. (2017). Using Check Dam Deposits to Investigate Recent Changes in Sediment Yield in the Loess Plateau, China. Glob. Planet. Change 152, 88–98. doi:10.1016/j.gloplacha.2017.03.003
Zhu, X., Peng, J., Jiang, C., and Guo, W. (2019). A Preliminary Study of the Failure Modes and Process of Landslide Dams Due to Upstream Flow. Water 11 (6), 1115. doi:10.3390/w11061115
Keywords: earthen check dam, loess, gully, seepage, sliding, overtopping, creep
Citation: Zhu Y, Li F, Yang F, Zhang Y, Tian W and Lan H (2022) Experimental Investigation on Failure Modes and Progressive Failure Process of Earthen Check Dam Triggered by Upstream Flow. Front. Earth Sci. 10:818508. doi: 10.3389/feart.2022.818508
Received: 19 November 2021; Accepted: 05 January 2022;
Published: 27 January 2022.
Edited by:
Fanyu Zhang, Lanzhou University, ChinaReviewed by:
Wei Shen, University of Bologna, ItalyRafael Moran, Polytechnic University of Madrid, Spain
Copyright © 2022 Zhu, Li, Yang, Zhang, Tian and Lan. This is an open-access article distributed under the terms of the Creative Commons Attribution License (CC BY). The use, distribution or reproduction in other forums is permitted, provided the original author(s) and the copyright owner(s) are credited and that the original publication in this journal is cited, in accordance with accepted academic practice. No use, distribution or reproduction is permitted which does not comply with these terms.
*Correspondence: Yanbo Zhu, emh1eWFuYm9AY2hkLmVkdS5jbg==; Hengxing Lan, TGFuaHhAaWdzbnJyLmFjLmNu