 Tian Baoqing
 Ding Zhifeng
 Yang Liming3
- 1Institute of Geophysics, China Earthquake Administration, Beijing, China
- 2Key Laboratory of Earthquake Source Physics, China Earthquake Administration, Beijing, China
- 3Institute of Science and Technology, China Three Gorges Corporation, Beijing, China
Geothermal resources are a type of sustainable and green energy, which can play an important role in emission peaks and carbon neutrality. Determining the best development target area is key to resource development and geophysical methods are commonly used for this purpose. Owing to serious human and industrial interference, the microtremor survey method is often adopted for geothermal exploration in urban areas. It is a passive source method, which is non-invasive and environmentally friendly. In this method, the Rayleigh wave dispersion curve is extracted using spatial autocorrelation based on the vertical component signal at the observation station. A genetic algorithm is used to invert the dispersion curve of one survey point to obtain strata parameters such as layer thickness, S-wave velocity, and density. It provides critical parameters for the cap layer and reservoirs for geothermal exploration. For a chain microtremor measurement, a two-dimensional (2D) apparent S-wave velocity section can be generated. The apparent S-wave velocity is calculated from the phase velocity using the following empirical method: the 2D apparent S-wave velocity section helps to identify the buried channel for heat flow and track the irregular shapes of the reservoirs or cap layers. It has been verified that the microtremor survey method is reliable and accurate compared with borehole materials. As a newly developed non-invasive geophysical method, it can be widely used in geothermal exploration.
Introduction
High-frequency climate and environmental disasters push mankind to pay more attention to protecting the environment. One of the best methods is energy conservation and emission reduction. Switching from traditional fossil fuels to renewable and green energy decreases the emission of carbon dioxide (CO2). Renewable and green energy mainly include solar, wind, biomass, and geothermal energy.
Geothermal energy comes from the interior of the Earth, and is stable because it does not depend on the weather. It originates from the decay of radioactive elements contained in the Earth. As a result, the amount of geothermal energy is large, equal to 170 million times that of coal with a potential exploitable resource of 4,948 trillion tons of standard coal equivalent. China is located in the circum-Pacific geothermal belt and the Mediterranean–Himalayan geothermal belt, where geothermal energy is abundant. Geothermal types include shallow geothermal energy, medium-deep depth hydrothermal resources, and hot dry rock geothermal resources. It is used for various proposed, such as generating power, heating, and cooling based on the different types of geothermal resources. Identifying an excellent target for exploiting geothermal resources is the most important factor, which typically relies on geophysical methods to ensure geothermal reservoirs and channels for heat flow (Kana et al., 2015).
Geophysical methods can be divided into invasive and non-invasive methods. Seismic methods, magnetic methods, and gravity methods are non-invasive methods. Based on the wave velocity difference of the strata, seismic methods can identify strata with different rock properties and determine the location and parameters of buried faults. Magnetic methods such as the magnetotelluric method (MT), audiomagnetotelluric method (AMT), and controlled source audio-frequency magnetotelluric method (CSAMT), can explore the distribution characteristics, properties, and geological fault occurrences and determine the thickness and depth of cap layers. Gravity methods help to depict the bedrock conditions, spreading of structures, and location of faults. For example, a 3D seismic survey was conducted in Saxony, Germany for geothermal exploration (Lüschen et al., 2015), which is an indispensable tool for geothermal exploration, even in crystalline basement rocks. To identify the geothermal potential, seismic reflection imaging can provide amplitude contrasts that may be related to volcanic rocks and possible hydrothermal alteration fronts (Sena-Lozoya et al., 2020). MT is an important method for the exploration of geothermal systems (Rosenkjaer et al., 2015). Uchida and Sasaki (2006) developed a stable inversion technique for the 3D interpretation of MT data and applied it to a large-volume MT dataset obtained in the Ogiri geothermal area, in southwestern Japan. CSAMT provides an efficient means of delineating the shallow resistivity pattern above a hydrothermal system (Sandberg and Hohmann, 1982). Di et al. (2006) successfully applied the CSAMT method to geothermal exploration in the Beijing area and accurately located geothermal reservoirs deeper than 2 km. Gravity methods can help to delineate the structural features that control the geothermal system, such as the research on the Eburru geothermal system in Kenya (Maithya et al., 2020). To understand the subsurface structure and its relation to the observed geothermal phenomenon, a land gravity survey was carried out in the Kinigi geothermal field, Northwest Rwanda (Uwiduhaye et al., 2018). In addition, joint inversion is typically adopted for geothermal exploration. Zaher et al. (2018) used airborne gravity and magnetic geophysical data to preliminarily explore the geothermal potential in the Siwa Oasis, Western Desert, Egypt. Joint inversion of gravity and surface wave data constrained by MT highlighted unconventional geothermal prospects in felsic basement (Ars et al., 2019).
Ambient noise tomography has also been adopted for geothermal exploration (Planès et al., 2020). The microtremor survey method (MSM) is a new, non-invasive geophysical method used for geothermal exploration, which also uses ambient noise as a signal. An observation array is typically adopted to collect field data. The frequency–wavenumber spectrum method F–K, (Capon, 1969), and spatial autocorrelation method SPAC, (Aki, 1957), are commonly adopted to extract the Rayleigh wave dispersion curve. Compared with F–K, SPAC has more accurate results (Ohori et al., 2002) with circular arrays. Bettig et al. (2001) presented a modified SPAC, which allows the use of irregular, almost carbitrarily shaped arrays. Okada and Ling (1994), Okada (2006) proposed an extended SPAC method with arbitrarily shaped arrays. Asten (2006) used the SPAC method to process the passive seismic data from finite circular array. Owing to the fundamental assumption of plane wave propagation of surface waves, attention must be paid to the near-source effect in array-based microtremor surveys (Roberts and Asten, 2008). Asten et al. (2019) developed a spatially averaged coherency (krSPAC), which allows spatial averaging of spectra from multiple pairs of sensors, irrespective of differences in spatial separation of the pairs. Cho and Iwata (2021) examined the limits and benefits of the SPAC microtremor array method. Microtremors have been applied to various aspects based on different processing methods. Roberts and Asten (2005) used microtremor array (SPAC) measurements to estimate the S-wave velocity profile of Quaternary silts. Chávez-García et al. (2007) adopted microtremors to achieve the S-wave velocity structure around the Teide Volcano. Stephenson and Odum (2010) applied the SPAC to characterise the S-wave velocity in the upper 300 m of Salt Lake Valley, Utah. It is also possible in SPAC observation to identify a 2D structure and interpret S-wave velocity profiles in a deep and narrow valley environment (Claprood et al., 2011). MSM has been used to determine soil characteristics (Ozer et al., 2017), estimate the near-surface S-wave velocity structure at a site exhibiting low to high impedance contrast (Setiawan et al., 2019), and identify the sediment (Raptakis and Makra, 2010; Tian et al., 2019; Tian et al., 2020a). Tian et al. (2016; 2017) applied the MSM method to identify the parameters of different strata and ensure the geothermal channel information. In addition, Tian et al. (2020b) combined MSM with geothermal assessment to improve precision. Using the regression method, the relationship between S-wave velocity, density, and thermal conductivity was identified (Tian et al., 2020c).
In this study, we investigated MSM, which can be widely applied to geothermal development and utilisation. First, we briefly introduce the observation array and the SPAC method. For different exploration targets, MSM is classified into two specific techniques: microtremor sounding and 2D microtremor profile methods. The inversion results of the dispersion curve provide layer parameters (depth, thickness, S-wave velocity, and density) for the geothermal system. To identify the geothermal channel, a 2D microtremor profiling method was adopted, which contained several survey points in a survey line. Our preliminary results appear to be useful for studying geothermal systems.
Microtremor Survey Method (MSM)
MSM is a passive surface-wave geophysical method. Microtremor signals mainly contain surface waves and body waves. The low-frequency waves (<1 Hz) arise from changes in pressure, sea waves, and tides, while the high-frequency (>1 Hz) waves originate from human sources and living activities. Based on the SPAC requirements, the microtremor signal must be collected by an array. Commonly, a regular triangular array (Figure 1) is selected to record the microtremor signal. The Rayleigh wave dispersion curve is extracted from the vertical component signal using the SPAC method (Aki, 1957), which assumes that the signal is stationary and random. Meanwhile, the surface wave is mainly the fundamental mode (Okada, 2003; Okada, 2006).
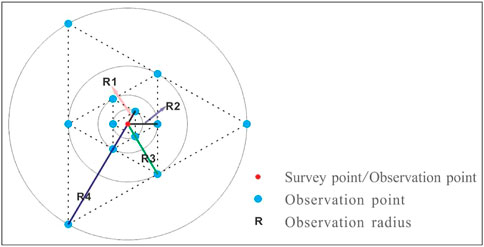
FIGURE 1. Regular triangular array for collecting the microtremor signal.
Usually, the frequency spectrum of the microtremor signal for two observation points A (0,0) and B (r,θ) can be expressed as;
where ω is the angular frequency, θ is the azimuth angle, k is the wave number, and r is the distance (radius) between the two stations.
The SPAC function between two stations is defined as
Here, the spatial covariance function is defined as
For the circular array, the azimuth average of the spatial covariance function for the SPAC function and the phase velocity can be obtained.
Here, J0 is the zero-order Bessel function and h is the average power.
Then, the SPAC coefficient
As a result, we can obtain
Using Eq. 7, the phase velocity can be calculated in distance r and frequency f.
When the Rayleigh wave dispersion curve is extracted, it is used to invert the S-wave velocity structure using the Monte Carlo algorithm. In our research, a genetic algorithm was selected to invert the geological structure. During the inversion, a initial inversion model with layer’s parameters is assumed to begin the inversion which is one horizontally stratified geological model. If the observation array is located at the fractured strata, the results of inversion has a relatively lower accuracy.
In some cases, it is not necessary to invert the S-wave velocity structure during the detection of geological structures. The relative change trend such as low velocity anomaly in the S-wave velocity section can reveal the location and depth of the structure accurately. The 2D microtremor profiling method is also based on the Rayleigh wave dispersion curve. It transforms the phase velocity (Vr-f) to the apparent S-wave velocity (Vx-H) using an empirical Eq. 8 for each survey point (Tian et al., 2017; Tian et al., 2022). Then, the apparent S-wave velocity section is obtained by horizontal interpolation and smoothing between every survey point. The workflow of MSM is shown in Figure 2.
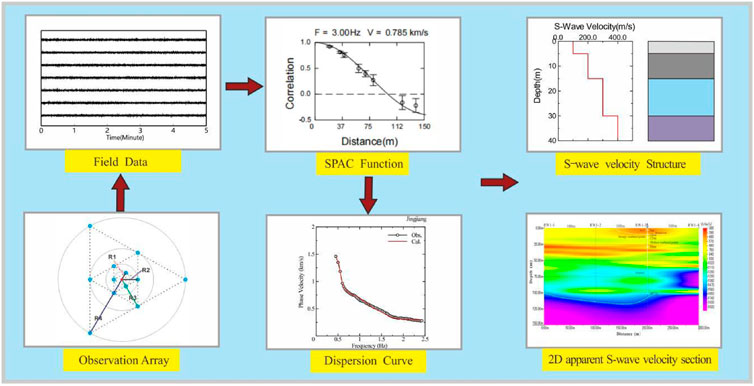
FIGURE 2. Microtremor survey method (MSM) workflow.
Here, the Vx represents the apparent S-wave velocity of the ith layer, t represent the time, Vr represents the phase velocity of the ith layer.
Data Acquisition, Processing, and Discussion
According to the exploration target, different techniques were selected to determine geothermal geological parameters. This section introduces three objectives for geothermal exploration. Different observation parameters and inversion methods were presented specifically to satisfy each item.
Determining the Geothermal System Parameters
Geothermal cap layers and reservoirs are known for some geothermal fields. Therefore, it is critical to determine the corresponding parameters. Accurate parameters of all strata are important for the different stages of geothermal development. For example, during the feasibility step, the estimation of the geothermal deposit and exploitation amount depends on the reservoir thickness. In addition, the reservoir depth is a vital parameter for drilling, which may decide whether the geothermal development is successful or not.
Data Acquisition
JingJiang, China is taken as an example where the geothermal reservoir is Triassic limestone. Based on the probing depth requirement, we deployed one survey point with four overlay circular observation arrays (Figure 1) to record the microtremor signals. The radii were 80–160–320–640 m. At every observation point, a three-component MTKV-3C seismometer and Datamark LS-8800 were used to record the microtremor signals. The main frequency of the observation seismometer was 1 Hz. At the same time, one cycle delay and amplifier circuit was adopted to achieve lower frequency signal. At each survey point, a 30 minute continuous signal was obtained.
Data Processing and Discussion
First, the original microtremor signal was processed by removing the data mean and trend, normalization and spectral whitening. Based on the original field data, the SPAC coefficients were calculated for every two stations. Then, they were fitted to the zero-order Bessel function for different frequencies and distances. After the dispersion curve was extracted, a genetic algorithm was adopted for inversion. The dispersion curve and inversion S-wave velocity structures are shown in Figure 3.
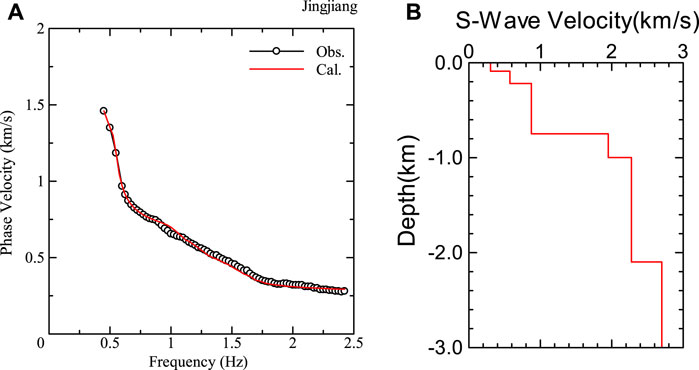
FIGURE 3. Dispersion curve (A) and inversion S-wave velocity structure (B).
Simultaneously, one borehole was drilled at this microtremor survey point. A comparison between the inversion results and borehole materials is shown in Table 1. The MSM distinguished several subsurface layers based on the wave velocity differences. In the same geologic age, it also distinguished different layers if there was a wave velocity difference. The error was small when the wave velocity difference was large. For example, it accurately identified the interference between the Quaternary Neogene and the Zhouchongcun Formation of the Triassic. However, the probing error was slightly larger when identifying the interference between two layers with small wave velocity differences, such as the layer of cream mudstone, gypsum, and layer of gypsum, creating mudstone. In general, the MSM can provide accurate parameters for layers with different rocks.
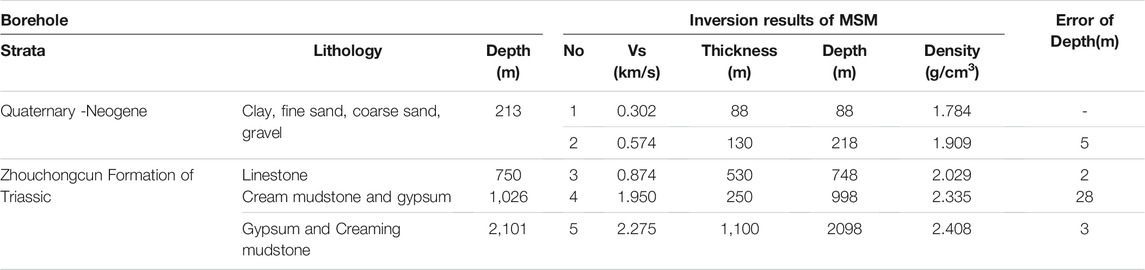
TABLE 1. Comparison between the inversion result and borehole materials.
Identifying the Buried Channel for Heat Flow
Convective geothermal resources are one resource type, which is frequently chosen for development and exploitation, which relies on channel formation for heat flow. Therefore, locating the buried channel and determining the channel parameters are the primary tasks for geothermal exploration. Faults (fracture zones) are channels for heat flow. To identify buried faults, one 2D section was the most intuitive and accurate method. In the horizontal direction of the section, the lateral position was determined. This section provided an accurate understanding of the width and depth of the channel. It also showed the fracturing degree of the fault by comparing the background values.
Data Acquisition
A research area in Zhejiang Province, China was selected to depict the ability of the MSM to identify the buried channel for heat flow. To obtain a 2D section, one microtremor survey line was deployed, including six survey points. The observation system is shown in Figure 4. For each observation array, the radii are 125–250–375–500 m using a 1 Hz main frequency for the observation seismometer. The time was automatically corrected using the GPS system among all seismometers. The microtremor signal was recorded for 30 min in each observation array.
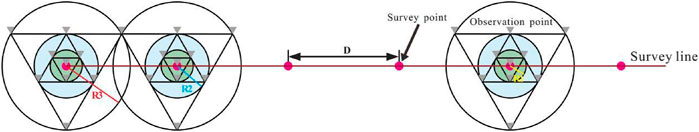
FIGURE 4. Observation system for a microtremor survey line. In this figure, R represents the observation radii and D represents the distance between two survey points.
Data Processing and Discussion
The field data were processed by removing the data mean and trend, normalization and spectral whitening. For every survey point, the dispersion curve was extracted using the SPAC method. All the dispersion curves are shown in Figure 5A. To achieve an apparent S-wave, the dispersion curve was transformed to the curve of the apparent S-wave velocity (Vx) and depth (H) using Eq. 8. Using the results of Vx-H, the 2D apparent S-wave velocity section (Figure 5B) was calculated using Kriging interpolation and smoothing among all the survey points.
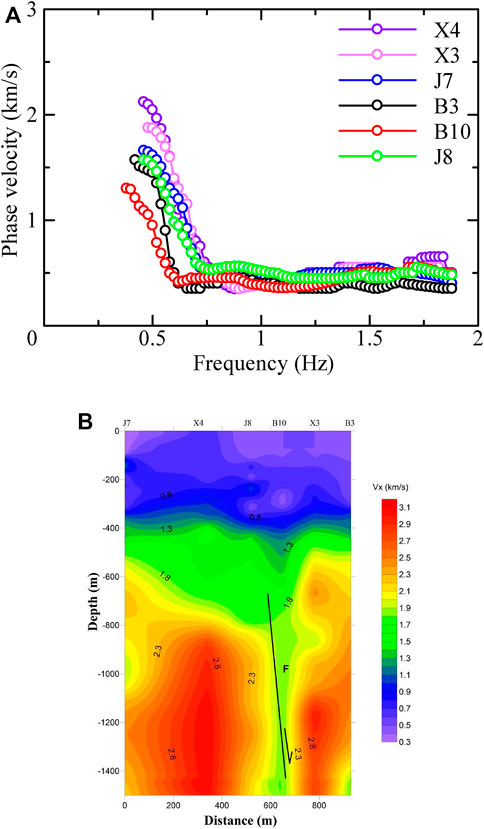
FIGURE 5. Dispersion curve of all the survey points (A) and 2D apparent S-wave velocity section to identify the buried channel for heat flow (B).
At the survey point located in the fault, the dispersion curve showed a low phase velocity at a low frequency compared with other dispersion curves. The apparent S-wave velocity section clearly indicated a buried fault. The strata can be divided into several layers. The depth of the first layer was 0–100 m, with a Vx of 300–400 m/s. The Vx of the second layer varied from 600 to 900 m/s at depths of 100–350 m. The lithology barely changed in this layer, and fracture zones developed in the third layer. An obvious low-velocity anomaly was observed from 800 to 1,500 m at distance of 600–650 m. The Vx values of the low-velocity anomaly and normal layer were approximately 1,600 m/s and 3,000 m/s, respectively. This anomaly is named Fault F1, and its width is approximately 50 m. Compared with the fracture zone, the surrounding rock is intact with high wave velocity. Geothermal resources are strongly related to this fault, which breaks and cuts off the fresh bedrock, resulting in fracture zones. This provides an excellent channel for heat flow.
The 2D microtremor profiling method has relatively high precision for probing geological structures. In the section of apparent S-wave velocity, the strata that are stably deposited (uniform colour) could be continuously traced laterally. Areas with obvious lithology changes, such as fault fracture zones, showed low-velocity anomalies because of the underestimation of phase velocity using SPAC. The obvious low-velocity anomaly can be used to interpret and identify buried faults (fracture zones) and other geological structures in the apparent S-wave velocity profile.
According to the comparison study and analysis of the detection results of the 2D microtremor profiling method and drilling results, it can be seen that the buried fracture zone displayed an obvious low-velocity anomaly in the 2D apparent S-wave velocity profile, which is an important indicator explaining the buried geothermal structure. Using the 2D micromotion profiling method to detect the thermal control structure and exploit the convection-type geothermal resources, the detection accuracy was high, and the measured effect was good. There were obvious lithologic differences on both sides of the normal fault plane, and the detection effect was good.
Tracking Irregular Strata Shapes
Estimating the amount of geothermal energy and exploiting geothermal resources requires a comprehensive understanding of the upward and downward trends of strata. The diagenetic environment of different geological periods and the function of tectonic movement in the test area resulted in complex geological structures. As a result, the strata were not homogeneous. Geophysical sections imaged the subsurface to generate a prospective stratigraphic structure. For conductive geothermal resources, information on reservoirs helps to calculate the total reserves of geothermal resources and locate the best drilling position.
Data Acquisition
Here, one research area in Shandong Province, China, is taken as an example to track the shape of different layers using a 2D apparent S-wave velocity section. This research area mainly exploits shallow geothermal resources above 150 m. The microtremor survey line included four survey points. The observation radii were 5–10–20–40 m. The main frequency of the observation seismometer was 2 Hz. The microtremor signal was recorded for 50 min in each observation array.
Data Processing and Discussion
The processing workflow for extracting the Rayleigh wave dispersion curve was the same as that for the above two sections. All the dispersion curves of the survey points are shown in Figure 6A. In addition, the dispersion curve of every survey point was transformed into Vx-H. The section was plotted using lateral Kriging interpolation and smoothing of the survey points.
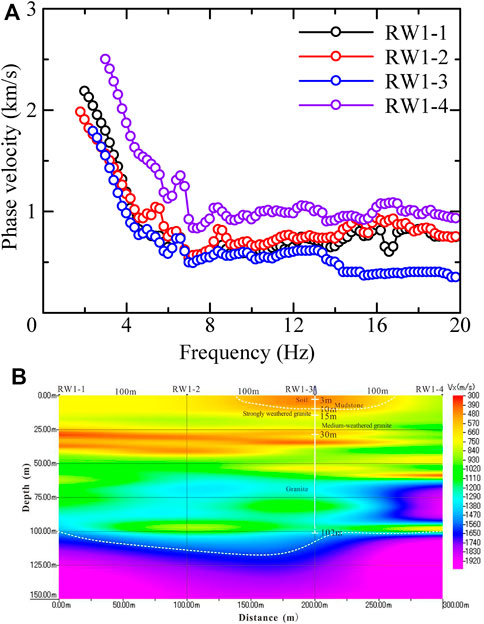
FIGURE 6. Dispersion curve of all the survey points (A) and 2D apparent S-wave velocity section to track the irregular shapes of the cap layers or reservoirs (B).
Figure 6A shows that the phase velocity of survey points RW1-4 is larger than that of the others. The dispersion curves of RW1-1 to RW1-3 exhibit the same spreading trend. The apparent S-wave velocity section shows that the strata are complex and variable (Figure 6B). Soil and mudstone develop from 0 to 10 m near survey point RW1-3. It only develops around survey point RW1-3 and stretches approximately 100 m horizontally. The Vx of the soil and mudstone was approximately 350–390 m/s. In the depth range of 25–40 m, a low-velocity layer was developed, which disappeared at a horizontal distance of 270 m with a Vx of 300–350 m/s. In this research area, weathered granite was developed to different degrees. The strongly weathered granite had a Vx of approximately 600 m/s leading to wide dispersion. Below this layer, medium-weathered granite also developed widely. Its thickness is approximately 40–50 m and the Vx is approximately 900–1,000 m/s. The Vx of the fresh granite was approximately 1,100–1,200 m/s. Below a depth of 125 m, the bedrock is intact, and the Vx was greater than 1,400 m/s.
At survey point RW1-3, drilling to a depth of 102 m was emplowed to verify the effectiveness of the MSM. The rock core of this borehole included soil, mudstone, strongly weathered granite, medium-weathered granite, and granite. Based on the correlation with these drilling materials, the 2D microtremor profile method could distinguish weathered granite with different degrees. In addition, it accurately determined the bedrock. Using the 2D apparent S-wave velocity section, we could track the developing trends of different rock layers, including geothermal reservoirs and cap layers. Meanwhile, it provided geological information on the bedrock, which plays an important role in the development of shallow geothermal resources.
Conclusion
Geothermal resources have received much attention because of the requirement for energy conservation and emissions reduction. As one kind of green energy that comes from the Earth’s interior, it is stable and sustainable. Geothermal amounts above 3 km of, subsurface and generating power, can be widely used for geothermal resources, such as warming, cooling, and generating power. Geophysical methods are usually adopted to provide essential information to search for an excellent developing target area.
The MSM is a new approach that has been successfully applied to geothermal exploration. It adopts ambient noise as a signal to avoid the inconvenience of an artificial signal source. In addition, the observation array for recording the field data is independent. Compared with traditional geophysical methods, the MSM is flexible and economical. In particular, it can be deployed under the interference of human and industrial activities. Because most of the development and utilisation of geothermal resources is located in cities or towns, this method is regarded as one of the most effective.
According to different exploration purposes, MSMs can be classified into two types: microtremor sounding methods and 2D microtremor profiling methods. The microtremor sounding method uses a genetic algorithm for inversion. It provides the parameters of the different rock layers and the S-wave velocity, layer thickness, and density are obtained from the inversion. In some research areas, cap layers and reservoirs are known. For geothermal exploration, it is necessary to provide the depth, thickness S-wave velocity, and density. The microtremor sounding method can accurately identify the related parameters of the different layers. The 2D microtremor profiling method must deploy several survey points to achieve an apparent S-wave velocity section. It can be used to identify the location and depict the developed characteristics of the buried channel. In addition, it can track the irregular shapes of cap layers or reservoirs. Based on the comparison between the results of the MSM and borehole, it is verified that this method is accurate and reliable for geothermal exploration. The development of clean and green energy is a new approach for geothermal exploration.
Data Availability Statement
The raw data supporting the conclusion of this article will be made available by the authors, without undue reservation.
Author Contributions
TB: Methodology, writing—review and editing. DZ: Supervision. YL: Writing—review and editing, investigation FY and ZB:Investigation.
Funding
This work was supported by the National Natural Science Foundation of China (under grant 41941016-01) and Institute of Geophysics, China Earthquake Administration (under grant DQJB21K47).
Conflict of Interest
YL, FY, and ZB were employed by the China Three Gorges Corporation.
The remaining authors declare that the research was conducted in the absence of any commercial or financial relationships that could be construed as a potential conflict of interest.
Publisher’s Note
All claims expressed in this article are solely those of the authors and do not necessarily represent those of their affiliated organizations, or those of the publisher, the editors and the reviewers. Any product that may be evaluated in this article, or claim that may be made by its manufacturer, is not guaranteed or endorsed by the publisher.
Acknowledgments
The authors would like to express deep gratitude to the editors and reviewers for their valuable comments and suggestions that greatly improved this paper.
References
Aki, K. (1957). Space and Time Spectra of Stationary Stochastic Waves with Special Reference to Microtremors. Bull. Earthquake Res. Inst. Tokyo Univ. 35, 415–456.
Ars, J.-M., Tarits, P., Hautot, S., Bellanger, M., Coutant, O., and Maia, M. (2019). Joint Inversion of Gravity and Surface Wave Data Constrained by Magnetotelluric: Application to Deep Geothermal Exploration of Crustal Fault Zone in Felsic Basement. Geothermics 80 (7), 56–68. doi:10.1016/j.geothermics.2019.02.006
Asten, M. W. (2006). On Bias and Noise in Passive Seismic Data from Finite Circular Array Data Processed Using SPAC Methods. Geophysics 71, V153–V162. doi:10.1190/1.2345054
Asten, M. W., Stephenson, W. J., and Hartzell, S. (2019). Spatially Averaged Coherencies (krSPAC) and Rayleigh Effective-Mode Modeling of Microtremor Data from Asymmetric Arrays. Geophysics 84, EN47–EN56. doi:10.1190/geo2018-0524.1
Bettig, B., Bard, P. Y., Scherbaum, F., and Riepl, J. (2001). Analysis of Dense Array Noise Measurements Using the Modified Spatial Auto-Correlation Method (SPAC): Application to the Grenoble Area. Bollettino di Geofisica Teorica Ed. Applicata 42, 281–304.
Capon, J. (1969). High-resolution Frequency-Wavenumber Spectrum Analysis. Proc. IEEE 57 (8), 1408–1418. doi:10.1109/proc.1969.7278
Chávez-García, F. J., Luzón, F., Raptakis, D., and Fernández, J. (2007). Shear-wave Velocity Structure Around Teide Volcano: Results Using Microtremors with the SPAC Method and Implications for Interpretation of Geodetic Results. Pure Appl. Geophys. 164, 697–720. doi:10.1007/s00024-007-0184-9
Cho, I., and Iwata, T. (2021). Limits and Benefits of the Spatial Autocorrelation Microtremor Array Method Due to the Incoherent Noise, with Special Reference to the Analysis of Long Wavelength Ranges. J. Geophys. Res. Solid Earth 126 (2), e2020JB019850. doi:10.1029/2020JB019850
Claprood, M., Asten, M. W., and Kristek, J. (2011). Using the SPAC Microtremor Method to Identify 2D Effects and Evaluate 1D Shear-Wave Velocity Profile in Valleys. Bull. Seismological Soc. America 101 (2), 826–847. doi:10.1785/0120090232
Di, Q., Shi, K., Li, Y., Wang, R., Fu, C., and An, Z. (2006). Successful Applications of CSAMT for Deep Geothermal Exploration in Urban Areas. SEG Tech. Program Expanded Abstr., 820–824. doi:10.1190/1.2370383
Domra Kana, J., Djongyang, N., Danwe Raïdandi, D., Njandjock Nouck, P., and Abdouramani Dadjé, fnm. (2015). A Review of Geophysical Methods for Geothermal Exploration. Renew. Sustain. Energ. Rev. 44, 87–95. doi:10.1016/j.rser.2014.12.026
Lüschen, E., Görne, S., von Hartmann, H., Thomas, R., and Schulz, R. (2015). 3D Seismic Survey for Geothermal Exploration in Crystalline Rocks in Saxony, Germany. Geophys. Prospecting 63 (4), 975–989. doi:10.1111/1365-2478.12249
Maithya, J., Fujimitsu, Y., and Nishijima, J. (2020). Analysis of Gravity Data to Delineate Structural Features Controlling the Eburru Geothermal System in Kenya. Geothermics 85 (5), 101795. doi:10.1016/j.geothermics.2019.101795
Ohori, M., Nobata, A., and Wakamatsu, K. (2002). A Comparison of ESAC and FK Methods of Estimating Phase Velocity Using Arbitrarily Shaped Microtremor Arrays. Bull. Seismological Soc. America 92 (6), 2323–2332. doi:10.1785/0119980109
Okada, H., and Ling, S. Q. (1994). About a Recent Study on the Surveying Geologic Structures by Using the Microtremor Survey Method. Sapporo, Hokkaido: Report of Hokkaido University. (in Japanese).
Okada, H., and Suto, K. (2003). The Microtremor Survey Method. Geophysical Monograph Series No.12. Tulsa: Society of Exploration Geophysicists. doi:10.1190/1.9781560801740
Okada, H. (2006). Theory of Efficient Array Observations of Microtremors with Special Reference to the SPAC Method. Exploration Geophys. 37, 73–85. doi:10.1071/EG06073
Ozer, C., Ozyalin, S., Ozel, O., and Polat, O. (2017). Determination of Soil Characteristic Using SPAC Method in Karsiyaka-Izmir, Turkey. Iosr Jagg 05 (2), 53–59. doi:10.9790/0990-0502015359
Planès, T., Obermann, A., Antunes, V., and Lupi, M. (2020). Ambient-noise Tomography of the Greater Geneva Basin in a Geothermal Exploration Context. Geophys. J. Int. 220 (1), 370–383. doi:10.1093/gji/ggz457
Raptakis, D., and Makra, K. (2010). Shear Wave Velocity Structure in Western Thessaloniki (Greece) Using Mainly Alternative SPAC Method. Soil Dyn. Earthquake Eng. 30, 202–214. doi:10.1016/j.soildyn.2009.10.006
Roberts, J., and Asten, M. (2008). A Study of Near Source Effects in Array-Based (SPAC) Microtremor Surveys. Geophys. J. Int. 174 (1), 159–177. doi:10.1111/j.1365-246X.2008.03729.x
Roberts, J., and Asten, M. (2005). Estimating the Shear Velocity Profile of Quaternary Silts Using Microtremor Array (SPAC) Measurements. Exploration Geophys. 36 (1), 34–40. doi:10.1071/EG05034
Rosenkjaer, G. K., Gasperikova, E., Newman, G. A., Arnason, K., and Lindsey, N. J. (2015). Comparison of 3D MT Inversions for Geothermal Exploration: Case Studies for Krafla and Hengill Geothermal Systems in Iceland. Geothermics 57 (9), 258–274. doi:10.1016/j.geothermics.2015.06.001
Sandberg, S. K., and Hohmann, G. W. (1982). Controlled‐source Audiomagnetotellurics in Geothermal Exploration. Geophysics 47 (1), 100–116. doi:10.1190/1.1441272
Sena-Lozoya, E. B., González-Escobar, M., Gómez-Arias, E., González-Fernández, A., and Gómez-Ávila, M. (2020). Seismic Exploration Survey Northeast of the Tres Virgenes Geothermal Field, Baja California Sur, Mexico: A New Geothermal prospect. Geothermics 84 (3), 101743. doi:10.1016/j.geothermics.2019.101743
Setiawan, B., Jaksa, M., Griffith, M., and Love, D. (2019). Estimating Near Surface Shear Wave Velocity Using the SPAC Method at a Site Exhibiting Low to High Impedance Contrast. Soil Dyn. Earthquake Eng. 122, 16–38. doi:10.1016/j.soildyn.2019.03.036
Stephenson, W. J., and Odum, J. K. (2010). 28. Application of the Spatial-Autocorrelation Microtremor-Array Method for Characterizing S-Wave Velocity in the Upper 300 M of Salt Lake Valley, Utah. Geophys. Dev. Ser., 447–460. doi:10.1190/1.9781560802259.ch28
Tian, B., Du, Y., Jiang, H., Zhang, R., and Zhang, J. (2020a). Estimating the Shear Wave Velocity Structure above the Fresh Bedrock Based on Small Scale Microtremor Observation Array. Bull. Eng. Geol. Environ. 79, 2997–3006. doi:10.1007/s10064-020-01761-7
Tian, B., Du, Y., You, Z., and Zhang, R. (2019). Measuring the Sediment Thickness in Urban Areas Using Revised H/V Spectral Ratio Method. Eng. Geology. 260, 105223. doi:10.1016/j.enggeo.2019.105223
Tian, B., Kong, Y., Gong, Y., Ye, C., Pang, Z., Wang, J., et al. (2020c). Thermal Conductivity Characterisation of Shallow Ground via Correlations with Geophysical Parameters. Eng. Geology. 272, 105633. doi:10.1016/j.enggeo.2020.105633
Tian, B., Kong, Y., Gong, Y., Ye, C., Pang, Z., Wang, J., et al. (2020b). An Improved Volumetric Method of Geothermal Resources Assessment for Shallow Ground Combining Geophysical Data. Renew. Energ. 145, 2306–2315. doi:10.1016/j.renene.2019.08.005
Tian, B., Xu, P., Ling, S., Du, J., Xu, X., and Pang, Z. (2017). Application Effectiveness of the Microtremor Survey Method in the Exploration of Geothermal Resources. J. Geophys. Eng. 14, 1283–1289. doi:10.1088/1742-2140/aa7f4e
Tian, B., Xu, P., Ling, S., Xu, X., Du, J., and Pang, Z. (2016). Application of the Initial Model Feature of Microtremor to Investigate a Part of the Geothermal Field of Jiangsu Region in China. Environ. Earth Sci. 75, 1298. doi:10.1007/s12665-016-5940-7
Tian, B., You, Z., Wang, G., and Zhang, J. (2022). Building a Geothermal Formation Model Using Microtremor Array Measurement. Geophysics 87 (1), B23–B30. doi:10.1190/geo2021-0014.1
Uchida, T., and Sasaki, Y. (2006). Stable 3D Inversion of MT Data and its Application to Geothermal Exploration. Exploration Geophys. 37 (3), 223–230. doi:10.1071/EG06223
Uwiduhaye, J. d. A., Mizunaga, H., and Saibi, H. (2018). Geophysical Investigation Using Gravity Data in Kinigi Geothermal Field, Northwest Rwanda. J. Afr. Earth Sci. 139 (3), 184–192. doi:10.1016/j.jafrearsci.2017.12.016
Keywords: geothermal resources, exploration, microtremor survey method, strata parameters, buried channel
Citation: Baoqing T, Zhifeng D, Liming Y, Yifan F and Bo Z (2022) Microtremor Survey Method: A New Approach for Geothermal Exploration. Front. Earth Sci. 10:817411. doi: 10.3389/feart.2022.817411
Received: 18 November 2021; Accepted: 03 January 2022;
Published: 20 January 2022.
Edited by:
Haibing Shao, Helmholtz Association of German Research Centres (HZ), GermanyCopyright © 2022 Baoqing, Zhifeng, Liming, Yifan and Bo. This is an open-access article distributed under the terms of the Creative Commons Attribution License (CC BY). The use, distribution or reproduction in other forums is permitted, provided the original author(s) and the copyright owner(s) are credited and that the original publication in this journal is cited, in accordance with accepted academic practice. No use, distribution or reproduction is permitted which does not comply with these terms.
*Correspondence: Tian Baoqing, dGlhbmJhb3FpbmdAY2VhLWlncC5hYy5jbg==; Ding Zhifeng, ZGluZ3pmQGNlYS1pZ3AuYWMuY24=