- College of Transportation Engineering, Nanjing Tech University, Nanjing, China
In view of the failure characteristics of rainfall erosion and imbricate layered sliding of silt subgrade slopes, this paper proposes a slope surface protection technology that is a composite protection layer that combines basalt fibre for reinforcing soil and polyacrylamide for solidifying soil. The anti-infiltration and anti-erosion performances of these proposed composite layers were systematically investigated through the finite element and discrete element numerical simulation methods. Based on the optimum proportions of polyacrylamide and basalt fibre found in a series of mechanical experiments, Geo-studio software was used to simulate numerical tests of rainfall infiltration of the silt subgrade slope, and the variation laws of volumetric water content and pore water pressure at the characteristic points and the selected sections of the slope were discussed. In addition, the PFC2D particle flow program was used to develop numerical tests on the slope erosion process of the composite layers and to analyze the degree of soil erosion during the process. The influences of layer thickness on infiltration and erosion were considered. In conclusion, the results indicate that the composite layers can effectively improve the anti-infiltration and anti-erosion performances of the silt subgrade slope. This highlights that the thickness of composite layers mixed with basalt fibre can satisfy the design parameter requirements for anti-erosion performance.
Introduction
Silt consists of Quaternary fluvial-lacustrine or aeolian sediments, which are widely distributed in the lower course of the Yellow River, Huaihe River and Haihe River in China. A silt is a fine-grained soil, or the fine-gained portion of a soil, with a plasticity index less than 4 or having the plot of plasticity index versus liquid limit fall below the “A” line (ASTM, 2011). Silt is easily hydrated when it is soaked, which worsens its engineering properties (Wang, et al., 2020). When silt is used as a subgrade material, rainfall infiltration and runoff can easily erode and scour the silt on the slope surface and induce layered slipping of the silt subgrade.
The erosive potential of rain, referred to as “erosivity”, depends on the rain intensity and the size and speed of fall of the raindrops (Renard, 1997). Soil detachment by raindrops is expressed as a function of their kinetic energy, which depends on the quantity of rain and the intensity of the showers. Runoff is the second factor in erosion, and it occurs when the porosity of the soil is saturated or when rainfall intensity exceeds the infiltration capacity. Runoff water detaches and transports solid grains and is an essential agent in erosion. The action of runoff on particle detachment depends on the hill-slope morphology and the speed and depth of the flow (Alavinia et al., 2018; Chehlafi et al., 2019; Acharki et al., 2022; Yang et al., 2022). Erosion can be quantified by periodic and accurate topographic measurements of the surface of an experimental plot or by rain simulation and reclamation of eroded soil at the foot of the slope (Courault et al., 1993; Ferro, 1998; Guo and Griffiths, 2020). Other methods rely on physical and mathematical models to quantify soil erosion (Meyer and Wischmeier, 1969; Cochrane and Flanagan, 2001; Kang et al., 2019; Fan et al., 2020). These methods, when they are well established, are an indispensable tool in choosing anti-erosion practices that allow for limiting runoff volumes and better controlling flow water on the slope scale.
Silt stabilization is a process of improving the physical and mechanical properties of a problematic silt to some predetermined targets (Adamo, et al., 2006; Giannopoulou et al., 2009; Kang, et al., 2021), which is currently one of the well-accepted ways to treat and utilize silt (Dohnalkov et al., 2018; Cristelo et al., 2012; Hou et al., 2016). Stabilization often significantly increases the strength and reduces the compressibility of the soil (Blanck et al., 2013; Chen et al., 2019; Eisazadeh et al., 2013; Guo et al., 2020a). Advancing silt stabilizer research and promoting its application in construction projects can enhance desilting in rivers, lakes, and coastal tidal flat deltas, which has important significance for the sustainable development of the economy, society, and environment (Zezin, et al., 2015; Fu, et al., 2020; Wang, et al., 2021a). Traditional stabilizers include slag (Wild et al., 1998; Gao et al., 2021), coal furnace fly ash (Kolias et al., 2005; Show et al., 2003; Arulrajah et al., 2018; Disfani et al., 2015), cement and lime (Lemaire et al., 2013), cement cellar dust (Baghdadi et al., 1997; Miller and Azad, 2000; Rivard-Lentz et al., 1997), domestic waste incineration slag (Kukko, 2000; Consoli et al., 2019), unconventional additives (Seco et al., 2011; Urena et al., 2013), lignin (Cai et al., 2016), alkaline activators (Cristelo, et al., 2012; Wang, et al., 2019), lime (Little, 1995; Choobbasti, et al., 2010), and calcium carbide residue (Jiang, et al., 2016; Du, et al., 2016). To date, silt stabilization research and practice have made good progress (Indraratna et al., 2012; Kavitha et al., 2015), but there is still much room for improvement, including stabilization effectiveness and cost (Marto et al., 2014; Suksiripattanapong, et al., 2015; Guo et al., 2020b; Wang, et al., 2021b).Based on a new slope protection system of three composite layers [silt and polyacrylamide (SP layer); silt, basalt fibre and polyacrylamide (SBP layer); and silt and basalt fibre (SB layer)], the aim of this study is to explore the anti-infiltration and anti-erosion performances of the composite layers and discuss the thicknesses of the SP, SBP and SB layers by means of mechanical and erosional experiments and the rainfall infiltration and erosion of numerical simulation.
Material and Mechanical Experiments
Traditional slope protection methods with anti-infiltration and anti-erosion features have certain limitations. In this section, the material properties and the structural characteristics of composite layers mixed with polyacrylamide solidification and basalt fibre reinforcement are presented. After that, direct shear tests and erosion tests of these proposed composite layers are conducted to determine the optimum content of the basalt fibre and polyacrylamide as well as the optimum length of the basalt fibre.
Slope Protection Structure
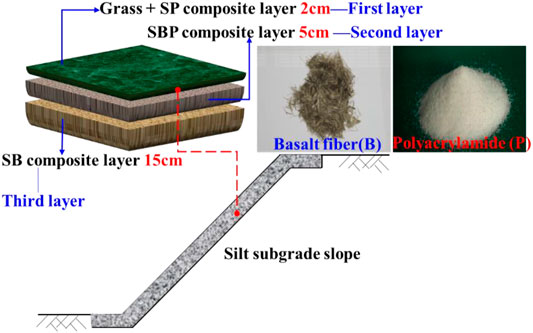
Basalt fibre is an inorganic fibre obtained from natural basalt as a raw material through high-temperature melting, wire drawing, and cooling. Due to its excellent performance characteristics, such as high tensile strength, large elastic modulus, good corrosion resistance and chemical stability, basalt fibre is widely used to prevent tensile crack formation and increases in brittleness and to improve the shear strength and unconfined compressive strength of silt subgrades. Polyacrylamide, as a soil stabilizer agent, has good flocculation and agglomeration functions, which can effectively enhance the agglomeration effect between soil particles. The composite layers have three layers (Figure 1). The top layer is a grass planting + SP layer (0.5–2 cm) consisting of grass, silt, and polyacrylamide with liquid plant nutrients, which can reduce rainwater runoff and solidify soil. The intermediate layer is an SBP layer (2–5 cm) containing silt, basalt fibre, and polyacrylamide with liquid plant nutrients, which can strengthen the silt structure, increase the cohesion of aggregate, reduce rainfall infiltration, and improve the tensile and shear strength of the soil of the slope. The bottom layer is an SB layer (5–15 cm) that includes silt and basalt fibre, which can connect the soils between the surface and depth. Moreover, the distribution of nondirectional fibre can preferably prevent soil erosion and slipping along with the surface layer.
Mechanical Properties of Raw Materials
The silt used in this research was dug from the Suqian section of provincial highway 325 in Jiangsu Province, China. The physical properties of silt are greyish-yellow, very wet, high-density, lusterless, low toughness, low dry strength and uniform particles. Tests were conducted to determine the basic physical characteristics and mechanical properties of the silt, as shown in Table 1. Most particles of silt are mainly concentrated in the range of 0.075–0.005 mm, the silt content accounts for 97.8%, and the clay content is approximately 2.2%. The coefficient of nonuniformity Cu (d60/d10) is 3.0, and the particle size distribution is relatively uniform, the curvature coefficient Cc(d230/(d10·d60)) is 1.33. Therefore, it can be judged that it is a poorly graded fine-grained soil with most of the silt content and very few clay content. Additionally, the mechanical properties of the main compositions of the basalt fibre and the polyacrylamide are shown in Tables 2, 3, respectively.
Specimen Preparation and Testing Methods
In this study, a series of direct shear tests were conducted on specimens of the original silt, silt mixed with basalt fibre, silt mixed with polyacrylamide, and silt mixed with both basalt fibre and polyacrylamide using a ZJ strain-controlled direct shear instrument with a shear rate of 0.8 mm/min. The different failure surfaces of composite silt obtained by incorporating different solidified materials are shown in Figure 2.

FIGURE 2. Failure surfaces of composite specimens in the direct shear test. (A) Silt, (B) silt mixed with basalt fibre (B), (C) silt mixed with polyacrylamide (P) and (D) silt mixed with both B and P (SBP)
A professional rainfall sprinkler, whose precipitation degree and time can be adjusted independently, was used for the erosion experiments to test various rainfall durations in different rainy season conditions (Figure 3A). To investigate the anti-erosion performances of the mixed specimens under four rainfall durations, as shown in Figure 3B, this study mainly analysed the mass losses and block spalling damage of the specimens. A filter screen was set below the specimen to measure the soil that was peeled off due to rainfall erosion. To quantify the rainfall erosion of the mixed specimens, the average rainfall intensity was set as 60.6 ± 0.5 mm/h, and the rainfall durations were 30, 60, 90, and 240 min (Figure 3B).
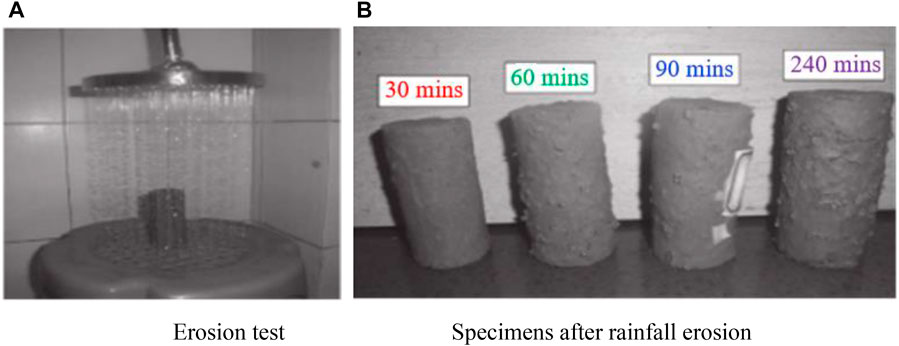
FIGURE 3. Erosion tests and specimens after rainfall erosion with different rainfall durations. (A) Erosion test (B) Specimens after rainfall erosion
After a series of designated rainfall times, the volumes of some specimens increased to varying degrees but did not collapse. However, a few cracks and erosion damage began to appear in the specimens when the erosion time increased to 240 min. The spalling soil and air-dried unqualified soils were collected under natural conditions, and then the weight was measured approximately 2 days later. An air-dried specimen was used to investigate the relationship between the mass loss rate and erosion time.
Mechanical Experiments on Silt and Polyacrylamide Composite Layer
Direct Shear Test
To explore the optimum content ratio of the polyacrylamide in the mixture of the first layer, direct shear tests were used to test the shear performances, and erosion tests were used to show the anti-erosion properties of the composite SP layer. Table 4 presents symbols for the original silt and four different component ratios of the polyacrylamide, 1, 2, 3, and 4%.
Figure 4 shows the stress-strain curves of the five solidified SP specimens under different vertical pressures. There is no obvious peak value in the shear stress displacement curve of plain silt, which is characterized by hardening strain. The stress-strain relationships of the SP mixed specimens have obvious peak values, showing softening strain characteristics. From Figure 4, the peak strength of the SP mixed specimens decreased under the same vertical pressure as the polyacrylamide content increased, and the shear stress increased as the vertical pressure increased.
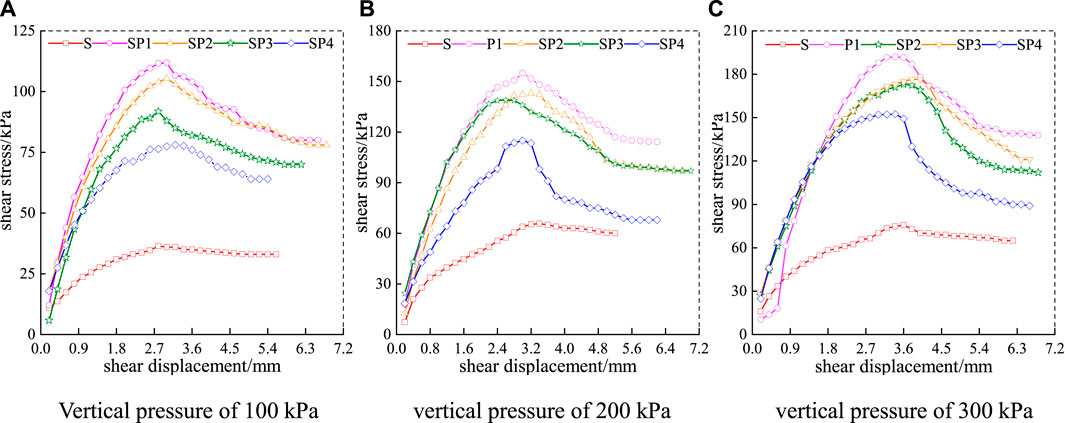
FIGURE 4. Stress-strain curves of the different SP mixed silts under three vertical pressures. (A) Vertical pressure of 100 kPa (B) vertical pressure of 200 kPa (C) vertical pressure of 300 kPa
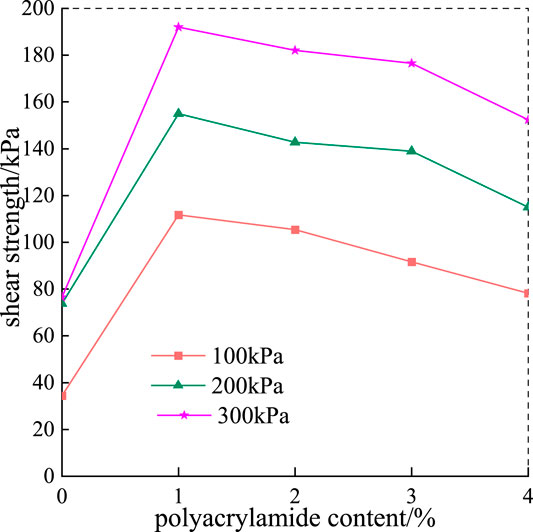
Figure 5 presents a comparison of the shear strength of the polyacrylamide content at 100 kPa, 200 kPa, and 300 kPa. With the increase in polyacrylamide mixed into the silt, the shear strength of the SP mixed silt first increased and then decreased with increasing polyacrylamide content. The peak strength of the SP mixed specimen is obtained when the content of polyacrylamide is 1% for every vertical pressure. It can also be found that the strength of solidified 1% polyacrylamide silt at the three vertical pressures is 224.4, 109.9, 150.7% higher than that of plain silt.
Each shear test was conducted to obtain the cohesion and internal friction angle of the different polyacrylamide contents of the mixed silt, as shown in Table 5. The incorporation of polyacrylamide substantially increases the cohesion 3) and internal friction angle (φ) of SP mixed silt, and the c and φ of the SP1 specimen are 1.64 times and 2.47 times those of plain silt, respectively. From Table 5, it is observed that c and φ reached a maximum and then decreased with increasing polyacrylamide content; generally speaking, the maximum c and φ of mixed silt is SP1. The reason is that polyacrylamide is absorbed on the surface of silt particles through the active groups on the long carbon chain, forming a spatial grid structure between silt particles to improve the aggregate bonding between silt particles and effectively enhance the shear performance of the mixed soil. However, when the content of polyacrylamide is too high, a large number of polyacrylamide particles absorb water in the soil, the moisture content of the soil is greatly reduced, and the friction between the soil particles is reduced. Furthermore, part of the polyacrylamide is not dissolved in water and is unable to form aggregates, so the shear strength of the soil decreases.
Erosion Test
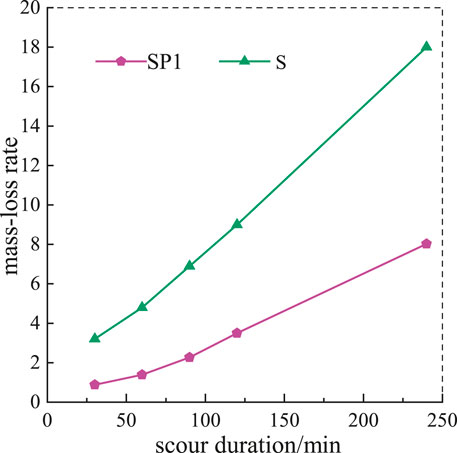
To investigate the erosion performance of the SP composite layer, erosion tests were carried out to select the optimum mixing ratio of the SP1 mixed silt and to compare the mass loss rate of the composite layer with that of the plain soil, as shown in Figure 6. The mass loss rates increased with increasing erosion duration for plain silt and SP1 mixed silt. The mass loss rate of plain silt increased sharply, but the increase of SP1 was relatively slow. The comparisons between the mass loss rate of plain silt and SP1 silt show that the anti-erosion performance of the composite layer increased by approximately 2.24–3 times. The hydrogen bonds and ionic bonds of polyacrylamide were absorbed on the surface of the soil particles, and the distance between the hydrophilic mineral layer and soil water decreased, which effectively enhanced the stability of the composite layer. Therefore, the SP1 composite layer can not only improve the shear strength but also effectively prevent soil erosion.
Direct Shear Test on Silt, Basalt Fibre and Polyacrylamide Composite Layer
The SBP mixed soil is the intermediate layer and includes silt, basalt fibre, and polyacrylamide. To study the influence of different contents of basalt fibre (B) and polyacrylamide (P) on the engineering performance of the SPB composite layer and to determine the optimum proportions, direct shear tests and penetration tests were conducted on the SBP specimens.
Table 6 summarizes the results of the direct shear tests of SBP mixed soil with different basalt fibre and polyacrylamide contents. According to the test results, the optimum content of basalt fibre is 0.4% and the optimum polyacrylamide content is 1%.
The stress-strain relationship curves of the optimum content of the SBP mixed soil and the plain silt under different vertical pressures are plotted in Figure 7A. It is clear that the variation trends of the stress-strain of those two soils are similar, but the shear stress of the SBP mixed soil is much greater than that of the plain silt with the same shear displacement. Figure 7B displays the peak strength change behaviour with the contents of two compositions of the mixed soil. The cohesion and internal friction angle of the SBP mixed soil are 1.88 times and 2.24 times that of plain silt, respectively, and the strength of the SBP composite layer increases by approximately 80–150%.
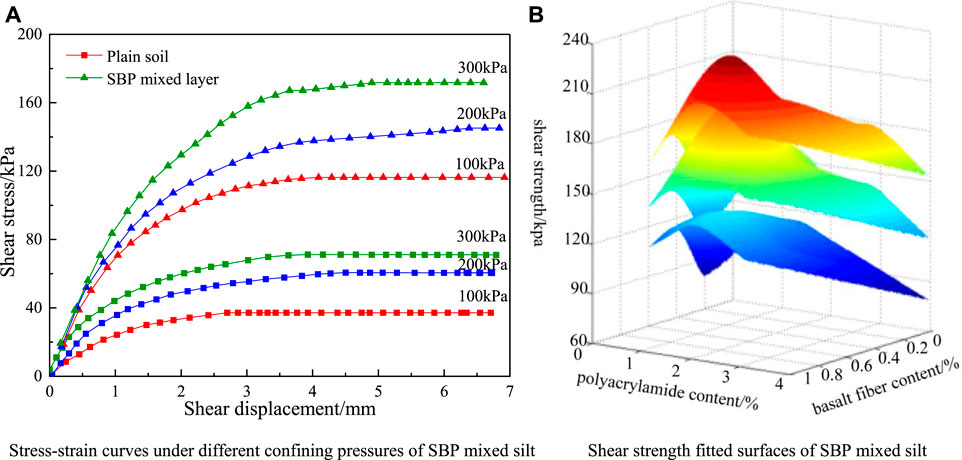
FIGURE 7. Stress-strain curves under different confining pressures of SBP mixed silt. (A) Stress-strain curves under different confining pressures of SBP mixed silt (B) Shear strength fitted surfaces of SBP mixed silt
Direct Shear Test on Silt and Basalt Fibre Composite Layer
The SB mixed layer is the bottommost of the composite layers and includes silt mixed with basalt fibre (B). Carrying out the direct shear test, the performances of the SB mixed soils were analysed with different basalt fibre contents and lengths. The different content ratios and lengths of the basalt fibre as well as the shear strengths of the SB mixed soils are shown in Table 7. In accordance with the direct shear test results, the optimal content and length of the basalt fibre are 0.4% and 12 mm, respectively, that is, SB2.
Figure 8 demonstrates the relationships between the shear strength and basalt fibre contents and lengths of the SB mixed soil under different vertical pressures. The shear strength of SB2 is obviously higher than that of the other SB mixed soils, and the strength of SB2 is almost 4 times that of plain silt. The reason why SB2 is the optimum content ratio and length is that if the basalt fibre easily overlaps and accumulates because the content is too high, it cannot fully contact the soil particles, and the basalt fibre cannot contribute to restraining deformation. If the reinforcement length is too short, the basalt fibres will be dispersed and cannot fully overlap between soil particles to form a network structure. The binding force between basalt fibre and soil particles will be reduced, which makes the basalt fibre easy to pull out. If the reinforcement length is too long, the long fibres easily agglomerate and bend, but the overlap and combination effect between fibre and soil particles is a disadvantageous factor.
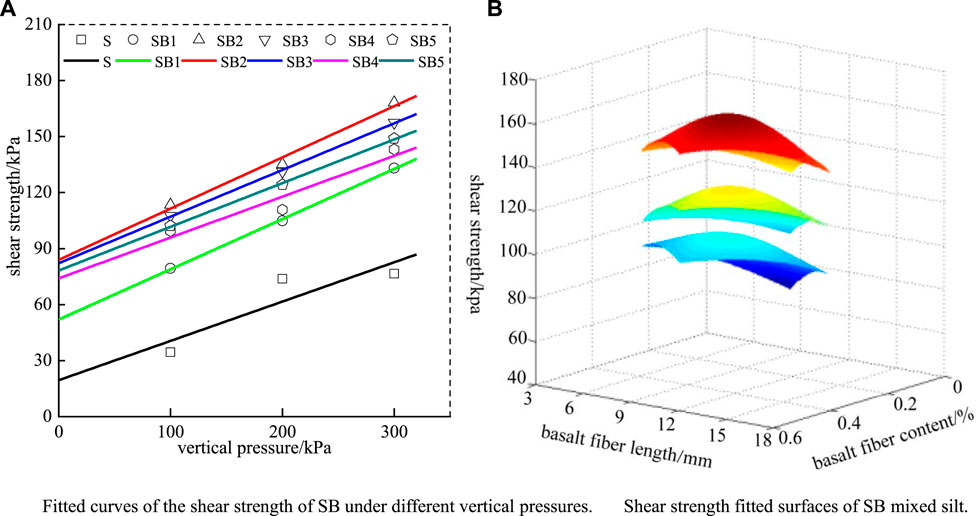
FIGURE 8. The shear strength behaviour of SB mixed silt under different vertical pressures. (A) Fitted curves of the shear strength of SB under different vertical pressures. (B) Shear strength fitted surfaces of SB mixed silt.
Numerical Simulation of Rainfall Infiltration
Numerical Model and Parameters
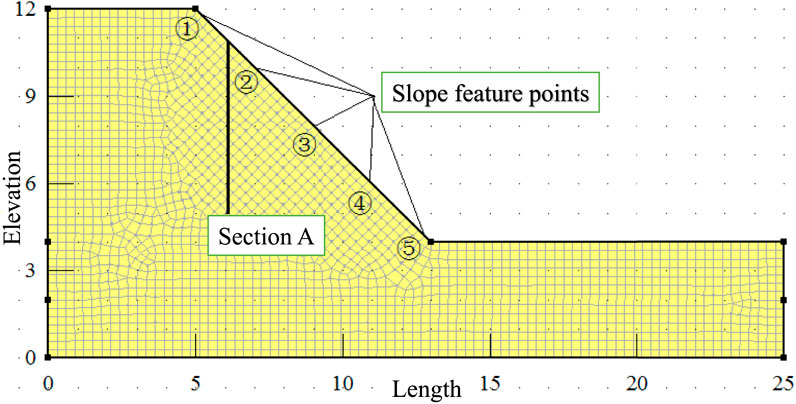
This section analyses the feasibility and practicability of the composite layers and considers the effects of rainfall infiltration and rainwater erosion on silt subgrade slope stability. A two-dimensional finite element model was established based on the geologic investigation and mechanical parameters of the silt subgrade slope in Suqian city, Jiangsu Province, as shown in Figure 9. The slope height is 12 m, and the length is 25 m. The calculation grid unit is set to 0.3 m, and the numbers of grid units and nodes are 2045 and 1936, respectively. Several feature points from the top to the bottom of the slope were selected to explore rain infiltration, and the geotechnical parameters are given in Table 8. According to the basic mechanical parameters of the soil obtained from the previous laboratory tests and engineering investigation, the van Genuchten mathematical model was used to calculate the volumetric soil water content and soil permeability coefficient of the silt subgrade corresponding to each matrix suction. With the change in the composite protection surface, the corresponding mechanical parameters were substituted into the van Genuchten model to compute the volumetric water content and permeability coefficient of different types of soil layers.
Based on the above analysis of the three mixed layers, the optimum composite protection surface should take 0.4% basalt fibre with lengths of 12 mm and 1% polyacrylamide to mix with plain silt in the corresponding layer. The mechanical parameters of SP, SBP, and SB are shown in Table 9.
Results of Rainfall Infiltration
Volumetric Water Content
Figure 10A shows the distribution of the volumetric water content of the silt subgrade slope with and without the composite protection layers after rainfall. The volumetric water content of both slope conditions (without or with composite layers) increases rapidly from the relative minimum, however, the distribution area of the volumetric water content of the slope with composite layers is significantly smaller than that of the slope without composite layers. The subgrade slope with composite protection layers rises to the saturated volumetric water content of 0.46 only in the SP mixed layer, and the area of variable volumetric water content occupies 27% of the slope. In contrast, the area of variable volumetric water content without composite layers takes up 42% of the slope. The groundwater table without composite layers rises to around 0.28 m above the toe of the slope, which is more dangerous for toe failure of the slope. For the composite layers, the groundwater table passes through the foundation layer below the toe of the slope, which is safer for the weakest part of the slope (shown Figure 10A).
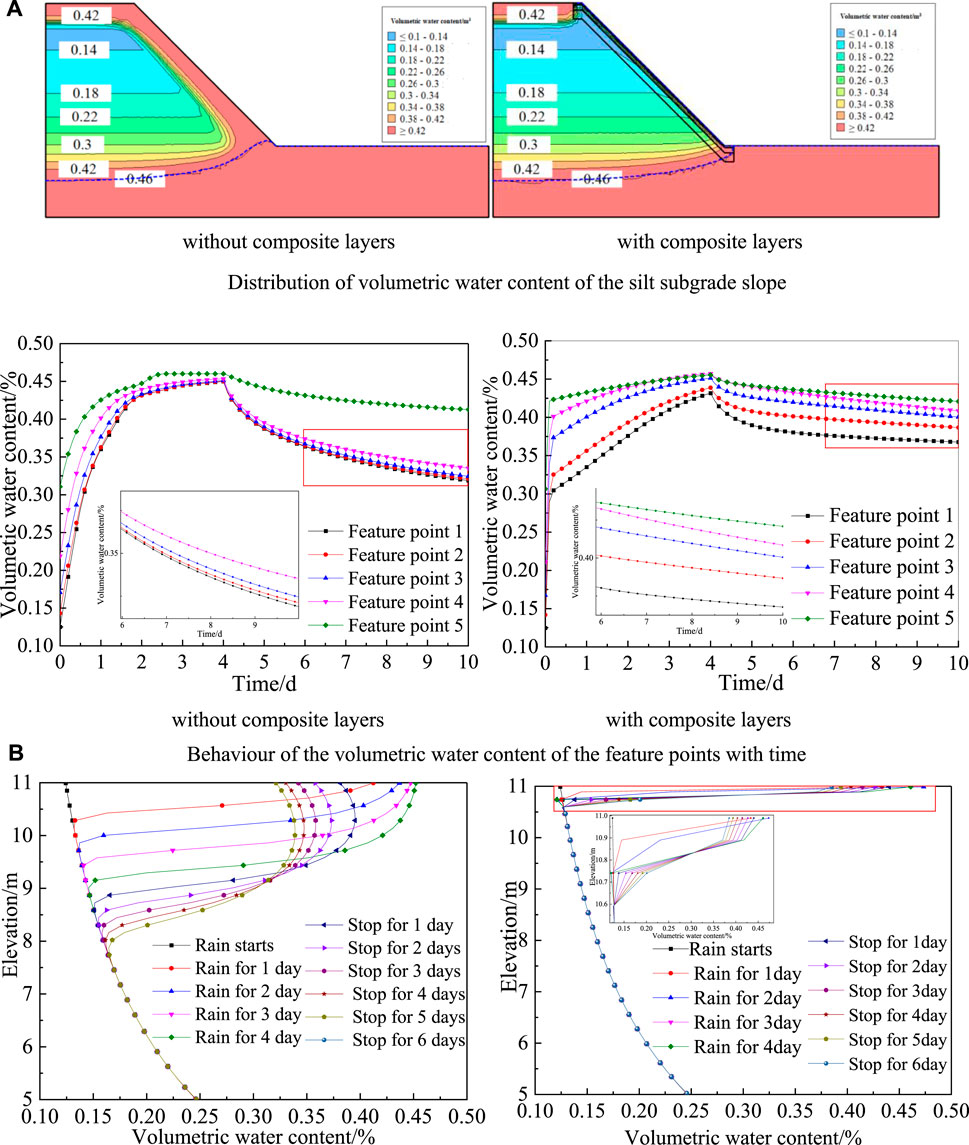
FIGURE 10. Behaviour of the volumetric water content of the silt subgrade slope with time and elevation. (A) Distribution of volumetric water content of the silt subgrade slope. (B) Behaviour of the volumetric water content of the feature points with time. (C) Behaviour of the volumetric water content of section A with elevation
Figure 10B compares the behaviour of the volumetric water content of the feature points as rain falls over time with and without composite layers. The volumetric water content speedily increases with increasing rainfall time and reaches the peak in volumetric water content on 4 days. Feature point 5 is located on the toe of the subgrade slope and has the maximum volumetric water content. Feature points 1 to 4 are located at the slope surface and the changing trend of their volumetric water content are comparatively similar, those which are smaller than that of feature point 5. For the without composite layers, the volumetric water contents of feature points 1 to 4 reduce at a faster rate after 4 days, while the reduction rate of feature point 5 is relatively slow 4 days later. That is, after the rainfall stopped, most of the water gradually gathered at the slope toe in the subgrade without a protective surface. Conversely, the volumetric water content of all the feature points simultaneously decreases at a smooth rate because of the composite layers that protect the slope surface.
Additionally, the behaviour of the volumetric water content of cross-section A is compared at different elevations in Figure 10C. For the slope without composite layers, the variation range and depth of volumetric water content are greatly influenced by the rainfall days, which will cause relatively deep rainwater infiltration no matter how long the rainfall is and will also lead to a large variation of pore water pressure in the subgrade slope. In section A, the affected depth of volumetric water content with composite layers is only 0.54 m, but the affected depth without composite layers is 3.54 m. Therefore, the composite protection surface is beneficial in preventing rainfall infiltration for the subgrade slope.
Pore Water Pressure
Figure 11A presents the distribution of the pore water pressure (PWP) of the silt subgrade slope with and without a composite protection surface during rainfall. The negative pore water pressure gradually increases to zero near the slope toe. The behaviours of pore water pressure with and without composite layers at the top of the slope are similar; however, there are apparent differences on the slope surface, and the PWP is uniformly distributed near the composite protection surface, where the distribution regions mainly appear in the SP, SBP and SB mixed layers.
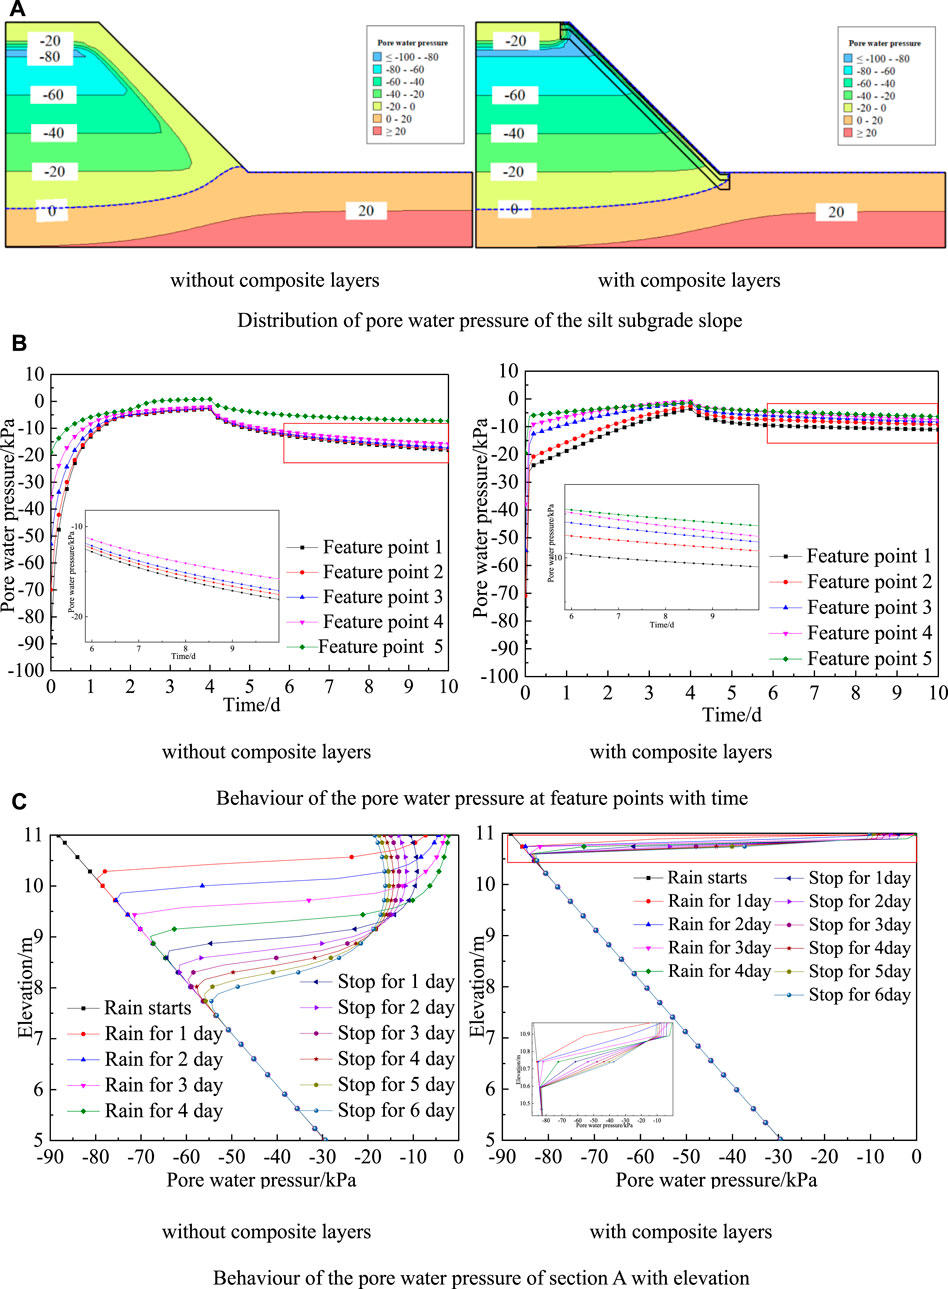
FIGURE 11. Behaviour of the pore water pressure of the silt subgrade slope with time and elevation.without composite layers with composite layers. (A) Distribution of pore water pressure of the silt subgrade slope. (B) Behaviour of the pore water. pressure at feature points with time. (C) Behaviour of the pore water pressure of section A with elevation
The PWP of the feature points increases with increasing rainfall time (Figure 11B). Without the composite protection surface, the rainwater infiltration into the subgrade surface accelerated to increase the pore water pressure during rainfall. However, due to the increased strength of the composite layer, the rainwater infiltration of the composite slope surface changes uniformly, which will allow for an even distribution of stress on the slope.
Figure 11C shows that the depth affected by the PWP with composite protection layers is only 0.87 m, whereas the affected depth without composite protection layers is approximately 3.80 m. Accordingly, the original silt subgrade slope is easily affected by rainwater infiltration, which will form a positive pore water pressure near the toe of the slope. In contrast, the composite protection surface effectively prevents rainwater infiltration near the slope face and toe and maintains the stability of the silt subgrade slope.
Numerical Simulations for Rainfall Erosion and Runoff
Numerical Modelling and Micro-parameters
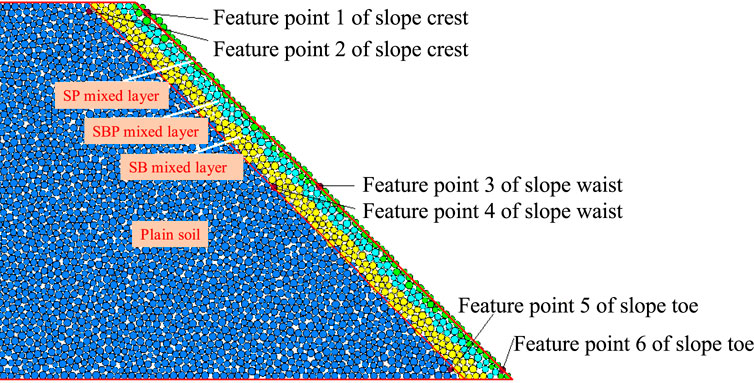
In this section, the particle follow code (PFC) is adopted to simulate the rainfall erosion process with and without composite protection layers, which reflects the distribution and migration of soil particles on the slope surface, and to analyse the anti-erosion performances of the composite protection layers of the silt subgrade slope. The object of PFC numerical simulation is meso soil particles, and the parameters obtained in the simulation process are meso-parameters. It is necessary to mark the macro- and meso-parameters of soil particles by means of a particle flow biaxial test, thereby obtaining the meso-parameters of the soil particles. The particle radius of the test model is set as the particle radius of the simulated slope, which is loaded under confining pressures of 100 kPa, 200 kPa, and 300 kPa. The measured partial stress-strain curves of the three mixed layers are plotted in Figure 12. Through numerical simulation, the partial stress-strain relationship is transformed into the macrostrength parameters represented by the Mohr circle and Mohr-Coulomb failure envelope. The measured values are compared with the simulated values to judge that the calibrated meso-parameters are reasonable and reliable in the numerical simulation of rainfall erosion of the slope.

FIGURE 12. The stress-strain relationship of the three mixed layers from lab tests. (A) SP mixed layer test results (B) SBP mixed layer test results (C) SB mixed layer test results
The particle flow generated by PFC2D is a disordered arrangement, and the radius expansion method is used to establish the particle flow model. To eliminate the influence of rainwater particle retention on the test results, only the subgrade part is selected in this model, the length of the subgrade slope is 13 m, the effective height is 8 m, and the number of generated particles reaches 3,500 (see Figure 13). The model is established according to the relationship between the macro- and micromechanical parameters of the slope. In this numerical analysis, the fluid is set up with fine particles to simulate rainfall and is solved by a discrete equation with a staggered grid method of finite volume elements. A zone of 0.3 m × 8 m area is set at 1 m above the top of the slope to generate fluid for simulating rainfall erosion, and the simulated rainfall intensity is equivalent to the torrential rain level of the National Meteorological Department. At 0.5 m above the top of the slope, the stable fluid is set up through fine particles to simulate the runoff formed by rainfall on the slope. Meanwhile, 6 feature points are set on the surface and protective layer of the slope, and they are distributed at the top, middle, and toe of the slope. The displacement of these feature points is monitored in real time.
Results of Rainfall Erosion
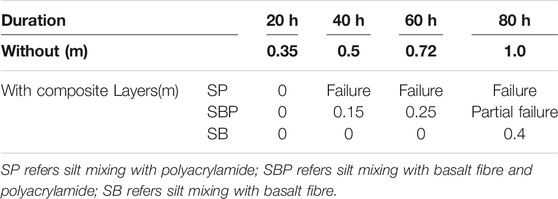
During the rainfall erosion simulation, the longest rainfall duration was set to 80 h, and Table 10 summarizes the rainfall erosion situations and the maximum erosion depths of the silt subgrade slope at 20, 40, 60, and 80 h. The slope failure mechanisms of the silt subgrade slope with and without composite protection layers at different rainfall durations are illustrated in Figure 14.
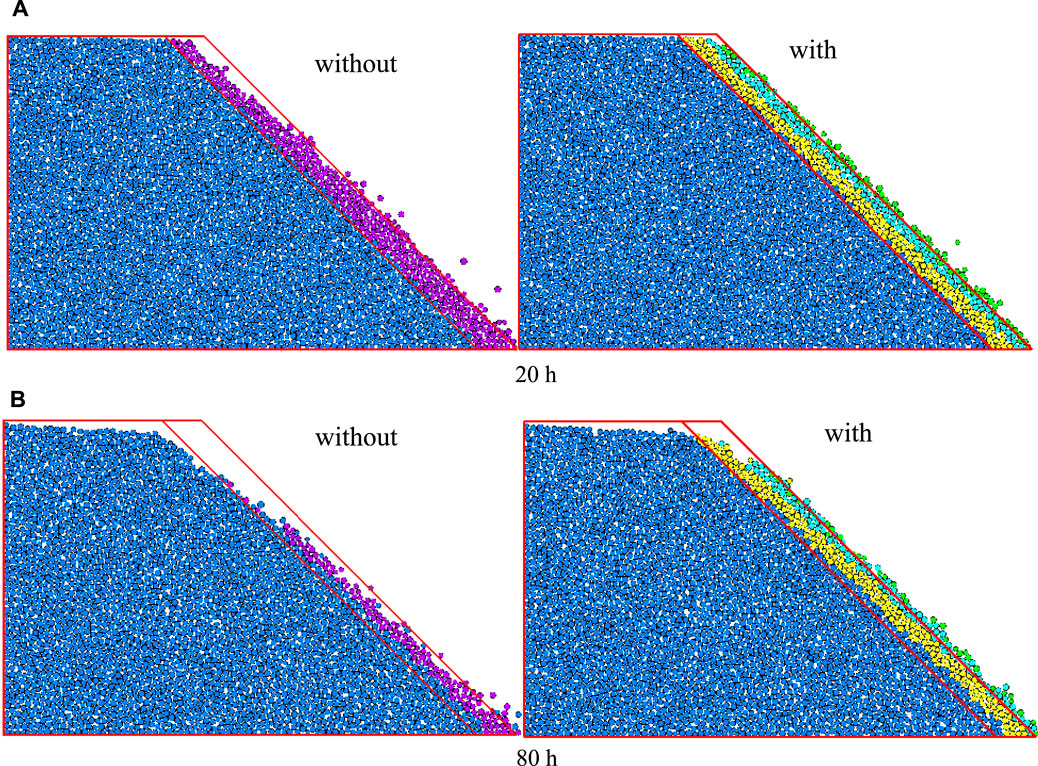
FIGURE 14. Comparison of erosion failure mechanisms without and with composite slope protection at. (A) 20 h and (B) 80 h
These results clearly indicate that when rainfall lasts for 20 h, a large amount of soil particles is flushed away from the top of the subgrade slope without composite layers, resulting in a large displacement of the slope top in a short time. Some particles are washed away in the middle of the slope, and the maximum erosion thickness was 0.35 m on the slope surface (Figure 14A). On the other hand, for the subgrade slope with the composite protection layers, only some tiny particles on the SP mixed layer begin to slide.
When the rainfall lasts for 40 and 80 h, the erosion depth of the slope without composite layers greatly increases with increasing rainfall duration; for example, approximately 60% of soil particles on the slope surface are eroded by rainwater. As seen from Table 10 and Figure 14B, the maximum erosion depth of the original subgrade slope reaches up to 1.0 m, leading to slipping of the soil particles and failure of the subgrade surface. In contrast, analysing the composite protection surface under the same rainfall erosion and durations, the erosion depths of the slopes only occur in the intermediate SBP composite layer when the rainfall continues for 60 h, and the erosion depth of the SBP layer is approximately 0.25 m. From Figure 14B, for the slope without composite protection layers, the subgrade surface was damaged by runoff because of long-term rainfall, that is slope failure. Even though most soil particles on the SP and SBP composite layers are washed away, only some of the particles on the SB composite layer were eroded from the top of the slope, namely partial failure of the slope. The comparison shows that the original slope occurs a sliding instability, but an erosion depth of approximately 0.4 m take place on the SB composite layer on the top of the reinforced slope.
Generally, the erosion of the subgrade slope with composite protection layers is approximately 50–60% less than that without a composite protection surface, and the erosion area is much smaller than that without a composite protection surface. The erosion area of the slope without composite protection layers accounts for half of the whole slope surface, and the erosion depth without composite protection layers is 40% higher than that with the composite protection layers. The composite protection layers greatly reduce the soil loss of the slope surface and enhance the anti-erosion performance of the silt subgrade slope.
Results of Rainfall Runoff
When the soil porosity is saturated or the rainfall intensity is greater than the permeability of the soil, runoff may be the second most important factor influencing rainfall erosion. The solid grains and soil are detached and transported by runoff water, which is the crucial factor in rainfall erosion. Figure 15 presents the effects of runoff on soil particle detachment and transportation of the subgrade slope with and without composite layers after 40 and 80 h of rainfall. Table 11 lists the runoff situations and maximum damage depths of the silt subgrade slope at 20, 40, 60, and 80 h.
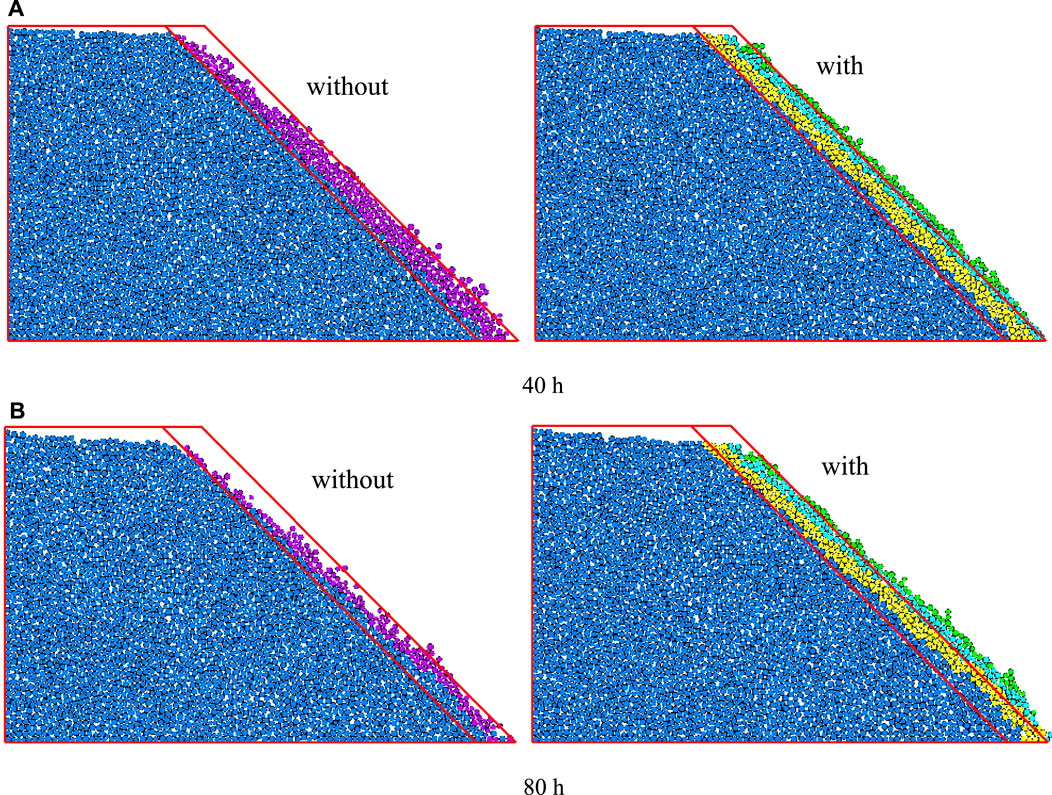
FIGURE 15. Comparison of runoff erosion failure mechanisms without and with composite slope protection at. (A) 40 h and (B) 80 h
After 20 h of rainfall, a large number of soil particles are washed away from the top of the silt subgrade slope without the composite surface layer, which results in a relatively large displacement on the top of the slope in a short time, and the corresponding maximum damage thickness is 0.18 m. However, with continuous rainfall, surface runoff is formed, and soil particle damage is generated on the top of the slope with composite layers when the rainfall lasts 40 h. In addition, displacement occurs in the SP composite layer, and several particles of the SBP composite layer on the top of the slope are washed away with runoff channels (Figure 15A).
The thickness of soil particles flushed by runoff gradually increases to approximately 0.68 m, and almost 1/3 of the soil particles on the slope surface without composite layers are washed away. One obvious phenomenon from Figure 15B is that the slope surface has been almost damaged by rainfall infiltration and runoff when rainfall lasts for 80 h, resulting in the runoff thickness increases to 0.72 m. In terms of the composite protection surface on the subgrade slope, the runoff thickness and surface damage degree are improved by approximately 50–70% after the 80 h of rainfall. Table 11 and Figure 15B show that a certain number of soil particles on the SP and SBP layers slip before 60 h of rainfall, which defines partly failure in this study. Furthermore, the SB composite layer has a small displacement, and there are some soil particles on the top of the slope that wash away after 80 h of rainfall.
Some of the particles of the SP and SBP mixed layers are washed to the foot of the slope. Only the particles on the top of the slope of the SB mixed layer have small displacements because of rainwater runoff, and the thickness of erosion reaches 0.20 m. The particles on the top of the slope are displaced because of the runoff water. One-third of the particles of the SP mixed layer rush away, the washed away particles of the SBP mixed layer slightly increase, and the plain silt under the composite layers hardly slip. Therefore, it can be concluded that the composite protection surface not only strongly prevents the soil particles from detaching and being transported by runoff water but also promptly limits the runoff volumes and controls flow water on the silt subgrade slope.
Discussion
Effect of Composite Layer Thickness on Rainfall Infiltration
From the above analysis, it can be seen that the zone of the reinforced subgrade slope affected by rainfall infiltration and slope erosion is mainly concentrated in the composite surface layers. In addition, the SP and SBP composite layers play very important roles in anti-infiltration behaviour. To further analyse the anti-infiltration performance of the composite protection layers, the thickness effects of the composite layers should be discussed and given more attention.
Effect of Thickness of SP Composite Layer
Figure 16 illustrates the behaviour of the volumetric moisture content and PWP at cross-section A corresponding to the thicknesses of 0.1 and 0.2 m of the SP composite layer. As seen from the figures, with an increase in thickness of the SP composite layer, the variability of volumetric water content and PWP on the top of the slope decreases, and slope elevation has a similar behaviour. When the thickness increases from 0.1 to 0.2 m, the depths influenced by the volumetric moisture content decrease from 0.54 to 0.49 m and by PWP decrease from 0.87 to 0.63 m. In general, the increase in composite layer thickness has no significant effect on either volumetric water content or PWP.
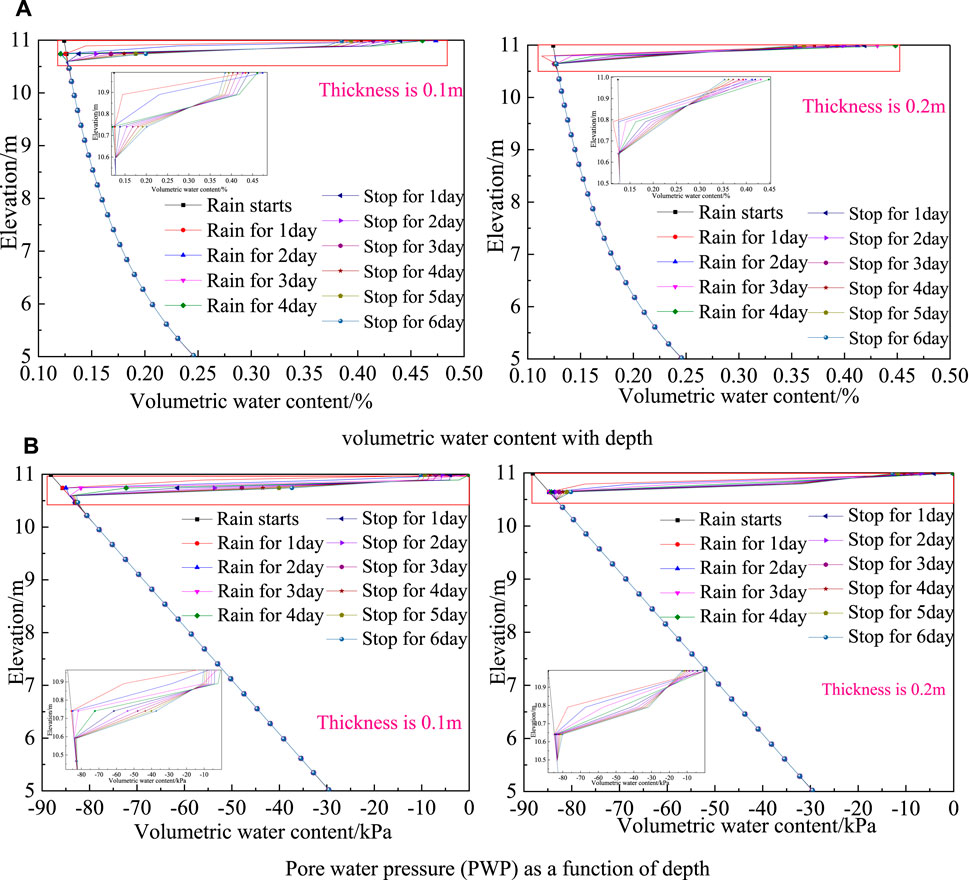
FIGURE 16. Behaviour of volumetric moisture content and PWP with depth at cross-section A. (A) volumetric water content with depth. (B) Pore water pressure (PWP) as a function of depth
Effect of Thickness of SBP Composite Layer
The same method was used to determine the effects of the SBP composite layer with 0.3 and 0.5 m thickness on the volumetric water content and PWP. The results demonstrate that the thicker the SBP composite layer is, the larger the variability of the volumetric water content and PWP are at cross-section A. The influence of the volumetric water content and PWP with the slope elevation are similar for these two thicknesses. The depths influenced by the volumetric water content and PWP decrease by approximately 18 and 55%, respectively, corresponding to 0.3 and 0.5 m.
Effect of Composite Layer Thickness on Rainfall Erosion and Runoff
Based on the above results and because the SB composite layer connects the other two protection layers and the plain soil layer, the thicknesses are chosen as 0.3 and 0.5 m to analyse the anti-erosion performances. To preferably highlight the anti-erosion effects of the bottom layer, three times the rainfall intensity and a 120-h rainfall duration are used in this simulation. Figure 17 displays the rainfall erosion behaviours under different rainfall durations and thicknesses.
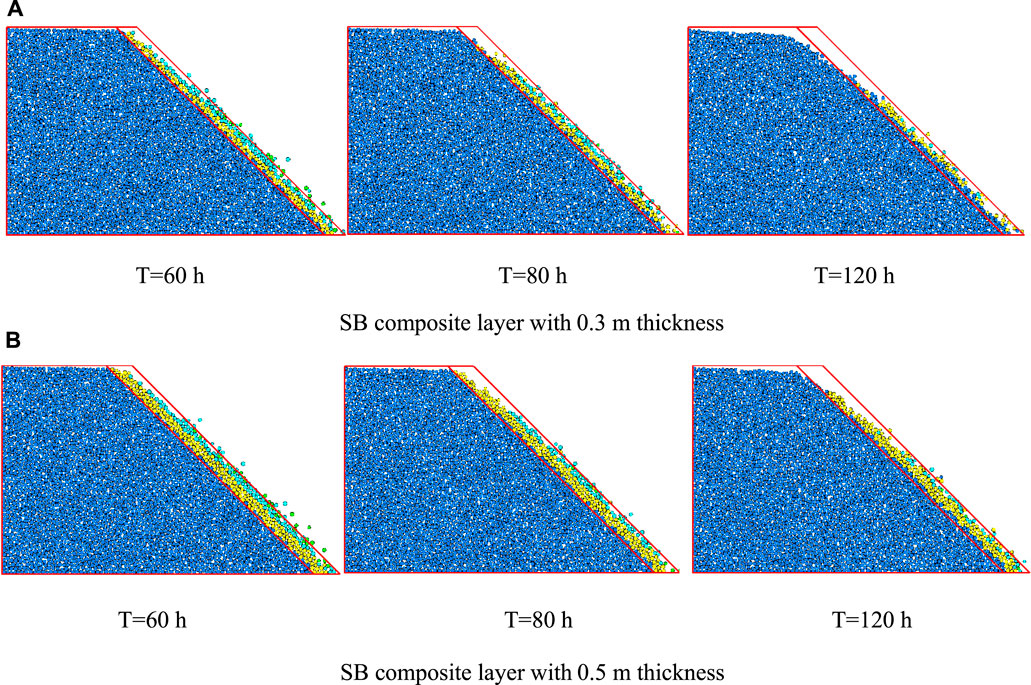
FIGURE 17. Erosion failure modes of slope protected with different SB composite thicknesses. (A) SB composite layer with 0.3 m thickness. (B) SB composite layer with 0.5 m thickness
The rainfall erosion of these two thicknesses were compared at 60 h, 80 h, and 120 h through PFC2D simulation. It can be inferred that soil particle erosion at the top is the major contributor to slope instability under the 60-h rainfall conditions. Increasing the SB layer thickness is one of the relatively important factors for protecting the subgrade slope by reducing soil erosion and runoff damage and strengthening the cohesion between composite layers and plain silt. As the rainfall duration increases to 80 h, the differences in slope erosion are increasingly obvious for thicknesses of 0.3 and 0.5 m. Approximately 25% of the soil particles in the SB layer with 0.3 m thickness are eroded, and the failure depth on the slope top is 0.56 m. For the 0.5 m layer, approximately 10% of the soil particles erode, and the failure depth is approximately 0.28 m on the top of the slope, indicating that the thickness of the SB composite layer in the anti-erosion treatment has a significant effect on reducing rainwater runoff and improving slope stability.
When the rainfall duration is relatively long, such as 120 h, as illustrated in Figures 17A,B a thicker SB composite layer is more suitable for enhancing the slope surface and preventing the composite protection surface from being damaged by rainfall erosion and rainwater runoff. In Figure 17A, the soil particles on the protective surface are more vulnerable to erosion due to long-term rainfall, and the soil particles of the first and second layers are almost eroded with a layer thickness of 0.3 m. However, when the thickness increases to 0.5 m, the decrease in the slope surface area of the rainfall erosion means that the anti-erosion performance of the SB composite layer effectively increases to reduce rainwater runoff (see Figure 17B). Meanwhile, the failure depth at the top of the slope will decrease at the same time. Therefore, the 0.5 m thickness of the SB composite layer distinctly reinforces the anti-erosion performance more remarkably than the 0.3 m thickness for the 120-h rainfall duration. Overall, the anti-erosion performance of the SB composite layer will be increased by approximately 25–35% when the layer thickness increases by 0.2 m, which can be considered an important design parameter for anti-erosion performance and reducing rainwater runoff in slope stability analysis.
Conclusion
According to the failure characteristics of the silt subgrade slope and rainfall-induced erosion failure and imbricate layered slip in the silt slope, a composite protection surface is proposed, which is composed of plain silt, polyacrylamide, and basalt fibre. In light of the comparative analysis of the anti-infiltration properties and anti-erosion performances of a slope with and without the composite protection surface based on a silt subgrade slope in Suqian, the following conclusions can be drawn from this study:
1) Based on the experimental results, the optimal content of the basalt fibre is 0.4%, the optimal length is 12 mm, and the optimal content of the polyacrylamide is 1% in the proposed composite protection layers.
2) The composite protection layers can effectively improve the anti-infiltration properties on silt subgrade slopes. Both the simulated and experimental results indicate that the top and intermediate composite layers initially limit rainwater infiltration on the upper surface, avoiding damage from rainwater runoff to the uppermost soil. According to the characteristics of the SB composite layer, the protective layers and original silt are mainly connected to protect the plain silt from soil loss and rainfall erosion. Therefore, the anti-infiltration properties of the composite protection layers could be guaranteed by decreasing the volumetric water content and improving the shear strength of the protective surface.
3) The composite protection layers can beneficially strengthen the anti-erosion performance of silt subgrade slopes. The bottommost mixed layer can effectively attach the anti-infiltration protection layers to the original slope surface to comprehensively enhance the anti-erosion property of the composite protection layers. For long-lasting rainfall, the rainwater will increase and may infiltrate into the deepest layer so that rainwater runoff probably forms either at the composite protection layers or under the base of the composite surface cover; accordingly, the SB composite layer can significantly minimize both the rainfall erosion and rainwater runoff of the silt subgrade slope.
4) Reasonably increasing the thickness of the composite protection layers brings about a substantial increase in anti-erosion performance. Comparing different thicknesses of the three mixed layers, the anti-erosion performance of the reinforced subgrade slope significantly increased by 25–35%. Thus, the thickness of protective layers should be considered in the design parameters of anti-infiltration properties and anti-erosion performance in silt slope stability analysis (Darboux and Huang, 2003; Hamza, 2014; Nima et al., 2015; Horpibulsuk et al., 2009; Horpibulsuk et al., 2008).
Data Availability Statement
The original contributions presented in the study are included in the article/Supplementary Material, further inquiries can be directed to the corresponding author.
Author Contributions
SG has performed the data analyses and wrote the manuscript; PX has performed the experiment; PZ has conducted the guidance of manuscript structure through constructive discussion; SW has contributed to detailed analysis and manuscript preparation.
Funding
The authors gratefully acknowledge the support of the National Nature Science Foundation of China (NSFC No.41372295, No. U1703244 and No. 41102178), the Nature Science Foundation of China of Jiangsu Province (No. BK20171006), the Fellowship of China Postdoctoral Science Foundation (No. 2021M701688), and the Youth Teacher Overseas Research Project, Jiangsu Province, China.
Conflict of Interest
The authors declare that the research was conducted in the absence of any commercial or financial relationships that could be construed as a potential conflict of interest.
Publisher’s Note
All claims expressed in this article are solely those of the authors and do not necessarily represent those of their affiliated organizations, or those of the publisher, the editors, and the reviewers. Any product that may be evaluated in this article, or claim that may be made by its manufacturer, is not guaranteed or endorsed by the publisher.
References
Acharki, S., El Qorchi, F., Arjdal, Y., Amharref, M., Bernoussi, A. S., and Ben Aissa, H. (2022). Soil Erosion Assessment in Northwestern Morocco. Remote Sensing Appl. Soc. Environ. 25, 100663. doi:10.1016/j.rsase.2021.100663
Adamo, P., Zampella, M., Gianfreda, L., Renella, G., Rutigliano, F. A., and Terribile, F. (2006). Impact of River Overflowing on Trace Element Contamination of Volcanic Soils in South Italy: Part I. Trace Element Speciation in Relation to Soil Properties. Environ. Pollut. 144, 308–316. doi:10.1016/j.envpol.2006.03.006
Alavinia, M., NasiriSaleh, F., and Asadi, H. (2018). Effects of Rainfall Patterns on Runoff and Rainfall-Induced Erosion. Int. J. Sediment Res. 3 (34), 270–278.
Arulrajah, A., Yaghoubi, M., Disfani, M. M., Horpibulsuk, S., Bo, M. W., and Leong, M. (2018). Evaluation of Fly Ash- and Slag-Based Geopolymers for the Improvement of a Soft marine clay by Deep Soil Mixing. Soils and Foundations 58, 1358–1370. doi:10.1016/j.sandf.2018.07.005
ASTM, D2487 (2011). “Standard Practice for Classification of Soils for Engineering Purposes (Unified Soil Classification System),” in ASTM International West Conshohocken (PA.
Baghdadi, Z. A., Fatani, M. N., and Sabban, N. A. (1997). Soil Modification by Cement kiln Dust. J. Mater. Civ. Eng. 4, 218–222. doi:10.1061/(ASCE)0899-1561(1995)7:4(218)
Blanck, G., Cuisinier, O., and Masrouri, F. (2013). Soil Treatment with Organic Non-traditional Additives for the Improvement of Earthworks. Acta Geotech 9, 1–12. doi:10.1007/s11440-013-0251-6
Cai, G., Zhang, T., Liu, S., Li, J., and Jie, D. (2016). Stabilization Mechanism and Effect Evaluation of Stabilized Silt with Lignin Based on Laboratory Data. Mar. Georesources Geotechnology 34 (4), 331–340. doi:10.1080/1064119x.2014.966217
Chehlafi, A., Kchikach, A., Derradji, A., and Mequedade, N. (2019). Highway Cutting Slopes with High Rainfall Erosion in Morocco: Evaluation of Soil Losses and Erosion Control Using concrete Arches. Eng. Geol. 3, 105200. doi:10.1016/j.enggeo.2019.105200
Chen, L., Wang, L., Cho, D.-W., Tsang, D. C. W., Tong, L., Zhou, Y., et al. (2019). Sustainable Stabilization/solidification of Municipal Solid Waste Incinerator Fly Ash by Incorporation of green Materials. J. Clean. Prod. 222, 335–343. doi:10.1016/j.jclepro.2019.03.057
Choobbasti, A. J., Ghodrat, H., Vahdatirad, M. J., Firouzian, S., Barari, A., Torabi, M., et al. (2010). Influence of Using rice Husk Ash in Soil Stabilization Method with Lime. Front. Earth Sci. China 4, 471–480. doi:10.1007/s11707-010-0138-x
Cochrane, T. A., and Flanagan, D. C. (2001). “Deposition Processes in a Simulated Rill,”. Soil Erosion Research for the 21st Century. Editors J. A. II, and D. C. Flanagan (Honolulu, Hawaii, USA: American Society of Agricultural Engineers), Vol. 1, 139–142.
Consoli, N. C., Bittar Marin, E. J., Quiñónez Samaniego, R. A., Heineck, K. S., and Johann, A. D. R. (2019). Use of Sustainable Binders in Soil Stabilization. J. Mater. Civ. Eng. 31 (2), 06018023. doi:10.1061/(asce)mt.1943-5533.0002571
Courault, D., Bertuzzi, P., and Girard, M.-C. (1993). Monitoring Surface Changes of Bare Soils Due to Slaking Using Spectral Measurements. Soil Sci. Soc. America J. 57, 1595–1601. doi:10.2136/sssaj1993.03615995005700060033x
Cristelo, N., Glendinning, S., Fernandes, L., and Pinto, A. T. (2012). Effect of Calcium Content on Soil Stabilisation with Alkaline Activation. Construction Building Mater. 29, 167–174. doi:10.1016/j.conbuildmat.2011.10.049
Darboux, F., and Huang, C.-h. (2003). An Instantaneous-Profile Laser Scanner to Measure Soil Surface Microtopography. Soil Sci. Soc. Am. J. 67, 92–99. doi:10.2136/sssaj2003.9200
Disfani, M. M., Arulrajah, A., Maghoolpilehrood, F., Bo, M. W., and Narsilio, G. A. (2015). Geotechnical Characteristics of Stabilised Aged Biosolids. Environ. Geotechnics 2, 269–279. doi:10.1680/envgeo.13.00054
Dohnálková, B., Drochytka, R., and Hodul, J. (2018). New Possibilities of Neutralisation Sludge Solidification Technology. J. Clean. Prod. 204, 1097–1107. doi:10.1016/j.jclepro.2018.08.095
Du, Y.-J., Jiang, N.-J., Liu, S.-Y., Horpibulsuk, S., and Arulrajah, A. (2016). Field Evaluation of Soft Highway Subgrade Soil Stabilized with Calcium Carbide Residue. Soils and Foundations 56, 301–314. doi:10.1016/j.sandf.2016.02.012
Eisazadeh, A., Kassim, K. A., and Nur, H. (2013). Morphology and BET Surface Area of Phosphoric Acid Stabilized Tropical Soils. Eng. Geology. 154, 36–41. doi:10.1016/j.enggeo.2012.12.011
Fan, J., Liu, W., Jiang, D., Chen, J., Tiedeu, W. N., and Daemen, J. J. K. (2020). Time Interval Effect in Triaxial Discontinuous Cyclic Compression Tests and Simulations for the Residual Stress in Rock Salt. Rock Mech. Rock Eng. 53, 4061–4076. doi:10.1007/s00603-020-02150-y
Ferro, V. (1998). Evaluating Overland Flow Sediment Transport Capacity. Hydrol. Process. 12, 1895–1910. doi:10.1002/(sici)1099-1085(19981015)12:12<1895:aid-hyp671>3.0.co;2-6
Fu, C., Yu, X., Fan, X., He, Y., Liang, J., and Li, S. (2020). Classification of Mass-Transport Complexes and Distribution of Gashydrate-Bearing Sediments in the Northeastern continental Slope of the South China Sea. Front. Earth Sci. 14, 25–36. doi:10.1007/s11707-019-0766-8
Gao, S., Guan, Q., Dong, D., and Huang, F. (2021). Environmental Risks of Shale Gas Exploitation and Solutions for Clean Shale Gas Production in China. Front. Earth Sci. 15, 406–422. doi:10.1007/s11707-020-0850-0
Giannopoulou, I., Dimas, D., Maragkos, I., and Panias, D. (2009). Utilization of Metallurgical Solid By-Products for the Development of Inorganic Polymeric Construction Materials. Glob. Nest. J. 11 (2), 127–136. doi:10.30955/gnj.000589
Guo, S., and Griffiths, D. V. (2020). Failure Mechanisms in Two-Layer Undrained Slopes. Can. Geotech. J. 57 (10), 1617–1621. doi:10.1139/cgj-2019-0642
Guo, S., Li, N., Liu, C., Liu, N., and Liu, W. (2020a). Unraveling the Progressive Failure Behaviors and Mechanisms of the Slope with a Local Dynamic Method Based on the Double Strength Reduction. Int. J. Geomech. 20 (6), 04020069. doi:10.1061/(asce)gm.1943-5622.0001693
Guo, S., Li, N., Liu, W., Ma, Z., Liu, N., and Lv, G. (2020b). Influence of Both Soil Properties and Geometric Parameters on Failure Mechanisms and Stability of Two-Layer Undrained Slopes. Adv. Mater. Sci. Eng. 2020, 1–13. doi:10.1155/2020/4253026
Hamza, G. (2014). Factorial Experimental Approach for Effective Dosage Rate of Stabilizer: Application for fine-grained Soil Treated with Bottom Ash. Soils. Found. 54 (3), 462–477. doi:10.1016/j.sandf.2014.04.017
Horpibulsuk, S., Katkan, W., and Apichatvullop, A. (2008). An Approach for Assessment of Compaction Curves of Fine Grained Soils at Various Energies Using a One Point Test. Soils and Foundations 48 (1), 115–125. doi:10.3208/sandf.48.115
Horpibulsuk, S., Rachan, R., and Raksachon, Y. (2009). Role of Fly Ash on Strength and Microstructure Development in Blended Cement Stabilized Silty clay. Soils and Foundations 49 (1), 85–98. doi:10.3208/sandf.49.85
Hou, D., Gu, Q., Ma, F., and O'Connell, S. (2016). Life Cycle Assessment Comparison of thermal Desorption and Stabilization/solidification of Mercury Contaminated Soil on Agricultural Land. J. Clean. Prod. 139, 949–956. doi:10.1016/j.jclepro.2016.08.108
Indraratna, B., Mahamud, M. A. A., and Vinod, J. S. (2012). “Chemical and Mineralogical Behaviour of Lignosulfonate Treated Soils,” in Geo Congress State of the Art and Practice in Geotechnical Engineering, ASCE, March 2012, 1146–1155.
Jiang, D., Fan, J., Chen, J., Li, L., and Cui, Y. (2016). A Mechanism of Fatigue in Salt under Discontinuous Cycle Loading. Int. J. Rock Mech. Mining Sci. 86 (7), 255–260. doi:10.1016/j.ijrmms.2016.05.004
Kang, Y., Fan, J., Jiang, D., and Li, Z. (2021). Influence of Geological and Environmental Factors on the Reconsolidation Behavior of fine Granular Salt. Nat. Resour. Res. 30 (1), 805–826. doi:10.1007/s11053-020-09732-1
Kang, Y. F., Jiang, D. Y., Liu, W., Fei, W., Chen, J., and Daemen, J. J. K. (2019). Discontinuous Fatigue of Salt Rock with Low-Stress Intervals. Int. J. Rock Mech. Mining Sci. 115 (3), 77–86. doi:10.1016/j.ijrmms.2019.01.013
Kavitha, O. R., Shanthi, V. M., Prince Arulraj, G., and Sivakumar, P. (2015). Fresh, Micro- and Macrolevel Studies of Metakaolin Blended Self-Compacting concrete. Appl. Clay Sci. 114, 370–374. doi:10.1016/j.clay.2015.06.024
Kolias, S., Kasselouri-Rigopoulou, V., and Karahalios, A. (2005). Stabilisation of Clayey Soils with High Calcium Fly Ash and Cement. Cement and Concrete Composites 27 (2), 301–313. doi:10.1016/j.cemconcomp.2004.02.019
Kukko, H. (2000). Stabilization of clay with Inorganic By-Products. J. Mater. Civ. Eng. 12 (4), 307–309. doi:10.1061/(asce)0899-1561(2000)12:4(307)
Lemaire, K., Deneele, D., Bonnet, S., and Legret, M. (2013). Effects of Lime and Cement Treatment on the Physicochemical, Microstructural and Mechanical Characteristics of a Plastic silt. Eng. Geology. 166, 255–261. doi:10.1016/j.enggeo.2013.09.012
Little, D. N. (1995). Stabilization of Pavement Subgrade and Base Courses with Lime, Kendall/Hunt Publishing Company. Dubuque, Iowa, USA: Kendall/Hunt Pub. Co., 219.
Marto, A., Latifi, N., and Eisazadeh, A. (2014). Effect of Non-traditional Additives on Engineering and Microstructural Characteristics of Laterite Soil. Arab. J. Sci. Eng. 39 (10), 6949–6958. doi:10.1007/s13369-014-1286-1
Meyer, L. D., and Wischmeier, W. H. (1969). Mathematical Simulation of the Process of Soil Erosion by Water. Trans. ASAE 12(6), 754–762. doi:10.13031/2013.38945
Miller, G. A., and Azad, S. (2000). Influence of Soil Type on Stabilization with Cement kiln Dust. Construction Building Mater. 14 (2), 89–97. doi:10.1016/s0950-0618(00)00007-6
Nima, L., Rashid, A. S. A., Sumi, S., and Suksun, H. (2015). Micro-structural Analysis of Strength Development in Low- and High Swelling Clays Stabilized with Magnesium Chloride Solution-A green Soil Stabilizer. Appl. Clay. Sci. 118, 195–206. doi:10.1016/j.clay.2015.10.001
Rivard-Lentz, D. J., Sweeney, L. R., and Demars, K. R. (1997). Incinerator Bottom Ash as a Soil Substitute: Physical and Chemical Behaviour. ASTM Sp Techn Publ. 39 (1), 246–262. doi:10.1016/S0140-6701(97)85604-4
Renard, K. G. (1997). Predicting Soil Erosion by Water: A Guide to Conservation Planning with the Revised Universal Soil Loss Equation (RUSLE). Washington, DC: United States Government Printing.
Seco, A., Ramírez, F., Miqueleiz, L., García, B., and Prieto, E. (2011). The Use of Non-conventional Additives in Marls Stabilization. Appl. Clay Sci. 51, 419–423. doi:10.1016/j.clay.2010.12.032
Show, K.-Y., Tay, J.-H., and Goh, A. T. C. (2003). Reuse of Incinerator Fly Ash in Soft Soil Stabilization. J. Mater. Civ. Eng. 15, 335–343. doi:10.1061/(asce)0899-1561(2003)15:4(335)
Suksiripattanapong, C., Horpibulsuk, S., Chanprasert, P., Sukmak, P., and Arulrajah, A. (2015). Compressive Strength Development in Fly Ash Geopolymer Masonry Units Manufactured from Water Treatment Sludge. Construction Building Mater. 82, 20–30. doi:10.1016/j.conbuildmat.2015.02.040
Ureña, C., Azañón, J. M., Corpas, F., Nieto, F., León, C., and Pérez, L. (2013). Magnesium Hydroxide, Seawater and Olive Mill Wastewater to Reduce Swelling Potential and Plasticity of Bentonite Soil. Construction Building Mater. 45, 289–297. doi:10.1016/j.conbuildmat.2013.03.053
Wang, J., Zhao, Y., Sun, J., Zhang, Y., and Liu, C. (2019). The Distribution and Sources of Polycyclic Aromatic Hydrocarbons in Shallow Groundwater from an Alluvial-Diluvial Fan of the Hutuo River in North China. Front. Earth Sci. 13, 33–42. doi:10.1007/s11707-018-0701-4
Wang, J., Zhang, Q., Song, Z., and Zhang, Y. (2020). Creep Properties and Damage Constitutive Model of Salt Rock under Uniaxial Compression. Int. J. Damage Mech. 29, 902–922. doi:10.1177/1056789519891768
Wang, J. B., Wang, T., Song, Z. P., Zhang, Y. W., and Zhang, Q. (2021a). Improved Maxwell Model Describing the Whole Creep Process of Salt Rock and its Programming. Int. J. Appl. Mech. 4 (1), 1–26. doi:10.1142/S1758825121501131
Wang, J., Wang, X., Zhang, Q., Song, Z., and Zhang, Y. (2021b). Dynamic Prediction Model for Surface Settlement of Horizontal Salt Rock Energy Storage. Energy 235, 121421. doi:10.1016/j.energy.2021.121421
Wild, S., Kinuthia, J. M., Jones, G. I., and Higgins, D. D. (1998). Effects of Partial Substitution of Lime with Ground Granulated Blast Furnace Slag (GGBS) on the Strength Properties of Lime-Stabilised Sulphate-Bearing clay Soils. Eng. Geology. 51, 37–53. doi:10.1016/s0013-7952(98)00039-8
Yang, X., Ma, G. L., Wu, H. R., Lu, H. M., and Zaman, M. (2022). Rainfall-Induced Erosion of Biocemented Graded Slopes. Int. J. Geomech. 22, 04021256. doi:10.1061/(asce)gm.1943-5622.0002239
Keywords: silt subgrade slope, composite layer, anti-infiltration, anti-erosion, polyacrylamide, basalt fibre
Citation: Guo S, Xu P, Zhang P and Wang S (2022) Numerical Investigation of the Anti-infiltration and Anti-Erosion Performance of Composite Layers Mixed With Polyacrylamide and Basalt Fibre for the Protection of Silt Subgrade Slopes. Front. Earth Sci. 10:815602. doi: 10.3389/feart.2022.815602
Received: 15 November 2021; Accepted: 06 January 2022;
Published: 27 January 2022.
Edited by:
Junbao Wang, Xi’an University of Architecture and Technology, ChinaReviewed by:
Wenpeng Liu, WSP, United StatesXiao Liu, China University of Geosciences, China
Fan Feng, Shandong University of Science and Technology, China
Copyright © 2022 Guo, Xu, Zhang and Wang. This is an open-access article distributed under the terms of the Creative Commons Attribution License (CC BY). The use, distribution or reproduction in other forums is permitted, provided the original author(s) and the copyright owner(s) are credited and that the original publication in this journal is cited, in accordance with accepted academic practice. No use, distribution or reproduction is permitted which does not comply with these terms.
*Correspondence: Peng Zhang, emhhbmdwZW5nLW1haWxAbmp0ZWNoLmVkdS5jbg==
 Shuangfeng Guo
 Peiwen Xu
 Peng Zhang
 Shengnian Wang