- 1Key Laboratory of Mechanics on Disaster and Environment in Western China, The Ministry of Education of China, Lanzhou University, Lanzhou, China
- 2College of Civil Engineering and Mechanics, Lanzhou University, Lanzhou, China
Catastrophic failures often occur to engineered infrastructure in areas underlain by saturated loess due to its high moisture content (degree of saturation >85%), low shear strength, and large deformation. Time effect (rheological property) and water are the most important factors affecting the mechanical properties of saturated loess. The rheological mechanism and characteristics of saturated loess are vital to understanding the interaction between infrastructure and foundation and the trigger of failures. Based on step-load testing, this study obtains the displacement-time relationship of saturated Q2 loess to analyze its creep behavior. Experimental results show that the creep strength of saturated Q2 loess is 75–80% of its unconfined compression strength, and the creep behavior can be simulated by the Burgers model. Additionally, the rheological parameters under different load conditions are obtained using the improved Marquardt iterative method. All these parameters can be used for numerical analysis of the rheological behavior of saturated Q2 loess.
Introduction
Loess occurs widely across China. The regions covered by loess account for 6.31 × 10⁵ km2 (Dijkstra et al., 1994), where it serves as the primary building material, building environment, or the foundation for the infrastructure. Due to the unique genesis of loess (Liu et al., 1985; Zhang et al., 1989; An et al., 1998; Sun, 2005; Chen et al., 2019; Fu et al., 2021), it possesses particular characteristics in deformation, strength, and stability (Wang, 1982; Feng and Zheng, 1982; Zheng, 1982; Lei, 1987), and abundant studies have been carried out on loess in the world. Loess below the groundwater table has high water content and a degree of saturation greater than 85%. Compared with unsaturated loess, saturated loess has lower strength, larger deformation, higher compressibility, and is more sensitive (Qiao and Li, 1990). These characteristics lead to geotechnical problems such as slope flow failure (Wen and Jiang, 2017; Xu et al., 2018; Xie et al., 2018), tunnel collapse, and piping in saturated loess areas (Peng et al., 2015).
The Loess Plateau is the core area of the Belt and Road Program and the primary site of Western Development. Many major projects, including Lanzhou-Chongqing railway, Zhengzhou-Xi’an high-speed railway, Xi’an-Lanzhou high-speed railway, Lanzhou-Xinjiang high-speed railway, and the Tao River Diversion Project, have traversed through saturated Q2 loess areas to a certain extent. Along with these projects, increasingly more problems have emerged due to the seepage failure of saturated Q2 loess. For example, six tunnels out of 15 in phase I of the Tao River Diversion Project passed through saturated loess. During the construction of Tunnel No. 15, flow failure (Figure 1A) occurred in a segment of about 30 m long, leading to roof collapse (Figure 1B) and construction delay of nearly 1 year. Another example is the Dayingliang tunnel through saturated Q2 loess along the second track of Baoji-Lanzhou Railway, which is less than 2 km away from Tunnel No. 15 of the Tao River Diversion Project. It was seriously damaged due to seepage during the construction by traditional methods. A much more expensive construction method, i.e., the ground freezing by liquid nitrogen, was adopted to finish some tunnel sections.
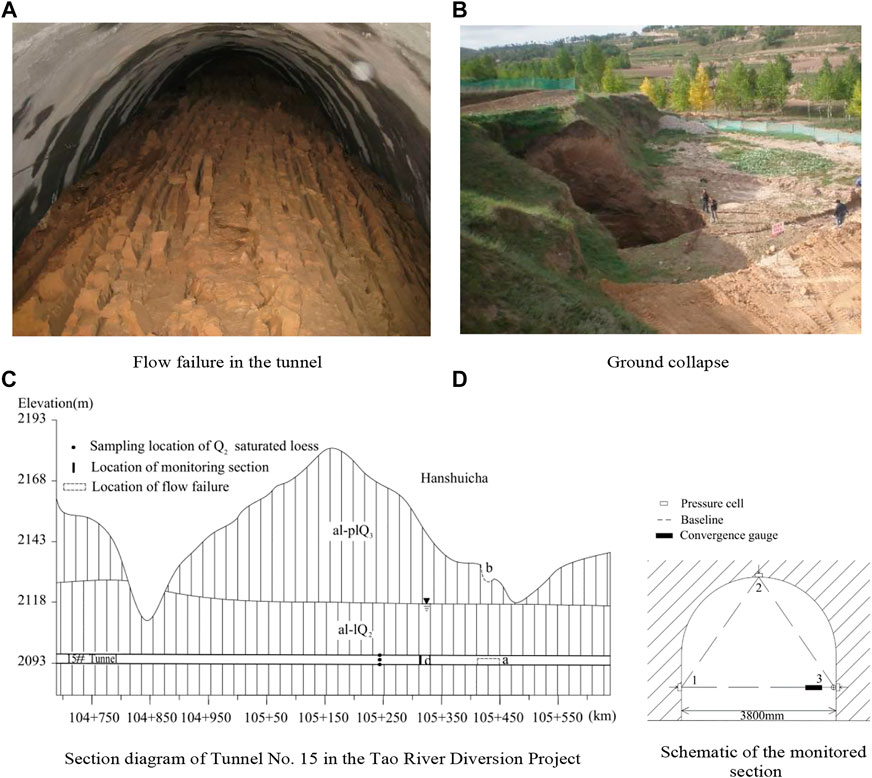
FIGURE 1. Flow failure of saturated Q2 loess in Tunnel No. 15 of the Tao River Diversion Project. (A) Flow failure in the tunnel. (B) Ground collapse. (C) Section diagram of Tunnel No. 15 in the Tao River Diversion Project. (D) Schematic of the monitored section.
The study of rock and soil creep is extensive. For example, Wang et al. (2020) used step-loading triaxial creep tests under different moisture content to reveal the relationships between the steady-state creep rate and the initial strain and shear modulus. Lin et al. (2020) introducd the nonlinear viscoplastic element into the classic Burgers model and verified the rationality of the model by the shear creep test results of rock discontinuity, the results show that the modified Burgers model can reflect the mechanical properties of rock in three creep stages. Xia et al. (2021) proposed an improved simulation method based on the classical Burgers model and the Parallel Bonded model in the Particle Flow Code (PFC) and applied it to simulate the full-stage creep process in soft rock. Tang et al. (2019) studied the creep behavior of loess under different moisture content and confining pressure conditions, they revealed that the creep behavior of loess is prominent at high moisture content and minor time-dependent deformation occurs at high confining pressures. Zhu et al. (2013) investigated the creep characteristics of red-bed sliding soil under different vertical loads and water content through direct shear creep tests. Other significant studies on the creep behavior of different geotechnical materials include Fabre and Pellet. (2006), Wang et al. (2014), and Ye et al. (2015). However, the studies on the creep characteristics of saturated Q2 loess are rare.
Engineering incidents quickly increase along with major projects in loess areas (Palmer, 2017; Wang et al., 2018). The key to curbing these incidents and mitigating the risks related to saturated Q2 loess is to understand its rheological mechanism and characteristics. This paper conducts creep tests of saturated Q2 loess obtained from a tunnel construction site by step loading. Testing results, including the displacement-time relationship and creep strength, are presented. In addition, the Burgers model was used to simulate the creep behavior, and the rheological parameters under different load conditions are obtained using the improved Marquardt iterative method. At the same time, deformation prediction by using laboratory experimental results agrees favorably with field observations.
Experiments and Results
Undisturbed saturated loess samples were obtained at section km105 + 240 (Figure 1C), the pressure and deformation were monitored by pressure boxes and convergence meter at 100 m away from the flow failure location in km 105 + 410, as shown in (Figure 1D). This section describes its grain size distribution, uniaxial compressive strength, and creep test scheme.
Grain Size Distribution
The particle size distribution of Q2 loess was obtained by a laser particle size analyzer, and the results are listed in Table 1. The Q2 loess samples have relatively uniform particle sizes, consisting of 5.2–8.0% of sand content, 28.5–31.8% of clay content, and more than 60% of silt content. The clay content of the Q2 loess is high and can be classified as silty clay.
Uniaxial Compressive Strength
The compressive strength is one of the essential mechanical properties of geomaterials, including the Q2 loess. Additionally, it serves as a crucial reference for determining the step loads at various stages of the creep test. This study conducted uniaxial compression tests to obtain the unconfined compressive strength, σc, of saturated Q2 loess samples, as presented in Table 2. The results show that the values of σc range between 0.5 and 0.6 MPa, and the strength decreases sharply with increasing water content.
Creep Test and Results
Loess is a complex porous geomaterial with a unique sensibility to water. The influence of pore water on its mechanical properties, such as deformation, strength, and constitutive behavior, has always been at the center of the study (Xie and Qi, 1999). Both the stress and deformation of loess are closely related to time (Huang, 1983; Qian and Yin, 1996). Time effect (rheological property) and water are the two most important factors affecting the mechanical properties of loess. In China, previous efforts mainly focused on the rheological behavior of loess. For instance, Chen et al. (1989) uncovered the quadratic time effect and proposed a rheological constitutive equation and the sheet structure theory for clay. Zhao et al. (2011) proposed a rheological model considering instantaneous plastic deformation based on results obtained through triaxial creep testing of undisturbed loess samples from Xi’an, China. Wang and Luo. (2009) analyzed the effects of deviatoric stress level, moisture content, and dry density on the creep characteristics of loess through the triaxial creep test. Pang. (2017) studied the rheological constitutive model of compacted loess under different levels of dynamic compaction based on the creep test. Shan et al. (2021) proposed the loading and unloading stress history has a cumulative effect on the creep deformation of loess.
Engineering practice has demonstrated that the results of the uniaxial creep test can meet the requirements of design and construction (Zhou, 1990). Therefore, this study adopted the uniaxial creep test to analyze the creep properties of saturated Q2 loess. Specifically, a CSS-44100 electronic universal testing machine with a closed-circuit control system was used. It is capable of applying a load ranging from 400 N to 100 kN with an error of less than 0.1%. Six to seven testing specimens of 5 cm in diameter and 10 cm in height were prepared for each of the two groups of undisturbed saturated Q2 loess samples.
The step loading protocol was adopted for the creep test. Specifically, six to seven gradually increasing loading steps were applied on the same specimen, with the maximum load controlled at 75% σc (Refer to Table 2). Uniform loading was adopted to reach the first load level in 600 s. Each loading step was terminated when the displacement increment (or the maximum value when the loading time reaches 24 h) was less than 0.001 mm/h. The stress and strain data was obtained every 30 s and 200 s in the loading stage and stable stage after loading. Figure 2 depicts representative deformation vs. time data from the creep tests of saturated Q2 loess samples.
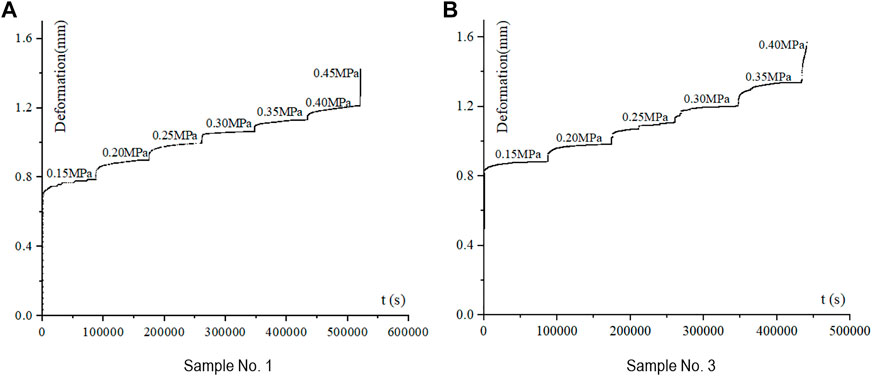
FIGURE 2. Displacement vs. time from the creep tests of saturated Q2 loess. (A) Sample No. 1. (B) Sample No. 3.
The following observations can be made for saturated Q2 loess from Figure 2:
a) A large instantaneous deformation occurs when the saturated Q2 loess specimen is subjected to a step load, accounting for more than 50% of the total deformation of each loading stage. However, with the increase in load, the proportion of the instantaneous deformation out of the total gradually decreases. The deformation accumulates with time at decreasing rates until it plateaus. This pattern can be classified as the attenuated or damped rheological stage or initial rheological stage.
b) Following the initial rheological stage, there is a segment where the deformation accumulates at a constant rate for all stages of loading except for the last one. The rate at which the deformation occurs, or the creep rate, in this segment is almost constant under the same level of load, is very close even under different levels of load. This pattern can be categorized into the constant rheological stage or the steady rheological stage.
c) When the stress level is high (e.g., the last load step), if the deformation increases sharply, the specimen usually undergoes quick failure, i.e., entering into accelerated creep stage without the constant rheological stage. It often takes a very short time from accelerated deformation to specimen collapse. As illustrated in Figure 3, one can see that cracks appear outside the specimen and rapidly expand throughout the entire specimen, forming an inclined slip surface. Therefore, the creep failure under uniaxial compression load is essentially a shear failure accompanied by noticeable lateral bulging. For sample No.1, the accelerated creep trend appeared at load step six, but failure did not occur within the loading time of this stage. It is presumed that creep failure would occur if the loading time is sufficient. When the load exceeds 0.45 MPa, brittle shear failure occurred instantly on sample No. 1 (Figure 3A). For sample No.3, the accelerated creep occurred at the load step six (i.e., 0.40 MPa), and creep failure occurred 2 hours after the loading was applied.
d) Theoretically, the stress corresponding to the asymptotic line at t = ∞ is its long-term strength. According to the deformation vs. time curves in Figure 2, the long-term strength values of specimens No. 1 and No. 3 are 0.45 MPa and 0.40 MPa, respectively. It can be seen from that the failure stress of saturated Q2 loess is generally about 75%–80% of its uniaxial compressive strength. In engineering application, it is suggested to take 75% of the uniaxial compressive strength as the long-term strength of saturated Q2 loess.
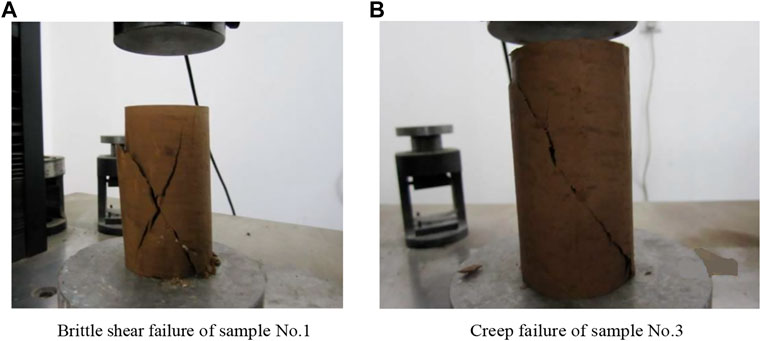
FIGURE 3. Failure patterns of saturated Q2 loess during creep. (A) Brittle shear failure of sample No.1. (B) Creep failure of sample No.3.
Discussion
Rheological constitutive models and appropriate parameters based on experimental data are essential for gaining an in-depth understanding of the creep behavior of geomaterials. Representative rheological models include those consisting of a combination of elements such as springs and dashpots, empirical models, integral models, damage-based models, and models based on classic elastic-viscoplastic potential theory (Xia and Sun, 1996; Zheng et al., 1997; Wang et al., 2004). Among these models, the element model is simple to construct, has clear physical meanings, and can comprehensively reflect various rheological properties of geomaterials such as creep and stress relaxation, and is selected for modeling the creep behavior of saturated Q2 loess. Typical element models include the Burgers model, the Maxwell model, the Generalized Maxwell model, the Kelvin model, the Kelvin-Voigt model, the Bingham model, the Poynting-Thomson model, the Nishihara model, etc. Table 3.
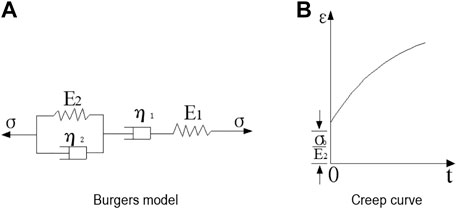
The creep test data in Figure 2 demonstrate that saturated Q2 loess exhibits obvious three-stage creep characteristics. Based on the observed deformation vs. time behavior and the features of various element models, it is found that the Burgers model can better describe the creep characteristics of saturated Q2 loess (Figure 4).
The creep equation of the Burgers model is:
Where E1, E2 are elastic modulus; η1, η2 are viscosity coefficients; σ0 is the step load.
Because of the complex constitutive equation of the creep model, it is difficult to obtain the model parameters directly according to the test results. Yang et al. (2004) provided a method to obtain creep model parameters based on the axial strain, instantaneous elastic strain, and other parameters. Since the instantaneous elastic strain is often not available in practical applications, the least square fitting method is generally used to determine the parameters in the element model. However, the least square method usually requires the selection of initial parameter values, and improper initial parameter values can easily lead to divergence during iteration. Marquardt damped least-squares method is an extremely powerful tool for the iterative solution of nonlinear problems. In this study, the modified Marquardt method was used to determine the rheological parameters based on the experimental data, and the results are listed in Tables 4, 5.
The results in Tables 4, 5 show that the values of elastic modulus and viscosity coefficient range in 10–70 MPa and 1.0×10⁹–9.0 × 10¹³ Pa·s, respectively. The two main indexes reflecting the creep characteristics are far lower than those of hard rock, i.e., 50–100 GPa and 1.0×10¹⁶–1.0 × 10¹⁷ Pa·s, indicating that saturated Q2 loess has a more prominent creep tendency. It can be seen from Tables 4, 5 that, as the loading stress rises, E1 decreases but E2 increases. Meanwhile, η1 grows first, reaches a maximum, then falls as the stress level increases. However, η2 consistently increases with the rise in the stress level and surges when creep failure occurs. The viscosity coefficients reflect the increase in the viscosity of saturated loess specimen as the stress rises. The results indicate that the creep property of saturated Q2 loess becomes more and more evident with the increase in load, and saturated Q2 loess is a nonlinear viscoelastic material.
Taking Table 4 as an example, draw the curves of η1 and η2 vs E1 and E2. It can be seen from Figure 5 that the relationship curves of η1 and η2 vs. E1 and E2 are almost symmetrical. η1 first increases and then decreases with the increase in E1 and E2; η2 decreases with the rise in E1 and increases with the increase in E2.
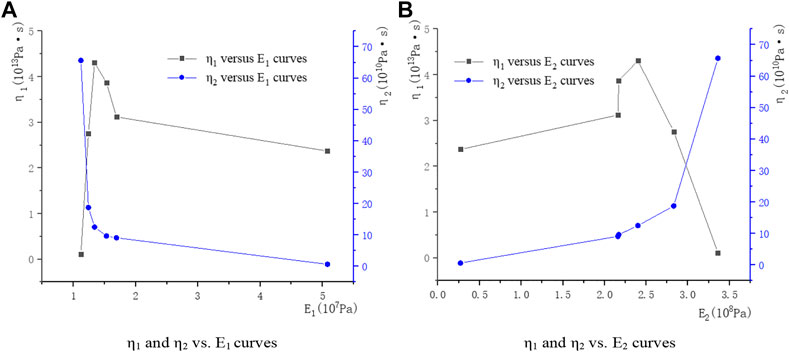
FIGURE 5. η1 and η2 versus E1 and E2 curves. (A) η1 and η2 vs. E1 curves. (B) η1 and η2 vs. E2 curves.
Comparison of Model-Simulated and Experimental Creep Curves of Saturated Q2 Loess
To verify the applicability of the Burgers model of saturated Q2 loess, the creep parameters of saturated loess (obtained from Table 4 and Table 5) were substituted into the Burgers model to calculate and obtain the simulated creep curve. Comparing the simulated curve with the experimental one in Figure 6, it is found that the Burgers model can be used to simulate the experimental data. The model-simulated and the experimental curves almost coincide under the first four loadings. When the load continues to increase, the model-simulated curve is slightly higher than the experimental one, indicating that the trend of the model-simulated accelerated stage is more obvious at the last two loading levels.
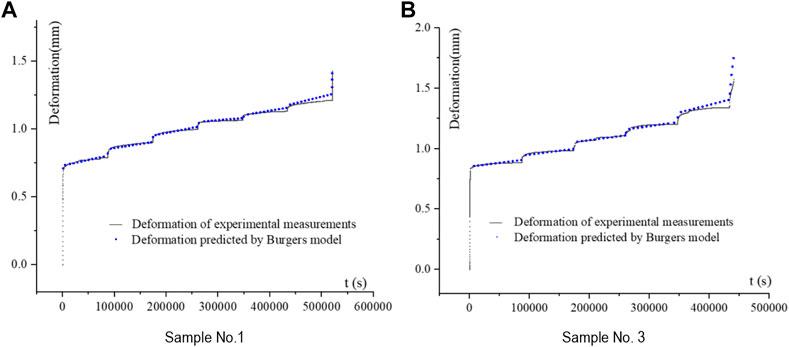
FIGURE 6. Simulated deformation vs. time relationship using the Burgers Model. (A) Sample No. 1. (B) Sample No. 3.
It can be seen from the comparison between the theoretical simulation curve and the experimental curve that the four-parameter Burgers model can well simulate the rheological curve of saturated Q2 loess, and the model parameters can be used for the elastic-viscoplastic analysis of saturated Q2 loess.
Application of Burgers Model to project(Case Study)
Tunnel No. 15 of the Tao River Diversion Project adopts two-way excavation. The tunnel is surrounded by saturated soft and plastic Q2 loess with an average water content of more than 28%. When one side of the tunnel was excavated to km105 + 410, the palm surface moved outward, and the arch frame sank and collapsed. On the 10th day, flow failure suddenly occurred. Saturated loess slid nearly 30 m from the palm surface within a few minutes, resembling toothpaste being squeezed out from a tube. After about 3 hours, the flow failure in the tunnel was stable. And 4 hours later, the tunnel roof at about 30 m above the tunnel base collapsed.
On the other side of the tunnel, the pressure and deformation at 100 m away from the flow failure location in km 105 + 410 section were monitored by pressure boxes and convergence meter, as shown in Figure 1D. The pressure boxes and the convergence meter are synchronously arranged, and the monitoring time of both is 170 d. From the pressure monitoring curve (Figure 7A), it can be seen that an inflection point appeared on the surrounding rock pressure of the tunnel at 110 kPa after about 10 days and then the pressure rose slowly, reaching the maximum of 160 kPa during the monitoring period. Meanwhile, an inflection point also occurred on the deformation of baselines 1-3 of the monitoring section as shown in Figure 7B at 18.649 mm on the 10th day, with the maximum reaching 22.6 mm during the monitoring period.
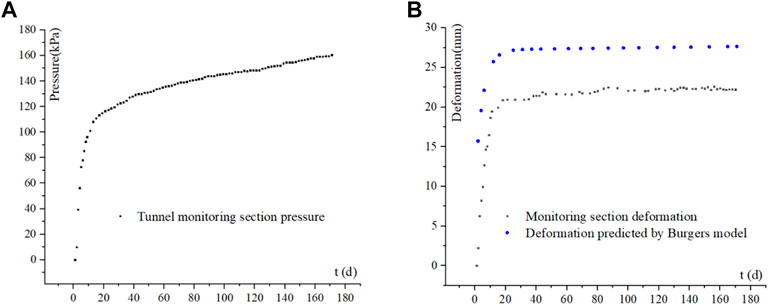
FIGURE 7. Monitored pressure and strain vs. time. (A) Monitored Pressure results vs. time. (B) Monitored strain results and simulated strain results by the Burgers model.
According to the results of pressure and deformation monitoring, combined with the creep test load gradient, select Burgers model creep parameters at 150 kpa as the simulation parameters of the monitoring section. The indoor creep test accelerated the stress loading process, and the completion time of samples No.1 and No.3 under the first stage load was 600 s. Using the equivalent time method, the actual observed stress inflection point time (10 d) is equivalent to the first stage loading completion time (600 s) in the laboratory, and the residual stress monitoring 160 d is equivalent to the stable loading time after the first stage loading. Under the equivalent time, according to Burgers model and combined with the tunnel diameter, the surrounding rock deformation of the tunnel is simulated. Also, the trend of the simulation deformation results are in good agreement with that of the monitored, with the simulated deformation being about 5 mm larger. The discrepancy can be attributed to the following reasons: 1) the selected Burgers model creep parameters are the creep parameters obtained at 150 kPa, but the in-situ pressure is 110–160 kPa; and 2) the tunnel surrounding rock is supported after excavation, hence reducing the actual deformation.
Conclusion
The uniaxial compressive strength of saturated Q2 loess is about 0.5–0.6 MPa, and decreases sharply with the increase in moisture content. Creep testing results of saturated Q2 loess show that the proportion of instantaneous deformation at each loading stage decreases with the increase in loading level, and its rheological curve consists of three typical phases, including the initial, steady, and accelerated creep stages.
The creep failure of saturated Q2 loess belongs to shear failure. Specimen failure is often accompanied by obvious lateral bulging. The failure stress of saturated Q2 loess is generally about 75–80% of uniaxial compressive strength. In engineering applications, it is suggested to take 75% of uniaxial compressive strength as the long-term strength of saturated Q2 loess.
The elastic modulus and viscosity coefficient of saturated Q2 loess are far lower than those of hard rock, revealing its more prominent creep tendency obvious. The parameters obtained for the Burgers model can be used for rheological numerical analysis of saturated Q2 loess.
It can be seen from the case study and comparison between the theoretical simulation curve and the experimental curve that the four-parameter Burgers model is suitable for saturated Q2 loess, which can well simulate the rheological curve of saturated Q2 loess, and the model parameters can be used for the elastic-viscoplastic analysis of saturated Q2 loess.
The experimental results shed light on the creep characteristics of saturated Q2 loess. However, in practice, rheological failures often occur several years or even decades after constructing the projects. In addition, uniaxial creep tests were conducted with relatively short durations due to test equipment limitations. Therefore, the creep parameters obtained need further experimental and numerical verification.
Data Availability Statement
The original contributions presented in the study are included in the article/Supplementary Material, further inquiries can be directed to the corresponding author.
Author Contributions
XL drafted the manuscript. XZ finished the comparison of model-simulated and experimental creep curves of saturated Q2 loess. XF prepared the data analysis. TY and ZS prepared the data collection. All authors have read and approved the final manuscript.
Funding
The Fundamental Research Funds for the Central Universities of Lanzhou University: Experimental Study on flow sliding failure mechanism of saturated loess (Number: lzujbky-2014-3).
Conflict of Interest
The authors declare that the research was conducted in the absence of any commercial or financial relationships that could be construed as a potential conflict of interest.
Publisher’s Note
All claims expressed in this article are solely those of the authors and do not necessarily represent those of their affiliated organizations, or those of the publisher, the editors and the reviewers. Any product that may be evaluated in this article, or claim that may be made by its manufacturer, is not guaranteed or endorsed by the publisher.
Acknowledgments
The first author would like to express warm gratitude to the Fundamental Research Funds for the Central Universities of Lanzhou University. We thank Professor Wenwu Chen for his helpful suggestions and Dr. Pengbo Yuan for his experimental help. The authors would also like to thank the reviewers for reviewing the draft version of the manuscript.
Abbreviations
E, Elastic modulus; η, Viscosity coefficient; σ, Step load. ε, Total strain at time t (s).
References
An, Z., Wang, S., Wu, X., Chen, M., Sun, D., and Liu, X. (1998). Aeolian Evidence on the Loess Plateau of China: the Beginning of the Great Ice Age in the Northern Hemisphere in the Late Cenozoic and the Uplift Drive of the Tibetan Plateau. Sci. China (D) 28 (6), 481–489.
Chen, H., Jiang, Y., Niu, C., Leng, G., and Tian, G. (2019). Dynamic Characteristics of Saturated Loess under Different Confining Pressures: a Microscopic Analysis. Bull. Eng. Geol. Environ. 78 (2), 931–944. doi:10.1007/s10064-017-1101-9
Chen, Z., Shi, Z., Yu, Z., Wu, X., and Jin, J. (1989). Measurement of Expansion, Creep and Relaxation of Brittle Rocks by 8000KN Multifunctional Triaxial Apparatus. J. Rock Mech. Eng. 8 (2), 97–118.
Dijkstra, T. A., Rogers, C. D. F., Smalley, I. J., Derbyshire, E., Li, Y. J., and Meng, X. M. (1994). The Loess of north-central China: Geotechnical Properties and Their Relation to Slope Stability. Eng. Geology. 36, 153–171. doi:10.1016/0013-7952(94)90001-9
Fabre, G., and Pellet, F. (2006). Creep and Time-dependent Damage in Argillaceous Rocks. Int. J. Rock Mech. Mining Sci. 43 (6), 950–960. doi:10.1016/j.ijrmms.2006.02.004
Feng, L., and Zheng, Y. (1982). Collapsible Loess in China. Beijing: China Railway Publishing House.
Fu, Y., Gao, Z., Hong, Y., Li, T., and Garg, A. (2021). Destructuration of Saturated Natural Loess: From Experiments to Constitutive Modeling. Int. J. Damage Mech. 30 (4), 575–594. doi:10.1177/1056789520939300
Huang, W. (1983). Engineering Properties of Soil. Beijing: Water Resources and Electric Power Press.
Lin, H., Zhang, X., Cao, R., and Wen, Z. (2020). Improved Nonlinear Burgers Shear Creep Model Based on the Time-dependent Shear Strength for Rock. Environ. Earth Sci. 79, 149. doi:10.1007/s12665-020-8896-6
Palmer, J. (2017). Creeping Earth Could Hold Secret to Deadly Landslides. Nature 548, 384–386. doi:10.1038/548384a
Pang, X. (2017). Rheological Constitutive Model of Compacted Loess Based on Creep Test. J. Railway Sci. Eng. 14 (06), 1206–1216. doi:10.19713/j.cnki.43-1423/u.2017.06.013
Peng, J., Fan, Z., Wu, D., Zhuang, J., Dai, F., Chen, W., et al. (2015). Heavy Rainfall Triggered Loess-Mudstone Landslide and Subsequent Debris Flow in Tianshui, China. Eng. Geology. 186, 79–90. doi:10.1016/j.enggeo.2014.08.015
Qian, J., and Yin, Z. (1996). Geotechnical Principle and Calculation. Beijing: China Water and Power Press.
Qiao, P., and Li, Z. (1990). Engineering Geology in Loess Area. Beijing: Water Resources and Electric Power Press.
Shan, S., Xie, W., Zhu, R., and Yang, H. (2021). Creep Characteristics of Compacted Loess in Yan'an New District under Loading and Unloading Conditions. J. Arid Land Resour. Environ. 35 (07), 144–155. doi:10.13448/j.cnki.jalre.2021.198
Tang, H., Duan, Z., Wang, D., and Dang, Q. (2019). Experimental Investigation of Creep Behavior of Loess under Different Moisture Contents. Bull. Eng. Geol. Environ. 79, 411–422. doi:10.1007/s10064-019-01545-8
Wang, G., Zhang, L., Zhang, Y., and Ding, G. (2014). Experimental Investigations of the Creep-Damage-Rupture Behaviour of Rock Salt. Int. J. Rock Mech. Mining Sci. 66 (1), 181–187. doi:10.1016/j.ijrmms.2013.12.013
Wang, S., and Luo, Y. (2009). Research on Creep Characteristics of Loess under Complex Stress. Rock Soil Mech. 30 (Suppl. 2), 43–47. doi:10.16285/j.rsm.2009.s2.098
Wang, S., Yang, Z., and Fu, B. (2004). Century Achievements and New Historical mission of Rock Mechanics and Engineering in China. Nanjing: Hohai University Press.
Wang, X., Wang, J., Zhan, H., Li, P., Qiu, H., and Hu, S. (2020). Moisture Content Effect on the Creep Behavior of Loess for the Catastrophic Baqiao Landslide. Catena 187, 104371. doi:10.1016/j.catena.2019.104371
Wang, X., Yin, Y., Wang, J., Lian, B., Qiu, H., and Gu, T. (2018). A Nonstationary Parameter Model for the sandstone Creep Tests. Landslides 15, 1377–1389. doi:10.1007/s10346-018-0961-9
Wang, Y. (1982). Microstructure of Loess and its Changes in Geological Age and Region — Study under Scanning Electron Microscope Loess and Quaternary Geology. Shaanxi People's Publishing House.
Wen, B.-P., and Jiang, X.-Z. (2017). Effect of Gravel Content on Creep Behavior of Clayey Soil at Residual State: Implication for its Role in Slow-Moving Landslides. Landslides 14, 559–576. doi:10.1007/s10346-016-0709-3
Xia, C., and Sun, J. (1996). Distinction of Rheological Model and Determination of Parameters on Creep Tests. J. Tongji Univ. 24 (5), 498–503.
Xia, C., Liu, Z., and Zhou, C. (2021). Burger's Bonded Model for Distinct Element Simulation of the Multi-Factor Full Creep Process of Soft Rock. J. Mar. Sci. Eng. 9, 945. doi:10.3390/jmse90909457
Xie, D., and Qi, J. (1999). Soil Structure Characteristics and New Approach in Research on its Quantitative Parameter. Chin. J. Geotechnical Eng. 21 (6), 651–656.
Xie, X., Qi, S., Zhao, F., and Wang, D. (2018). Creep Behavior and the Microstructural Evolution of Loess-like Soil from Xi'an Area, China. Eng. Geology. 236, 43–59. doi:10.1016/j.enggeo.2017.11.003
Xu, L., Coop, M. R., Zhang, M., and Wang, G. (2018). The Mechanics of a Saturated Silty Loess and Implications for Landslides. Eng. Geology. 236, 29–42. doi:10.1016/j.enggeo.2017.02.021
Yang, S., Zhang, J., and Huang, Q. (2004). Analysis of Creep Model of Jointed Rock. Rock Soil Mech. 25 (8), 1225–1228. doi:10.16285/j.rsm.2004.08.010
Ye, G.-l., Nishimura, T., and Zhang, F. (2015). Experimental Study on Shear and Creep Behaviour of green Tuff at High Temperatures. Int. J. Rock Mech. Mining Sci. 79, 19–28. doi:10.1016/j.ijrmms.2015.08.005
Zhao, L., Ge, K., and Liu, E. (2011). Study on the Rheological Properties of Loess Building Science 21 (3), 69–73. doi:10.13614/j.cnki.11-1962/tu.2011.03.004
Zheng, Y., Zhou, C., and Xia, S. (1997). Discussion on Viscoelastic Continuous Damage Constitutive Model of Geotechnical Materials. J. Hohai Univ. 25 (2), 114–116.
Keywords: saturated loess, creep, step load, burgers model, flow failure
Citation: Liu X, Zhang X, Fu X, Yang T and Su Z (2022) Experimental Study on Creep Characteristics of Saturated Q2 Loess. Front. Earth Sci. 10:815275. doi: 10.3389/feart.2022.815275
Received: 15 November 2021; Accepted: 03 January 2022;
Published: 25 January 2022.
Edited by:
Yueren Xu, China Earthquake Administration, ChinaReviewed by:
Chao Kang, University of Northern British Columbia Canada, CanadaR. M. Yuan, China Earthquake Administration, China
Copyright © 2022 Liu, Zhang, Fu, Yang and Su. This is an open-access article distributed under the terms of the Creative Commons Attribution License (CC BY). The use, distribution or reproduction in other forums is permitted, provided the original author(s) and the copyright owner(s) are credited and that the original publication in this journal is cited, in accordance with accepted academic practice. No use, distribution or reproduction is permitted which does not comply with these terms.
*Correspondence: Xiaowei Liu, bGl1eHdAbHp1LmVkdS5jbg==
 Xiaowei Liu
 Xudong Zhang
 Xiaogang Fu
 Tianxiang Yang
 Zisong Su


