- 1Key Laboratory of Earthquake Engineering and Engineering Vibration of China Earthquake Agency, Institute of Engineering Mechanics, China Earthquake Agency, Harbin, China
- 2Key Laboratory of Loess Earthquake Engineering, China Earthquake Agency, Lanzhou, China
- 3Geotechnical Disaster Prevention Engineering Technology Research Center of Gansu Province, Lanzhou, China
A large-scale shaking table test was conducted with simulated earthquakes and groundwater to study the dynamic response and instability mechanism of a loess slope with a saturated bottom. By examining the acceleration, dynamic pore water pressure, corresponding soil pressure and observed macroscopic failure behaviour of the slope under different shaking intensities, the dynamic responses of acceleration and pore water pressure of the loess slope were analysed. By comparing the time history curve of acceleration with the time history curves of pore water pressure and surrounding soil pressure, we found that the instability failure of the slope was first due to the continuous vibration that caused the local structure of the slope soil to be damaged, forming locally saturated soil and the rise in the groundwater table during shaking. Then, the saturated soil liquefied under the action of strong vibration, and the liquefied soil mass slid under the action of a high-intensity earthquake force. Finally, the acceleration and spectral characteristics of the pore water pressure changed sharply with a shift in the predominant frequency at the liquefied locations under a high shaking intensity. The significant changes in dynamic pore water pressure mainly occurred when the shaking components in the low-frequency bands below 1 Hz. This implied that the shift in the frequency mainly resulted from the damage in the structure of the loess slope after high-intensity shaking. These results help us better understand the triggering mechanism and failure mechanism of saturated loess slopes during the Minxian-Zhangxian earthquake.
Introduction
Loess is a special soil widely distributed in northern China. Natural loess has aeolian characteristics, and the particle components are mainly powder particles; in loess, joints and large pores are visible to the naked eye, and soluble salt crystal cementation occurs between soil particles, so it has strong water sensitivity and dynamic vulnerability (Wang, 2020; Assallay et al., 1997). Documented case histories of the phenomenon of liquefaction have been useful to researchers studying the devastating effects of loess liquefaction slipping. In the Ⅺ degree zone of the 1303 HongTong M 8.0 earthquake in Shanxi Province, China, large-scale slipping caused by liquefaction of the underlying strata occurred in the area of Huanbu on the piedmont diluvial fan with a slope of approximately 2° in northeastern HongTong County, resulting in fragmentation of the upper loess tableland (Zhao et al., 2003; Su et al., 2003). The 1811–1812 New Madrid M 8.0 earthquake in the United States caused the liquefaction of the loess stratum on the east bank of the Mississippi River, forming an irregular shallow settlement area with a length of approximately 20 km and a width of approximately 6 km, which led to the backflow of the Mississippi River and the expansion of the Reelfoot Lake area (Hwang et al., 2000; Jefferson et al., 2003). In the 1920 Haiyuan MS 8.5 earthquake in Ningxia, the liquefaction of saturated sandy loess at the bottom of Shibeiyuan occurred approximately 14 km northwest of Yuanzhou district, Guyuan city. A large-scale liquefaction slipping area of 2.9 km2 was formed in the Ⅹ degree zone, villages were destroyed, and more than 200 people were killed (Bai and Wang, 1987). In the 1989 Dushanbe MS 5.5 earthquake, a large amount of liquefaction was triggered on a nearly flat site below the gentle slope and hilly terrain of the Gilsa region, and a large mudflow formed, resulting in more than 200 deaths (Ishihara et al., 1990). In the 2013 Minxian-Zhangxian MS 6.6 earthquake, Gansu Province, a large mudflow landslide was triggered by liquefaction of saturated loess in Yongguang village, located near the epicentre in the VIII degree zone; twelve people were killed, and eight houses were destroyed (Xu C. et al., 2013). The above-mentioned examples show that liquefaction can be triggered when the earthquake intensity exceeds the VIII degree, as liquefaction causes large-scale slippage of loess. The losses and impacts related to such disasters are very serious.
Prakash and Puri (1982) first proposed the liquefaction problem of saturated loess based on vibration triaxial test results of loess-like soil from the central United States under a constant amplitude cyclic load. Ishihara et al. (1990) investigated the large-scale landslides triggered by the M 5.5 earthquake in the suburb of Dushanbe, the capital of the Tajikistan Republic, and concluded that liquefaction occurred in the landslide masses due to the high collapsibility of the loess soil saturated by irrigation water. Scholars have also discovered the phenomenon of loess sliding caused by loess liquefaction in the Wenchuan earthquake (Wang et al., 2012) and Minxian-Zhangxian earthquakes (Wang and Wu, 2013) in the loess region. Studies (Zhang et al., 1995; Wang et al., 2000; Zhang et al., 2013; Wang G. et al., 2014; Wang et al., 2021; Wang, 2020) have been conducted to confirm that saturated loess, even loess with a natural moisture content higher than the plastic limit moisture content, has liquefaction potential and that liquefaction can occur in the loess layer triggered by earthquakes of a certain intensity.
The liquefaction-induced mechanism, as the dominant mechanism contributing to the slipping of saturated loess, has been widely studied. Recent research on this topic has focused on triaxial tests, ring shear tests and flume model tests to investigate the mechanism that produces the high mobility of loess landslides (Zhang et al., 1995; Zhang and Sassa, 1996; Fletcher, 2000; Wang et al., 2002; Sassa et al., 2005; Wang et al., 2007; Wang Q. et al., 2014; Zhang et al., 2014; Carey et al., 2017; Gao, 2021). Wang (2003) concluded that due to water, saturated loess causes partial or total dissolution of salt crystals and other cements, which significantly weakens its structural strength. In addition, pore water pressure is generated under the action of seismic loading, resulting in a significant decrease in the effective stress of the soil, thus causing a catastrophic flow slide. Wang et al. (2007) revealed that a significant reduction in the shear strength could result after shear failure due to the build-up of excess pore water pressure within the shear zone by performing undrained and partially drained ring-shear tests on mixtures of sandy silt with different loess contents, which agreed with the conclusions drawn by Zhang et al. (1995) and Zhang et al. (2014).
However, past studies on the behaviour of loess liquefaction have not clarified the relationship between the dynamic characteristics and macrodamage of slopes under the seismic action of saturated loess, especially loess saturated by groundwater. These include the acceleration response, surrounding-soil pressure response, and dynamic pore water pressure response. In addition, the critical ground motion acceleration and dynamic pore pressure ratio that cause loess liquefaction slipping must be further studied.
This research studied the dynamic behaviour of a loess slope model with a saturated bottom using a prototype soil profile patterned from the Yongguang Wamuchi village landslide after a past earthquake based on the shaking table test. The large-scale shaking table facility at Lanzhou Institute of Seismology, China Earthquake Administration (CEA) Key Laboratory of Loess Earthquake Engineering, CEA, was used. This experimental study provides an improved understanding of the phenomenon of liquefaction slipping of a slope in which the bottom is saturated by rising groundwater during an earthquake. In addition, the experimental data can be used as a baseline to validate numerical simulations of liquefaction-induced loess landslides and evaluate the effectiveness of different liquefaction mitigation measures, such as anti-liquefaction piles and prefabricated vertical drains.
Case Study
On 22 July 2013, an MS 6.6 earthquake occurred in the NW-trending Lintan-Tangchang fault on the northeastern edge of the Qinghai-Tibet Plateau, with the epicentre at the junction of Minxian and Zhangxian counties in Dingxi, Gansu Province. The earthquake induced at least 2330 landslides, of which 600 landslides and collapses occurred in the loess layer (Wang and Wu, 2013; Xu S. H. et al., 2013; Xu C. et al., 2013). Among these landslides, a typical loess liquefaction landslide occurred on the slope of Yongguang village, Minxian County, Gansu Province (see Figure 1). The landslide was approximately 45,200 m2, and Q3 loess-induced instability almost destroyed the whole Wamuchi village, resulting in 12 deaths. The sliding distance of the landslide was approximately 1.05 km, as shown in Figure 1B, illustrating typical loess fluid-slip characteristics. The long-term rainfall before the earthquake increased the water content of the slope together with the groundwater. Special topographic (Figure 1C) and hydrological conditions provide the basic conditions for the rise in the groundwater level due to rainfall and earthquakes. Groundwater and rainfall saturated the bottom loess on the sliding surface 2–3 m above the sandstone (Liu, 2020). In addition, the moisture content of the slope surface was high due to rainfall. The high water content provides a material basis for the seismic liquefaction of loess. According to the laboratory test results, the peak acceleration of seismic ground motion caused liquefaction to be at least 122 gal (Wang et al., 2021). According to the seismic ground motion records of the Minxian seismic station (PGA is 226 gal), the peak acceleration of ground motion (PGA) on the slope of Wamuchi is more than 300 gal. During an earthquake, the excess pore water pressure of saturated loess rises due to seismic loading, which leads to slope failure. Although significant efforts have been devoted to the study of the initiation, motion, and deposition of fluidized landslides with emphasis on pore-pressure generation and dissipation, the understanding of the fluidized landslide process is limited (Wang et al., 1998). In particular, under seismic action, how excess pore pressure is generated and maintained and how the generated pore pressure affects the movement of displaced landslide material requires further scrutiny.
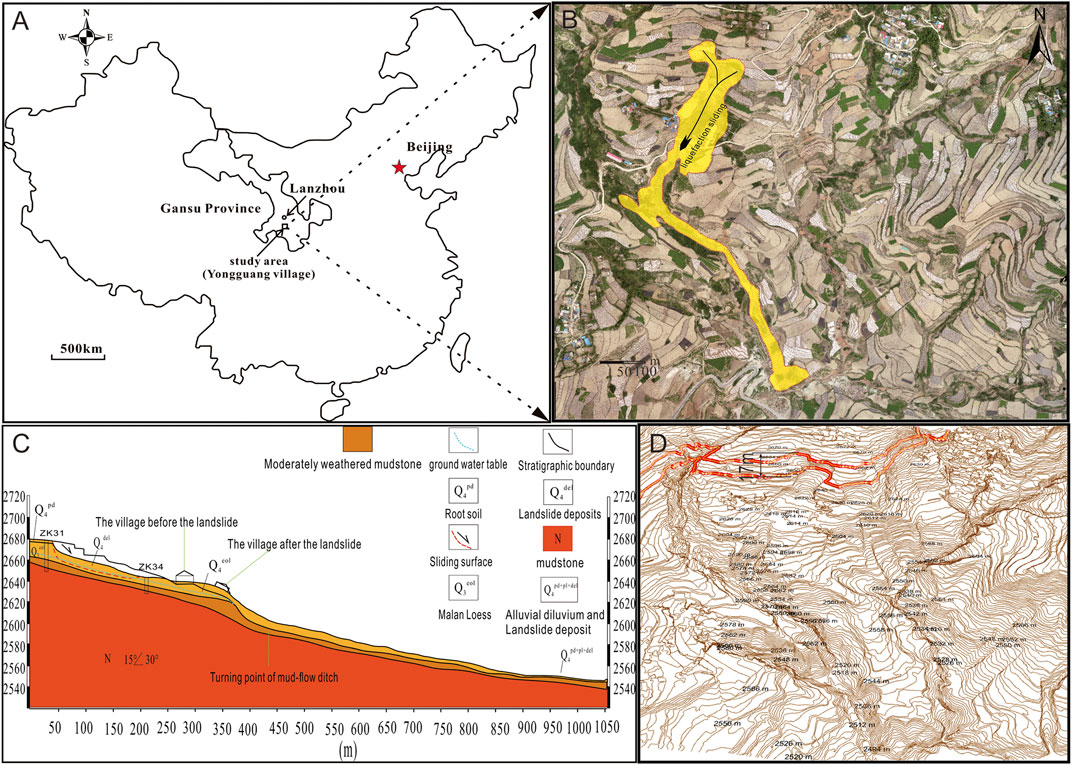
FIGURE 1. (A) Location of the Yongguang landslide; (B) The landform after the landslide; (C) The engineering geological profile of the Yongguang village landslide; (D) The contour line of landslide DSM.
The Large-Scale Shaking Table Test
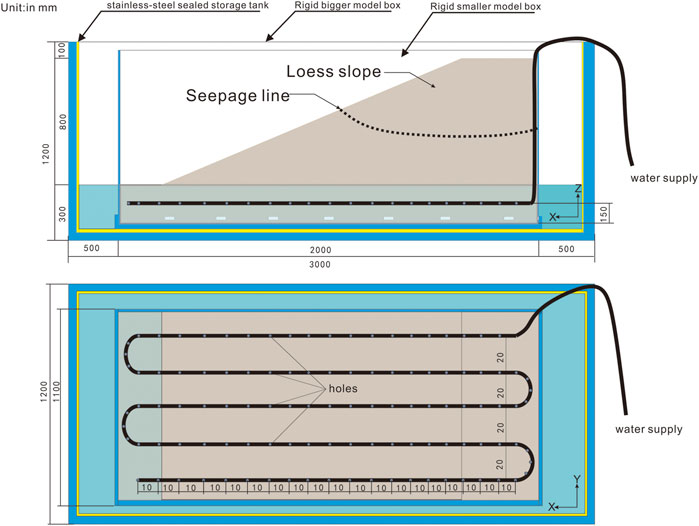
A large-scale shaking table test was performed to investigate the dynamic characteristics and failure mechanism of the bottom saturated loess landslide. The shaking table facility at Lanzhou Institute of Seismology, China Earthquake Administration (Key Laboratory of Loess Earthquake Engineering, CEA) was used. The shaking table size was 4 m (in width) × 6 m (in length), and the table could achieve horizontal (x), vertical (z), and horizontal-vertical (x-z) coupled loading. The shaking frequency in the x-direction was 0.1–70.0 Hz, and hat in the z-direction was 0.1–50.0 Hz. The maximum acceleration of the x-direction was 1.7 g, and that of the z-direction was 1.2 g when the loadings in the two directions were applied separately. In the combined model box used to saturate the bottom soil of the slope model, a stainless-steel sealed storage tank was embedded in the rigid model box with internal dimensions of 3.0 m × 1.5 m ×1.2 m [length × width × height (L × W × H)]. In the stainless-steel tank, a smaller rigid rectangular model case was fixed on the bottom, and 18 rectangular window holes were cut on four sides around the model box. The sizes of the smaller rigid box were 2 m × 1 m × 1.1 m (L × W × H). The body and bottom plate of the smaller rigid box were separable, and water could seep into the box from the gaps around the bottom of the model case. The front and back internal faces of the smaller model box were set up with polyphenylene bubble panels to minimize possible boundary effects. Vaseline was smeared on both sidewalls along the sliding direction to reduce friction.
Similarity Relations
The physical ground model simulated prototype ground conditions representative of soil profiles with saturated bottoms observed at the Yongguang west landslide during the 2013 Minxian-Zhangxian MS 6.6 earthquake. The designed shaking table model was expected to meet geometric, kinematic, and dynamic similarity based on similarity theory to reflect the actual dynamic response characteristics of the prototype slope. In fact, it is impossible for the parameters to meet all similarity ratios according to similarity theory. Therefore, it is necessary to control the main parameters and ignore secondary parameters according to the purpose of the test. Considering the size of the model box and the possible application to the remoulded slope model, we designed the slope model by a similarity ratio (λ) of 10 following the similarity adopted by Lin and Wang (2006). Soil density ρ, geometric length L and gravitational acceleration were selected as the fundamental parameters in this test, with values λρ = 1, λL = 10, and λa = 1, respectively. Other similarity ratios are calculated according to Birmingham’s π theorem (Birmingham, 1914).
Similarity Materials
There is a large difference in the physical and mechanical parameters between the prototype and model materials according to the similarity ratios; therefore, materials similar to natural materials must be adopted. In the modelling process, materials similar to those present in loess are loess, barite powder, fly ash, saw powder, water and glycerin, with a ratio of 0.50:0.15:0.15:0.15:0.03:0.02. Direct shear and triaxial tests on the loess samples were conducted in the laboratory, as described in previous studies (Chai et al., 2019). The basic physical and mechanical parameters of the physical model are listed in Table 1.
The Process of Modelling
Yongguang landslide from the perspective of triggering mechanism, as Figure 1 shown the Yongguang landslide is just a part of a mountain. The sliding body is Q3 Malan loess located on the upper part of weathered argillaceous sandstone. The weathered argillaceous sandstone is a relatively water-tight layer, the prolonged rainfall before the earthquake and the rise of the groundwater level during the earthquake caused the soil near the groundwater level was in a saturated state. The borehole data from the field survey after landslide shows that the groundwater depth at the back edge of the landslide is 16–17.8 m and the groundwater depth at slope foot position before slide is 3.2 m (Liu, 2020). According to DSM data (Figure 1D) of post-slide landslide, the position of the sliding surface of the trailing edge is about 17 m below the slope surface. Liquefaction of the bottom saturated loess caused by ground shaking, which leads to the occurrence of landslides (Wu et al., 2015). Through the investigation and analysis described above, the model was simplified to a single loess model slope according to the prototype. The model slope had a length of 2000 mm, height of 1000 mm, width of 1000 mm, top width of 250 mm and slope angle of 25°. The layout of the final test model is illustrated in Figure 2. The loess used for making the model was sifted through a sieve with a mesh diameter of 2 mm, and model material with a moisture content of 5% (natural moisture content of the loess) was prepared by spraying water, mixing, and drying. During the model-making stage, the layered tamping method was used to build it from bottom to top, and the thickness of each tamping was controlled at 10 cm. To avoid separation from other layers, the surface of each layer was especially rough to make better contact with each other layer after the tamping was completed. The density of the model was controlled at 1.35 g/cm3.
To saturate the model slope bottom, groundwater was formed by water infiltrating through the gaps and holes around the case bottom. The water injected from the pipe with holes at equal intervals (10 cm) was buried at equal spacing distances at the bottom of the model. After the model tamping was completed, water was injected into the large model case, and the water pipe was connected to tap water (low water pressure and slow velocity) to saturate the soil at the bottom of the model. After constant injection, a water level of 30 cm was reached, and the model was steady until the water surface of the large model box did not drop within 1 h, which was necessary to form a stable groundwater level. The soil at the bottom of the model was sampled and tested; its moisture content was 33%, and its saturation was calculated to be 85.2%. According to the liquefaction standard proposed by Wang et al. (2000) and the requirements of saturation in the Standard for Building Construction in Collapsible Loess Regions (GB 50025-2018), loess was considered to be saturated when its saturation reached more than 80% after soaking and before collapsing. The completed model is shown in Figure 2.
Monitoring
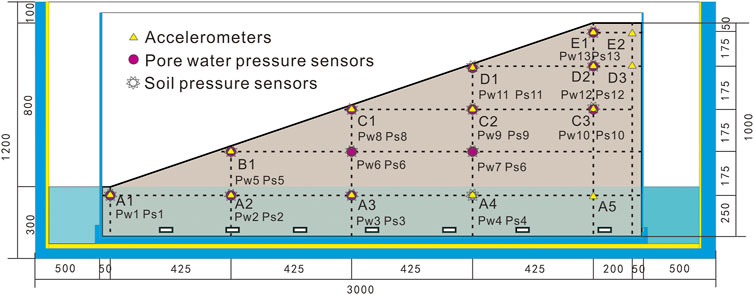
In the test, 14 three-way capacitive acceleration sensors, 13 soil pressure sensors and 13 pore water pressure sensors were embedded in the model slope to monitor the dynamic response, as shown in Figure 3.
Shaking Sequences
The EW component of the Minxian wave (MX wave) was used in the test as the input waveform, which was recorded on 22 July 2013, at the Minxian strong motion station 18 km from the epicentre in the Minxian-Zhangxian MS 6.6 earthquake. The peak acceleration in the EW direction was 226 gal. The EW component of the MX wave was used as the input motion proportionally scaled according to its peak wave. The EW component of the waveform had a preeminent frequency of 4.1 Hz and a duration of 70 s. The input MX wave was loaded as the excitation scheme shown in Table 2.
Experimental Results
The shaking table tests provided an opportunity to further investigate the dynamic behaviour of bottom-saturated loess slopes under the action of earthquakes, which has been observed in several earthquakes. In this section, the results of the acceleration time history and acceleration amplification are evaluated thoroughly. The pore water pressure generation and its effect on observed liquefaction slipping are discussed. Additionally, the soil pressure corresponding to the pore water pressure is analysed, and the ratio of pore water pressure and corresponding soil pressure is used to identify dynamic liquefaction, combined with the slope macroscopic deformation.
Acceleration Amplification Effect of the Slope
Based on the results of the physical model, the acceleration time history of the slope surface and the inner position of the slope were obtained to analyse the peak acceleration (PGA) of each monitoring point. Figure 4 shows the time history curves of the surface on the slope, and Figure 5 presents the acceleration response in the slope when the acceleration amplitude of the seismic wave was 113, 339, and 565 gal. To reflect the amplification effect of acceleration, the acceleration amplification coefficient was defined at each measurement point. The peak acceleration amplification coefficient here refers to the ratio of the PGA measured at any monitoring point to the PGA measured at the shaking table (Feng et al., 2019). The relative height (h/H) was defined by the ratio of the height of any monitoring point (h, measured from the toe of the model slope) to the total height (H) of the model slope. The dynamic response acceleration reached the maximum at the same time under the action of low intensity with a peak acceleration of 113 gal. Comparing the peak acceleration amplification coefficient in Figure 6A, it was found that the peak acceleration of the slope surface gradually increased with increasing input ground motion and relative height (h/H). The peak acceleration increased along the slope surface (from A1 to E1) with increasing height under low intensity (see Figure 4A). Acceleration amplification of the slope surface showed that the closer to the shallow surface and the top of the slope, the more obvious the acceleration amplification, which is what predecessors call the surface effect (Zhang et al., 2018). However, the acceleration at the toe (A1) and the middle (C1) of the slope surface increased evidently when the input acceleration exceeded 339 gal; i.e., the accelerated response no longer increased gradually along the slope surface (Figure 4B). With the increase in input amplitude reaching 565 gal, the acceleration of the middle slope surface (C1) increased abnormally and reached the maximum (11.8 m/s2) 3.20 s after the peak of input ground motion, as shown in Figure 4C. More interestingly, the acceleration did not have an arc attenuation trend after a sudden increase and then slowly decreased, similar to A2/A4/D3, as shown in Figure 5C. Large deformations, such as cracks, probably appeared at this location, but no liquefaction slip occurred. The macroscopic deformation of the slope surface also confirms this hypothesis.
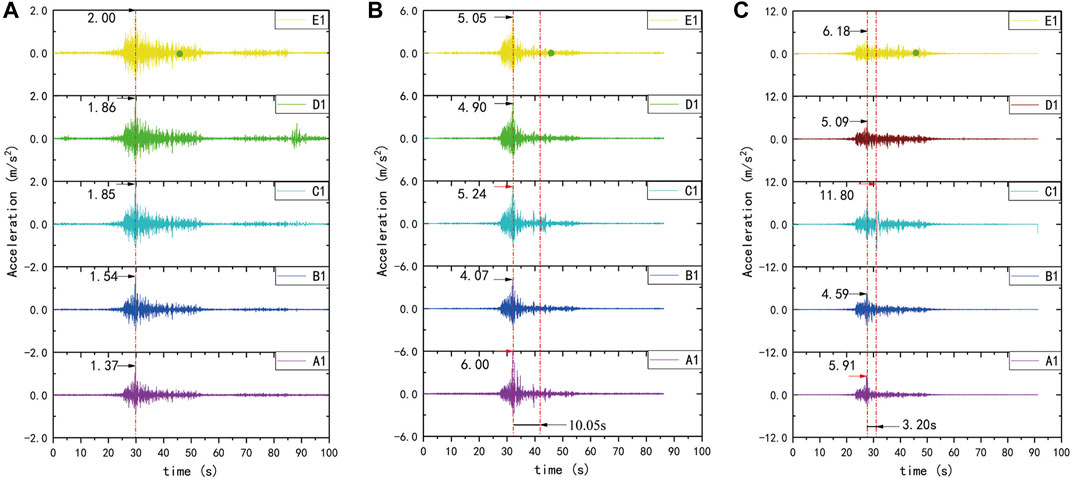
FIGURE 4. The acceleration time history of the slope surface. (A) The input amplitude is 113 gal. (B) The input amplitude is 339 gal. (C) The input amplitude is 565 gal.
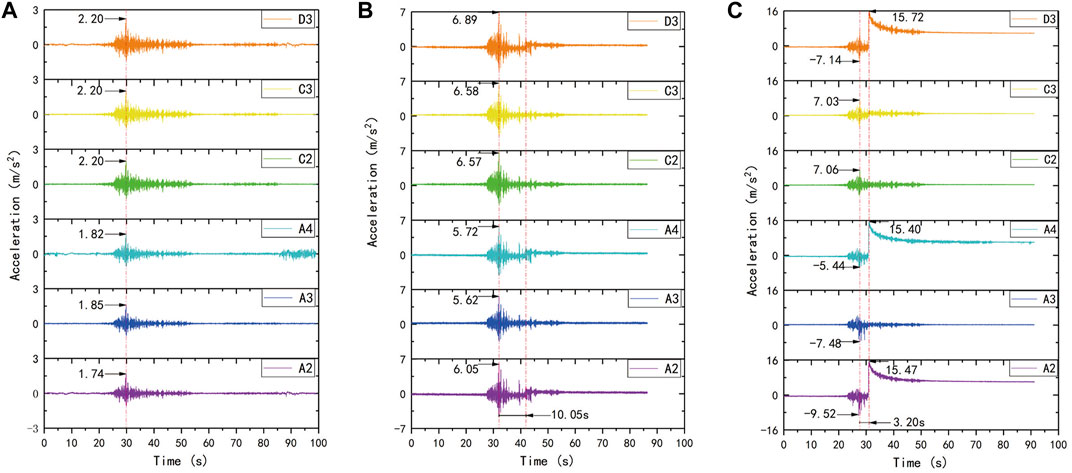
FIGURE 5. The acceleration time history in the slope. (A) The input amplitude is 113 gal. (B) The input amplitude is 339 gal. (C) The input amplitude is 565 gal.
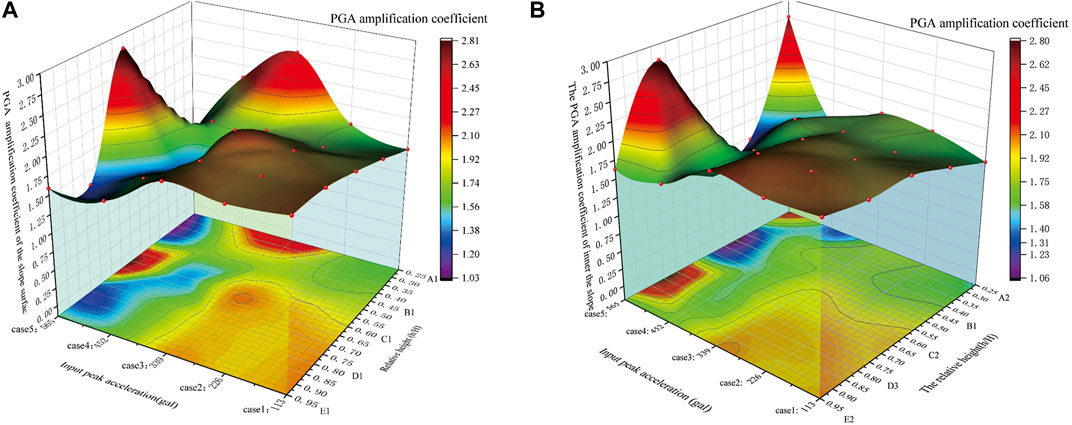
FIGURE 6. The PGA amplification coefficient against the input peak acceleration and relative height. (A) The PGA amplification coefficient of the slope surface. (B) The PGA amplification coefficient inside the slope.
By comparing the acceleration response of different relative height monitoring points, A2, B1, C2, D3, and E2, it was found that the acceleration response gradually increased with increasing elevation of the monitoring points. However, the accelerations in the horizontal layer at the same height did not change significantly, and the peak acceleration amplification coefficient showed little difference, as shown in Figure 6B. Under the action of a unidirectional seismic wave, the acceleration response law inside the slope showed an elevation effect, as Zhang et al. (2018) described.
When the peak acceleration of the input vibration reached 565 gal, the acceleration of the slope bottom at A2/A4 and near the top of the slope (D3) suddenly increased and reached a maximum 3.20 s after the input shaking reached the peak value; these values slowly decreased and finally stabilized (see Figure 5C). However, the zeros of the stabilized acceleration deviated from the initial zeros, which indicates that the soil at the three points clearly migrated. The main reasons for the baseline drift of acceleration were hysteresis of the sensor, background noise of the sensor and tilt of the sensor (Zheng et al., 2010). In this study, the first two reasons were excluded because there was no drift in other channel sensors tested in the same test. The main reason for the inclination of the sensors is speculated to be the liquefaction of the soil surrounding the sensors. Moreover, the migration was in a viscous state, rather than as a landslide that broke apart. The specific explanation is that local liquefaction occurred at the monitoring points, and the liquefied soil slipped under the continuous seismic force.
Dynamic Pore Water Pressure Response
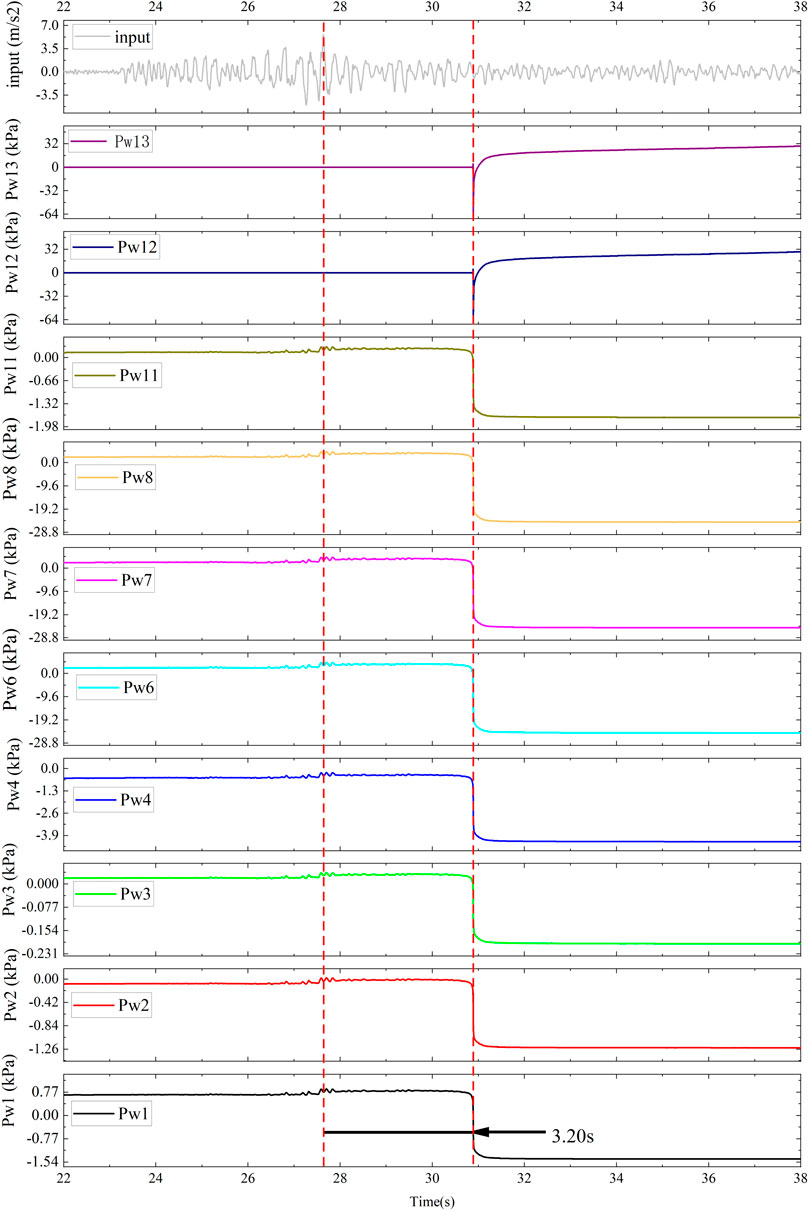
The importance of pore water pressure generation/dissipation in liquefaction mechanisms has been highlighted by numerous researchers (Major and Iverson, 1999; Wang and Sassa, 2001; Wang and Sassa, 2003). The dynamic pore water pressure of monitoring points in the slope has no significant change when a low amplitude vibration is applied. When the vibration peak reached 339 gal, the pore water pressure in the centre of the slope (Pw7) and the middle of the slope (Pw6, Pw8) suddenly increased and reached the first peak, while the input shaking reached the peak acceleration. The maxima were 1.017, 1.020, and 1.018 kPa, respectively. Then, they fluctuated and gradually decreased; 13 s later, the pore water pressure of Pw6, Pw7, and Pw8 increased again to reach the second peak, which had almost the same peak value of 1.06 kPa, and then maintained a steady state of slow increase without dissipation, as shown in Figure 7A.
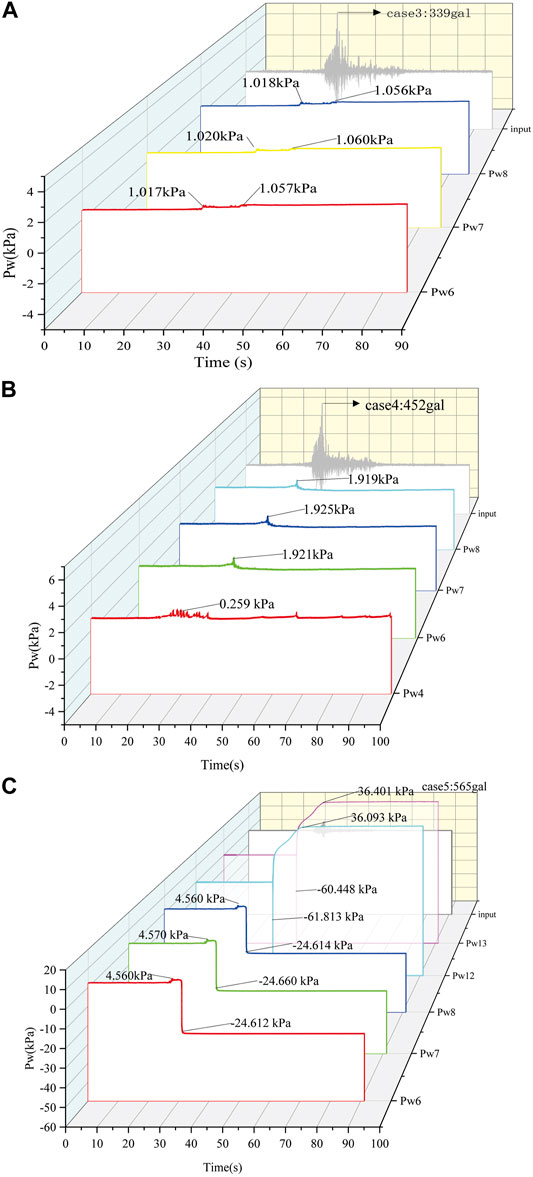
FIGURE 7. The pore water pressure in the slope. (A) The input amplitude is 113 gal. (B) The input amplitude is 339 gal. (C) The input amplitude is 565 gal.
While the peak acceleration of the input increased to 452 gal, other monitoring points in the slope body did not show significant changes, except that the pore water pressure of Pw4, Pw6, Pw7, and Pw8 suddenly increased while the peak acceleration of the input reached the maximum, but the increased amplitude was not notable; then, they decreased and remained at a stable value, as shown in Figure 7B. However, the pore water pressure of Pw4 began to increase and fluctuated before the input reached its peak, which was located near the bottom of the model. Moreover, the pore water pressure of Pw4 was smaller than those of Pw7 and Pw8.
When the peak acceleration of the input was 565 gal, the pore water pressure first undernote a small increase at all monitoring points. Then, 3.20 s after the peak input motion, the pore water pressure of Pw6, Pw7, and Pw8 suddenly decreased, and all pore water pressures reached their negative and smallest pore pressure values. These results indicate that tension rupture occurred at these monitoring points, resulting in the rapid dissipation of pore water pressure. However, the pore water pressure of Pw12 and Pw13 synchronously decreased to the negative and smallest values, which were −61.813 and −60.448 kPa, respectively. Then, it suddenly increased to approximately 20.00 kPa, slowly increased, and finally stabilized at 36.093 kPa (Pw12) and 36.401 kPa (Pw13) (Figure 7C).
Combined with the distribution of the acceleration amplification factor and the growth trend of pore water pressure (Figure 7), it can be noticed that with the increase in ground motion (from case 1 to case 3), the seepage line in the model gradually rose. Under the amplification of the soil in the middle of the model, the local pore water pressure of the high moisture content soil in the middle of the slope increased (Pw6/Pw7/Pw8 position), and the soil began to liquefy locally. The saturated soil at the bottom was not liquefied. Due to the weak amplification effect of ground motion at the bottom, the vibration amplitude did not reach the critical peak acceleration of liquefaction, and there was no obvious increase in pore water pressure. With a further increase in the seismic peak value, the original local liquefied soil mass was further liquefied, the liquefaction range was increased, and the saturated soil mass at the bottom also began to liquefy (A4, i.e., Pw4). When the seismic peak acceleration increased to 565 gal, the saturated loess at the bottom of the slope also began to liquefy, the middle seepage line continued to rise, and the middle and rear shoulder of the model also liquefied because the acceleration had a greater amplification effect along the elevation. The uplift of the liquefaction part proved the rise in the groundwater level under the action of earthquakes. At the same time, the liquefied soil reduced the strength of the surrounding soil. Under the action of the amplified seismic inertia force, the shear strength exceeded the shear strength of the soil, resulting in tensile failure, and the liquefied soil ejected from the tension crack (Figure 9C).
Soil Pressure of the Slope Model
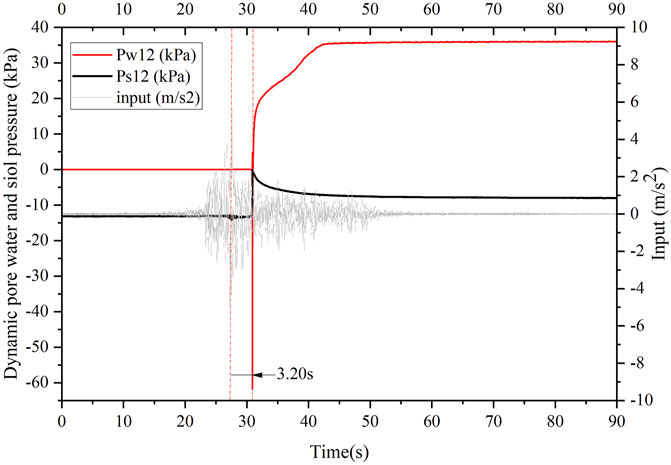
Thirteen soil pressure transducers were arranged approximately adjacent to the pore water pressure sensors along the central line to monitor the dynamic soil pressure, as shown in Figure 3. When we focused on the variation tendency of the soil pressure of the slope model at the same position as the pore water pressure in the slope, the dynamic soil pressure at the bottom (Ps1, Ps2, Ps3, Ps4), in the middle (Ps6, Ps7, Ps8) and near the top of the slope (Ps11, Ps12) had the same changing tendency when the input peak shaking sequence was case 5 (PGA: 565 gal). These soil pressures built up and synchronously reached their peak 3.2 s after the input reached the peak acceleration. Furthermore, it was found that the soil pressure of Ps1, Ps2, Ps3, Ps4, Ps6, Ps7, Ps8, Ps11, and Ps12 gradually decreased in a circular tendency after the peak value, similar to the acceleration of A2, A4, and D3 mentioned previously (see Figure 8). This shift in soil pressure and pore water pressure can be explained by liquefaction sliding, which is directly related to the generation and dissipation of generated pore water pressure and the macroscopic deformation of damaged parts of the slope caused by earthquake forces. In the liquefaction slipping zone, the dissipation of soil pressure also presents a viscous state. The slow dissipation of soil pressure is an important reference to judge whether the measured soil is liquefied, while the soil pressure in the tensile crack zone suddenly decreases to the minimum value. Combined with the analysis of the growth and dissipation trend of pore water pressure and soil pressure in the bottom saturation zone and the middle liquefaction zone, it can be concluded that the phenomenon of mud spraying and slurry pouring occurs when the pore water pressure is greater than the surrounding earth pressure.
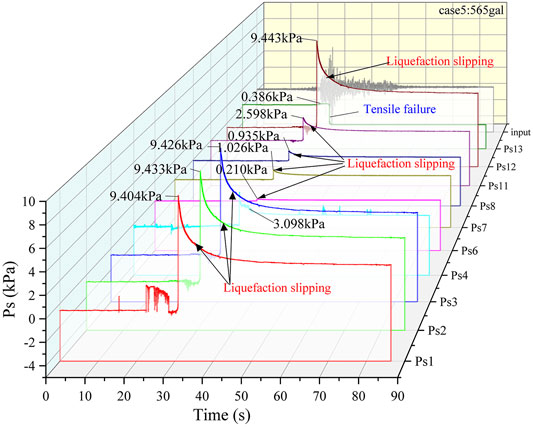
FIGURE 8. The soil pressure in the slope when the peak acceleration of the input vibration is 565 gal.
Failure Mode of the Slope
The deformation of the slope under separate input shaking intensities was summarized into three types, as shown in Figure 9. Here, we should note that the white marks are gypsum powder sprinkled for marking cracks after each test case.
1) Partial deformation and localized surface cracks. When the amplitude of the input shaking was less than 226 gal, the slope had no clear deformation. While the peak acceleration of the input vibration increased to 226 gal, three small transverse cracks and two vertical cracks appeared near the bottom on the right side of the slope surface 55 cm from the slope toe, and the spacing of the three transverse cracks was 15 and 10 cm from bottom to top, as shown in Figure 9A.
2) Fracture deepening and local liquefaction. When the input shaking amplitude increased to 339 gal, two transverse cracks appeared on the surface of the slope in the middle of the slope and just along the slope shoulder. With the input amplitude increased to 452 gal, these two fractures extended laterally to form penetrating fractures, and the cracks deepened. Meanwhile, new fractures appeared near the wetting front on the slope surface and were indirectly connected with the original cracks in the middle of the model. Many small tensile cracks appeared on the top of the model. However, the slope remained stable. The saturated loess at the bottom of the model was liquefied, and bubbles emerged from the front of the bottom slope foot (see Figure 9B).
3) Failure of slope and liquefaction sliding. When the input shaking intensity was 565 gal, liquefaction occurred at the middle surface and near the shoulder of the slope; in the bottom saturated zone, water in the soil was extruded from the soil by liquefaction and gathered at the foot of the slope. The phenomenon of mud outflow and water spraying occurred locally, and visible bubbles emerged from the liquefied soil (see Figure 9C). The trace of forward slippage movement appeared on the surface soil of the slope body. The whole slope slid along the liquefaction surface, and the old fracture continued to grow and formed three deep fractures: one near the toes of the slope with a maximum width of 10 cm, one in the middle with a maximum width of 15 cm and one on the shoulder of the slope with a maximum width of 12 cm. The liquefied mud in the front two cracks emerged and presented the phenomenon of mud spraying. Mud spraying and water pouring, such as sand liquefaction, appeared at the foot of the model slope. The trailing edge of the model slope detached from the inner wall of the box and migrated approximately 15–20 cm along the sliding surface, resulting in significant displacement of the slope and instability failure.
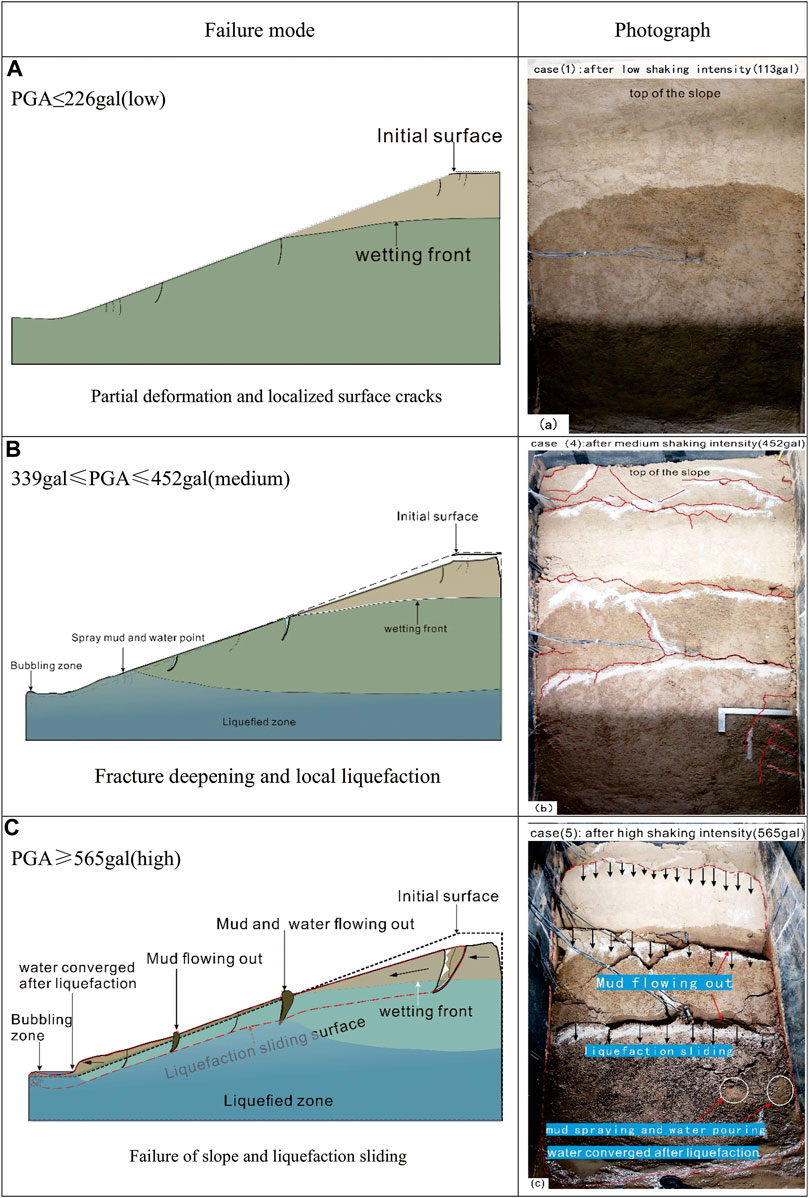
FIGURE 9. Summarized failure modes: (A) low shaking intensity (113 gal); (B) medium shaking intensity (452 gal); (C) high shaking intensity (565 gal).
Discussion
Variation in the Dynamic Response of Pore Water Pressure
The above analysis shows that the dynamic pore water pressure response of the model slope at each monitoring point would not change significantly under low-intensity shaking. To distinguish the main components that resulted in these sharp changes, in this study, a 4th-order Butterworth filter was adopted to decompose the recordings of dynamic pore water pressure and obtain the pore water pressure time-history curves in different frequency bands according to Ma et al. (2019). The patterns of pore water pressure time-history curves for measurement point of Pw13 for high shaking acceleration (case 5) are shown in Figure 10. The dynamic pore water pressure time-history curves in frequency bands less than 1, 1–5, 5–10, 10–15, 15–20, and 20–25 Hz represent the pore water pressure generated by the main energy components of the seismic wave with shaking frequencies less than 1, 1–5, 5–10, 10–15, 15–20, and 20–25 Hz. This method of decomposing the recordings of dynamic pore water pressure and obtaining the pore water pressure time-history curves in different frequency bands was used to distinguish the main components that resulted in sharp changes.
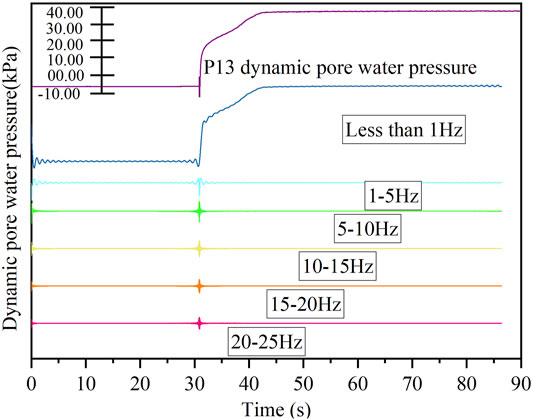
FIGURE 10. Dynamic pore water pressure time-history curves at bandpass frequencies less than 25 Hz [curves for measurement site Pw13 of the slope model under high acceleration (case 5) are shown as an example here]. These series of subcurves are divided into six frequency bands (less than 1, 1–5, 5–10, 10–15, 15–20 and 20–25 Hz).
In this study, we defined a value as the ratio (hereinafter termed the peak value ratio) between the peak amplitude value for dynamic pore water pressures in different frequency bands and that obtained from the total dynamic pore water pressure time-history curve [hereinafter termed the pore water pressure peak value ratio (
where
The results for the slope under three shaking intensities are presented in Figure 11, which shows that the values of
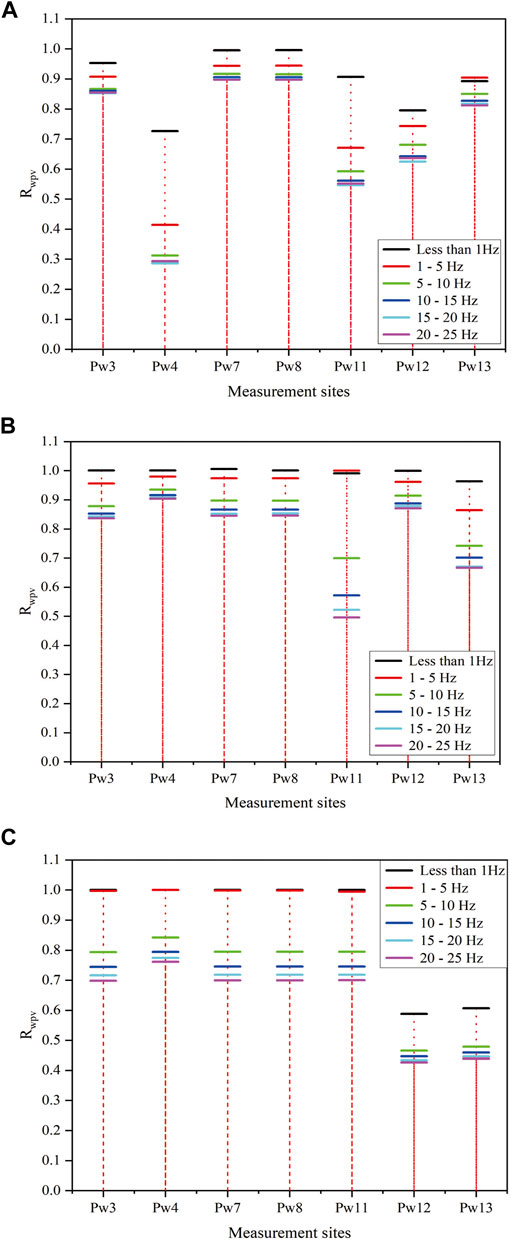
FIGURE 11. Peak value ratios (
Generation of Negative Pore Pressure
When the peak acceleration of input shaking was 565 gal, 3.2 s after the peak acceleration, the pore water pressure at all liquefied monitoring points suddenly decreased to a negative value, as shown in Figure 12. The reason is that all sensor data returned to zero before the next testing in each working case, but the actual initial pore water pressure at the monitoring point was not 0 kPa. When tension was generated after sharp shaking, the pore pressure decreased below the initial pore pressure, so the recorded pore water pressure data are negative. During the extrusion deformation, the pore water pressure increased and was greater than the initial pressure as the pore water pressure time history of Pw12 and Pw13 showed, and the value of pore water pressure was positive. The difference between the maximum positive pore pressure and negative pore pressure is the increased amplitude of pore water pressure build-up under the testing case.
Flow-Sliding Motion and Liquefaction Slipping
The liquefaction-induced sliding motion presented in Figure 9C could be interpreted based on the monitored dynamic pore water and soil pressure behaviours as follows. In stage 1, under low shaking intensity, excess pore water pressure was not generated. The horizontal driving force generated by shaking reduced the shear resistance, which caused small tensile cracks on the shallow surface of the slope. In stage 2, as the shaking intensity increased, excess pore water pressure was first generated at the bottom of the slope and was greater than the surrounding soil, which reduced the shear resistance of the loess and caused localized liquefaction at the bottom. However, due to the constraint of a rigid baffle at the front of the slope, the liquefied soil did not slide significantly. The upper tensile cracks apparently increased because of the horizontal seismic force and the softening of the soil at the bottom. Finally, in stage 3, as the shaking intensity increased, the water table rose. The excess pore water pressure at the middle of the slope and near the shoulder increased sharply and much more than the surrounding soil pressure (see Figure 13). This was due to the acceleration amplification effect, as mentioned previously. The rapid increase in dynamic pore pressure resulted in the liquefaction of surrounding soil. The partial liquefaction of soil slid forward or rapid runout of tensile cracks occurred under the action of earthquake force, resulting in the destruction of the slope body. Long-distance liquefaction slipping occurs if there is no terrain ahead to prevent it or if there is a slope suitable for long-distance sliding, similar to the Yongguang landslide.
Conclusion
This study investigated the triggering mechanism of liquefaction-induced landslides in Yongguang village on 22 July 2013, in Minxian County, Gansu Province. A large-scale shaking table model test was conducted on a simulated slope in which the bottom was immersed in water. Based on the results presented in this paper, the distributions of and variations in the dynamic acceleration, pore water pressure and soil pressure response of the bottom saturated loess slope under simulated earthquakes were studied, and the following conclusions were drawn:
1) The accelerations recorded in slopes increased with increasing distance from the bottom to the upper surface both along the slope surface and inside the model. The dynamic acceleration response in the slope changed markedly under high-intensity shaking, especially in the liquefied zone, which was the internal force that caused soil liquefaction. The acceleration of the liquefied zone indicated that the liquefied area first accelerated by the earthquake force, and after failure, it slid rapidly. The slope was unstable due to liquefaction and presented a liquefaction slipping phenomenon. Mud spraying and water pouring, such as sand liquefaction, appeared locally.
2) Dynamic pore water pressures build-up and fluctuation were the main causes of earthquake liquefaction slipping. As the input shaking intensity increased, the water level in the slope body increased because the permeability of the soil increased as vibration damage increased. The pore water pressure of local soil with high moisture content increased instantaneously, and the strength of the soil decreased. Under the action of continuous vibration, liquefaction occurred, and the liquefied soil was accelerated, resulting in the liquefaction slipping phenomenon.
3) The low-frequency band vibration played an important role in pore water pressure build-up and liquefaction slipping. The synchronous changes in the dynamic pore water pressure and soil pressure as well as the displacement response mainly occurred when the shaking components were in the low-frequency bands, especially below 1 Hz. This kind of resonance phenomenon occurring between the response acceleration and dynamic pore water pressure may have resulted from the change in the natural frequency of the slope after liquefaction. The vibration frequencies leading to large deformation and liquefaction of the slope soil were all below 1 Hz.
4) The mechanism of the Yongguang landslide failure was that the high-intensity earthquake vibration caused the structure of the slope soil to be damaged, and the increased permeability of the earthquake-damaged soil caused the groundwater level to rise, resulting in the liquefaction of the saturated soil. The liquefied soil slid along the long and narrow channels formed by the two sides of the mountain under the action of earthquake forces.
Data Availability Statement
The raw data supporting the conclusions of this article will be made available by the authors, without undue reservation.
Author Contributions
WL helped conceive the study and guided the writing of the thesis. WP helped conceive the study, performed the test analysis, and assisted with writing the manuscript. PX conceived the study, assisted with the shaking table data process and stability analysis, and assisted with writing the manuscript. XS and GH helped conceive the study, assisted with the model preparation and shaking tests, and wrote the manuscript. WH performed the stability analysis and field sampling and assisted with writing the manuscript. All authors contributed to the article and approved the submitted version.
Funding
Funding for this work was provided by the National Natural Science Foundation of China (No. U1939209), Science for Earthquake Resilience, China Earthquake Administration (XH20058Y) and Basic Scientific Research Fund, Science and Technology Innovation Base of Lanzhou, Institute of Earthquake Forecasting, China Earthquake Administration (2018IESLZ08).
Conflict of Interest
The authors declare that the research was conducted in the absence of any commercial or financial relationships that could be construed as a potential conflict of interest.
Publisher’s Note
All claims expressed in this article are solely those of the authors and do not necessarily represent those of their affiliated organizations, or those of the publisher, the editors and the reviewers. Any product that may be evaluated in this article, or claim that may be made by its manufacturer, is not guaranteed or endorsed by the publisher.
Acknowledgments
This research was supported by Gaofeng Che and Jinlian Ma (Key Laboratory of Loess Earthquake Engineering, CEA), and we are grateful for their help and valuable discussions on this work. Valuable English editing by AJE is appreciated. Discussions with Xiaosen Kang (ChangAn University), Ning MA (Southwest Jiaotong University), and Yanguo Zhou (Zhejiang University) greatly improved this manuscript. Two reviewers provided valuable comments, which helped us considerably improve this paper.
References
Assallay, A. M., Rogers, C. D. F., and Smalley, I. J. (1997). Formation and Collapse of Metastable Particle Packings and Open Structures in Loess Deposits. Eng. Geology. 48, 101–115. doi:10.1016/S0013-7952(97)81916-3
Bai, M. X., and Wang, Z. G. (1987). A Study Report of Low Angle Slip in the Loess Plateau of Ningxia (In Chinese) Earthquake Agency of Ningxia Hui Autonomous.
Buckingham, E. (1914). On Physically Similar Systems; Illustrations of the Use of Dimensional Equations. Phys. Rev. 4, 345–376. doi:10.1103/PhysRev.4.345
Carey, J. M., McSaveney, M. J., and Petley, D. N. (2017). Dynamic Liquefaction of Shear Zones in Intact Loess during Simulated Earthquake Loading. Landslides 14, 789–804. doi:10.1007/s10346-016-0746-y
Chai, S. F., Wang, P., and Guo, H. T. (2019). Model Material Similarity and Associated Evaluation for Soil Slopes in A Large-Scale Shaking Table Test (In Chinese). China Earthquake Eng. J. 41, 1308–1315. doi:10.3969/j.issn.1000-0844.2019.05.1308
Feng, X., Jiang, Q., Zhang, X., and Zhang, H. (2019). Shaking Table Model Test on the Dynamic Response of Anti-dip Rock Slope. Geotech Geol. Eng. 37, 1211–1221. doi:10.1007/s10706-018-0679-4
Fletcher, L. A. (2000). Contrasting Failure Behaviour of Two Large Landslides in Clay and Silt. Can. Geotech. J. 39, 46–62. doi:10.14288/1.0089531
Gao, J. L. (2021). Experimental Study on Liquefaction Slip Mechanism of Loess Low-Angle Slope:A Case Study of Shibeiyuan Landslide S (In Chinese). Master’s thesis (Xi’an (China): Northwest university).
Hwang, H., Wang, L. M., and Yuan, Z. H. (2000). Comparison of Liquefaction Potential of Loess in Lanzhou, China, and Memphis, USA. Soil Dyn. Earthquake Eng. 20 (5), 389–395. doi:10.1016/S0267-7261(00)00088-9
Ishihara, K., Okusa, S., Oyagi, N., and Ischuk, A. (1990). Liquefaction-Induced Flow Slide in the Collapsible Loess Deposit in Soviet Tajik. Soils and Foundations 30, 73–89. doi:10.3208/sandf1972.30.4_73
Jefferson, I. F., Evstatiev, D., Karastanev, D., Mavlyanova, N. G., and Smalley, I. J. (2003). Engineering Geology of Loess and Loess-like Deposits: a Commentary on the Russian Literature. Eng. Geology. 68 (3/4), 333–351. doi:10.1016/S0013-7952(02)00236-3
Lin, M.-L., and Wang, K.-L. (2006). Seismic Slope Behavior in A Large-Scale Shaking Table Model Test. Eng. Geology. 86, 118–133. doi:10.1016/j.enggeo.2006.02.011
Liu, K. (2020). Earthquake-Induced Failure Mechanism and Stability Evaluation of Loess Slope under Rainfall Effects (In Chinese). dissertation’s thesis (Lanzhou (China): Lanzhou university).
Ma, N., Wu, H., Ma, H., Wu, X., and Wang, G. (2019). Examining Dynamic Soil Pressures and the Effectiveness of Different Pile Structures inside Reinforced Slopes Using Shaking Table Tests. Soil Dyn. Earthquake Eng. 116, 293–303. doi:10.1016/j.soildyn.2018.10.005
Major, J. J., and Iverson, R. M. (1999). Debris-flow Deposition: Effects of Pore-Fluid Pressure and Friction Concentrated at Flow Margins. Geol. Soc. Am. Bull. 111 (10), 1424–1434. doi:10.1130/0016-7606(1999)111<1424:dfdeop>2.3.co;2
Prakash, S., and Puri, V. K. (1982). Liquefaction of Loessial Soils. Seattle, Wash: Anon Proc of Third International Conference on Seismic Microzonation, 1101–1107.
Sassa, K., Wang, G., Fukuoka, H., and Vankov, D. A. (2005). Shear-Displacement-Amplitude Dependent Pore-Pressure Generation in Undrained Cyclic Loading Ring Shear Tests: an Energy Approach. J. Geotech. Geoenviron. Eng. 131131, 7506–7761. doi:10.1061/(ASCE)1090-024110.1061/(asce)1090-0241(2005)131:6(750)
Su, Z. Z., Yuan, Z. M., and Zhao, J. Q. (2003). A Review on Studies Concerned with the 1303 Hongtong, Shanxi, Earthquake of M8 (In Chinese). Earthquake Res. Shanxi (3), 4–9. doi:10.3969/j.issn.1000-6265.2003.03.009
Wang, F. W., Sassa, K., and Wang, G. (2002). Mechanism of a Long-Runout Landslide Triggered by the August 1998 Heavy Rainfall in Fukushima Prefecture, Japan. Eng. Geology. 63, 169–185. doi:10.1016/S0013-7952(01)00080-1
Wang, G. H., Sassa, K., Fukuoka, H., and Wang, F. W. (1998). “Study on the Excess Pore Pressure Generation in Laboratory-Induced-Landslides,” in Proceedings of 8th Congress of IAEG. Editors D. P. Moore, and O. Hungr (Rotterdam: Balkema), 4237–4244. Vancouver.6
Wang, G., and Sassa, K. (2001). Factors Affecting Rainfall-Induced Flowslides in Laboratory Flume Tests. Géotechnique 51 (7), 587–599. doi:10.1680/geot.51.7.587.51386
Wang, G., Sassa, K., Fukuoka, H., and Tada, T. (2007). Experimental Study on the Shearing Behavior of Saturated Silty Soils Based on Ring-Shear Tests. J. Geotech. Geoenviron. Eng. 133, 319–333. doi:10.1061/(asce)1090-0241(2007)133:3(319)
Wang, G., and Sassa, K. (2003). Pore-pressure Generation and Movement of Rainfall-Induced Landslides: Effects of Grain Size and fine-particle Content. Eng. Geology. 69, 109–125. doi:10.1016/S0013-7952(02)00268-5
Wang, G., Zhang, D., Furuya, G., and Yang, J. (2014). Pore-Pressure Generation and Fluidization in A Loess Landslide Triggered by the 1920 Haiyuan Earthquake, China: A Case Study. Eng. Geology. 174, 36–45. doi:10.1016/j.enggeo.2014.03.006
Wang, L. M., Liu, H. M., Li, L., and Sun, C. S. (2000). Laboratory Study on the Mechanism and Beheviors of Saturated Loess Liquefaction (In Chinese). China J. Geotechnical Eng. 22 (1), 89–94. doi:10.3321/j.issn.1000-4548.2000.01.016
Wang, L. M., and Wu, Z. J. (2013). Earthquake Damage Characteristics of the Minxian–Zhangxian Ms6.6 Earthquake and its Lessons (In Chinese). China Earthquake. Eng. J. 35 (3), 401–412. doi:10.3969/j.issn.1000-0844.2013.03.0401
Wang, L. M. (2020). Mechanism and Risk Evaluation of Sliding Flow Triggered by Liquefaction of Loess Deposit during Earthquakes (In Chinese). Chin. J. Geotechn. Eng. 42, 1–19. doi:10.11779/CJGE202001001
Wang, Q., Wang, L. M., Wang, J., Zhong, X. M., and Chai, S. F. (2014). “Research Progress of the Loess Seismic Liquefaction (In Chinese),” in , 34, 898–903.Earthquake Eng. Eng. Dyn.. doi:10.13197/j.eeev.2014.S0.898.wangq.141
Wang, Q., Wang, L. M., Yuan, Z. X., Wang, P., and Ding, F. M. (2012). A Study of Loess Liquefaction Induced by the Wenchuan Ms8.0 Earthquake in Tianchuan, Qingshui County, Gansu Province (In Chinese). Hydrogeology Eng. Geology. 37, 63–67. doi:10.16030/j.cnki.issn.1000-3665.2012.02.019
Wang, Q., Wang, Z., Su, Y., Wang, L., Ma, H., et al. (2021). Characteristics and mechanism of the landslide in Yongguang village, Minxian County, China. Nat. Hazards 105, 1413–1438. doi:10.1007/s11069-020-04360-7
Wu, Z. J., Sun, J. J., Chen, Y. J., Wang, Q., and Zhao, W. C. (2015). Analysis of Disaster-Causing Mechanism of Loess Landslides Induced by the Minxian-Zhangxian MS6.6 Earthquake, China. Jpn. Geotechnical Soc. Spec. Publ. 1 (7), 40–45. doi:10.3208/jgssp.cpn-21
Xu, C., Xu, X. W., and Zheng, W. J. (2013). Compiling Inventory of Landslides Triggered by Minxian-Zhangxian Earthquake of July 22,2013 and Their Spatial Distribution Analysis. (In Chinese). J. Eng. Geology. 2013 (05), 736–749. doi:10.1016/j.jseaes.2014.06.014
Xu, S. H., Wu, Z. J., Su, J. J., Yan, W. J., Su, H. J., and Su, Y. Q. (2013). Study of the Characteristics and Inducing Mechanism of Typical Earthquake Landslides of the Minxian-Zhangxian Ms6.6 Earthquake (In Chinese). China Earthquake Eng. J. 35, 471–476. doi:10.3969/j.issn.1000-0844.2013.03.0471
Zhang, D., Takeuchi, A., and Sassa, K. (1995). The Motion Characteristics of Loess Landslides Induced by the Haiyuan Earthquake in the Ningxua Province, China. Landslides 32, 12–17. doi:10.3313/jls1964.32.1_12
Zhang, D. X., and Sassa, K. (1996). A Study of the Mechanism of Loess Landslides Induced by Earthquakes (In Japanese). J. Jpn. Soc. Erosion Control. Eng. 49, 4–13. doi:10.11475/sabo1973.49.2_4
Zhang, F., Wang, G., Kamai, T., Chen, W., Zhang, D., and Yang, J. (2013). Undrained Shear Behavior of Loess Saturated with Different Concentrations of Sodium Chloride Solution. Eng. Geology. 155, 69–79. doi:10.1016/j.enggeo.2012.12.018
Zhang, X. C., Huang, R. Q., Xu, M., Pei, X. J., Han, X. S., Song, L. J., et al. (2014). Loess Liquefaction Characteristic and its Influential Factors of Shibeiyuan Landslide (In Chinese). Rock Soil Mech., 801–810. doi:10.16285/j.rsm.2014.03.013
Zhang, Z. L., Wu, S. R., Wang, T., Tang, H., M., and Liangs, C. Y. (2018). Influence of Seismic Wave Amplitude on Dynamic Response of Loess-Mudstone Slope. (In Chinese). Rock Soil Mech. 39 (7), 2335–2349. doi:10.16285/j.rsm.2016.2335
Zhang, Z., and Wang, L. (1995). Geological Disasters in Loess Areas during the 1920 Haiyuan Earthquake, China. GeoJournal 36, 269–274. doi:10.1007/BF00813183
Zhao, J. Q., Zhang, D. W., and Gao, S. Y. (2003). Huanbu Ground Slide, the Relic of 1303 Hongtong, Shanxi, Earthquake of M8(in Chinese). Earthquake Res. Shanxi (3), 16–23. doi:10.3969/j.issn.1000-6265.2003.03.011
Keywords: shaking table test, bottom-saturated loess slope, dynamic acceleration response, dynamic pore water pressure, liquefaction sliding, failure mechanism
Citation: Chai S, Wang L, Wang P, Pu X, Xu S, Guo H and Wang H (2022) Failure Mechanism and Dynamic Response Characteristics of Loess Slopes Under the Effects of Earthquake and Groundwater. Front. Earth Sci. 10:814740. doi: 10.3389/feart.2022.814740
Received: 14 November 2021; Accepted: 28 March 2022;
Published: 21 April 2022.
Edited by:
Fanyu Zhang, Lanzhou University, ChinaReviewed by:
Baydaa Maula, Middle Technical University, IraqAilan Che, Shanghai Jiao Tong University, China
Copyright © 2022 Chai, Wang, Wang, Pu, Xu, Guo and Wang. This is an open-access article distributed under the terms of the Creative Commons Attribution License (CC BY). The use, distribution or reproduction in other forums is permitted, provided the original author(s) and the copyright owner(s) are credited and that the original publication in this journal is cited, in accordance with accepted academic practice. No use, distribution or reproduction is permitted which does not comply with these terms.
*Correspondence: Lanmin Wang, d2FuZ2xtQGdzZHpqLmdvdi5jbg==; Ping Wang, bGFuemhvdXdhbmdfcEAxMjYuY29t
 Shaofeng Chai
 Lanmin Wang2,3*
 Ping Wang
 Shiyang Xu
