- 1Department of Mathematical Sciences, Tsinghua University, Beijing, China
- 2Key Laboratory of Computational Geodynamics, College of Earth and Planetary Sciences, University of Chinese Academy of Sciences, Beijing, China
Continental collision zones are widely distributed across the earth’s surface with diverse types of tectonic processes. Even the same collision zone shows significant lateral tectonic variations along its strike. In this study, we systematically investigated how plate velocity slowdown after the closure of the ocean influences the continental collision evolution, as well as the effects of kinematic characteristics and continental rheology on varying the continental collision modes in a plate velocity slowdown model. From the comparison between the constant plate velocity system (CVS) and the plate velocity-dropping system (VDS), we can conclude the following: Plate velocity dropping promotes the extension inside the slab by decreasing the movement of the surface plate, whereas slab pull increases as subduction continues. The timing of the subducting slab break-off and the polarity alteration was initiated earlier in the plate velocity drop models than in the constant plate velocity models, and fast convergence may have triggered multiple episodes of slab break-off and caused strong deformation adjacent to the collision zone. Parametric tests of the initial subducting angle, plate convergence velocity, and continental crustal rheological strength in VDS indicated the following: (1) Three end members of the continental lithospheric mantle deformation modes were identified from the VDS; (2) models with a low subducting angle, fast continental convergence velocity, and medium-strength overriding crust were more likely to evolve into a polarity reversed mode, whereas steep-subducting-angle, slow-plate-velocity, weak-overriding-crust models tended toward a two-sided mode; (3) a strong overriding continent is more liable to develop a stable mode; and (4) overriding crustal rheological strength plays a significant role in controlling changes in continental collision modes.
Introduction
Continental collision is an important process for regional tectonic evolution. It is widely distributed across the earth, ranging from the Mediterranean Sea to southwestern China (Figure 1A) (Li et al., 2011; Handy et al., 2010, 2015; Roda et al., 2010, 2012), significantly affecting the climate, resource reallocation, surface topography construction process, and deep mantle spatial–temporal evolution (Wang et al., 2014; Li et al., 2015). Complex discrepant tectonic evolution exists among different continental convergence zones (Negredo et al., 2007; Chertova et al., 2014; Spakman et al., 2018), and even the same collision zone also shows evident lateral variations of tectonic characters along its strike direction (Chen et al., 2015; Liang et al., 2016); in particular, along the Himalaya orogen, tomographic images have recognized distinct east–west inhomogeneous subducting angles and horizontal slip distances (Figures 1B,C) there. For example, Nabelek et al. (2009) used the receiver function method to construct an image of the crust and upper mantle beneath the Himalayas and the southern Tibetan Plateau; they argued that the Indian mantle lithosphere has not extended significantly beyond 31°N. Mechie et al. (2011a, 2011b, 2012) also adopted receiver function method to identify Moho characters across Tibet Plateau and recognized that Indian lithospheric mantle extends northwards until about the Banggong-Nujiang suture, where it steeply sinks to 350–400 km depth. Based on seismic anisotropy characters, Chen et al. (2015) suggested that the geometry of Indian lithosphere underthrusting beneath South Tibet is characterized by lateral variations. Kufner et al. (2021) presented finite-frequency tomography in Hindu Kush; they interpreted their high-velocity anomalies as crustal subduction on top of a northwards-subducting Indian lithosphere, and its penetration depth increases along-strike while thinning and steepening. By contrast, Alpine orogen exhibits several distinct lithospheric mantle deformation features (Kissling et al., 2006; Roda et al., 2010, 2012; Handy et al., 2015; Zhao et al., 2015); e.g., under the central and eastern Alps, subductions operate in an opposite polarity (Figure 1D, profile CC′), while in the western Alps, the overriding Adriatic lithospheric mantle seemed to delaminate and was dragged down by the subducting European lithosphere (Figure 1E, profile DD’).
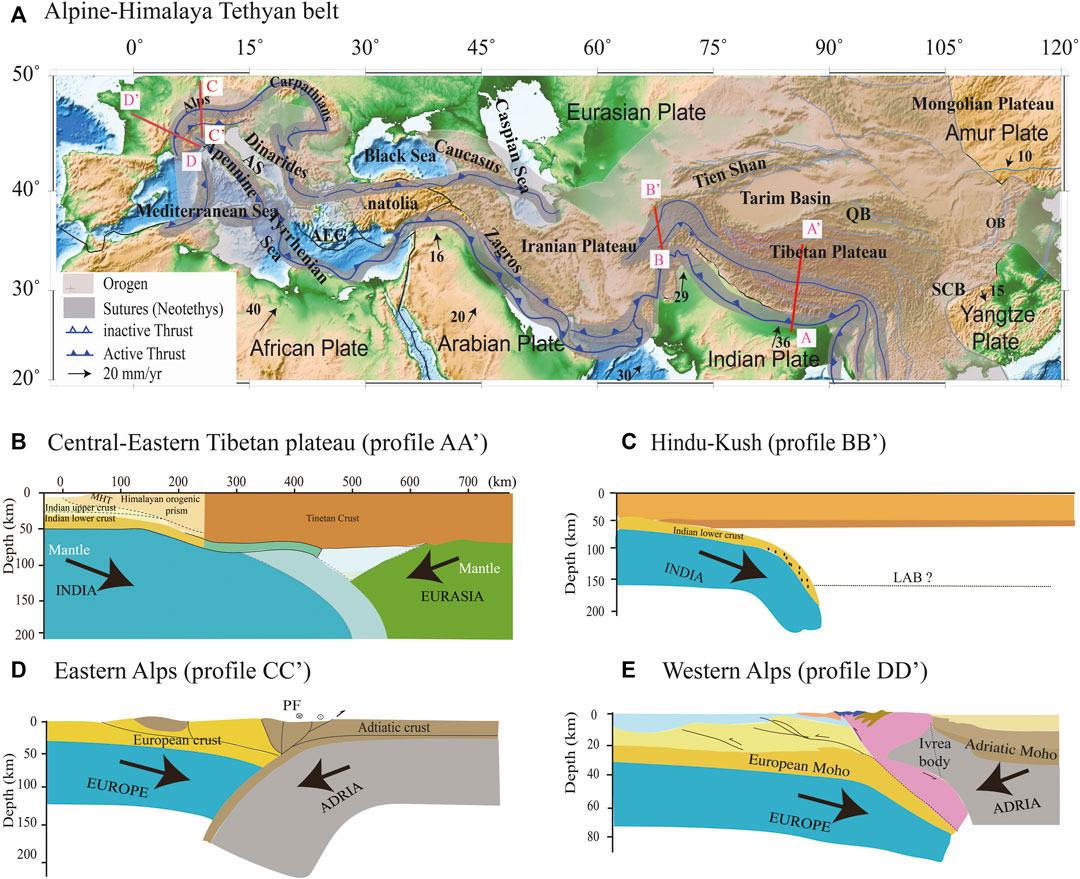
FIGURE 1. (A) The Alpine–Himalayan Tethyan belt and main tectonic units along the collisional orogens. White and black lines outline the orogens and plate convergence boundary, respectively. Gray shadows mark the continental sutures since Cenozoic. Dark sawtooth blue lines show the main thrust belts, and light blue lines delineate the first-order block boundaries around Tibet. Black arrows refer to the plate convergence direction with numbers denoting plate velocity. AS: Adria Sea, AEG: Aegean Sea, QB: Qaidam Basin, SCB: Sichuan Basin, OB: Ordos Basins (Bird, 2003; Li et al., 2011; Saein and Afzal 2017). A simplified schematic diagram of the lithospheric structure of the collisional orogens is shown across (B) central-eastern Tibetan Plateau (AA′) (Owens and Zandt, 1997; Tilmann and Ni, 2003; Nabelek et al., 2009; Mechie et al., 2012; Mechie and Kind, 2013; Ye et al., 2015; Huangfu et al., 2018), (C) Hindu Kush (BB′) (Liang et al., 2020; Kufner et al., 2021), (D) eastern Alps (CC′) (Lippitsch et al., 2003; Kissling et al., 2006; Handy et al., 2015), and (E) Austroalpine of the western Alps (DD′) (Lippitsch et al., 2003; Kissling et al., 2006; Handy et al., 2010; Roda et al., 2010, 2012; Zhao et al., 2015).
In recent years, a number of numerical simulations have been conducted to investigate the essential process and controlling parameters of different continental convergence processes, and prominent progress has been achieved in our understanding of these dynamic processes. Although previous studies have recognized kinematic characters (like subducting angle and plate velocity) and plate rheology can highly influence the fate of plates when they do meet each other, further efforts are still needed to better understand the geodynamic controls and styles of post-subduction collisional orogenic processes (Faccenda et al., 2008). According to the differential dynamic processes controlled by different plate kinematic characters and lithospheric deformation among the various continental convergent boundaries, conceptual models that account for the behavior of continental lithospheric mantle, proposed thus far, can be summarized as follows: (1) pure shear thickening, (2) folding and buckling, (3) one-sided underthrusting or subduction (steep/flat), (4) two-sided/ablative plate consumption, and (5) subducting slab break-off (Pysklywec, 2001; Li et al., 2011; Li, 2014; Yang et al., 2019; Chen, 2021). Pysklywec et al. (2000) suggested that according to their modeling results, continental convergence is such a complicated process that it needs to be illustrated through a combination of several modes, rather than using a single model. Little work, however, has focused on such a combined effect.
Slowdown of plate motion after continental collision, following the oceanic subduction, is a common process that has already been recognized by previous geological and geophysical measurements. For example, plate reconstruction has shown that the convergence velocity between India and Asia experienced a dramatic decrease from ∼18 to ∼3.5 cm/year (Patriat and Achache, 1984; Wang et al., 2001, 2014; Copley et al., 2010) at 50–35 Ma, started from the initial contact of margins between Indian and Asian continents, and continued as the Himalayan orogeny developed and the Tibetan Plateau uplifted (Guillot et al., 2003; Copley et al., 2010). Although numerous numerical simulations have been conducted to study the evolution of continental collision, most of them have adopted a constant plate velocity through the plate convergence process (oceanic subduction and continental collision) for simplification (Burg and Gerya, 2005; Warren et al., 2008; Yamato et al., 2008; Duretz et al., 2012; Liao and Gerya, 2017), and little attention has been given to the influence of plate velocity slowdown (Faccenda et al., 2008; Li et al., 2013; Capitanio et al., 2015).
In this study, we conducted a series of two-dimensional (2D) numerical experiments that integrated both oceanic subduction and the following continental convergence process to systematically investigate differences between a constant velocity system (CVS; a constant plate velocity is incorporated through oceanic subduction and continental convergence) and a velocity-dropping system (VDS; plate velocity decreases after continental collision), as well as the influences of various kinematic characters (e.g., convergence velocity and subducting angle) and continental crustal rheological strength on diverse continental convergence styles in VDS, by following the evolutionary trajectory of plates, analyzing the results of different model series, exploring the potential relationships, or even transitions, among the various continental collision modes to better understand the evolution of continental convergence, and, finally, applying it to explain dynamic processes of related natural cases. This study shed new light on the study of continental collision differentiation.
Materials and Methods
Governing Equation
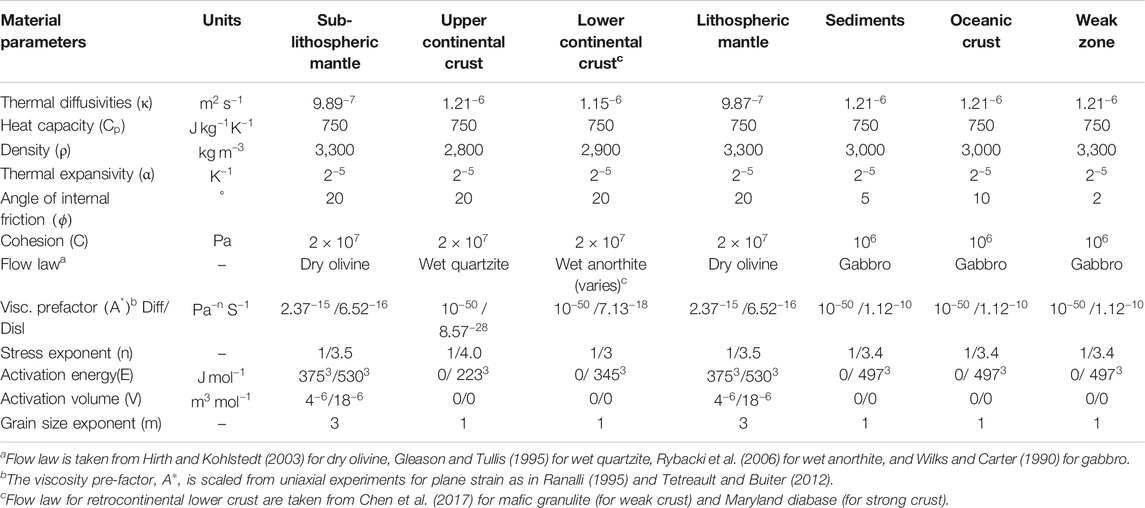
We conducted numerical experiments with a 2D finite element code [Advanced Solver for Problems in Earth’s ConvecTion (ASPECT); Kronbichler et al., 2012]. ASPECT is an extensible code of the C++ program library deal.ii (Differential Equations Analysis Library, https://www.dealii.org/) targeted at the computational solution of partial differential equations using adaptive finite elements (Arndt et al., 2021). It solves regional thermal convection problems and incorporates the use of complex boundary conditions, large variations in rheological parameters, and localized mesh refinement. The viscous-plastic rheology used in this study satisfied the equations of the conservation of mass (Eq. 1), momentum (Eq. 2), and internal energy (Eq. 3) for an incompressible medium and adopted the Boussinesq approximation.
The right-hand-side terms of Eq. 3 correspond to internal heat production, for example, due to radioactive decay, friction heating, and adiabatic compression of material.
where
Eq. 5 is used to describe the evolution of a set of variables
Rheology
Like other geodynamics codes, ASPECT assumes that the solid Earth materials can be treated as a highly viscous fluid, its deformation is predominantly defined by brittle fracture or viscous creep; thus, we apply three basic rheological characters: plastic yielding, diffusion creep, and dislocation creep. Diffusion and dislocation creep can be conveniently formulated with Eq. 6 (Karato and Wu, 1993; Karato, 2008).
Where the effective deviatoric strain rate is defined as
We implemented composite viscosity combining diffusion creep (
The effective viscosity in the viscous stress is defined for the power law creep based on the temperature and the strain rate tensor (Glerum et al., 2018; Karato, 2008). The plastic yielding is defined by the Drucker–Prager criterion Eq. 8 (Davis and Selvadurai, 2002):
When the viscous stress 2
After giving the maximum (
where i is one of the subscripts among diff, disl, comp, and yield.
Initial Model Configuration and Boundary Conditions
The model is 2,000 km long and 660 km deep in the x- and z-directions, respectively. The resolution of finite element mesh consists of three parts, in the upper 2,000 km
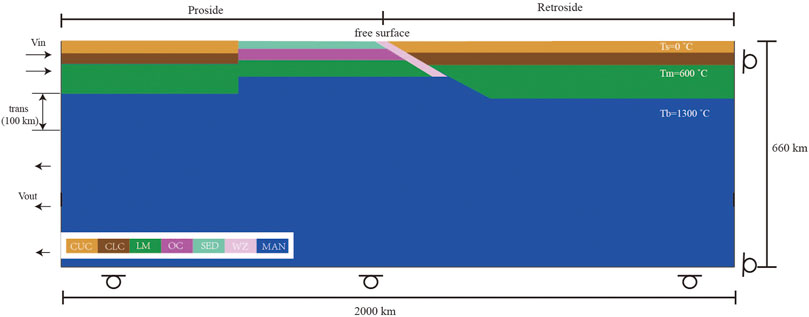
FIGURE 2. Configuration of the reference model. The size of the numerical box is 2000 × 660 km, and an oceanic plate is integrated with a continental plate on the proside (left). The retroside (right) is an overriding continental plate. Various colors reflect to different lithologies, CUC: continental upper crust, CLC: continental lower crust, LM: lithospheric mantle, OC: oceanic crust, SED: sediment, WZ: weak zone, and MAN: sub-lithospheric mantle. Ts is surface temperature, Tmn is the Moho temperature of normal continent, Tmc stands for the Moho temperature of continental Craton, Tb is the bottom temperature of lithosphere. Vin and Vout denote where material flow in and out, and Vtrans denotes the transition zone from flow in to flow out.
The initial surface temperature is 0°C, the initial Moho temperature of the oceanic lithosphere and retrocontinent is 600°C, while it is 400°C for the procontinent. The initial Lithosphere–Asthenosphere Boundary (LAB) temperature is defined as 1,300°C, below which an adiabatic thermal gradient of 0.5°C/km is assumed. Both side walls are thermal insulated boundaries.
The initial temperature structure of continental lithosphere follows a steady-state geotherm from Chapman (1986) that considers the thickness of each compositional layer, shown as Eqs. (11), (12), and (13). The initial oceanic lithospheric temperature distribution follows the plate cooling model (Turcotte and Schubert, 2002).
Where TZ denotes the temperature of the depth Z, TT is the top surface temperature of each layer, TB denotes the bottom temperature of each layer, and the heat flows at the top and bottom of each layer are denoted as qT and qB, respectively.
Mechanical boundary conditions are free slip at both the retroside and bottom boundaries; the top boundary used a true free-surface condition to account for topography evolution. Inflow velocity at the procontinental lithosphere wall, it is the approximation of an integration of three major forces in nature, i.e., slab pull, ridge push, and convection drag, and equivalently balanced outflow velocity on the same sidewall across the sub-lithospheric mantle. Besides, there is a velocity transition zone between flow-in and flow-out zones (thickness of 100 km) (Figure 2).
Results
Comparison of CVS and VDS
Previous studies have indicated that the force equilibrium state and thermal structure of plate, and lithospheric deformation styles during subduction, are related to the convergence velocity (Li et al., 2002). It has also been recognized that dramatic plate velocity slowdown after continental collision following oceanic subduction is a general phenomenon, but little work has been done using numerical modeling to systematically investigate how such a convergence velocity drop influences the spatial–temporal evolution of crustal-lithospheric deformation during continental collision. Thus, we started with the comparison of CVS and VDS.
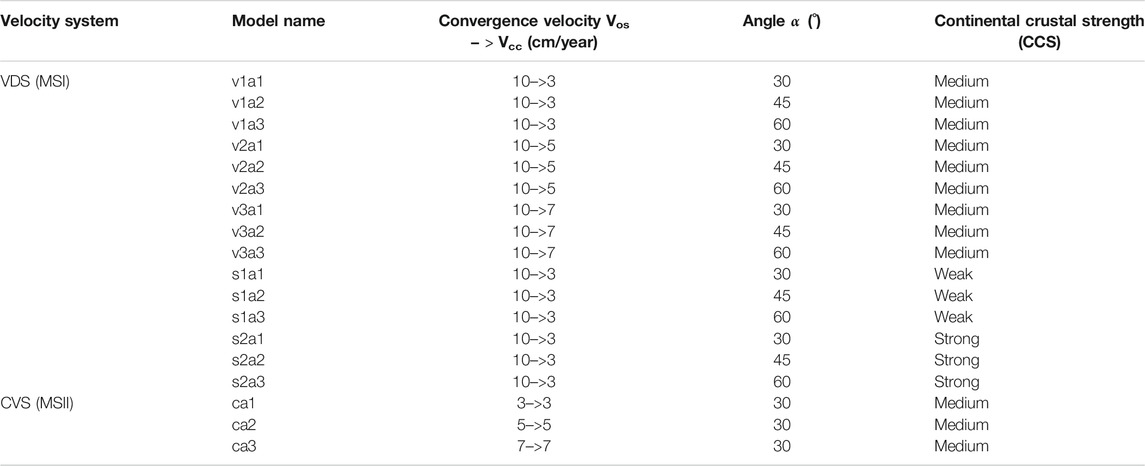
First, we constructed two series of numerical models using (1) MSII-ca1, -ca2, and -ca3 and (2) MSI-v1a1, -v2a1, and -v3a1 that belong to CVS and VDS, respectively (Table 3). All models shared the same initial subducting angle (
Take MSII-ca1 as an example (Figure 3). In this model, we push from the proside with a constant velocity. This velocity during oceanic subduction is equal to that in the continental convergence phase, and both are constant (Vos = Vcc = 3 cm/year) (Figure 3E). During the initial stage of oceanic subduction, relatively dense oceanic plate subducted along a prescribed slope weak zone, and little sediment and oceanic crust was scraped off and rested in site (Figure 3A1). Excess negative buoyancy is attributed to the prior oceanic plate subduction and then dragged the trailing continental plate downward though it is buoyant, accompanied by the steepening of subducting angle. Note that, as procontinent arrived at trench, collision started, characterized by a notable upbending of the leading edge of retrocontinent. Besides, slow pushing led to a slow proplate motion, which resulted in relatively strong coupling between plates, as a portion of the retrocontinental lithospheric mantle was dragged down and sank together with the subducting slab (Figure 3A2). At the early stage of continental collision, combined effects from continuous pushing from the proside trailing edge and slab downward dragging maintained the downward movement of the continental lithospheric mantle. However, as more buoyant continental crust resisted sinking, it accumulated at shallow. Later, pushing from prescribed velocity competed with the crust’s buoyance. The process gave rise to strain localization (Figure 3C3), especially in the proside ocean-continent transition zone, and then generated a rupture there, along which temperature abnormally increased (Figure 3A3). In addition, we can recognize significant uplift of both plates adjacent to the collision zone, especially the retroside that formed a narrow and almost stationary orogen (Figure 3F).
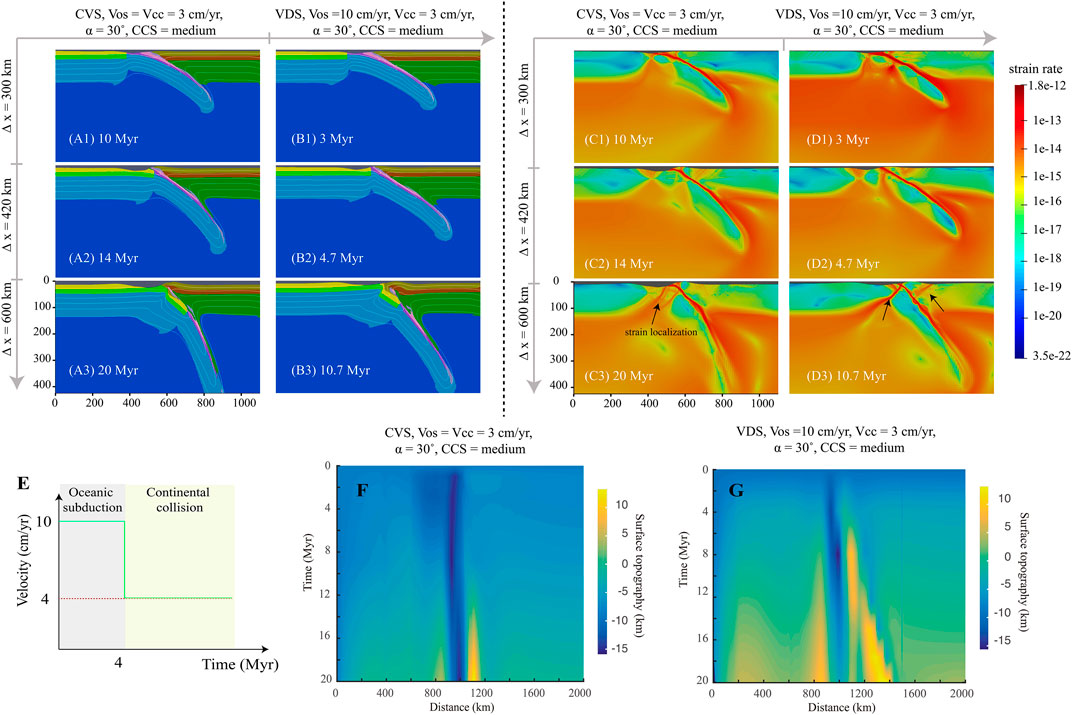
FIGURE 3. The upper left panel shows the snapshots of compositional fields from models MSII-ca1 (CVS) (A1–A3) and MSI-v1a1 (VDS) (B1–B3), respectively. Different colors denote different lithologies (see Figure 2). White lines denote isotherm with 200°C increment that start from 200°C to 1,200°C. The upper right panel shows the snapshots of strain rate from models MSII-ca1 (C1–C3) and MSI-v1a1 (D1–D3). ∆x is the amount of convergence. (E) shows the velocity boundary conditions of CVS (red dotted line) and VDS (green dotted line). (F) and (G) show the topography evolution of both models.
MSI-v1a1 from VDS, on the other hand, was applied with a 10 cm/year plate velocity during oceanic subduction (Vos = 10 cm/year) for ∼4 Myr, followed by a much slower continental convergence (Vcc = 3 cm/year). Though a higher Vos was applied to MSI-v1a1 than to MSII-ca1, the main process of oceanic subduction proceeded in a similar way except for two differences: (1) Little material from the retrocontinental lithospheric mantle was dragged down by the slab due to plates’ relative weaker coupling resulting from fast subduction (Figure 3B1). (2) The subducting angle was slightly gentle (Figures 3A2,3B2). After the continents’ initial contact, convergence velocity decreased to 3 cm/year. Similar to the process in MSI-ca1, accumulation of buoyant continental crust at the plate interface occurred, and local crustal rupture developed in the proplate through which an anomalous temperature increasing occurred (Figure 3B3). At shallow depth, dramatic strain localization developed in the proside ocean-continent transition zone (Figure 3D3). Besides, under the increased pulling from the slab in depth, the subducting angle gradually steepened (Figures 3D2,3D3). It is worth noting that the subducting angle in model MSI-ca1 is much steeper than the one in MSI-v1a1. We supposed that, as the prior oceanic subduction was prescribed a higher plate convergence velocity in the latter model, during the early stage of continental collision, plates were still weakly coupled. The subducting plate could keep cold and maintain its strength, which facilitated the lithosphere sinking integrally with a nearly steady dipping angle. At the same time, prior fast plate convergence velocity could cause tense compression in the collision zone and result in severe deformation at the front edge of the retrocontinent. A new shear zone at shallow was then formed retroside (Figures 3D2,3D3). Finally, compared with the nearly fixed narrow orogen in the MSII-ca1, orogen in MSI-v1a1 showed a prominent retroward advance, and eventually developed into a relatively wider orogen (Figures 3F,G).
To further investigate the effects of plate velocity on the continental collision pattern in both systems, we varied the continental convergence velocity (Vcc) (Table 3). As is shown in Figure 4: (1) Increasing Vcc could get a relatively gentle subducting angle in both series of models (Figures 4A,B). (2) All models tended to generate plate polarity reversal, while the time of slab break-off and polarity alteration was initiated earlier in the VDS than in the CVS (Figure 4C). In addition, fast Vcc always causes severe deformation of both plates adjacent to the collision zone.
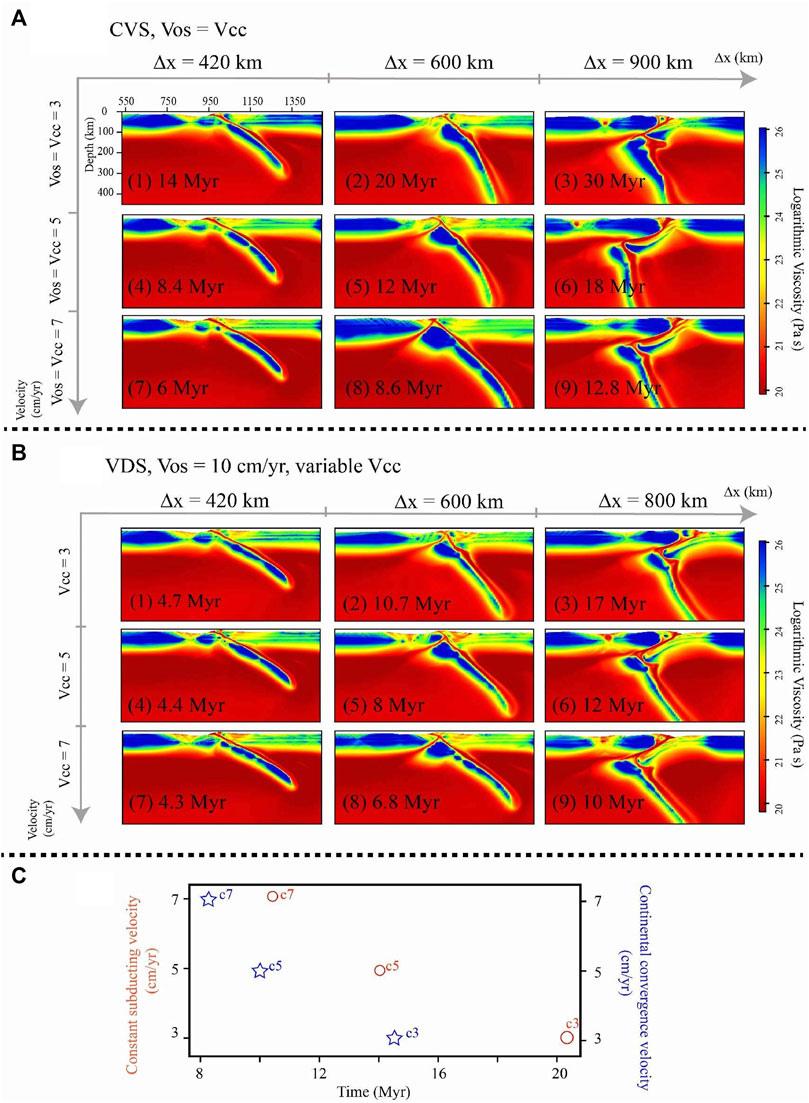
FIGURE 4. (A) shows the viscosity field of models with variable plate velocity in CVS (Vos = Vcc), (1)–(3) are the snapshots of model with a 3 cm/year constant plate velocity, and (4)–(9) correspond to the snapshots of models with 5 cm/year and 7 cm/year constant plate velocity, respectively. (B) shows the viscosity field of models with variable plate velocity in VDS (Vos > Vcc), (1)–(3) show the snapshots of model with a 3 cm/year continental convergence velocity (Vcc), and (4)–(9) correspond to the snapshots of the model with 5 cm/year and 7 cm/year continental convergence velocity, respectively. Δx is the amount of convergence. (C) The start time of slab break-off. Red notes and circles denote the results of CVS; blue notes and stars denote the VDS results.
Controlling Parameters of Altering the Continental Collision Mode in VDS
According to the foregoing numerical experiment results, VDS showed conspicuous differences from the normally used CVS. By varying the continental convergence velocity, the dip angle of the initial weak zone, and retrocontinental crustal rheological strength, we then examined how these parameters influence the spatial−temporal evolution of the continental collision process in VDS. Three end members of the continental collision mode can be obtained according to the model results from parametric sensitive tests: (1) polarity reversed mode, (2) oceanic-type stable mode, and (3) two-sided/ablative mode
The polarity reversed continental collision mode is not a new concept model. Numerous geological and geophysical records have recognized this type of collision mode and referred to these collisions between volcanic arcs and ocean−continent subduction zones or those with subducting ridges (Clift et al., 2003; Brown et al., 2011; Handy et al., 2015; von Hagke et al., 2016). Take the model MSI-v1a1 as an example (Figure 5). The whole evolution process includes oceanic subduction (OS) and continental collision (CC). Considering the negative buoyance of cool oceanic plate, fast plate convergence velocity (10 cm/year) was prescribed during the whole OS. At the early stage, little sediment and crust material was scraped off from the lower plate because of weak coupling between plates under fast plate convergence. The scraped-off material then rested in site, accumulated, and accreted to the adjoining retroplate. Meanwhile, distinct subsidence occurred as slab bended and promoted to the formation of a foreland basin (Figure 5A). When the ocean closed (during CC), the prescribed plate convergence velocity slowed down (3 cm/year). Continuous compression, along with the accumulation of scraped-off material at shallow, uplifted the collision zone rapidly, producing a narrow orogen, underneath which the slab dipping angle gradually steepened (Figures 5B,C). The model results also showed that a small portion of the retrocontinental lithospheric mantle was dragged down by the slab as plates’ strong coupling under slow convergence (Figure 5C). As continental convergence continued, on the retroside around orogen, a slight subsidence happened at almost the symmetric place to the proside foreland basin with respect to the axis of orogenic belt. On the proside, foreland basin broadened slightly, with its proside flank slightly uplifted. It is worth noting that temperature increased abnormally at the retroplate leading edge (Figure 5C). The reasons for this may come from two aspects: (1) The compression from continental collision resulted in crustal thickening (Figure 5D), which may increase the radioactive heat from the continental crust. (2) A portion of hot retrocontinental lithospheric material moved upward along the plates’ interface (Figure 5D). Following that, procontinental crust ruptured, leaving the surface crust indented to the orogenic wedge and causing the wedge to grow retroward along the reversed shear zone on the retroplate (Figure 5E). Eventually, the procontinent plate obducted onto the retroplate. The retrocontinent then delaminated, accompanied by parts of the lower crust and lithospheric mantle underthrusted beneath the procontinent, leaving a gentle uplift and widening of the foreland basin on the proside. Meanwhile, a new narrow retroside subsidence generated behind orogenic wedge (Figure 5F). To conclude, from OS to the early stage of CC, topography building up was relatively concentrated on the collision zone, followed by a broad surface uplift and a retroward movement of the orogenic wedge.
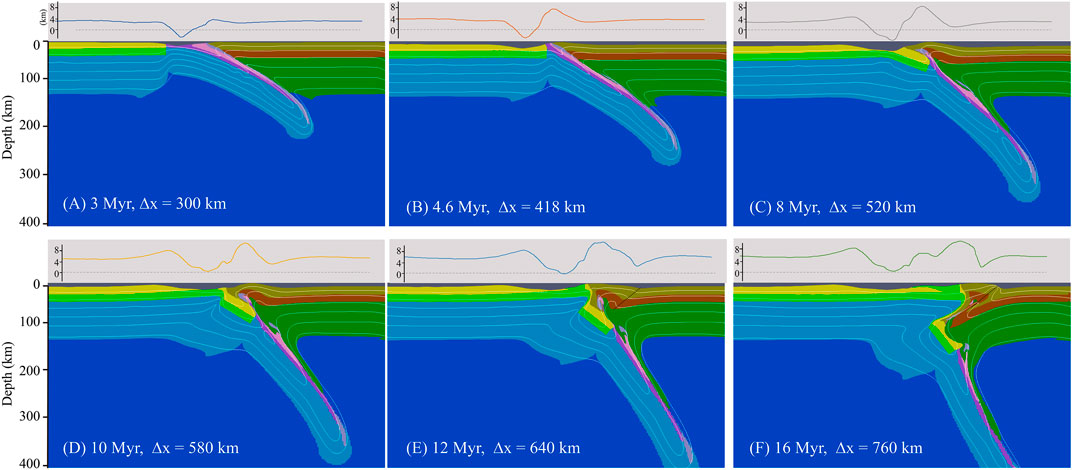
FIGURE 5. Evolution of polarity reversed mode. Panels above each snapshot with gray shading show the corresponding topography. Δx is the amount of convergence. Different colors in (A–F) denote different lithologies (same as Figure 2).
The most common mode is the stable continental collision mode, which has been confirmed by geological and geophysical observations as well as numerical models (Chemenda et al., 2000; Yin and Harrison, 2000; Li et al., 2011; Huangfu et al., 2018). It has a one-sided asymmetric type with a stable plate polarity and can be further divided into flat and steep subtypes.
The model MSI-s2a3 was an example of a steep subtype (Figure 6). The general process of OS in this model was similar to that in model MSI-v1a1 (Figure 5), while much more sediment and oceanic crust were scraped off (Figure 6A). During CC, a relative slow continental convergence velocity of 3 cm/year compared to the OS was prescribed. Initially, accumulated oceanic crust at shallow detached from its deeper part. After that, temperature abnormally increased along the gap. The accumulation then contributed to the growth of the orogen wedge and the notable uplift (Figure 6B). As the procontinental lithosphere arrived at the collision zone, the subducting angle gradually steepened, accompanied by a slight slab roll-over. At ∼8 Myr, a second proside crustal rupture happened at the place where slab necking occurred. During this period, both the proside and the retroside around the collision zone experienced uplift (Figures 6C,D). Meanwhile, the break-off procontinental crust moved downward, persisted at approximately 130–180 km because of its intrinsic buoyancy, and partly intruded into the bottom of the adjacent retrocontinental lithosphere. Contemporary decoupling between the procontinental upper and lower crust occurred, leaving the upper crust stacked at the surface, while the lower crust started to sink with the lithospheric mantle. The retrocontinental leading end near the surface was warped slightly upward, followed by a proward advance of the orogeny wedge (Figures 6E,F).
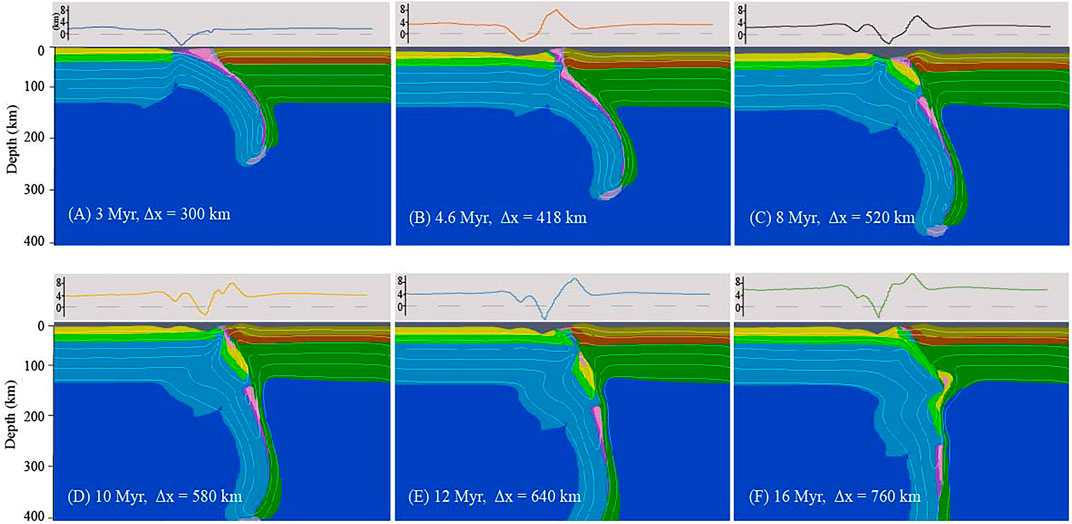
FIGURE 6. Evolution of the stable continental collision mode. Panels above each snapshot with gray shading show the corresponding topography. Δx is the amount of convergence. Different colors in (A–F) denote different lithologies (same as Figure 2).
The ablative/two-sided continental collision mode (Tao and O’connell, 1992; Faccenda et al., 2008; Warren et al., 2008) was the third mode obtained from the model results. This mode can be further divided into symmetric and polarity-reversed subtypes. The model MSI-s1a2 consisted of a weaker retrocontinental lower crust and a 45° subducting angle. It yielded a similar oceanic subduction process as MSI-v1a1 (Figure 5) did. However, it generated a relatively gentle topographic uplift (Figures 7A,B). Thereafter, it became extremely distinct as the continents ran into each other. As the retrocontinental lower crust was designed to be rheologically weak, the sediment and procrustal rocks accumulated at shallow could easily cause an indention without creating significant orogen wedge rising. In contrast, under the obstruction from a buttress that consisted of the scraped-off material and the upward retrolithospheric mantle, the procontinental leading edge uplifted instead (Figure 7C). Continuous horizontal proside pushing gave rise to a thick and quasi-symmetric collision zone with a thickened crust, which caused a wide retroside topographic growth. As the procontinental crust is intrinsically buoyant, it resisted going downward. The competition between continuous proside pushing and the resistance from the retrocontinent then resulted in strain localization of the proplate leading edge, after which the procontinental crust ruptured (Figures 7D,E). Later on, the subducting slab gradually turned over and changed its polarity, indented into the retrocontinent, peeled off the retrocontinental upper crust, and started to subduct with the delaminated retrocontinental lithospheric mantle, leaving a retrocrustal fold at the surface (Figure 7F).
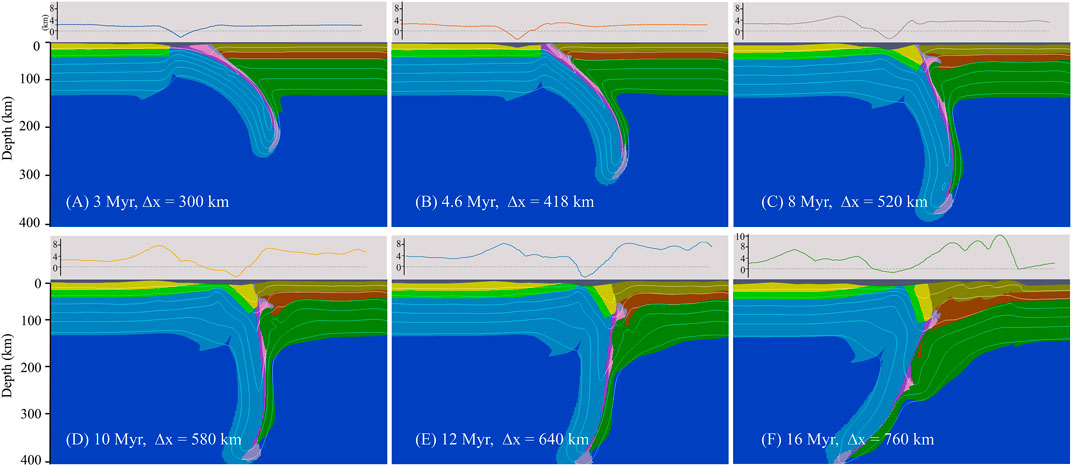
FIGURE 7. Evolution of the ablative/two-sided continental collision mode. Panels above each snapshot with gray shading show the corresponding topography.
In this study, an important aspect of our effort to differentiate the models from previous experiments was conducting a parametric study in VDS. Three distinct end members of continental collision modes were obtained. The regime diagram (Figure 8, Supplementary Material) shows the dependence of continental collision evolution on the continental convergence rate, initial subducting angle, and continental crustal rheological strength.
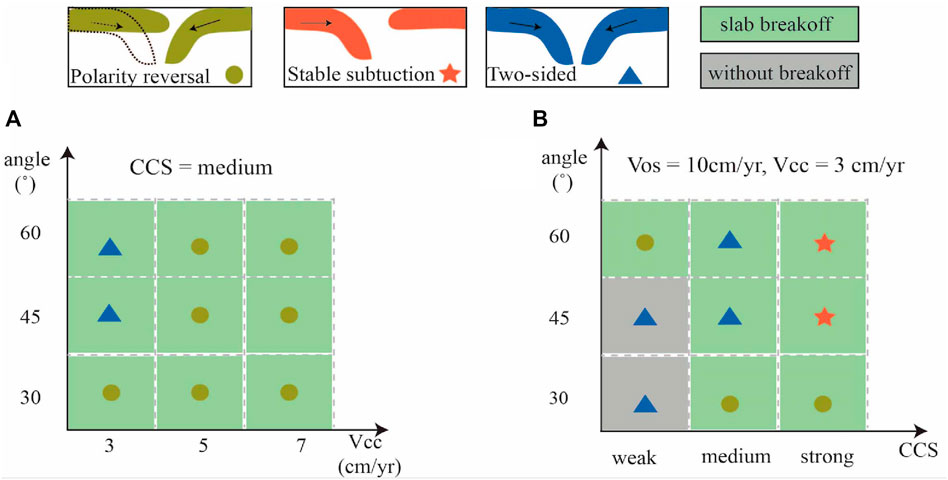
FIGURE 8. Schematic figures of continental collision modes depending on (A) subducting angle and plate velocity, and (B) subducting angle and crustal rheological strength. Different symbols denote different collision modes.
Among models that used a medium retrocontinental crustal strength, the ones with a gentle subducting angle (30°) always exhibited polarity-reversed mode. In the same time frame, increasing continental convergence velocity resulted in an earlier break-off of the proplate as well as a longer retrocontinental delamination (Figure 4B). In contrast, models with a slightly steeper subducting angle (45°) and slow continental convergence (3 cm/year) evolved into the ablative continental collision mode, whereas models with fast convergence velocity (
In the weak continental crustal regime (CCS = weak), the retrocontinental lower crust had relatively low viscosity in favor of the decoupling between the retrocontinental crust and the underlying mantle lithosphere. Such models were more liable to evolve polarity reversals. Differences existed, however, between models with a relatively gentle subducting angle (
As we applied a strong retrocontinental crustal strength (CCS = strong), the retroplate seemed to be strong enough to resist intense deformation and delamination. It was then more inclined to deform as an integrated plate, which produced a stable continental collision mode (Figure 8B).
To conclude, these numerical results indicate that continental convergence velocity, initial subducting angle, and retrocontinental crustal rheological strength are three crucial first-order controlling parameters that have significant influences on the continental collision process in VDS, and the crustal strength is especially important for the alteration of continental collision patterns among them. As illustrated in Figure 8, in models with medium crustal strength, slow convergence velocity and steep subducting angle tended to evolve into a two-sided/ablative continental collision mode. Fast convergence and gentle subducting angles always developed into a polarity reversal mode. Models with a weak continental lower crust were more likely to form a two-sided reversed mode. Further enhancing crustal strength contributed to a strong, coherent retrocontinental lithosphere and tended to evolve into a stable mode. Note that a weak retrocontinental lower crust with a gentle subducting angle accommodated continental convergence with a two-sided reversed mode characterized by rolling over of the proplate, rather than breaking off.
Discussion
The Effects of Plate Velocity Slowdown on the Continental Collision Process
The most crucial setup that differentiates VDS models from CVS is decreasing plate convergence velocity from 10 cm/year during oceanic subduction to the slower ones (3/5/7 cm/year) after the onset of continental collision. Figure 4 shows that the polarity reversal mode dominated the continental collision style in both VDS and CVS, while the time of polarity reversal in VDS is always earlier than in CVS. This phenomenon arises from the change of both net force and temperature field in VDS: On one hand, during oceanic subduction, fast plate convergence velocity caused fast slab sinking that led to an increase in negative buoyancy. When sharply decreasing the continental convergence velocity after the continental collision, surface lithospheric motion notably slowed down, with slab in depth continuing its downward dragging. The net effect from the forces acting in opposite directions could trigger tension and localized strain in the slab interior. In addition, the foregoing fast oceanic subduction could aggravate the plates’ relative motion and increase shear heating on the plates’ interface, which may also warm and weaken the plates from the surface. As a consequence, the subducting slab may weaken in certain zones. On the other hand, fast plate convergence velocity corresponded to high horizontal compression. Intense compression between plates could result in severe deformation in and around the collision zone, providing ideal conditions for the formation of a new fault, along which a new subduction may develop.
Besides, slab break-off always results in a sudden removal of downward slab pulling. After that, the following continental forepart could rebound upward due to its buoyancy. In our models, such a process may facilitate the obduction of procontinent along the newly developed fault, and contribute to the evolution of plate polarity reversal (Figure 5).
Continental Collision Modes in the Plate Velocity Slowdown Model
Parametric sensitive tests revealed that kinematic characteristics (including plate convergence velocity and subducting angle), as well as the rheological strength of continental crust, had strong influences on continental collision evolution in a plate velocity slowdown model, which has also been confirmed by previous studies that adopted a constant plate velocity model (Pysklywec, 2001; Faccenda et al., 2008; Yang et al., 2019). However, it has its own characteristics. Except for models with slow continental convergence velocity (3 cm/year) and steep subducting angles (>45°), which result in a quasisymmetric ablative mode, the polarity-reversed mode dominated the continental collision style in models with medium overriding crustal strength. When we fixed the plate convergence velocity but altered the subducting angle and retrocontinental crustal strength, three end members of the collision modes were observed under specific parameter ranges: Models with a weak crust and low subducting angles (<45°) showed a reversed ablative mode whereas models with a strong crust always demonstrated a stable mode. In addition, with the exception of a weak crust group, the others evolved into slab necking or slab break-off. Thus, we can infer that plate velocity slowdown after continents meet can break the force equilibrium of the slab by increasing resistance to subduction and then intensifying the extension of the slab, especially in the transition zone between the oceanic and continental plates. This extension is responsible for the local weakening and subsequent break-off of the subducting plate. The shallower the slab that breaks off, the much easier it is for the adjacent overriding plate to switch its polarity. Overriding crustal strength is crucial to altering continental collision modes among these three parameters. A weak overriding continental crust could partially or completely decouple the crust from the lithospheric mantle and facilitate the proplate’s indention, resulting in the sinking of the delaminated lithospheric mantle. On the contrary, a strong overriding crust could hamper further deformation and maintain its polarity to form a stable mode inherited from the foregoing oceanic subduction.
Geological Implications for Different Continental Collision Modes
Plate convergence involving oceanic lithosphere is always characterized by one plate that descends beneath the other at the plate’s boundary (namely, subduction). The nature of lithospheric deformation during continental plate convergence, however, is still ambiguous. Continental crust generally resists subduction because of its buoyancy, and consequently, it is more liable to deform, thicken, and uplift at a collision zone. These orogenic events significantly contribute to cover up the nature of the underlying lithospheric mantle dynamics. Evidence supports the subduction of the lithospheric mantle at continental collision boundaries. This process is not as steady or coherent as it is in oceanic subduction; instead, it is characterized by diverse tectonic complexities. Our numerical experiments are not prescribed to certain specific orogeny; thus, snapshots mainly show the general process of lithospheric scale deformation at collisional margins. However, numerous seismic images conducted in the active continental collision zones enable the division of continental collision modes into three end members.
Hindu Kush
The Hindu Kush region, located in the western syntaxis of the Tibetan plateau, is the westernmost part of the India-Eurasia collision system and a prominent site to study ongoing continental collision. The comparison of the geodynamic conditions and evolution of Hindu Kush with the stable continental collision mode exhibited good consistency (Figures 1C, 6F). In the Hindu Kush region, the lower plate has been interpreted to be the Indian craton lithosphere, and the overriding plate as the Tajik Basin (TB). The TB is formed by accreted continental terrane during the late Carboniferous to Early Permian, and its crust experienced limited extension. Thus, it is reasonable to presume TB to be a strong overriding lithosphere, which is the favored condition to develop a stable continental collision mode according to the model predictions (Figure 8). Seismic tomographic and seismological studies indicated a steep northward dipping High Velocity Zone (HVZ) underneath the HK. The HVZ was interpreted as the subducting Indian lithosphere, along the surface of which is a thin intermediate-depth seismic belt that was interpreted as the subducting lower crust; these slab geometry and lithospheric deformation features are well consistent with the results of stable collision models (Figure 6F). In addition, a slab necking was observed in seismic images, the structure of which was also indicated by the model results (Figure 6F).
Eastern Alps
Geophysical and geologic evidence has suggested that switches in subduction polarity, either in time (at a given location) or in space, along the plate convergent boundaries are ubiquitous (von Hagke et al., 2016). Polarity reversed mode has been recognized in both subduction orogenies (e.g., Taiwan) and collisional mountain belts (e.g., Pamir-Hindu-Kush, circum-Mediterranean Alpine mountain belt) (Faccenna et al., 2004; Handy et al., 2015; von Hagke et al., 2016). Teleseismic tomographic images have indicated that two + VP anomalies with disparate orientations exist beneath the Alps (Handy et al., 2015): one of them beneath the western and central parts subducts southeastward to ∼200 km (Schmid et al., 1996), and the other one beneath the eastern part directs to the opposite side for European subduction and inclines northward to
Furthermore, the evolution of surface topography in our model is coincidental with the results of analogue modeling (Willingshofer and Sokoutis, 2009), as well as the evolution of the eastern Alps based on geological data (Genser et al., 2007). Willingshofer and Sokoutis (2009) once pointed out that plates experienced weakly coupling during the consumption of Alpine Tethys as calcareous clays and silts from sediment and oceanic crust worked as decoupling materials, after which the European continental margin started underthrusting (late Eocene). During the late Eocene–early Oligocene, strong subsidence occurred to form a foreland basin (Genser et al., 2007). The above process is compatible with our polarity-reversed models (Figures 5A–C) with fast oceanic subduction. From Oligocene to Miocene, strong internal deformation and vertical motion occurred in the wedge, followed by the switch of thrusting of the orogenic wedge from north-directed onto the European plate to south-directed. During Middle-late Miocene, cooling of the orogenic wedge strengthened it to facilitate the transmission of stress to the northern plate, which may have led to the late-stage uplift of foreland basin. First-order characteristics of topographic evolution from our model with slow convergence (Figures 5C–F) are also consistent with the evolution of the above continental collision stage.
On the basis of model results, we can conclude that the following conditions are favorable for the development of the polarity reversed mode: (1) slab break-off at shallow, after which the remaining strong surface proplate moves upward; and (2) newly developed reversed fault (in this case, the Periadriatic Fault System) working as a weak zone in the leading edge of the overriding plate contiguous to the collision zone, along which the pre-subducting plate would readily slide and facilitate its obduction (Figure 9A).
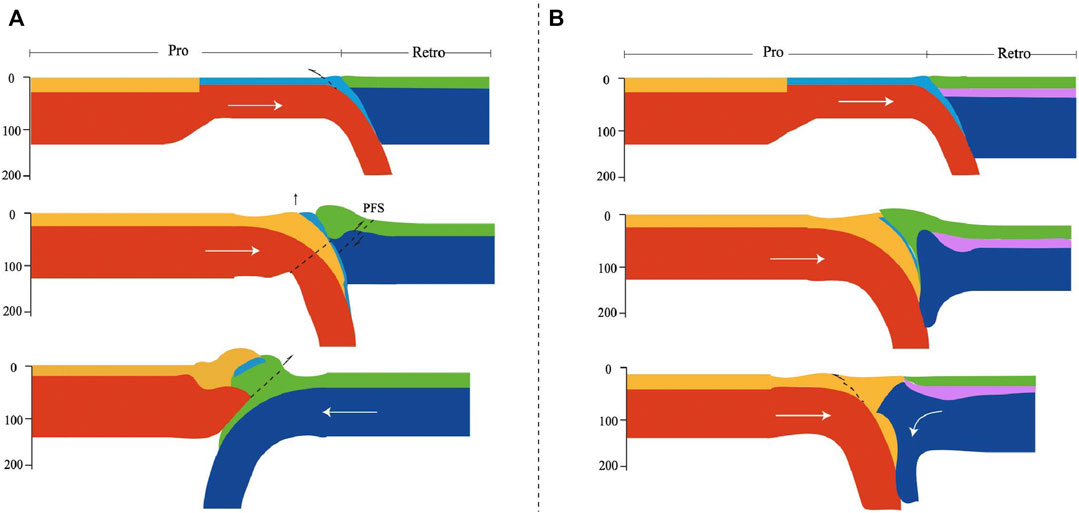
FIGURE 9. Schematic diagram of the evolution of (A) polarity reversed mode in eastern Alps and (B) ablative mode in the Austroalpine of the western Alps. PFS is Periadriatic Fault System (Handy et al., 2015; Zhao et al., 2015).
The Austroalpine of the Western Alps
Ablative/two-sided plate consumption model was first introduced by Tao and O'Connell (1992), they interpreted the process based on the dynamics of fluids, which suggests that the viscous lower lithosphere flows downward, and the brittle upper lithosphere deforms in a passive response as it is dragged downward by a dense, descending neighbor. Roda et al. (2012) once verified that the statistical data of the natural P–T peak assemblages coming from the Austroalpine of the Western Alps and the simulated P-T data from the continental upper and lower crust are in good agreement; they proposed that the structural, metamorphic setting, and exhumation of HP/UHP rocks in the Austroalpine Domain could be interpreted as episodic oceanic subduction and orogenic processes that might be manifested by an ablative mode induced by strong coupling of adjacent converged plates. As in model MSI-s1a2, continuous indention of the prolithosphere peeled off the upper crust from the weaker lower lithosphere, leaving a notable shallow converge deformation and an uplift of the collision zone; meanwhile retrocrust accreted to the orogenic wedge (Figure 9B). These features are in accordance with certain tectonic characters of the western Austroalpine, for example, the double-verged accretion in the region (Handy et al., 2010; Roda et al., 2012). Although it might not totally explain tectonic evolution of the Austroalpine, the results of our ablative model could shed new light on our understanding of the tectonic evolution of this region.
Ivrea body, once recognized as a slice of the Adriatic mantle exhumed during Mesozoic extension (Nicolas et al., 1990; Zhao et al., 2015), is a special tectonic unit that shapes the recent orogenic structure and crust–mantle deformation pattern of the western Alps. It can work as a buttress between lower and upper plates, impedes pro-upper crustal material from retroward advancing, constrains crustal shortening in the subducting plate, and generates high surface elevation (Liao et al., 2018). Our ablative models also showed the similar characteristics of a lithospheric structure and topography evolution (Figure 7C).
Model Limitations
Though our models can reconcile important first-order continental collision characteristics, as well as topographic responses, limitations still exist and hamper the reproduction of detailed orogenic process. Because it is based on a 2D model, it cannot reproduce tectonic processes, such as extrusion tectonics and highly curved collision front and lateral mantle flow; however, the formation of the natural orogens is intrinsically 3D; therefore, 3D modeling approach is required in the future for a better simulation. Figure 3F exhibited a surface uplift of ∼10 km, which is not observed on earth. This extremely high value in 2D models may be due in part to the lateral extrusion deformation. Besides, in the models, the flow-in and flow-out were prescribed on the same wall, which is not strictly consistent with the mantle flow pattern, and may introduce differences in the model results.
To simplify the model, we neglected mineral phase changes. However, it would modify density. For example, eclogitization in subducted oceanic crust can influence the slab pull and help change the continental collision regime, and control slab break-off. Partial melting is not included either, which can reduce the effective viscosity (strength) of crustal rocks. Besides, no plastic weakening occurs, which is related to the strength of lithosphere, topography evolution, and slab break-off.
Conclusion
Plate velocity slowdown between the transition from oceanic subduction to continental convergence, along with continental convergence velocity, subducting angle, and continental crustal rheological strength, are first-order controlling parameters that have significant influences on the fate of the oceanic and continental lithosphere, as well as on the whole evolution of the continental convergence system.
Three different deformation modes of the lithospheric mantle can be obtained through conducting a series of numerical experiments: polarity-reversed mode, two-sided/ablative mode, and stable mode. In addition, by comparing models with distinct configurations, we can conclude the following:
1) A dramatic decrease in plate convergence velocity when continents meet facilitated the extension in the interior of the subducting plate, as the surface plate’s motion was slower than the slab’s downward sinking, which may have resulted in the slab break-off after certain localized strain accumulation.
2) Fast continental convergence velocity in VDS helps the acceleration of continental collision processes and results in earlier slab break-off. In contrast, in models with a slow continental convergence velocity and a steep subducting angle, the overriding lithospheric mantle tended to delaminate and was dragged down by the subducting plate.
3) Increasing overriding crustal strength produces a stable collision zone. Such a strong crust can limit the development of strain localization in the overriding plate, making the model more likely to evolve into a stable continental convergence mode. Applying a medium or even weak overriding continental crust may more easily produce crust–mantle decoupling, after which the lithospheric mantle may sink in either a reversed mode or a two-sided mode.
4) Favorable conditions for the development of a polarity reversed mode are as follows: (i) a shallow slab break-off, after which the remaining surface subducting plate would move upward, and (ii) a newly developed reversed fault (in this case, the Periadriatic Fault System) contiguous to the collision zone would act as a weak zone at the leading edge of the overriding plate, along which the presubducting plate would readily slide and facilitate its obduction. Decoupling between the upper and middle/lower crust could decrease the influence of downward slab pull and facilitate the scrape-off and accumulation of crustal material at surface. Continuous pulling down of the deeper slab can then dragged the delaminated overriding lithospheric mantle downward.
Data Availability Statement
The original contributions presented in the study are included in the article/Supplementary Material, further inquiries can be directed to the corresponding author.
Author Contributions
ML performed numerical modeling and wrote the manuscript. DY contributed to the writing and revision of the manuscript. PH contributed to the revision of the manuscript. All authors contributed to scientific interpretations and commented on the manuscript.
Funding
This work is supported by the National Key Research and Development Program on Monitoring, Early Warning and Prevention of Major Natural Disaster (No. 2017YFC1500301) and the National Natural Science Foundation of China (Grant Nos. U1839206 and 42104097). The figures in this paper are produced by the Generic Mapping Tools V5.4.2 (Wessel et al., 2013), Python V3.6.7, and Paraview V5.7.0, and then compiled by Adobe Illustrator.
Conflict of Interest
The authors declare that the research was conducted in the absence of any commercial or financial relationships that could be construed as a potential conflict of interest.
Publisher’s Note
All claims expressed in this article are solely those of the authors and do not necessarily represent those of their affiliated organizations, or those of the publisher, the editors, and the reviewers. Any product that may be evaluated in this article, or claim that may be made by its manufacturer, is not guaranteed or endorsed by the publisher.
Acknowledgments
We thank the Computational Infrastructure for Geodynamics for supporting the development of ASPECT (https://aspect.geodynamics.org).
Supplementary Material
The Supplementary Material for this article can be found online at: https://www.frontiersin.org/articles/10.3389/feart.2022.814710/full#supplementary-material
Supplementary Figure S1 | Viscosity fields of models in VDS with variable subducting angle (30˚, 45˚, 60˚) and continental convergence velocity (3 cm/year, 5 cm/year, 7 cm/year) correspond to Figure 8.
Supplementary Figure S2 | Viscosity fields of models in VDS with variable retrocontinental lower crustal strength (weak, medium, strong) and dip angle (30˚, 45˚, 60˚) correspond to Figure 8.
References
Arndt, D., Bangerth, W., Blais, B., Fehling, M., Gassmöller, R., Heister, T., et al. (2021). The deal.II Library, Version 9.3. J. Numer. Math. 29, 171–186. doi:10.1515/jnma-2021-0081
Bird, P. (2003). An Updated Digital Model of Plate Boundaries. Geochem. Geophys. Geosyst. 4 (3), 1027. doi:10.1029/2001GC000252
Brown, D., Ryan, P. D., Afonso, J. C., Boutelier, D., Burg, J. P., Byrne, T., et al. (2011). “Arc–Continent Collision: The Making of an Orogen,” in Arc-Continent Collision (Berlin, Heidelberg: Springer Berlin Heidelberg), 477–493. doi:10.1007/978-3-540-88558-0_17
Burg, J.-P., and Gerya, T. V. (2005). The Role of Viscous Heating in Barrovian Metamorphism of Collisional Orogens: Thermomechanical Models and Application to the Lepontine Dome in the Central Alps. J. Metamorph. Geol. 23 (2), 75–95. doi:10.1111/j.1525-1314.2005.00563.x
Capitanio, F. A., Replumaz, A., and Riel, N. (2015). Reconciling Subduction Dynamics during Tethys Closure with Large-Scale Asian Tectonics: Insights from Numerical Modeling. Geochem. Geophys. Geosyst. 16, 962–982. doi:10.1002/2014gc005660
Chapman, D. S. (1986). Thermal Gradients in the continental Crust. Geol. Soc. Lond. Spec. Publ. 24 (1), 63–70. doi:10.1144/GSL.SP.1986.024.01.07
Chemenda, A. I., Burg, J. P., and Mattauer, M. (2000). Evolutionary Model of the Himalaya–Tibet System: Geopoembased on New Modelling, Geological and Geophysical Data. Earth Planet. Sci. Lett. 174 (3-4), 397–409. doi:10.1016/S0012-821X(99)00277-0
Chen, Y., Li, W., Yuan, X., Badal, J., and Teng, J. (2015). Tearing of the Indian Lithospheric Slab beneath Southern Tibet Revealed by SKS-Wave Splitting Measurements. Earth Planet. Sci. Lett. 413, 13–24. doi:10.1016/j.epsl.2014.12.041
Chen, L., Capitanio, F. A., Liu, L., and Gerya, T. V. (2017). Crustal Rheology Controls on the Tibetan Plateau Formation during India-Asia Convergence. Nat. Commun. 8, 15992–15998. doi:10.1038/ncomms15992
Chen, L. (2021). The Role of Lower Crustal Rheology in Lithospheric Delamination during Orogeny. Front. Earth Sci. 9. doi:10.3389/feart.2021.755519
Chertova, M. V., Spakman, W., Geenen, T., Van Den Berg, A. P., and Van Hinsbergen, D. J. J. (2014). Underpinning Tectonic Reconstructions of the Western Mediterranean Region with Dynamic Slab Evolution from 3-D Numerical Modeling. J. Geophys. Res. Solid Earth 119 (7), 5876–5902. doi:10.1002/2014JB011150
Clift, P. D., Schouten, H., and Draut, A. E. (2003). A General Model of Arc-Continent Collision and Subduction Polarity Reversal from Taiwan and the Irish Caledonides. Geol. Soc. Lond. Spec. Publ. 219, 81–98. doi:10.1144/GSL.SP.2003.219.01.04
Copley, A., Avouac, J.-P., and Royer, J.-Y. (2010). India-Asia Collision and the Cenozoic Slowdown of the Indian Plate: Implications for the Forces Driving Plate Motions. J. Geophys. Res. 115 (B3). doi:10.1029/2009JB006634
Dando, B. D. E., Stuart, G. W., Houseman, G. A., Hegedüs, E., Brückl, E., and Radovanović, S. (2011). Teleseismic Tomography of the Mantle in the Carpathian-Pannonian Region of central Europe. Geophys. J. Int. 186 (1), 11–31. doi:10.1111/j.1365-246X.2011.04998.x
Davis, R. O., and Selvadurai, & A. P. S. (2002). Plasticity and Geomechanics. Cambridge: Cambridge University Press.
Duretz, T., Schmalholz, S. M., and Gerya, T. V. (2012). Dynamics of Slab Detachment. Geochem. Geophys. Geosyst. 13 (3), a–n. doi:10.1029/2011GC004024
Faccenda, M., Gerya, T. V., and Chakraborty, S. (2008). Styles of post-subduction Collisional Orogeny: Influence of Convergence Velocity, Crustal Rheology and Radiogenic Heat Production. Lithos 103 (1-2), 257–287. doi:10.1016/j.lithos.2007.09.009
Faccenna, C., Piromallo, C., Crespo-Blanc, A., Jolivet, L., and Rossetti, F. (2004). Lateral Slab Deformation and the Origin of the Western Mediterranean Arcs. Tectonics 23. doi:10.1029/2002tc001488
Genser, J., Cloetingh, S. A. P. L., and Neubauer, F. (2007). Late Orogenic Rebound and Oblique Alpine Convergence: New Constraints from Subsidence Analysis of the Austrian Molasse basin. Glob. Planet. Change 58, 214–223. doi:10.1016/j.gloplacha.2007.03.010
Gleason, G. C., and Tullis, J. (1995). A Flow Law for Dislocation Creep of Quartz Aggregates Determined with the Molten Salt Cell. Tectonophysics 247, 1–23. doi:10.1016/0040-1951(95)00011-b
Glerum, A., Thieulot, C., Fraters, M., Blom, C., and Spakman, W. (2018). Nonlinear Viscoplasticity in ASPECT: Benchmarking and Applications to Subduction. Solid Earth 9, 267–294. doi:10.5194/se-9-267-2018
Guillot, S., Garzanti, E., Baratoux, D., Marquer, D., Mahéo, G., and de Sigoyer, J. (2003). Reconstructing the Total Shortening History of the NW Himalaya. Geochem. Geophys. Geosyst. 4 (7). doi:10.1029/2002GC000484
Handy, M. R., M. Schmid, S. S., Bousquet, R., Kissling, E., and Bernoulli, D. (2010). Reconciling Plate-Tectonic Reconstructions of Alpine Tethys with the Geological-Geophysical Record of Spreading and Subduction in the Alps. Earth-Science Rev. 102 (3-4), 121–158. doi:10.1016/j.earscirev.2010.06.002
Handy, M. R., Ustaszewski, K., and Kissling, E. (2015). Reconstructing the Alps-Carpathians-Dinarides as a Key to Understanding Switches in Subduction Polarity, Slab Gaps and Surface Motion. Int. J. Earth Sci. (Geol Rundsch) 104 (1), 1–26. doi:10.1007/s00531-014-1060-3
Hirth, G., and Kohlstedt, D. (2003). “Rheology of the Upper Mantle and the Mantle Wedge: A View from the Experimentalists,” in Geophysical Monograph Series (Washington DC: American Geophysical Union), 138, 83–105. doi:10.1029/138gm06
Huangfu, P., Li, Z.-H., Gerya, T., Fan, W., Zhang, K.-J., Zhang, H., et al. (2018). Multi-terrane Structure Controls the Contrasting Lithospheric Evolution beneath the Western and central-eastern Tibetan Plateau. Nat. Commun. 9 (1), 3780. doi:10.1038/s41467-018-06233-x
Jamieson, R. A., Beaumont, C., Fullsack, P., and Lee, B. (1998). Barrovian Regional Metamorphism: Where's the Heat? Geol. Soc. Lond. Spec. Publ. 138 (1), 23–51. doi:10.1144/GSL.SP.1996.138.01.03
Karato, S.-i., and Wu, P. (1993). Rheology of the Upper Mantle: A Synthesis. Science 260, 771–778. doi:10.1126/science.260.5109.771
Karato, S.-i. (2008). Deformation of Earth Materials: An Introduction to the Rheology of Solid Earth. Cambridge: Cambridge University Press.
Kissling, E., Schmid, S. M., Lippitsch, R., Ansorge, J., and Fügenschuh, B. (2006). Lithosphere Structure and Tectonic Evolution of the Alpine Arc: New Evidence from High-Resolution Teleseismic Tomography. Geol. Soc. Lond. Mem. 32 (1), 129–145. doi:10.1144/GSL.MEM.2006.032.01.08
Kronbichler, M., Heister, T., and Bangerth, W. (2012). High Accuracy Mantle Convection Simulation through Modern Numerical Methods. Geophys. J. Int. 191 (1), 12–29. doi:10.1111/j.1365-246X.2012.05609.x
Kufner, S.-K., Kakar, N., Bezada, M., Bloch, W., Metzger, S., Yuan, X., et al. (2021). The Hindu Kush Slab Break-Off as Revealed by Deep Structure and Crustal Deformation. Nat. Commun. 12, 1685. doi:10.1038/s41467-021-21760-w
Li, L., Liao, X., and Fu, & R. (2002). Slab Breakoff Depth: A Slowdown Subduction Model. Geophys. Res. Lett. 29 (3), 11–111113. doi:10.1029/2001GL013420
Li, Z. H., Xu, Z. Q., and Gerya, T. V. (2011). Flat versus Steep Subduction: Contrasting Modes for the Formation and Exhumation of High- to Ultrahigh-Pressure Rocks in continental Collision Zones. Earth Planet. Sci. Lett. 301 (1-2), 65–77. doi:10.1016/j.epsl.2010.10.014
Li, Z.-H., Xu, Z., Gerya, T., and Burg, J.-P. (2013). Collision of continental Corner from 3-D Numerical Modeling. Earth Planet. Sci. Lett. 380, 98–111. doi:10.1016/j.epsl.2013.08.034
Li, Y., Wang, C., Dai, J., Xu, G., Hou, Y., and Li, X. (2015). Propagation of the Deformation and Growth of the Tibetan-Himalayan Orogen: A Review. Earth-Sci. Rev. 143, 36–61. doi:10.1016/j.earscirev.2015.01.001
Li, Z. (2014). A Review on the Numerical Geodynamic Modeling of continental Subduction, Collision and Exhumation. Sci. China Earth Sci. 57 (1), 47–69. doi:10.1007/s11430-013-4696-0
Liang, X., Chen, Y., Tian, X., Chen, Y. J., Ni, J., Gallegos, A., et al. (2016). 3D Imaging of Subducting and Fragmenting Indian continental Lithosphere beneath Southern and central Tibet Using Body-Wave Finite-Frequency Tomography. Earth Planet. Sci. Lett. 443, 162–175. doi:10.1016/j.epsl.2016.03.029
Liang, Y., Li, L., Liao, J., and Gao, R. (2020). Interaction of the Indian and Asian Plates under the Pamir and Hindu-Kush Regions: Insights from 3-D Shear Wave Velocity and Anisotropic Structures. Geochem. Geophys. Geosyst. 21, e2020GC009041. doi:10.1029/2020gc009041
Liao, J., and Gerya, T. (2017). Partitioning of Crustal Shortening during continental Collision: 2‐D Thermomechanical Modeling. J. Geophys. Res. Solid Earth 122 (1), 592–606. doi:10.1002/2016JB013398
Liao, J., Gerya, T., and Malusà, M. G. (2018). 3D Modeling of Crustal Shortening Influenced by Along-Strike Lithological Changes: Implications for continental Collision in the Western and Central Alps. Tectonophysics 746, 425–438. doi:10.1016/j.tecto.2018.01.031
Lippitsch, R., Kissling, E., and Ansorge, J. (2003). Upper Mantle Structure beneath the Alpine Orogen from High-Resolution Teleseismic Tomography. J. Geophys. Res. 108. doi:10.1029/2002JB002016
Mechie, J., and Kind, R. (2013). A Model of the Crust and Mantle Structure Down to 700 Km Depth beneath the Lhasa to Golmud Transect across the Tibetan Plateau as Derived from Seismological Data. Tectonophysics 606, 187–197. doi:10.1016/j.tecto.2013.04.030
Mechie, J., Kind, R., and Saul, J. (2011a). The Seismological Structure of the Tibetan Plateau Crust and Mantle Down to 700 Km Depth. Geol. Soc. Lond. Spec. Publ. 353, 109–125. doi:10.1144/sp353.7
Mechie, J., Yuan, X., Schurr, B., Schneider, F., Sippl, C., Ratschbacher, L., et al. (2011b). Crustal and Uppermost Mantle Velocity Structure along a Profile across the Pamir and Southern Tien Shan as Derived from Project TIPAGE Wide-Angle Seismic Data. Geophys. J. Int. 188, 385–407. doi:10.1111/j.1365-246x.2011.05278.x
Mechie, J., Zhao, W., Karplus, M., Wu, Z., Meissner, R., Shi, D., et al. (2012). Crustal Shear (S) Velocity and Poisson's Ratio Structure along the INDEPTH IV Profile in Northeast Tibet as Derived from Wide-Angle Seismic Data. Geophys. J. Int. 191, 716. doi:10.1111/j.1365-246x.2012.05616.x
Mitterbauer, U., Behm, M., Brückl, E., Lippitsch, R., Guterch, A., Keller, G. R., et al. (2011). Shape and Origin of the East-Alpine Slab Constrained by the ALPASS Teleseismic Model. Tectonophysics 510 (1), 195–206. doi:10.1016/j.tecto.2011.07.001
Nábelek, J., Hetényi, G., Vergne, J., Sapkota, S., Kafle, B., Jiang, M., et al. (2009). Underplating in the Himalaya-Tibet Collision Zone Revealed by the Hi-CLIMB experiment. Science 325, 1371–1374. doi:10.1126/science.1167719
Negredo, A. M., Replumaz, A., Villaseñor, A., and Guillot, S. (2007). Modeling the Evolution of continental Subduction Processes in the Pamir-Hindu Kush Region. Earth Planet. Sci. Lett. 259 (1-2), 212–225. doi:10.1016/j.epsl.2007.04.043
Nicolas, A., Hirn, A., Nicolich, R., and Polino, R. (1990). Lithospheric Wedging in the Western Alps Inferred from the ECORS-CROP Traverse. Geol 18, 587–590. doi:10.1130/0091-7613(1990)018<0587:lwitwa>2.3.co;2
Owens, T. J., and Zandt, G. (1997). Implications of Crustal Property Variations for Models of Tibetan Plateau Evolution. Nature 387, 37–43. doi:10.1038/387037a0
Patriat, P., and Achache, J. (1984). India-Eurasia Collision Chronology Has Implications for Crustal Shortening and Driving Mechanism of Plates. Nature 311 (5987), 615–621. doi:10.1038/311615a0
Pysklywec, R. N., Beaumont, C., and Fullsack, P. (2000). Modeling the Behavior of the continental Mantle Lithosphere during Plate Convergence. Geology 28 (7), 655. doi:10.1130/0091-7613(2000)028<0655:mtbotc>2.3.co;2
Pysklywec, R. N. (2001). Evolution of Subducting Mantle Lithosphere at a continental Plate Boundary. Geophys. Res. Lett. 28 (23), 4399–4402. doi:10.1029/2001gl013567
Roda, M., Marotta, A. M., and Spalla, M. I. (2010). Numerical Simulations of an Ocean-Continent Convergent System: Influence of Subduction Geometry and Mantle Wedge Hydration on Crustal Recycling. Geochem. Geophys. Geosyst. 11 (5). doi:10.1029/2009GC003015
Roda, M., Spalla, M. I., and Marotta, A. M. (2012). Integration of Natural Data within a Numerical Model of Ablative Subduction: a Possible Interpretation for the Alpine Dynamics of the Austroalpine Crust. J. Metamorph. Geol. 30 (9), 973–996. doi:10.1111/jmg.12000
Rybacki, E., Gottschalk, M., Wirth, R., and Dresen, G. (2006). Influence of Water Fugacity and Activation Volume on the Flow Properties of fine-grained Anorthite Aggregates. J. Geophys. Res. Solid Earth 111. doi:10.1029/2005jb003663
Saein, L. D., and Afzal, P. (2017). Correlation between Mo Mineralization and Faults Using Geostatistical and Fractal Modeling in Porphyry Deposits of Kerman Magmatic Belt, SE Iran. J. Geochem. Explor. 181, 333–343. doi:10.1016/j.gexplo.2017.06.014
Schmid, S. M., Pfiffner, O. A., Froitzheim, N., Schönborn, G., and Kissling, E. (1996). Geophysical-geological Transect and Tectonic Evolution of the Swiss-Italian Alps. Tectonics 15 (5), 1036–1064. doi:10.1029/96TC00433
Spakman, W., Chertova, M. V., van den Berg, A. P., and van Hinsbergen, D. J. J. (2018). Publisher Correction: Puzzling Features of Western Mediterranean Tectonics Explained by Slab Dragging. Nat. Geosci. 11 (5), 374. doi:10.1038/s41561-018-0096-6
Tao, W. C., and O'connell, R. J. (1992). Ablative Subduction: A Two-Sided Alternative to the Conventional Subduction Model. J. Geophys. Res. 97 (B6), 8877–8904. doi:10.1029/91JB02422
Tetreault, J. L., and Buiter, S. J. H. (2012). Geodynamic Models of Terrane Accretion: Testing the Fate of Island Arcs, Oceanic Plateaus, and continental Fragments in Subduction Zones. J. Geophys. Res. 117 (B8). doi:10.1029/2012JB009316
Tilmann, F., and Ni, J. (2003). Seismic Imaging of the Downwelling Indian Lithosphere Beneath Central Tibet. Science 300, 1424–1427. doi:10.1126/science.1082777
Turcotte, D. L., and Schubert, G. (2002). Geodynamics. Cambridge: Cambridge University Press. doi:10.1017/CBO9780511807442
von Hagke, C., Philippon, M., Avouac, J.-P., and Gurnis, M. (2016). Origin and Time Evolution of Subduction Polarity Reversal from Plate Kinematics of Southeast Asia. Geology 44 (8), 659–662. doi:10.1130/G37821.1
Wang, Q., Zhang, P.-Z., Freymueller, J. T., Bilham, R., Larson, K. M., Lai, X. a., et al. (2001). Present-Day Crustal Deformation in China Constrained by Global Positioning System Measurements. Science 294 (5542), 574–577. doi:10.1126/science.1063647
Wang, C., Dai, J., Zhao, X., Li, Y., Graham, S. A., He, D., et al. (2014). Outward-growth of the Tibetan Plateau during the Cenozoic: A Review. Tectonophysics 621, 1–43. doi:10.1016/j.tecto.2014.01.036
Warren, C. J., Beaumont, C., and Jamieson, R. A. (2008). Modelling Tectonic Styles and Ultra-high Pressure (UHP) Rock Exhumation during the Transition from Oceanic Subduction to continental Collision. Earth Planet. Sci. Lett. 267 (1-2), 129–145. doi:10.1016/j.epsl.2007.11.025
Wessel, P., Smith, W. H. F., Scharroo, R., Luis, J., and Wobbe, F. (2013). Generic Mapping Tools: Improved Version Released. Eos Trans. AGU 94, 409–410. doi:10.1002/2013eo450001
Wilks, K. R., and Carter, N. L. (1990). Rheology of Some continental Lower Crustal Rocks. Tectonophysics 182, 57–77. doi:10.1016/0040-1951(90)90342-6
Willingshofer, E., and Sokoutis, D. (2009). Decoupling along Plate Boundaries: Key Variable Controlling the Mode of Deformation and the Geometry of Collisional Mountain Belts. Geology 37, 39–42. doi:10.1130/g25321a.1
Yamato, P., Burov, E., Agard, P., Le Pourhiet, L., and Jolivet, L. (2008). HP-UHP Exhumation during Slow continental Subduction: Self-Consistent Thermodynamically and Thermomechanically Coupled Model with Application to the Western Alps. Earth Planet. Sci. Lett. 271 (1), 63–74. doi:10.1016/j.epsl.2008.03.049
Yang, T., Huangfu, P., and Zhang, Y. (2019). Differentiation of Continental Subduction Mode: Numerical Modeling. J. Earth Sci. 30 (4), 809–822. doi:10.1007/s12583-017-0946-y
Ye, Z., Gao, R., Li, Q., Zhang, H., Shen, X., Liu, X., et al. (2015). Seismic Evidence for the North China Plate Underthrusting beneath Northeastern Tibet and its Implications for Plateau Growth. Earth Planet. Sci. Lett. 426, 109–117. doi:10.1016/j.epsl.2015.06.024
Yin, A., and Harrison, T. M. (2000). Geologic Evolution of the Himalayan-Tibetan Orogen. Annu. Rev. Earth Planet. Sci. 28, 211–280. doi:10.1146/annurev.earth.28.1.211
Keywords: numerical modeling, Alpine-Himalayan Tethyan belt, continental collision, various continental collision mode, plate velocity slowdown
Citation: Liu M, Yang D and Huangfu P (2022) Effects of Plate Velocity Slowdown on Altering Continental Collision Patterns and Crustal-Lithospheric Deformation During the Collision Process. Front. Earth Sci. 10:814710. doi: 10.3389/feart.2022.814710
Received: 14 November 2021; Accepted: 06 January 2022;
Published: 22 February 2022.
Edited by:
Jie Liao, Sun Yat-sen University, Zhuhai Campus, ChinaReviewed by:
Quan Zhou, Facebook, United StatesLin Chen, Institute of Geology and Geophysics (CAS), China
Copyright © 2022 Liu, Yang and Huangfu. This is an open-access article distributed under the terms of the Creative Commons Attribution License (CC BY). The use, distribution or reproduction in other forums is permitted, provided the original author(s) and the copyright owner(s) are credited and that the original publication in this journal is cited, in accordance with accepted academic practice. No use, distribution or reproduction is permitted which does not comply with these terms.
*Correspondence: Dinghui Yang, ydh@mail.tsinghua.edu.cn
 Mengxue Liu