 Like Wei
 Qiang Yuan
 Yiwei Ren
 Deyi Jiang1*
- 1State Key Laboratory of Coal Mine Disaster Dynamics and Control, Chongqing University, Chongqing, China
- 2Information Research Institute, Ministry of Emergency Management, Beijing, China
- 3College of Energy Engineering, Xi’an University of Science and Technology, Xi’an, China
- 4China Coal Technology and Engineering Group Chongqing Research Institute, Chongqing, China
- 5Chongqing Engineering Research Center of Automatic Monitoring for Geological Hazards, Ministry of Natural Resources, Chongqing, China
Energy evolution process of rock deformation is conducive to essentially reveal the rock failure mechanism and is of great significance to uncover the breeding of dynamic disasters in rock engineering. To characterize the damage evolution of energy dissipation during rock failure, the digital image correlation (DIC) technique is proposed to describe the rock failure mechanics and its energy evolution process. The uniaxial compression experiment of sandstone specimen was carried out, and the whole field deformation and failure characteristics of the rock had been captured by the DIC system. Measurement accuracy was verified by the fiber Bragg grating (FBG) sensor, the elastic region of the specimen was divided according to the location of strain localization band (SLB), and the evolution process of elastic strain energy of the rock was analyzed. The results show that the time history development of rock strain obtained by the FBG and DIC system matches identically, and the deviation of peak axial strain of both means is less than 5%, which verifies the applicability of DIC system. The uncoordinated evolution of rock deformation displacement field is discussed to reveal the crack development and failure form of the sandstone specimen under uniaxial compression. The energy evolution of the elastic region of the specimen is revealed, and the development of releasable elastic strain energy would be divided into three stages, which correspond to the stress–strain characteristics of rock failure mechanics. This study could provide an alternative analytical method for the experimental rock mechanics research studies.
Introduction
The deformation and failure of rocks is an energy dissipation and irreversible process. The rock mass subjected to external force not only causes the change in rock stress and strain state but also leads to the change in rock damage state. Correctly understanding and describing the energy evolution in the process of rock deformation and failure has important scientific and practical significance for in-depth understanding of the damage, fracture, instability, and failure of rock materials, and the occurrence mechanism of rock engineering disasters (Mikhalyuk and Zakharov, 1997; Steffler et al., 2003; Sujatha and Kishen, 2003; Song et al., 2012).
In recent years, the energy analysis method has been used to describe the rock mechanics behaviors including deformation, broken, creeping, and permeation. Xie et al. (2005), Xie et al. (2009), and Feng et al. (2021) studied the internal relationship between energy dissipation, release and rock failure in the process of rock deformation and failure, and proposed rock strength and overall failure criteria based on the energy theory. On this basis, Zhang and Gao (2012) and Zhang and Gao (2012) analyzed different energy conversion mechanisms in the process of rock uniaxial compression, and established a self-inhibitory evolution model of energy conversion of loaded rock. Afterward, the evolution characteristics of energy dissipation, friction energy dissipation, and breakage energy dissipation were studied to show that the energy dissipation ratio shows a spoon shape characteristic (Miao et al., 2021). The jointed sandstone with different dip angles under uniaxial compression finds out that the energy evolution process is divided into five stages, and total elastic strain energy at the peak point of jointed sandstone exhibit asymmetrical “U” type evolution characteristics with the increase of dip angles of joint (Wang et al., 2020). The sandstone energy evolution behavior under the unconfined compressive condition revealed that the interface friction between fatigue damage and cracks will produce plastic deformation (Liu et al., 2020). The internal energy parameters of rock specimens during tensile failure were obtained to analyze the law of energy storage and consumption (Gong et al., 2018). Jiang et al. collected acoustic emission parameters during uniaxial compression of shale and analyzed the criticality of energy release during load fracture of brittle rock (Jiang et al., 2016). Zhao studied the energy variation law of rocks under different confining pressures and different unloading paths (Zhao et al., 2015). Song discussed the energy dissipation characteristics of the coal and rock in the process of uniaxial compression from the perspective of energy by using geophysical methods (Song et al., 2015).
Due to the complexity of rock deformation, different technical means were used to explore the principle of energy dissipation law during the rock deformation. Some emerging optical testing technologies, such as fiber Bragg grating (FBG) sensing technology and digital image correlation (DIC) technology, have also been applied to explore the precursor information of deformation and instability of rock mass materials (Chai et al., 2015; Chai et al., 2016; Wang et al., 2018). Simultaneously, tests in uniaxial compression of rocks with FBG sensor, MTS system, and laser strain gauge have shown that the sensor has high accuracy in rock strain measurement (Hatenberger et al., 2003). The stability and accuracy of resistance strain gauge and FBG sensor in rock uniaxial cyclic loading and unloading test were compared (Yang et al., 2007), and the damage evolution process of rocks during uniaxial compression by prefabricating speckles on the surface of the standard specimen was described (Ma et al., 2006).
The evolution of deformation field on the specimen surface during rock loading is measured by DIC technology, the non-uniform deformation process of rock materials is analyzed, and the parameters such as the width of localized zone are described quantitatively (Huang et al., 1990; Berthaud et al., 1997; Feng et al., 2021). Nowadays, the DIC method is widely being used in this type of research studies: insights by using DIC analysis into surface deformation of free-standing granite prisms with water continuously infiltrating from the upper surface for over 24 h under ambient laboratory environmental conditions were presented (Li et al., 2021). Pre-cracked specimen compression test was carried out by using DIC system, and the crack initiation and propagation of rocks with pre-existing cracks were discussed (Xi et al., 2020). The failure mechanism of the tunnel in soft rock subjected to surcharge loading with the DIC measurement, which revealed that the stress loosening zone in the tunnel roof is larger than that in the tunnel sidewall, was investigated (Huang et al., 2020). Evolutions of displacement strain fields and non-linear and localized deformation of the specimen are obtained by the 3D-DIC system (Seisuke et al., 2019). The measurement accuracy of 3D DIC by comparing with the traditional extensometer measurement results and the finite element simulation results was verified (Chen et al., 2017).
As an advanced non-destructive monitoring method, the DIC method is widely used in the field of rock mechanics because of its advantages of non-contact testing, low cost, high precision, and full field observation. So far, focusing on how to use that mean to characterize the failure process and energy evolution could be a vital link to evaluate the geohazard development, and it would create a bridge between energy dissipation and the broken law of rock mass. In this study, the DIC technology is utilized to capture the full field strain distribution so as to explore the rock failure from the perspective of energy evolution.
Methods and Materials
Experiment Setup
The uniaxial compression test is implemented, which includes the MTS electronic servo universal testing machine, GOM ARMIS three-dimensional digital speckle full field strain measurement system, and FBG strain acquisition system. MTS electronic servo universal test machine can carry out single-axis compression, stretching, shearing, splitting, and other tests of materials. The largest range is 50 KN, and the loading methods are displacement, strain, and force control. The FBG strain acquisition system consists of FBG sensor and optical demodulator. The GOM ARMIS 3D digital speckle full field strain measurement system is composed of two stable blue light sources, two 5-million-pixel CCD industrial cameras, a calibration system and a core software system (Figure 1).
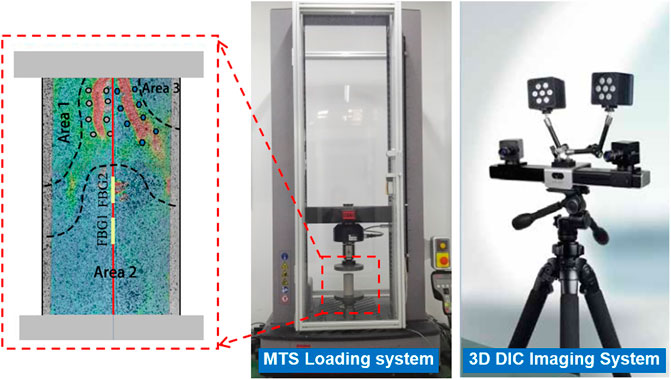
FIGURE 1. Measurement system of uniaxial loading experiment.
Measurement Principle of Digital Image Correlation Technology
The DIC technology has been widely used because of its advantages of non-contact acquisition of full field strain and displacement data. It solves the displacement field and strain field data of the measured object by comparing the reference image and the deformed image, calculating the matching degree between the deformed point P(X0, Y0) in the reference image and the square near the deformed image P′(X0′, Y0′), determining the displacement components ux and uy of the point P(X0, Y0) in the X and Y directions, and substituting in Eq. 2 to calculate the displacement of the deformed point P(X0, Y0) (Pan et al., 2006; Satoru et al., 2016). The basic principle can be illustrated in Figure 2, where P(X, Y) is the gray intensity of the reference image target subset, and P′(X′, Y′) is the gray intensity of the deformed image target subset.
According to Eq.3, the sub-pixel gray value of any position in any sub-set of the deformed image can be calculated, and the gray value of any point in the deformed image can be obtained (Pan et al., 2006).
The displacement calculated by Eq. 2 is taken as the initial value and substituted in Eq. 4 for iterative calculation. When the (uk+1-uk) is less than the threshold value, the displacement with an accuracy of 0.001 pixels and displacement gradient can be obtained.
where ∇ is the partial differential operator, ui is the number i component of displacement vector of u, uk is the number k iteration of displacement vector value of u, (uk+1−uk) is a correction value, and ∇C(uk) and ∇∇C(uk) are the Jacobian matrix and Hessian matrix, respectively.
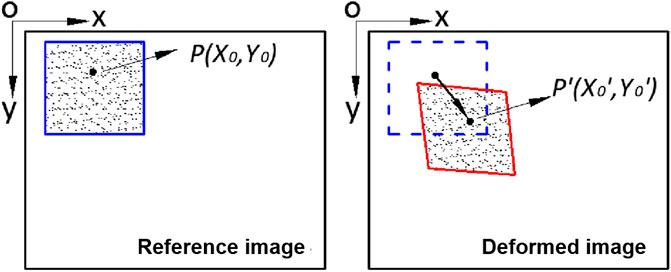
FIGURE 2. Basic principle of DIC.
The determination of subset size is related to speckle size, and it is generally believed that each subset should contain at least 3–5 speckles to improve the matching degree. The subset spacing has a direct influence on the number of speckle field data points. The smaller the subset spacing, the longer the calculation time, and the higher the strain field resolution. In this study, each black speckle has 5 pixels, so that the subset size is determined as 19 pixels with a subset spacing of 16 pixels to meet the requirement of measuring accuracy.
Preparation of Rock Specimen and Experiment Procedure
In order to summarize the damage energy evolution law of sandstone-like materials during uniaxial compression, three kinds of sandstone specimens were prepared with quartz sand, iron powder, barite powder, gypsum, and alcohol resin solution under different forming pressures. Quartz sand was used as the aggregate, iron powder and barite powder were used to improve the bulk density of materials, and resin and gypsum were used as the cementing agent and regulator, respectively. The material was weighed with a high-precision electronic balance, fully mixed, loaded into the mold, loaded to the design forming pressure at a speed of 50 N/s on the universal testing machine, and stabilized for 5 min. Finally, according to the standard for test methods of engineering rock mass (GBT 50266-2013), a cylindrical standard specimen with a height of 100 mm and a diameter of 50 mm is made (Figure 3). Table 1 shows the mechanical parameters of rock specimens and on-site sandstone.
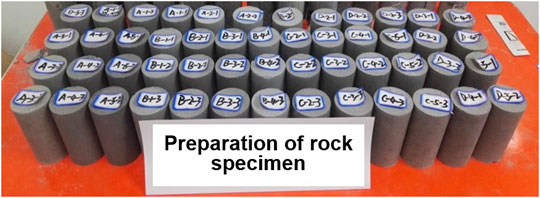
FIGURE 3. Rock specimen preparation.
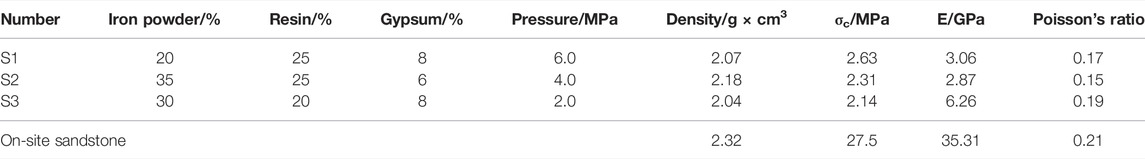
TABLE 1. Proportion and mechanical parameters of the specimen.
In order to verify the accuracy of DIC system test results, S1 rock specimen was taken as an example, two groups of FBG sensors were pasted to the axial center line of the specimen, the position of the installation area was adjusted, and an appropriate amount of glue was applied along the axial direction of the FBG (Figure 4). In order to avoid large light loss of optical fiber at both ends of the specimen, about 1 cm should be reserved for the optical fiber at both ends of the specimen. After the FBG sensor was pasted, the surface of the specimen was sprayed with white primer. After the primer was dry, black speckles were made.

FIGURE 4. Layout of DIC and FBG measurement.
The size of speckles in this test is 0.24–0.4 mm, and the speckle density is 50%. Before the uniaxial compression test, the fabricated specimen should be placed in the center of the pressure plate of the testing machine, and the bending and breaking of the FBG should be avoided during the placement process. The height of the tripod was adjusted so that the height of the camera is consistent with that of the specimen. The included angle and aperture of the camera was adjusted to make the specimen clear in the picture, and the focal lengths of the two cameras were made as consistent as possible. After the adjustment was completed, the test system was connected. At the beginning of the measurement, in order to ensure the synchronization of data acquisition of MTS, DIC, and FBG systems, the data acquisition frequency was set to 2 Hz.
The end face flatness of the specimen should be checked before the uniaxial compression test, which means the two end surfaces of the specimen should be polished with 0# sandpaper to ensure the flatness of the specimen conforms to the rock mechanics test specifications. Afterward, both the end surfaces are smeared with Vaseline to reduce the friction between the specimen and the loading head. Finally, the test chooses the displacement control principle with a loading speed of 1 mm/min.
Failure Characteristics of Rock Specimen
Comparative Analysis of Digital Image Correlation and Fiber Bragg Grating Measurement
The strain results of DIC 1 and DIC 2 in Figure 5 were extracted by DIC measurement data dealing with the least square regression method (LSR). The detailed operation is that the LSR method is used to obtain the strain distribution through the differential approximation function based on the local displacement region of the specimen. Assuming that the strain is uniform in the local area, the displacement can be expressed as a plane area, so that Eq. 1 can be obtained according to the LSR method.
Furthermore, the local strain can be calculated by differentiating Eq. 1
where u is the displacement; ε and γ are the strains; x, y, and z are the positions; and a, b, and c are the coefficients of spline function. By repeating the aforementioned process for the displacement of the observed area, the strain distribution of the whole field can be obtained. When the strain calculation window gets larger, the obtained strain data will be smoother.
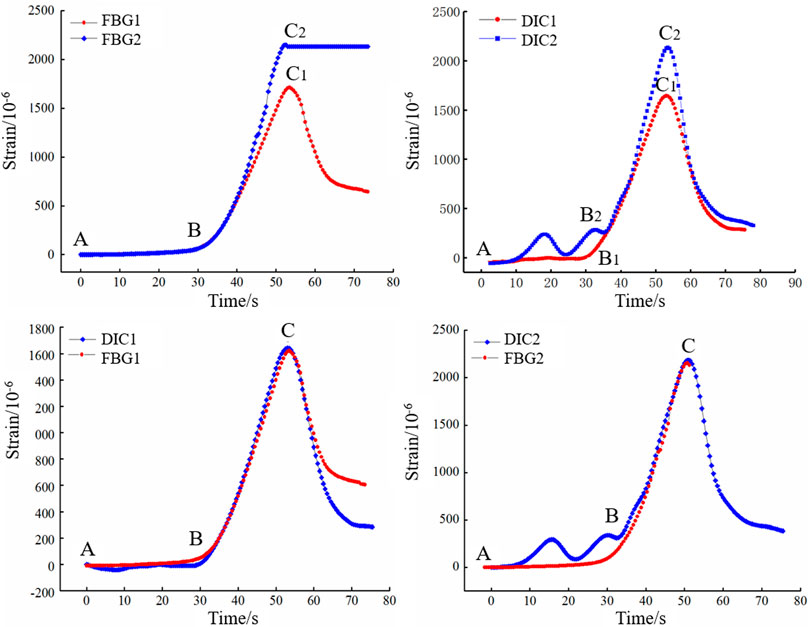
FIGURE 5. Comparison of strain distribution measured by DIC and FBG.
Two measuring lines DIC1 and DIC2 were set exactly the same as the FBG sensor in the DIC system (Figure 5), and the axial strain of the specimen measured by the FBG sensor and the DIC system was compared and analyzed.
As shown in Figure 4, in order to facilitate the analysis, the curve is divided into three sections: A, B, and C. In AB section, the strain data of FBG1 and FBG2 are smooth and consistent; the strain value of DIC1 fluctuates slightly, but the trend is consistent with that of FBG1. The large fluctuation of DIC2 data is mainly due to the small strain at the initial stage of specimen loading and the influence of noise on the DIC system. From point B, the strain of FBG1 and FBG2 increases rapidly with time and increases approximately linearly. It reaches the peak strain at point C. The strain measured by FBG2 is significantly greater than that of FBG1. This difference is mainly caused by the uncoordinated deformation of the specimen during uniaxial compression. At this stage, the strain curves of DIC1 and DIC2 are very close to those of FBG1 and FBG2, and the peak strains measured by DIC1 and FBG1 are 1712 με and 1644 με, respectively. The relative deviation is 3.9%, and the peak strains measured by DIC2 and FBG2 are 2190
Stress–Strain Analysis of Uniaxial Compression Test
The typical stress–strain curve of specimen S1–S3 and the actual state of specimen at points O, A, B, C, and D during deformation and failure are illustrated in Figure 6.
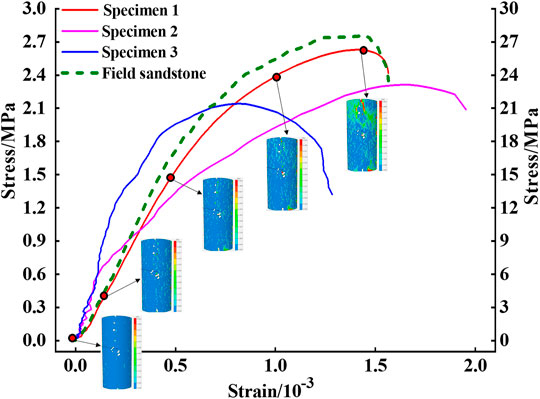
FIGURE 6. Stress–strain curve of uniaxial compression.
The original open cracks and micropores in the OA section specimen gradually close with the increase of stress, forming an early non-linear deformation stage, and the curve is concave as a whole. The specimen of the AC section changes from elastic deformation to elastic–plastic stage, where the specimen has an elastic deformation stage after compaction. After point B, the microcracks in the specimen begin to sprout and develop stably. The unstable microcracks in the specimen of the CD section develop rapidly after point C, and gradually form open cracks visible to the naked eye. After point D, the specimen is damaged and the stress decreases gradually.
The uniaxial compressive strength of specimens S1, S2, and S3 is about 2 MPa. The stress increases gradually with the increase of strain. After reaching the peak value, the stress decreases rapidly. It has obvious brittleness characteristics and is similar to field sandstone, indicating that the prepared rock material has good mechanic performance, which can be analyzed further.
Deformation Process Analysis
Five key points O, A, B, C, and D in the S1 stress–strain curve of the specimen are selected to analyze the displacement and strain evolution process of the specimen in the process of uniaxial compression. According to the radial displacement evolution process of specimen S1 in Table 2, in the compaction section OA, the radial displacement of the specimen as a whole is evenly distributed, and the specimen is uniformly deformed. With the increase of load, at point B, the upper end of the specimen moves left and right inconsistently, showing a trend of small left and large right. The specimen of the BC section enters the non-linear deformation stage. When it reaches point C, the upper end of the specimen moves left and right inconsistently, showing a trend of accelerated development. With the further increase of load, the radial displacement of the specimen in the CD section continues to increase. At point D, there is a significant difference between the left and right displacement of the upper end face of the specimen. There is a large displacement difference between the blue–green junction and the red–green junction, and there are two obvious displacement mutation bands (DMB). Compared with the actual photos of the specimen, it can be found that the position of the displacement sudden change zone is the same as that of the macrocrack in the final failure of the specimen. Therefore, the evolution diagram of radial displacement can clearly reflect that the specimen begins to have non-uniform deformation in the radial direction from point B. Two obvious abrupt bands of radial displacement show that the upper end of the specimen is obviously subjected to tension, which leads to macrocracks and final failure.
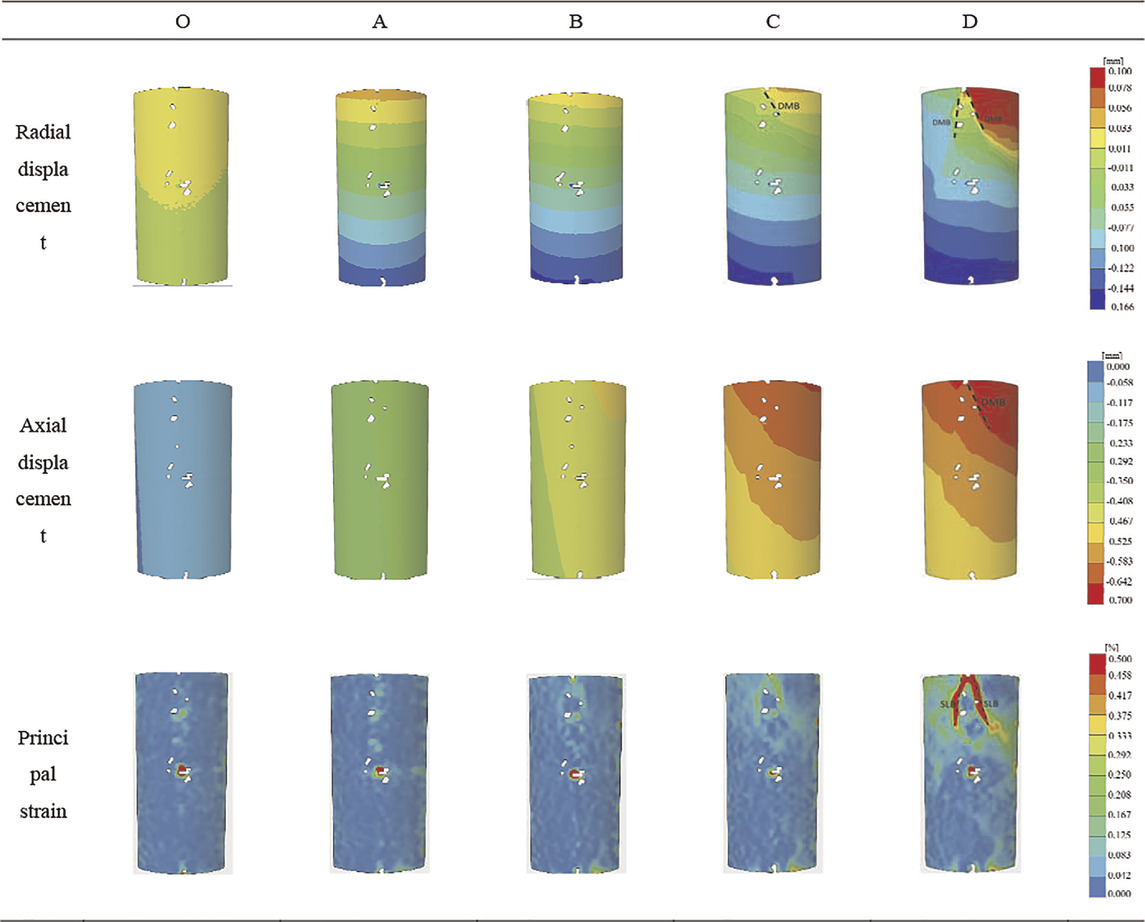
TABLE 2. Displacement and strain development of rock specimen S1.
According to the evolution process of S1 axial displacement in Table 2, the axial displacement field of the specimen in the OA section is evenly distributed, the specimen in the AB section gradually enters the linear elastic stage, and the axial displacement field increases uniformly. In the displacement field of point B, there is an uneven phenomenon that the axial displacement on the right side of the specimen is greater than that on the left side, entering the non-linear deformation stage. The axial displacement of the BC section specimen continues to increase, showing the phenomenon of small at the lower left and large at the upper right. The deformation of the specimen in the CD section accelerates, and the upper end of the specimen moves to D, showing a zoning phenomenon of small on the left and large on the right. The shear action of the specimen decreases gradually from top to bottom and from right to left.
Therefore, the axial displacement evolution diagram can clearly reflect that the axial displacement at the right end of the specimen is large, and shear cracks are generated along the junction of the red and orange areas, which is consistent with the development of S1 crack of the specimen. The crack development of the specimen can be predicted by the evolution of the axial displacement field.
Based on the evolution process of S1 principal strain in Table 2, small strain localization band (SLB) appears on the surface of the specimen in OA and AB sections, and the SLB are relatively dispersed. In the BC section, each SLB is gradually connected to form a larger band. At point D, two obvious SLBs have been formed in the upper part of the specimen. The deformation of the CD section specimen and the SLB accelerates. Two SLBs are formed at the upper end of the specimen, which gradually become wider and longer, and the SLB at the other positions are gradually connected into a network and staggered distribution. At point D, two obvious SLBs have been formed, and the strain concentration of the right SLB at the upper end is greater than that of the left.
Analysis of Energy Evolution Characteristics
Analysis Method of Releasable Elastic Strain Energy
Uniaxial compression deformation of specimens is a process of strain accumulation and release failure accompanied by energy evolution. Based on the analysis of the energy evolution theory, the full field strain and displacement data are obtained by DIC technology, and the failure of the specimen is explored from the perspective of energy. There is a clear SLB in the deformation process of the specimen.
According to the position of SLB, the study area of specimen S1–S3 is divided, and the medium in this area basically remains in an elastic state (Pan et al., 2002). The primary and secondary strain values of each area of the specimen are extracted, and the evolution process of the elastic strain energy that can be released from the surface area during the deformation of the specimen is calculated from Eq. 7 (Song et al., 2012).
where Ue is the releasable elastic strain energy; E and ν are the elasticity modulus and Poisson ratio, respectively; and ε1 and ε2 are the main strains of the rock specimen.
Analysis of Elastic Strain Energy Evolution
Elastic Strain Energy Evolution of S1 Specimen
The principle of elastic area dividing is based on the development of SLB during loading. The elastic area is determined by the SLB of the specimen. The strain in the SLB has the largest strain distribution, and will first enter into plastic deformation, that is, the deformation in this region is much larger than other positions of the specimen. Therefore, the elastic region can be divided by marking the place outside the strain localization zone.
As a result, the energy analysis area is divided according to the position of SLB during loading, and the specimen S1 is divided into three elastic areas (Figure 7). The average principal strain values in two directions of each area during loading are extracted, and the elastic strain energy of each area is calculated. Specimen S1 is taken as an example, and the same five key points O, A, B, C, and D on the stress–strain curve are selected for analysis (Figure 8) also the elastic strain energy density in different specimen region are shown in Table 3.
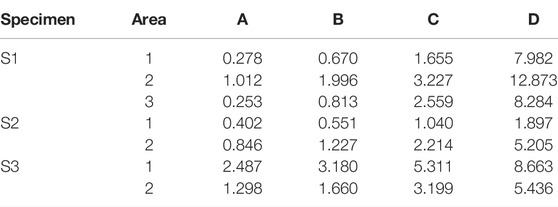
TABLE 3. Elastic strain energy density in different specimen regions (kJ/m3).
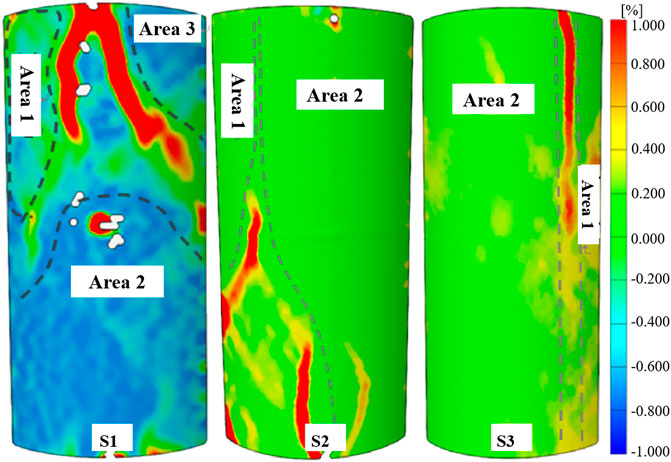
FIGURE 7. Region division of rock specimen.
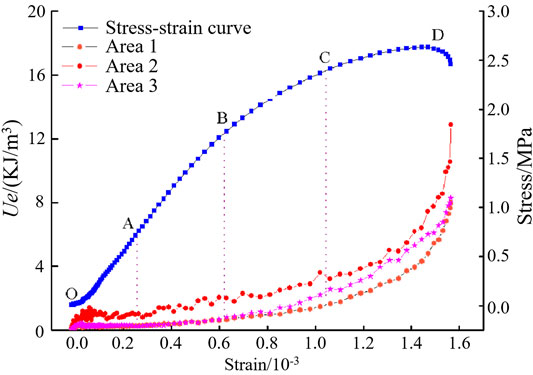
FIGURE 8. Elastic strain energy evolution of S1 specimen.
In the OA section, the micropore and crack gradually compacted section, with a maximum axial stress of 0.21σc. The main strain in the three regions is small, most of the input energy is dissipated, and the elastic strain energy accumulation gets to be stable. The elastic strain energy densities in regions 1–3 are 0.278, 1.012, and 0.253 kJ/m3, respectively.
In the AB section, the linear elastic deformation section, the maximum axial stress is 0.65σc. The main strain on the surface of the specimen is sporadically distributed, and most of the input energy is transformed into elastic strain energy. The elastic strain energy in three regions increases steadily, and the elastic strain energy densities in regions 1–3 are 0.670, 1.996, and 0.630 kJ/m3, respectively.
In the BC section, the elastoplastic deformation section, the maximum axial stress is 0.93σc. The main strain concentration areas on the specimen surface are connected with each other, the SLB becomes clear from fuzzy, the elastic strain energy continues to increase, the elastic strain energy at local positions reaches the surface energy, the elastic strain energy is released, and the strain concentration phenomenon occurs. The elastic strain energy densities in areas 1–3 are 1.655, 3.227, and 1.062 kJ/m3, respectively.
In the CD section, in the plastic deformation stage, the axial stress reaches the peak, the main strain concentration becomes higher and higher, and the SLB is staggered. With the continuous input of energy, the elastic strain energy in the three regions accelerates to accumulate, the number of unit rock mass at the localization band that reaches the surface energy is more and more, the damage evolution of the specimen is accelerated, and the damage is more and more serious. The elastic strain energy densities in areas 1–3 are 7.982, 12.873, and 8.284 kJ/m3, respectively. It is found that in the same stage, there is a certain difference in the strain concentration and elastic strain energy accumulation in regions 1–3, which is mainly caused by the uneven deformation in the process of uniaxial compression deformation.
Through the aforementioned analysis, the evolution process of strain energy in the elastic region before the load reaches the peak is divided into three stages:
1) OA section can release elastic strain energy in a stable stage. At this stage, most of the energy input by the specimen is dissipated, the releasable elastic strain energy absorbed in the unit rock mass is less, and the releasable strain energy is in a stable state.
2) AC section can release the linear growth stage of elastic strain energy. With the continuous increase of load, the elastic strain energy of unit rock mass is in the stable growth stage, and the releasable strain energy in the specimen continues to grow. The elastic strain energy of some unit rock mass reaches the surface energy, and the elastic strain energy is released, resulting in strain concentration, but the concentration degree is small, and the specimen is damaged.
3) CD section can release elastic strain energy and accelerate the growth stage. With the continuous input of energy, the releasable strain energy of unit rock mass continues to accumulate, the number of unit rock mass reaching the surface energy is more and more, the damage evolution of the specimen is accelerated, and the damage is more and more serious. When the maximum load point D is reached, the number of releasable strain energy of single rock mass in the strain concentration area of unit rock mass in areas 1–3 increases sharply, and the elastic strain energy release shows an obvious SLB.
Elastic Strain Energy Evolution of S2 and S3 Specimen
The strain data extracted based on DIC technology and the theory of releasable strain energy can better describe the damage process of the specimen. Next, the evolution process of releasable strain energy during uniaxial compression of S2 and S3 is briefly analyzed by using the analysis method of S1. The division of the area outside the SLB of S2 and S3 at the peak stress is shown in Table 2.
Before reaching the peak load, the evolution trend of the releasable elastic strain energy in each region of S2 and S3 is similar to that of S1 (Figures 9, 10). The evolution process of the releasable elastic strain energy in each region of S2 and S3 can also be divided into three stages: stable stage OA, linear growth stage AC, and accelerated growth stage CD.
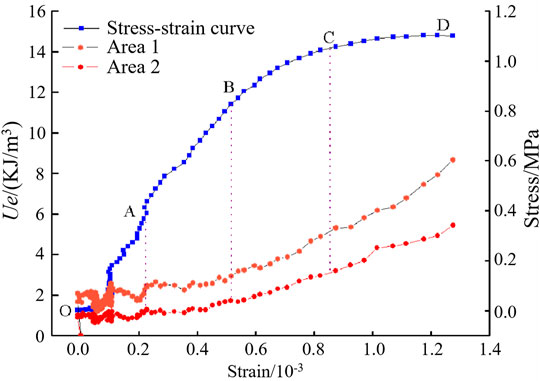
FIGURE 9. Elastic strain energy evolution of S2 specimen.
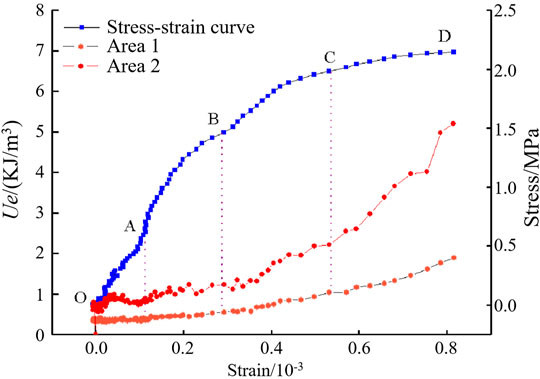
FIGURE 10. Elastic strain energy evolution of S3 specimen.
In the stable stage of releasable elastic strain energy OA, the S2 and S3 are in the compaction stage as a whole, the defects are gradually compacted, most of the input energy is dissipated, and only a small part is stored in a very small amount of unit rock mass as releasable strain energy. The overall stored energy of this stage is low, and the releasable elastic strain energy in each area is less than 2 kJ/m3.
In the AC section of the linear growth stage of the releasable strain energy, S2 and S3 gradually enter the elastic deformation stage. Most of the input energy is transformed into releasable elasticity energy that stored in the unit rock mass, and its energy value is less than which of the surface energy, which has little impact on the apparent strain, and the damage of the is small and occurs in the interior of the.
In the accelerated growth stage of releasable strain energy CD, S2 and S3 transition to elastic–plastic deformation, and the input energy continues to be transformed into releasable elastic strain energy. At this time, the releasable elastic strain energy in unit rock mass accumulates more, the releasable strain energy of some unit rock mass reaches surface energy, the damage evolves from interior to surface, and there is an obvious SLB on the surface.
Based on the global strain data obtained by DIC, the damage evolution process of specimens S1, S2, and S3 is analyzed to describe the damage process from the perspective of energy. Before reaching the peak load, the evolution process of releasable elastic strain energy can be divided into three stages: stable stage, linear growth stage, and accelerated growth stage.
Conclusion
1) The axial strain of the sandstone rock specimen measured by the FBG sensor and DIC system is compared. The strain–time curves of specimens measured by DIC and FBG sensors are consistent, and the relative deviation of peak strain is less than 5%, which verifies the accuracy and applicability of the DIC system.
2) The non-conforming deformation evolution process of radial and axial displacement fields during uniaxial compression of S1 is analyzed. It shows that the evolution analysis of the displacement field can predict the development of crack and deformation failure form of S1.
3) The evolution of radial displacement shows that the specimen begins to have non-uniform deformation from point B. Two obvious abrupt bands of radial displacement show that the upper end of the specimen is obviously subjected to tension, which leads to macrocracks and final failure.
4) Based on DIC full field test and rock energy theory, the energy evolution process of the elastic region in the process of uniaxial compression is revealed. From the perspective of elastic strain energy density evolution, there are three stages: elastic strain energy stability stage, elastic strain energy linear growth stage, and elastic strain energy accelerated growth stage. It corresponds to the compaction stage, elastic–plastic deformation stage, and unstable fracture stage of the specimen.
Data Availability Statement
The original contributions presented in the study are included in the article/Supplementary Material, further inquiries can be directed to the corresponding authors.
Author Contributions
LW wrote the first draft of the manuscript. QY and YR wrote sections of the manuscript. QY and DJ contributed to conception and design of the study. YL and DZ organized the database. YZ and SR performed the statistical analysis. All authors contributed to manuscript revision, read, and approved the submitted version.
Funding
This work was funded by the National Natural Science Foundation of China, grant number 51804052, 51804244 and 51834003; the Natural Science Foundation of Chongqing, China, grant number CSTC2019JCYJ-BSH0088; and the Special Key Project of Chongqing Technology Innovation and Application Development, grant number cstc2019jscx-tjsbX0015.
Conflict of Interest
The authors declare that the research was conducted in the absence of any commercial or financial relationships that could be construed as a potential conflict of interest.
Publisher’s Note
All claims expressed in this article are solely those of the authors and do not necessarily represent those of their affiliated organizations, or those of the publisher, the editors, and the reviewers. Any product that may be evaluated in this article, or claim that may be made by its manufacturer, is not guaranteed or endorsed by the publisher.
References
Berthaud, Y., Torrenti, J. M., and Fond, C. (1997). Analysis of Localization in Brittle Materials through Optical Techniques. Exp. Mech. 37 (2), 216–220. doi:10.1007/bf02317862
Chen, Y., Sun, S., and Ji, C. (2017). Development and Application of 3D Digital Image Correlation (3D DIC) in Deformation Measurement of Materials. J. Aeronaut. Mater. 37 (4), 90–100.
Feng, P., Xu, Y., and Dai, F. (2021). Effects of Dynamic Strain Rate on the Energy Dissipation and Fragment Characteristics of Cross-Fissured Rocks. Int. J. Rock Mech. Mining Sci. 138, 104600. doi:10.1016/j.ijrmms.2020.104600
Feng, P., Zhao, J., Dai, F., Wei, M., and Liu, B. (2021). Mechanical Behaviors of Conjugate-Flawed Rocks Subjected to Coupled Static-Dynamic Compression. Acta Geotech., doi:10.1007/s11440-021-01322-6
Gong, F., song, L., Li, X., and Yan, J. (2018). Linear Energy Storage and Dissipation Rule of Red sandstone Materials during the Tensile Failure Process. Chin. J. Rock Mech. Eng. 237 (02), 352–363.
Huang, F., Wu, C., Jang, B., Hong, Y., Guo, N., and Guo, W. (2020). Instability Mechanism of Shallow Tunnel in Soft Rock Subjected to Surcharge Loads. Tunnelling Underground Space Tech. 99 (103350), 1–12. doi:10.1016/j.tust.2020.103350
Huang, J., Chen, G., Zhao, Y., and Wang, R. (1990). An Experimental Study of the Strain Field Development Prior to Failure of a marble Plate under Compression. Tectonophysics 175 (1-3), 269–284.
Jiang, D., Xie, K., Jiang, X., Chen, J., and Yuan, Xi. (2016). Statistical Analysis of Acoustic Emission Energy Distribution during Uniaxial Compression of Shale. Chin. J. Rock Mech. Eng. S2, 3822–3828.
Jing, C., Yuan, Q., Wang, S., Yi, L., and Zhang, L. (2015). Detection and Representation of Mining-Induced Three Horizontal Zones Based on Fiber Bragg Grating Sensing Technology. J. China Univ. Mining Tech. 44 (6), 971–976.
Jing, C., Yuan, Q., Yi, L., Zhang, D., and Qi, L. (2016). Experimental Study on Overlying Strata Deformation Based on Distributed Optical Fiber Sensing. Chin. J. Rock Mech. Eng. S2, 3589–3596.
Li, Y., Leith, K., Perras, M. A., and Löw, S. (2021). Digital Image Correlation–Based Analysis of Hygroscopic Expansion in Herrnholz Granite. Int. J. Rock Mech. Mining Sci. 146, 1–14. doi:10.1016/j.ijrmms.2021.104859
Liu, Z., Wang, W., Luo, J., and Guanghong, M. (2020). Method of Energy Evolution of Rock under Uniaxial Compression Test. J. China Coal Soc. 45 (9), 3131–3139.
Ma, S., Liu, S., and Zhao, Y. (2006). Gray Correlation of Digital Images from Loaded Rock Specimen Surface to Evaluate its Damage Evolution. Chin. J. Rock Mech. Eng. 3, 590–595.
Miao, S., Liu, Z., Zhao, X., and Huang, Z. (2021). Energy Dissipation and Damage Characteristics of Beishan Granite under Cyclic Loading and Unloading. Chin. J. Rock Mech. Eng. 40 (5), 928–938.
Mikhalyuk, A. V., and Zakharov, V. V. (1997). Dissipation of Dynamic-Loading Energy in Quasi-Elastic Deformation Processes in Rocks. J. Appl. Mech. Tech. Phys. 38 (2), 312–318. doi:10.1007/bf02467918
Okubo, S., Tang, Y., Jiang, X., Peng, S., Chen, C., and Yan, Z. (2019). Application of 3D-DIC System in Rock Mechanic Test. Rock Soil Mech. 40 (8), 3263–3273.
Pan, B., Xie, H., Xu, B., and Dai, F. (2006). Performance of Sub-pixel Registration Algorithms in Digital Image Correlation. Meas. Sci. Tech. 17 (6), 1615.
Pan, Y., Yang, X., Ma, S., and Xu, B. (2002). Experimental Study on Deformation Localization of Geotechnical Materials. J. China Coal Soc. 3, 281–284.
Ren, J., Ge, X., Pu, Y., Ma, W., and Zhu, Y. (2000). Preliminary CT Real-Time Analysis of Rock Unloading Damage Evolution Mechanism. Chin. J. Rock Mech. Eng. 6, 697–701.
Ren, J., and Ge, X. (2001). Study on Meso Mechanism and Constitutive Model of Rock Damage Evolution under Uniaxial Compression. Chin. J. Rock Mech. Eng. 4, 425–431.
Schmidt-Hattenberger, C., Naumann, M., and Borm, G. (2003). Fiber Bragg Grating Strain Measurements in Comparison with Additional Techniques for Rock Mechanical Testing. IEEE Sensors J. 3 (1), 50–55. doi:10.1109/jsen.2003.809025
Song, D., Wang, E., Li, Z., Liu, J., and Xu, W. (2015). Energy Dissipation of Coal and Rock during Damage and Failure Process Based on EMR. Int. J. Mining Sci. Tech. 25 (5), 787–795. doi:10.1016/j.ijmst.2015.07.014
Song, Y., Jiang, Y., Ma, S., Yang, X., and Zhao, T. (2012). Evolution of Deformation fields and Energy in Whole Process of Rock Failure. Rock Soil Mech. 33 (5), 1352–1365.
Steffler, E. D., Epstein, J. S., and Conley, E. G. (2003). Energy Partitioning for a Crack under Remote Shear and Compression. Int. J. fracture 120 (4), 563–580. doi:10.1023/a:1025511703698
Sujatha, V., and Kishen, J. M. C. (2003). Energy Release Rate Due to Friction at Bimaterial Interface in Dams. J. Eng. Mech. 129 (7), 793–800. doi:10.1061/(asce)0733-9399(2003)129:7(793)
Wang, G., Wen, X., and Zhang, L. (2020). Dip Effect of Energy Evolution Mechanism of Jointed sandstone under Uniaxial Compression. J. Cent. South Univ. (Science Technology) 51 (7), 1913–1923.
Wang, X., Hou, w., Pan, Y., and Dong, W. (2018). Experiments of Strain Localization Processes of Coal Specimens in Uniaxial Compression Based on the Digital Image Correlation Method. J. China Coal Soc. 43 (4), 984–992.
Xi, X., Wu, X., Guo, Q., and Cai, M. (2020). Experimental Investigation and Numerical Simulation on the Crack Initiation and Propagation of Rock with Pre-existing Cracks. IEEE Access 8, 636–644. doi:10.1109/access.2020.3009230
Xie, H., Peng, R., Yang, J., and Zhou, H. (2005). On Energy Analysis of Rock Failure. Chin. J. Rock Mech. Eng. 24 (15), 2603–2608.
Xie, H., Li, L., Peng, R., and Ju, Y. (2009). Energy Analysis and Criteria for Structural Failure of Rocks. J. Rock Mech. Geotechnical Eng. 1 (1), 11–20. doi:10.3724/sp.j.1235.2009.00011
Yang, Y. W., Bhalla, S., Wang, C., Soh, C. K., and Zhao, J. (2007). Monitoring of Rocks Using Smart Sensors. Tunnelling Underground Space Tech. 22 (2), 206–221. doi:10.1016/j.tust.2006.04.004
Yoneyama, S. (2016). Basic Principle of Digital Image Correlation for In-Plane Displacement and Strain Measurement. Adv. Compos. Mater. 25 (2), 105–123. doi:10.1080/09243046.2015.1129681
Zhang, Z., and Gao, F. (2012). Experimental Research on Energy Evolution of Red sandstone Samples under Uniaxial Compression. Chin. J. Rock Mech. Eng. 31 (5), 953–962.
Zhang, Z., and Gao, F. (2012). Research on Nonlinear Characteristics of Rock Energy Evolution under Uniaxial Compression. Chin. J. Rock Mech. Eng. 31 (6), 1198–1207.
Keywords: rock material, failure mechanics, DIC, strain, energy evolution
Citation: Wei L, Yuan Q, Ren Y, Jiang D, Zhang D, Liu Y, Zou Y and Ren S (2022) Analysis of Failure Mechanics and Energy Evolution of Sandstone Under Uniaxial Loading Based on DIC Technology. Front. Earth Sci. 10:814292. doi: 10.3389/feart.2022.814292
Received: 13 November 2021; Accepted: 28 February 2022;
Published: 08 April 2022.
Edited by:
Xuanmei Fan, Chengdu University of Technology, ChinaReviewed by:
Peng Feng, Chengdu University, ChinaJinwang Zhang, China University of Mining and Technology, China
Jing Xie, Sichuan University, China
Copyright © 2022 Wei, Yuan, Ren, Jiang, Zhang, Liu, Zou and Ren. This is an open-access article distributed under the terms of the Creative Commons Attribution License (CC BY). The use, distribution or reproduction in other forums is permitted, provided the original author(s) and the copyright owner(s) are credited and that the original publication in this journal is cited, in accordance with accepted academic practice. No use, distribution or reproduction is permitted which does not comply with these terms.
*Correspondence: Qiang Yuan, cWlhbmd5dWFuQGNxdS5lZHUuY24=; Deyi Jiang, ZGV5aWpAY3F1LmVkdS5jbg==