 Guidong Ping
 Xin Liu1
94% of researchers rate our articles as excellent or good
Learn more about the work of our research integrity team to safeguard the quality of each article we publish.
Find out more
METHODS article
Front. Earth Sci. , 06 April 2022
Sec. Structural Geology and Tectonics
Volume 10 - 2022 | https://doi.org/10.3389/feart.2022.812874
This article is part of the Research Topic Advances in the Study of Natural Fractures in Deep and Unconventional Reservoirs View all 29 articles
Paleostress plays an important role in controlling the formation and distribution of reservoir fractures, which is a key factor controlling the production of oil and gas from unconventional reservoirs. At present, there are many methods to perform paleostress inversion, but these methods are mainly based on outcrop or directional core data, which are not easily available in the oil and gas industry, which mainly focuses on the study of underground geological structures. In this study, we use 3D seismic reflection data for the first time to perform slip-tendency-based stress inversion to determine the stress field of the Xicaogu area in the Bohai Bay Basin during the Neogene period. This slip-tendency-based stress inversion method is based on the analysis of slip tendency and fault throw and does not require the measurement of slip directions. The data for this method can easily be extracted from data sets routinely used in the oil and gas industry. The inversion results show that in the study area and the strata of interest, the maximum principal stress axis (σ1) is oriented vertically, the intermediate principal stress axis (σ2) is oriented N70o, the minimum principal stress (σ3) is oriented N160o, and σ2/σ1 = 0.69 and σ3/σ1 = 0.27. The results of this study serve as an important reference to clarify fault reactivation at the critical stage of hydrocarbon accumulation.
The contribution of unconventional reservoirs to global oil and gas production has made it important to address the main factors controlling the production of oil and gas from these reservoirs (Khair et al., 2013, 2015). Natural fractures are amongst the key factors used to find sweet spots in unconventional reservoirs (Gong et al., 2021). Rocks may have been subjected to a tremendous diversity of stress magnitudes and orientations during their tectonic history which might have caused rock failure and generated fractures; therefore, paleostress reconstruction is essential for accurate fracture prediction. Furthermore, paleostress reconstruction is an important method to study the tectonic evolution of a region (Jamison, 1992; Van der Pluijm et al., 1997). Paleostress field analysis is helpful to explain fault reactivation (Gartrell and Lisk, 2005; Kulikowski and Amrouch, 2018), the timing and patterns of fault leakage (Du Rouchet, 1981; Gartrell and Lisk, 2005; Henk, 2005), and to identify potential instability precursors (Igwe and Okonkwo, 2016).
At present, the widely used paleostress inversion methods are fault-slip data inversion (Etchecopar et al., 1981; Angelier, 1984; Célérier, 1988; Yamaji, 2000; Zalohar and Vrabec, 2010; Hansen, 2013) and calcite e-twin inversion (Turner, 1953; Spang, 1972; Lacombe, 2001; Lacombe et al., 2007; Kulikowski and Amrouch, 2017). However, these methods require the presence of outcrops and oriented core data. Those data are generally not available in the oil and gas industry. Oil field operators and geologists are often only concerned about underground geological structures and they obtain structural data through seismic data interpretation; this subsurface structural data usually does not have a related field outcrop.
Recently, a slip-tendency-based stress inversion method was introduced by McFarland et al. (2012). The methodology is based on slip tendency and fault displacement, which allows for the reconstruction of the paleostress state using fault displacement data without reference to slip directions. The inversion approach has been demonstrated using data sets obtained from outcrops (Morris et al., 2016; Ferrill et al., 2020), but has not been applied to seismic data. In this study, we use seismic data for the first time to apply the slip-tendency-based stress inversion method. The method was used to reconstruct the paleostress tensor of the Xicaogu area in the Shulu Sag of the Bohai Bay Basin. The inversion results can be used to analyze regional tectonic evolutions, and serve as an important reference to clarify fault reactivity at the critical stage of hydrocarbon accumulation.
The slip tendency (Ts) of a fault is defined as the ratio of the shear stress (τ) to the normal stress (σn) on the fault’s surface (Morris et al., 1996):
If this ratio equals or exceeds the coefficient of static friction (μs), there is a high probability that the fault will slip (Collettini and Trippetta, 2007).
In this study, we derived the equation of extensional regimes. Assuming three principal stresses σ1>σ2>σ3 in space, according to the Anderson model, it is considered that the Earth’s surface is a principal stress plane (that is, a plane with zero shear stress), so there is a principal stress axis perpendicular to the ground.
In the extensional deformation environment, the maximum principal stress axis (σ1) is vertical and the intermediate principal stress axis (σ2) and the minimum principal stress axis (σ3) are horizontal. If the orientation and magnitude of the principal stress are known, the shear stress and normal stress acting on the fault’s surface can be written as:
where l, m, and n are the direction cosines of the normal to the fault plane.
In practical applications, fault planes are generally described by their geographical orientation (such as dip and dip angle), therefore, coordinate transformation is required. In the geographic coordinate system (X, Y, and Z represent north, east, and down) (Figure 1), the direction cosines of the normal to the fault plane are:
where δ is the plunge of the normal to the fault plane and λ is the angle between the dip orientation of the fault plane and the trend of σ3。
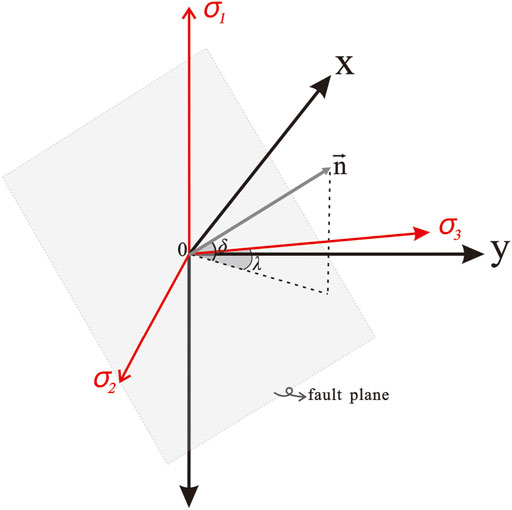
FIGURE 1. A fault plane in a geographic coordinate system (x, y, and z), with z pointing down, x pointing north, and y pointing east. The angle δ is the plunge of the fault′s normal and λ is the angle between the dip orientation of the fault plane and the trend of σ3. The coordinate system (red arrow) is parallel to the principal stresses σ1, σ2, and σ3 in the extensional environment, respectively. σ1 is vertical and σ2 and σ3 are horizontal.
If the orientation and magnitude of the principal stresses are known, the shear stress and normal stress acting on the fault surface can be written using Equation 2 and Equation 3 as follows:
When Equation 7 and Equation 8 are combined, the slip tendency in the geographic coordinate system can be obtained as follows:
Where, k1 = σ2/σ1 and 0 < k1 < 1, k2 = σ3/σ1 and 0 < k2 < 1, δ is the plunge of the normal of the fault plane, and λ is the angle between the dip orientation of the fault plane and the orientation of σ3.
Slip tendency values allow for the assessment of the likelihood and direction of slip on a fault’s surface. A higher slip tendency value means there is a greater possibility of fault reactivation, and that as time passes, there will be more sliding along the fault. Therefore, faults with higher slip tendency values will accumulate larger fault displacements than those with low slip tendency. However, there are also special cases, where faults with high slip tendency only slip during the late stage of their deformation history or have their slip activity suppressed in the stress shadow of a larger slip surface nearby; therefore, faults with a high slip tendency may have a variety of fault displacement values from high to low. Therefore, slip tendency can be used as a proxy for fault displacement (McFarland et al., 2012).
The stress inversions technique evaluates the ability of a candidate stress tensor to explain the pattern of displacement on surfaces of different orientations by quantifying the degree of agreement between the computed slip tendency values of the stress tensor and the corresponding measured displacement values for a set of observed surfaces (Morris et al., 2016). Stress inversion is the process of finding the stress state that optimizes this measure of agreement with the inverted stress tensor that best fits the fault displacement data. The nonlinear least squares method is utilized to obtain the “best-fit’’ stress tensor (McFarland et al., 2012).
The faults of the study areas are mostly planar faults, so it was assumed that fault throw could be taken as a proxy for displacement. The composite workflow for this study is given in Figure 2. The approach includes the following steps:
(1) interpretation of the 3D seismic depth-converted data
(2) fault kinematics (fault orientations and throws)
(3) Selection of the candidate stress state and using the selected stress state to calculate slip tendency values for each faults
(4) Calculation of deviation values between the slip tendency values and the corresponding measured throw values for a set of observed faults
(5) Repeating steps 3 and 4 for a complete set candidate stress
(6) Determining the stress state that minimizes the deviation value.
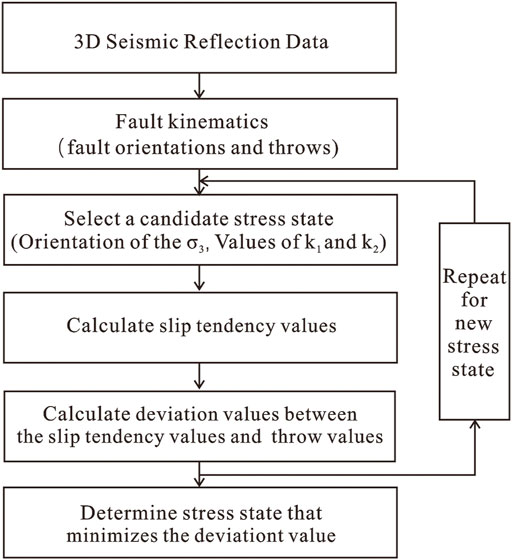
FIGURE 2. The composite workflow for this study.
As a result, the paleostress fields (orientation of the principal stresses and shape of the stress ellipsoid) are estimated.
The Shulu Sag, which is located in the south-western corner of the Jizhong depression in the Bohai Bay Basin of China (Figure 3), is an elongate half-graben basin. It covers 300 km2 and was formed from the downthrow of the hanging wall of the Xinhe fault, which is located on the eastern side of the basin and played a major role in the basin evolution (Jiang et al., 2007). The Shulu Sag can be divided simply into three tectonic belts based on its tectonic subsidence history: the gentle slope (Western slope), the steep slope (Eastern slope), and the Trough belt, which includes the northern, middle, and southern troughs (Ren et al., 2019; Jiang et al., 2018). The gentle slope can be further divided into fold structure areas such as the Nanxiaochen area, the Taijiazhuang area, the Xicaogu area, and the Leijiazhuang area (Figure 4A). The Shulu Sag unconformably overlies the Cambrian–Ordovician and Permian–Carboniferous basement and is filled with Eocene to Pliocene lacustrine deposits. From bottom to top, the Cenozoic strata in this area are the Paleogene Shahejie Formation, the Dongying Formation, the Neogene Guantao Formation, and the Minghuazhen Formation (Figure 4B).
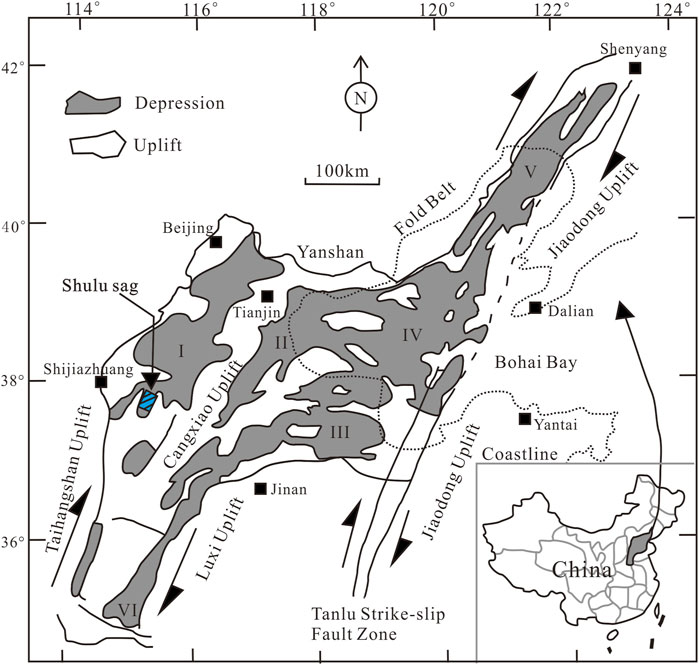
FIGURE 3. Tectonic setting of the Bohai Bay Basin (Jiang et al., 2007). The Shulu sag (the blue area in the figure) is located in the southwestern corner of the Jizhong depression (I). Other sub-basins include the Huanghua depression (II), Jiyang depression (III), Bozhong depression (IV), Liaohe depression (V), and Dongpu depression (VI) (modified after Jiang et al., 2007).
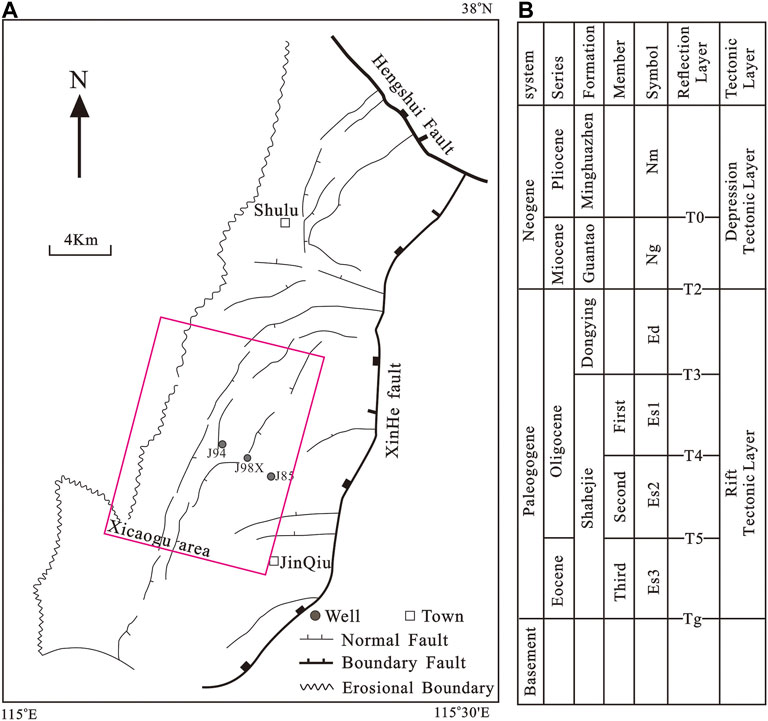
FIGURE 4. (A) Location map of the Shulu Sag. The red border represents the location map of the Xicaogu area. (B) Stratigraphic systems of the Shulu sag.
The Shulu Sag has undergone three structural evolution stages: 1) the initial rift stage occurred during the early Paleogene; the rifting was attributed to NW–SE regional extension induced by mantle convection (Tian et al., 1992; Li et al., 2010), India–Eurasia collision (Yin, 2000; Liu et al., 2004) or by roll-back of the subducted Pacific Plate (Zhang et al., 2003; Schellart and Lister, 2005). Under the NW extensional stress field, the Shulu Sag formed a half-graben structure and mainly deposited the strata from the third member of the Shahejie Formation to the second member of the Shahejie Formation. 2) The intensive rift stage is recorded from the first member of the Shahejie Formation to the sedimentary period of the Dongying Formation, The direction of the extensional stress changed to near SN orientation, mainly forming NEE- and EW-oriented faults (Allen et al., 1998). 3) The postrift stage occurred during the Guantao Formation-Quaternary sedimentary period, and the boundary between the postrift’s structural layer and the rift’s structural layer is the bottom interface of the Guantao Formation (the T2 reflection layer), which is a large-scale regional unconformity surface. The major regional unconformity between the Paleogene and Neogene deposits represents an important tectonic event that marks the termination of the rifting stage and the beginning of the post-rifting stage (Qi and Yang, 2010), regional extension in the basin ended at the end of the Oligocene, most likely because of the onset of transpression within eastern Asia, caused by the collision of Australia with the Philippine Sea Plate (Allen et al., 1998). Since the Neogene, the fault activity has obviously weakened, The NE-,NEE-and EW- trending pre-existing faults were reactivated. Some secondary faults were created under the nearly SN direction extension stress (Teng et al., 2014). Fault reactivation caused by the Neotectonism was probably induced by the combination of the regional Tan-Lu fault zone strike-slip movement and the mantle re-upwelling (Yu et al., 2011; Huang et al., 2012; Teng et al., 2014).
The Xicaogu structural belt is located in the middle part of the western slope of the Shulu Sag (Figure 4A). Although oil and gas have been discovered in the Shulu slope, large-scale oil and gas reservoirs are mainly concentrated in the Xicaogu structural belt. In this area, oil and gas reservoirs are all fault-related reservoirs (Xingru et al., 2016), and fault activity has affected oil and gas migration and accumulation. In this study, for the first time, the paleostress state of the Xicaogu area in the Shulu Sag is inverted using seismic interpretation data. The inversion results are of great significance to the analysis of tectonic evolutions and fault reactivation at the critical period of hydrocarbon accumulation.
The Xicaogu structural belt is a concentrated area of large-scale oil reservoirs in the Shulu sag. The oil in this area mainly come from the source rocks of the third member of the Shahejie Formation. The source rocks began to mature at the end of the deposition of the Dongying Formation and reached peak maturity in the middle period of the deposition of the Guantao Formation. The oil and gas accumulation period mainly occurred during the middle period of the deposition of the Guantao Formation (He, 2017). During the Neogene period, the tectonic background is relatively stable, a few faults were developed inheritably from the pre-existing syn-rift fault systems (Figure 5A). Throw-depth (T-z) plot was constructed by calculating the throw across faulted horizons (Baudon and Cartwright, 2008; Pochat et al., 2009), which can be used to constrain the temporal activity of fault population. The Neogene faults show maximum throw is consistently observed at the bottom of Dongying Formation (T3 reflection layer). For example, the T-z profile for fault 1 in Figure 5B, and progressively decreases toward the Guantao Formation, suggesting that these faults nucleated at Dongying Formation (the Syn-rift stage) and then propagated into the Neogene strata. The reactivation of faults affected hydrocarbon migration and accumulation in this area. Therefore, in this study, the stress tensor of the Neogene period was inverted.
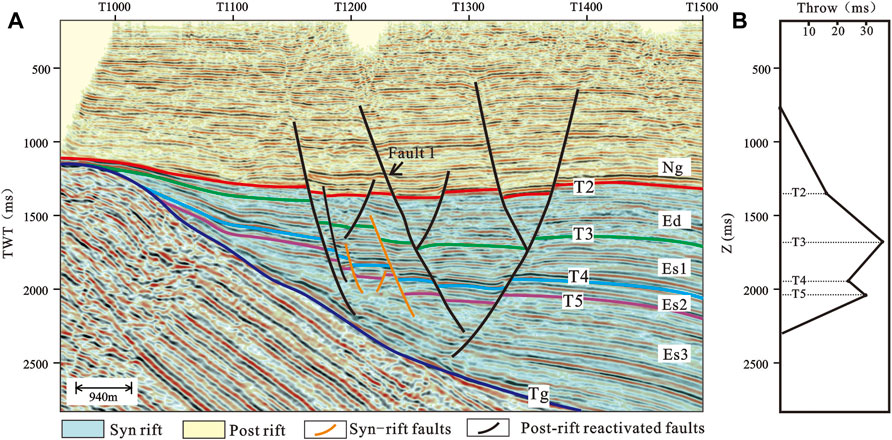
FIGURE 5. (A) seismic section illustrating the growth characteristics of faults in the study area, locations of seismic sections shown in Figure 6. (B) T-z profile for Fault 1 in (A), which shows maximum throw is at the bottom of Dongying Formation (T3 reflection layer) and progressively decreases toward the Guantao Formation, suggesting that most Neogene faults were developed inheritably from the pre-existing syn-rift fault systems.
The Xicaogu area is spread across about 165 km2 and 3D seismic data is available for the entire area. The original data has been processed well; the main frequency is 15–38 HZ, the seismic volume has an inline spacing of 25 m, and it was loaded to workstations and interpreted using Landmark 2003. The structural map of the bottom of the Guantao formation was obtained by time-depth conversion of seismic interpretation data (Figure 6).
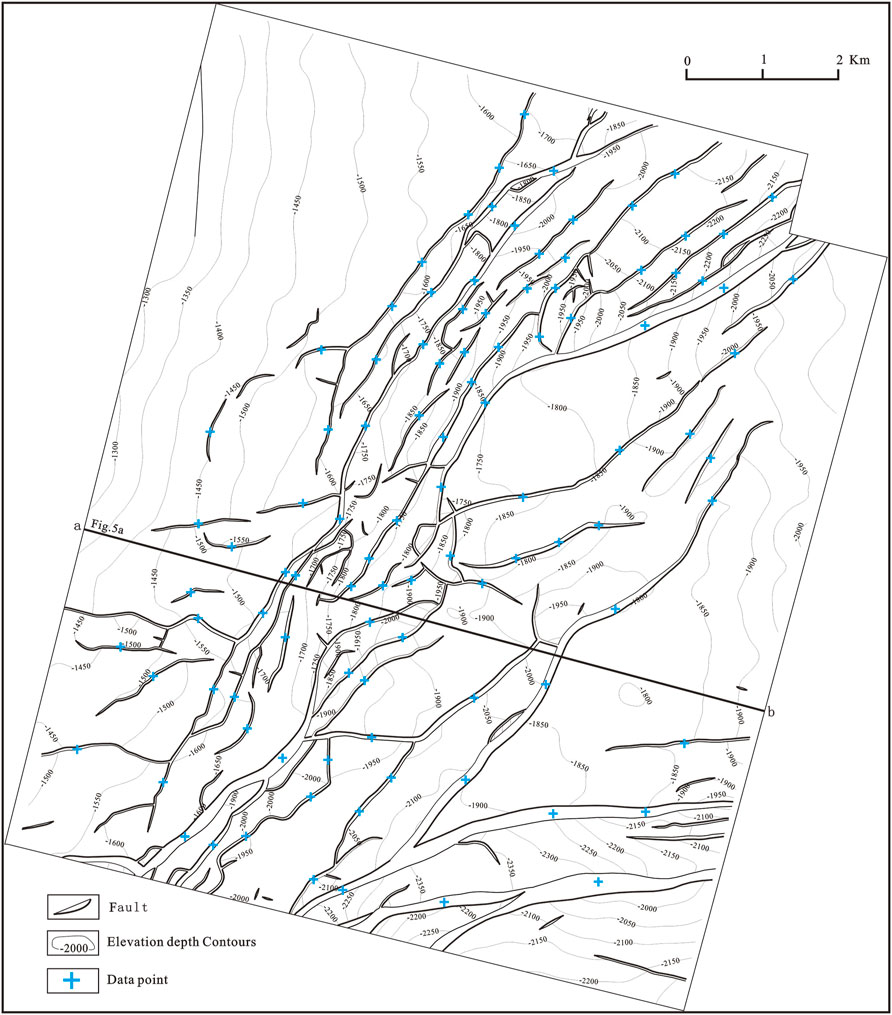
FIGURE 6. The structural map of the bottom of the Guantao formation, locations of map shown in Figure 4. The blue crosses are the data collection points. A total of 101 data points were selected to measure the fault attribute and throw data.
Through 3D seismic interpretation, the characteristic geometric parameters of faults in the Guantao formation were measured, including fault dip, dip angle, and fault throw. A total of 101 data points were selected to measure the fault attribute and fault throw data (Figure 6). We measured throw values from seismic sections that oriented orthogonal to local fault strike. Throw was determined by the vertical separations between footwall and hanging wall cutoff elevations of T2 reflection layer (the bottom of the Guantao formation). If the trend of the fault segments has undergone significant changes, these parameters should be measured by segments (Figure 7).
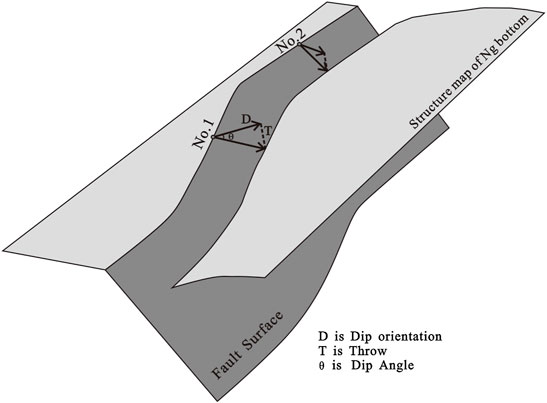
FIGURE 7. Schematic diagram of the data measurement principles. No.1 and No.2 represent different measurement points because the trend of the fault segments has undergone significant changes.
The fault throw was graded according to the fault throw values obtained by measurements. The maximum fault throw in the fault data was recorded, and the graded faults were projected on a stereographic map. Figure 8 is a stereographic projection of faults of different throw orders. It can be seen from the map that the strike of the faults with a fault throw greater than 30 m are generally in the NEE-EW direction, and the strike of the faults with a fault throw less than 30 m are in the NE-NNE direction and obviously different from the orientation of the faults with a high throw. In addition, the stereographic map indicates that the high-angle faults accumulated larger fault throws, and were probably easier to reactivate.
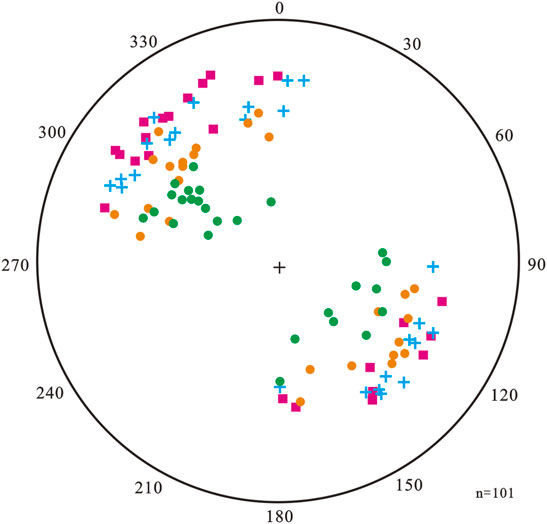
FIGURE 8. The stereographic projection of the poles of the faults. The red rectangles represent the faults with throws greater than 100 m, the blue crosses represent the faults with throws between 50 and 100 m, the orange dots represent the faults with throws between 30 and 50 m, and the green dots represent the faults with throws less than 30 m.
Methods presented by McFarland et al. (2012) were implemented in Matlab™. In the inversion process, an initial stress state is assumed, including the orientation of the stresses σ3, k1 and k2. σ3 began at azimuth 0o and it increased from 0o to 360o with a step of 0.5 o. k1 and k2 ranged from 0.1 to 1 with a step of 0.02 in cyclic calculation. The fault slip tendency (Ts) under this stress state was then calculated. After calculating the slip tendency of each fault in the target horizon, the calculated value of the slip tendency of each fault was recorded. The maximum and minimum values of the slip tendency in the data were also recorded. The fault throw and slip tendency values of each fault were normalized (McFarland et al., 2012), where normalization means that the slip tendency values were from 0 to 1 to enable a direct mathematical comparison between the slip tendency and fault throw.
The normalized slip tendency of each fault was compared with the value of the fault throw and the deviation was calculated. Then, after changing the stress state, the deviation calculation was repeated, and the stress state corresponding to the minimum deviation was obtained.
In the least square method, the paleostress inversion algorithm calculates the slip tendency that best matches the fault throw and then determines the corresponding stress state. In other words, the algorithm finds the corresponding stress state with the smallest deviation value.
Stress inversion was carried out using the faults’ geometric parameters obtained from the seismic interpretation data to obtain the stress state under the condition where the slip tendency and fault throw distribution best match each other (Figure 9). The final stress state inversion results show that the maximum principal stress σ1 is vertical, the minimum principal stress σ3 is oriented N160o, the intermediate principal stress σ2 is oriented N70o, and σ2/σ1 = 0.69 and σ3/σ1 = 0.27.
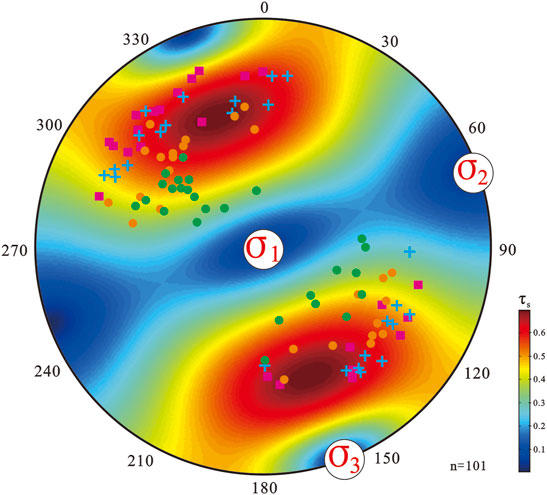
FIGURE 9. Principal stress orientations and slip tendency plots of the best-fit stress states.
Paleostress plays an essential role in controlling the formation and distribution of reservoir fractures, which is a crucial factor in controlling oil and gas production from unconventional reservoirs. At present, there are many methods to invert paleostress. Still, these methods are mainly based on outcrop or directional core data, which are not readily available in the oil and gas industry, which primarily focuses on the study of underground geological structures.
This study is a valuable application and development of the slip-tendency-based stress inversion method, the inversion method was previously demonstrated only by outcrop data (Morris et al., 2016), but it has not been applied to seismic data. In this study, we used 3D seismic reflection data for the first time to perform slip-tendency-based stress inversion to determine the stress field of the Xicaogu area in the Bohai Bay Basin during the Neogene period. The method is based on the analysis of slip tendency and fault throw and does not require the measurement of fault slip directions. The data for this method can easily be extracted from data sets routinely used in the oil and gas industry.
Fault surface orientations and throw magnitudes of faults in the Guantao Formation in the Xicaogu area were analyzed. The results show that faults with different fault throws exist in different areas of stereographic projection. The dip angles of faults with large throws are steeper. We concluded that the faults with large throws may be easier to reactivate and that faults in high slip tendency orientations tend to develop larger throws than other faults. This relationship provided a basis for fault throw as a proxy for slip tendency.
Based on the attitudes of faults and throws obtained from seismic interpretation data, stress inversion was then achieved by identifying the stress state that best fit the slip tendency values and the throws of the observed surfaces. The method was used to determine the stress field during the post-rift subsidence stage of the Xicaogu area in the Bohai Bay Basin. The paleostress inversion results show that the maximum principal stress σ1 is vertical, the minimum principal stress σ3 is oriented N160o, the intermediate principal stress σ2 is oriented N50o, and σ2/σ1 = 0.69 and σ3/σ1 = 0.27. The results agreed with previous conclusions regarding orientations for the extension stress of the post-rift stage (Teng et al., 2014).
The methodology makes a conservative assumption that the stress state of postrift stage was homogeneous normal faulting stress regime to make the calculation feasible. The Bohai Bay Basin was thought to have experienced the Palaeogene rifting and Neogene post-rift thermal subsidence. Most of the postrift faults are of NE- or EW-trending, which were the reactivation of pre-existing faults of Palaeogene rifting stage. Slip could accumulate on randomly oriented pre-existing faults, but the cumulated throws during the tectonic or stress event were different.
The results strongly dependent on fault orientation and throw, so several sources of calculation error exist related to the quality of the available data and seismic interpretation. Our testing of the methodology described in this study is at an early stage, Notwithstanding this, we believe that paleostress estimations based on simple geometric analysis are prone to more significant errors without such an approach. In this study, the fault throws were assumed to be the results of a single-stage stress field. However, if in the future we encounter faults in the deep layers, the faults may experience multi-stage stress fields with different orientations. The fault throws would be the result of multiple slip events, which would not represent a single tectonic movement. To counter this problem, we suggest that the fault data should be selected according to the last reactivation period of the fault as indicated by both subtle sedimentary growth and termination levels to ensure that the fault throws are not affected by later tectonic events.
The slip-tendency-based stress inversion method opens new and interesting perspectives to paleostress analysis. Further development and testing of the paleostress estimation method are underway. More faults with various fault orientations are to be analyzed in future work to better constrain the region’s history.
The original contributions presented in the study are included in the article/Supplementary Material, further inquiries can be directed to the corresponding author.
GP, ML contributed to conception and design of the study. XL organized the database. XZ performed the Fault kinematics analysis. YG contributed to seismic interpretation. SW contributed to programming, XbL contributed to evidence collection. GP, ML, XL wrote sections of the manuscript. All authors contributed to manuscript revision, read, and approved the submitted version.
This work was supported by University Nursing Program for Young Scholars with Creative Talents in Heilongjiang Province (UNPYSCT-2017037), Research Initiation Project of Northeast Petroleum University (rc201707) and Natural Science Foundation of Heilongjiang Province (TD2019D001).
YG was employed by QingXing Oil Development Limited Liability Company.
The remaining authors declare that the research was conducted in the absence of any commercial or financial relationships that could be construed as a potential conflict of interest.
All claims expressed in this article are solely those of the authors and do not necessarily represent those of their affiliated organizations, or those of the publisher, the editors, and the reviewers. Any product that may be evaluated in this article, or claim that may be made by its manufacturer, is not guaranteed or endorsed by the publisher.
Abul Khair, H., Cooke, D., and Hand, M. (2015). Paleo Stress Contribution to Fault and Natural Fracture Distribution in the Cooper Basin. J. Struct. Geology. 79, 31–41. doi:10.1016/j.jsg.2015.07.007
Abul Khair, H., Cooke, D., and Hand, M. (2013). The Effect of Present Day In Situ Stresses and Paleo-Stresses on Locating Sweet Spots in Unconventional Reservoirs, a Case Study from Moomba-big lake fields, cooper basin, South australia. J. Petrol. Explor Prod. Technol. 3 (4), 207–221. doi:10.1007/s13202-013-0082-x
Allen, M. B., Macdonald, D. I. M., Xun, Z., Vincent, S. J., and Brouet-Menzies, C. (1998). Transtensional Deformation in the Evolution of the Bohai basin, Northern china. Geol. Soc. Lond. Spec. Publications 135 (1), 215–229. doi:10.1144/gsl.sp.1998.135.01.14
Angelier, J. (1984). Tectonic Analysis of Fault Slip Data Sets. J. Geophys. Res. 89, 5835–5848. doi:10.1029/jb089ib07p05835
Baudon, C., and Cartwright, J. (2008). Early Stage Evolution of Growth Faults: 3d Seismic Insights from the levant basin, Eastern Mediterranean. J. Struct. Geology. 30 (7), 888–898. doi:10.1016/j.jsg.2008.02.019
Célérier, B. (1988). How Much Does Slip on a Reactivated Fault Plane Constrain the Stress Tensor? Tectonics 7 (6), 1257–1278. doi:10.1029/tc007i006p01257
Collettini, C., and Trippetta, F. (2007). A Slip Tendency Analysis to Test Mechanical and Structural Control on Aftershock Rupture Planes. Earth Planet. Sci. Lett. 255 (3-4), 402–413. doi:10.1016/j.epsl.2007.01.001
Du Rouchet, J. (1981). Stressfields, a Key to Oil Migration. AAPG Bull. 65 (1), 74–85. doi:10.1306/2f919774-16ce-11d7-8645000102c1865d
Etchecopar, A., Vasseur, G., and Daignieres, M. (1981). An Inverse Problem in Microtectonics for the Determination of Stress Tensors from Fault Striation Analysis. J. Struct. Geology. 3, 51–65. doi:10.1016/0191-8141(81)90056-0
Ferrill, D. A., Smart, K. J., and Morris, A. P. (2020). Resolved Stress Analysis, Failure Mode, and Fault-Controlled Fluid Conduits. Solid Earth 11 (3), 899–908. doi:10.5194/se-11-899-2020
Gartrell, A. P., and Lisk, M. (2005). “Potential New Method for Paleostress Estimation by Combining Three-Dimensional Fault Restoration and Fault Slip Inversion Techniques: First Test on the Skua Field, Timor Sea,” in Evaluating Fault and Cap Rock Seals. Editors P. Boult, and J. Kaldi (Tulsa, Oklahoma, United States: AAPG Hedberg Series), 23–26.2
Gong, L., Wang, J., Gao, S., Fu, X., Liu, B., Miao, F., et al. (2021). Characterization, Controlling Factors and Evolution of Fracture Effectiveness in Shale Oil Reservoirs. J. Pet. Sci. Eng. 203, 108655. doi:10.1016/j.petrol.2021.108655
Hansen, J.-A. (2013). Direct Inversion of Stress, Strain or Strain Rate Including Vorticity: A Linear Method of Homogenous Fault-Slip Data Inversion Independent of Adopted Hypothesis. J. Struct. Geology. 51, 3–13. doi:10.1016/j.jsg.2013.03.014
He, B. (2017). Research on the Main Controlling Factor of Hydrocarbon Accumulation in Xicaogu Structual belt in Shulu Sag of Hebei central Depression. Daqing, China: Northeast Petroleum University. (in Chinese with English abstract).
Henk, A. (2005). Pre-drilling Prediction of the Tectonic Stressfield with Geomechanical Models. First Break 23, 53–57. doi:10.3997/1365-2397.2005021
Huang, L., Liu, C., Zhou, X., and Wang, Y. (2012). The Important Turning Points during Evolution of Cenozoic basin Offshore the Bohai Sea: Evidence and Regional Dynamics Analysis. Sci. China Earth Sci. 55 (3), 476–487. doi:10.1007/s11430-011-4359-y
Igwe, O., and Okonkwo, I. A. (2016). Application of Paleostress Analysis for the Identification of Potential Instability Precursors within the Benue Trough Nigeria. Geoenviron Disasters 3, 17. doi:10.1186/s40677-016-0051-z
Jamison, W. R. (1992). “Stress Controls on Fold Thrust Style,” in Thrust Tectonics. Editor K. R. McClay (Dordrecht: Springer Netherlands), 155–164. doi:10.1007/978-94-011-3066-0_13
Jiang, Z. (2018). A Source-To-Sink Study of the Paleogene Shulu Sag: Characteristics and Depositional Dynamics of its Deposits//Sedimentary Dynamics of Windfield-Source-Basin System. Singapore: Springer, 281–328. doi:10.1007/978-981-10-7407-3_7
Jiang, Z., Chen, D., Qiu, L., Liang, H., and Ma, J. (2007). Source-Controlled Carbonates in a Small Eocene Half-Graben Lake Basin (Shulu Sag) in Central Hebei Province, North China. Sedimentology 54 (2), 265–292. doi:10.1111/j.1365-3091.2006.00834.x
Kulikowski, D., and Amrouch, K. (2017). Combining Geophysical Data and Calcite Twin Stress Inversion to Refine the Tectonic History of Subsurface and Offshore Provinces: A Case Study on the Cooper‐Eromanga Basin, Australia. Tectonics 36 (3-4), 515–541. doi:10.1002/2016tc004366
Kulikowski, D., and Amrouch, K. (2018). 4D Modelling of Fault Reactivation Using Complete Paleostress Tensors from the Cooper-Eromanga Basin, Australia. Aust. J. Earth Sci. 65 (5), 661–681. doi:10.1080/08120099.2018.1465472
Lacombe, O., Amrouch, K., Mouthereau, F., and Dissez, L. (2007). Calcite Twinning Constraints on Late Neogene Stress Patterns and Deformation Mechanisms in the Active Zagros Collision belt. Geol 35, 263–266. doi:10.1130/g23173a.1
Lacombe, O. (2001). Paleostress Magnitudes Associated with Development of Mountain Belts: Insights from Tectonic Analyses of Calcite Twins in the Taiwan Foothills. Tectonics 20 (6), 834–849. doi:10.1029/2001tc900019
Li, S.-Z., Suo, Y. H., Dai, L. M., Liu, L. P., Jin, C., Liu, X., et al. (2010). Development of the Bohai Bay Basin and Destruction of the North China Craton. Earth Sci. Front. 17, 64–89. (in Chinese).
Liu, M., Cui, X., and Liu, F. (2004). Cenozoic Rifting and Volcanism in Eastern China: a Mantle Dynamic Link to the Indo-Asian Collision? Tectonophysics 393, 29–42. doi:10.1016/j.tecto.2004.07.029
Mcfarland, J. M., Morris, A. P., and Ferrill, D. A. (2012). Stress Inversion Using Slip Tendency. Comput. Geosciences 41, 40–46. doi:10.1016/j.cageo.2011.08.004
Morris, A., Ferrill, D. A., and Brent Henderson, D. B. (1996). Slip-tendency Analysis and Fault Reactivation. Geol 24, 275–278. doi:10.1130/0091-7613(1996)024<0275:staafr>2.3.co;2
Morris, A. P., Ferrill, D. A., and Mcginnis, R. N. (2016). Using Fault Displacement and Slip Tendency to Estimate Stress States. J. Struct. Geology. 83, 60–72. doi:10.1016/j.jsg.2015.11.010
Pochat, S., Castelltort, S., Choblet, G., and Van Den Driessche, J. (2009). High-resolution Record of Tectonic and Sedimentary Processes in Growth Strata. Mar. Pet. Geology. 26 (8), 1350–1364. doi:10.1016/j.marpetgeo.2009.06.001
Qi, J., and Yang, Q. (2010). Cenozoic Structural Deformation and Dynamic Processes of the Bohai bay basin Province, china. Mar. Pet. Geology. 27 (4), 757–771. doi:10.1016/j.marpetgeo.2009.08.012
Ren, C., He, F., Gao, X., Wu, D., Yao, W., Tian, J., et al. (2019). Prediction of Exploration Targets Based on Integrated Analyses of Source Rock and Simulated Hydrocarbon Migration Direction: a Case Study from the Gentle Slope of Shulu Sag, Bohai Bay Basin, Northern China. Geosci. J. 23 (6), 977–989. doi:10.1007/s12303-018-0078-0
Schellart, W. P., and Lister, G. S. (2005). The Role of the East Asian Active Margin in Widespread Extensional and Strike-Slip Deformation in East Asia. J. Geol. Soc. 162, 959–972. doi:10.1144/0016-764904-112
Spang, J. H. (1972). Numerical Method for Dynamic Analysis of Calcite Twin Lamellae. Geol. Soc. America Bull. 83 (2), 467–472. doi:10.1130/0016-7606(1972)83[467:nmfdao]2.0.co;2
Teng, C., Zou, H., and Hao, F. (2014). Control of Differential Tectonic Evolution on Petroleum Occurrence in Bohai Bay Basin. Sci. China Earth Sci. 57 (5), 1117–1128. doi:10.1007/s11430-013-4771-6
Tian, Z.-Y., Han, P., and Xu, K.-D. (1992). The Mesozoic-Cenozoic East China Rift System. Tectonophysics 208, 341–363. doi:10.1016/0040-1951(92)90354-9
Turner, F. J. (1953). Nature and Dynamic Interpretation of Deformation Lamellae in Calcite of Three Marbles. Am. J. Sci. 251 (4), 276–298. doi:10.2475/ajs.251.4.276
Van der Pluijm, B. A., Craddock, J. P., Graham, B. R., and Harris, J. H. (1997). Paleostress in Cratonic North America: Implications for Deformation of Continental Interiors. Science 277, 794–796. doi:10.1126/science.277.5327.794
Xingru, L., Feng, Z., Shengli, L., Jie, H., Guanzhong, L., Tingting, S., et al. (2016). Distribution of Hydrocarbon Reservoirs and Petroleum Accumulation Patterns in the Shahejie Formation on Slope of Shulu Depression, North China. J. Geomechanics 22 (1), 66–75. (in Chinese with English abstract). doi:10.3969/j.issn.1006-6616.2016.01.007
Yamaji, A. (2000). The Multiple Inverse Method: a New Technique to Separate Stresses from Heterogeneous Fault-Slip Data. J. Struct. Geology. 22 (4), 441–452. doi:10.1016/s0191-8141(99)00163-7
Yin, A. (2000). Mode of Cenozoic East-West Extension in Tibet Suggesting a Common Origin of Rifts in Asia during the Indo-Asian Collision. J. Geophys. Res. 105, 21745–21759. doi:10.1029/2000jb900168
Yu, Y., Zhou, X., Xu, C. G., Lü, D., Wei, G., and Wang, G. (2011). Characteristics and Formation Mechanisms of the Cenozoic Faults in the Bohai Sea Waters. Oil Gas Geology. 32 (2), 273–279. doi:10.11743/ogg20110216
Zalohar, J., and Vrabec, M. (2010). Kinematics and Dynamics of Fault Reactivation: the Cosserat Approach. J. Struct. Geology. 32 (1), 15–27. doi:10.1016/j.jsg.2009.06.008
Keywords: seismic data, slip tendency, throw, paleostress inversion, Bohai Bay basin
Citation: Ping G, Liu X, Li M, Zhang X, Gao Y, Wang S and Liu X (2022) Using Seismic Data and Slip Tendency to Estimate Paleostress: A Case Study From Xicaogu Area of Bohai Bay Basin, China. Front. Earth Sci. 10:812874. doi: 10.3389/feart.2022.812874
Received: 10 November 2021; Accepted: 18 March 2022;
Published: 06 April 2022.
Edited by:
Kouqi Liu, Central Michigan University, United StatesReviewed by:
Fushen Liu, Zhejiang University, ChinaCopyright © 2022 Ping, Liu, Li, Zhang, Gao, Wang and Liu. This is an open-access article distributed under the terms of the Creative Commons Attribution License (CC BY). The use, distribution or reproduction in other forums is permitted, provided the original author(s) and the copyright owner(s) are credited and that the original publication in this journal is cited, in accordance with accepted academic practice. No use, distribution or reproduction is permitted which does not comply with these terms.
*Correspondence: Minghui Li, MTE0MTg5MTg3QHFxLmNvbQ==
Disclaimer: All claims expressed in this article are solely those of the authors and do not necessarily represent those of their affiliated organizations, or those of the publisher, the editors and the reviewers. Any product that may be evaluated in this article or claim that may be made by its manufacturer is not guaranteed or endorsed by the publisher.
Research integrity at Frontiers
Learn more about the work of our research integrity team to safeguard the quality of each article we publish.