 Wenhao Liu
 Huihua Peng3*
 Pengyu Guo
- 1State Key Laboratory for the Coal Mine Disaster Dynamics and Controls, Chongqing University, Chongqing, China
- 2School of Resources and Safety Engineering, Chongqing University, Chongqing, China
- 3Department of Building Engineering, Hunan Institute of Engineering, Xiangtan, China
- 4Technology Innovation Center of Geohazards Automatic Monitoring, Ministry of Natural Resources, Chongqing Engineering Research Center of Automatic Monitoring for Geological Hazards, Chongqing, China
A promising large-scale energy storage is underground compressed air energy storage (CAES) in lined rock caverns. To ensure the safety and stability of storage caverns because of the influence of periodic injection during production, it is crucial to understand the mechanical behavior of lining concrete under different complex stress paths. In this study, three types of uniaxial compressive fatigue test and uniaxial creep test were conducted on concrete. The following conclusions were obtained from the results. 1) The irreversible deformation after the interval was larger than that before the interval in the discontinuous multi-step cyclic loading (DMCL) test. 2) Loading velocity significantly influenced concrete fatigue, and the irreversible deformation in the cycle of low loading velocity was greater than that in the cycle of high loading velocity. 3) The residual strain increased with an increase in stress level. 4) The creep strain increased with an increase in stress level during the multi-step creep loading test; the fractional derivative results were more consistent with the experimental results. 5) The permeability of concrete increased rapidly under the influence of an external force when the stress level exceeded 0.73.
Introduction
In the context of carbon peak and carbon neutrality, renewable energy sources, which can replace fossil energy on a large scale, present new opportunities for development (Liu et al., 2020a; Ben Yosef et al., 2021; Jiang et al., 2021; Liu et al., 2020b; Ma et al., 2021; Nair et al., 2021). The development of renewable energy sources is currently restricted because they are inherently intermittent, being dependent on weather conditions and daily cycles. Therefore, reliable storage technology is essential to the economic and technical feasibility of renewable energy sources. The pumped hydroelectric storage (PHS) (Winde et al., 2017; Jurasz et al., 2018; Sultan et al., 2018; Liu et al., 2020c; Emmanouil et al., 2021) and compressed air energy storage (CAES) (Zhao et al., 2015; Zhang et al., 2019; Soltani et al., 2020; Li et al., 2021; Liu et al., 2021; Yang et al., 2022) have been regarded as promising large-scale electric energy storage technologies. The PHS is limited by the hydrogeological conditions and large cover depths during its construction, whereas CAES has attracted much attention because of its lower capital and maintenance cost (Rutqvist et al., 2012; Venkataramania et al., 2016; Wei et al., 2016; Chen et al., 2017; Ye et al., 2018; Liu et al., 2020d).
CAES can be constructed using rock cavities, salt cavities, and porous-media reservoirs. The construction of CAES has greater flexibility in terms of site selection and substantially reduced construction costs through the use of underground lined caverns with an artificial sealing layer, such as concrete (Raju and Kumar Khaitan, 2012; Kim et al., 2013; Kim et al., 2016; Jiang et al., 2020; Zhou et al., 2020). For a typical CAES system with frequent injection and production, a major challenge in storing compressed air in underground lined caverns is the risk of air leakage from the caverns. Therefore, it is necessary to investigate the porosity, permeability, and fatigue behavior of concrete under various loading conditions.
Recently, many studies have been conducted to understand the fatigue performance and permeability of concrete and rock (Jiang et al., 2016; Fan et al., 2020; Kang et al., 2021; Xu et al., 2022). Irreversible strain, fatigue crack initiation, and fatigue life are the main subjects of investigations on fatigue performance (Youshi et al., 1992; Pan and Hong, 2019). Du et al. studied the fatigue behavior of prestressed concrete under the fatigue loading of different stress ranges and proposed the S-N relationship between the tested beam and the bottom tensile steel bar related to the prestressing force (Du et al., 2020). Li et al. obtained the crack growth rate of the strengthened reinforced concrete beams through fatigue crack propagation tests, proposing a fatigue crack growth equation of strengthened reinforced concrete beams (Li et al., 2018) Lv et al. investigated the fatigue performance of self-compacting rubber lightweight aggregate concrete with different rubber particles substitution percentages under uniaxial compression (Lv et al., 2020). Abbass et al. conducted low cycle loading tests on reinforced concrete beams under different stress amplitude range levels; the authors found that the bond strength of normal-strength concrete was less than that of high-strength concrete (Abbass et al., 2013). Kasu et al. tested concrete beam specimens with different nominal maximum aggregate sizes (10 and 20 mm) under bending cyclic loading; the authors found that the smaller the nominal maximum aggregate size was, the better the fatigue performance of concrete was (Kasu et al., 2019). Jiang et al. conducted concrete uniaxial and eccentric cyclic loading tests to determine the fatigue performance, elastic modulus, and residual strain of concrete (Jiang et al., 2017). Zhu et al. tested the externally reinforced concrete specimens under fatigue loads with different fatigue amplitudes and developed a bond-slip model, considering the effects of the concrete strength and the fatigue loading amplitude (Zhu et al., 2016). Zhang et al. tested the permeability of 12 concrete specimen mixtures and found that the Klinkenberg factor was the key parameter of conversion (Zhang and Li, 2019). Rahal et al. proposed a macroscopic model for predicting the evolution of permeability with cracking (Rahal and Sellier, 2019).
The mechanical and seepage properties of lining concrete under various cyclic loadings are critical design parameters of CAES underground caverns and are crucial to ensuring the tightness and stability the cavern’s structure. This paper presents the mechanical and seepage properties of concrete under different conditions based on three groups of cyclic loading tests and a group of creep tests.
Experimental Procedure
Materials
To prepare the concrete, we used ordinary Portland cement, fine aggregate, sand, water, admixture, fly ash, and coarse aggregate with a maximum grain size of 40 mm. The fine aggregate and cementing material were natural sand and Chinese standard 42.5 Portland cement, respectively. The chemical composition of the cement is presented in Table 1, and the concrete mix proportion is shown in Table 2. The water-to-binder ratio of the concrete preparation was 0.31. The concrete mixtures were mixed evenly and poured into cubic molds with the size of 150 × 150 × 150 mm. The concrete was vibrated using a needle vibrator until the concrete surface formed a paste layer; the vibrator was pulled out slowly. The concrete cubes were removed from molds after 24 h and then placed in a standard curing chamber at 20 ± 2°C with relative humidity ≥95% for 28 days. The pouring and curing conditions of the concrete were in compliance standard requirements (GB/T 50081-2002) (M. Of Housing, U.-R.D. of the People’s Republic of China, 2002). The compressive strengths of the 7 day and 18 day were 51.7 and 61.5 MPa, respectively. The concrete cubes were drilled using a high-speed coring machine with an inner diameter of 50 mm to obtain the cylindrical specimens, which were cut by a cutting machine and smoothened at the end by a grinder. The length of each specimen was 100 ± 0.5 mm, the diameter was 50 mm, and the end surface roughness was controlled within a ±0.02 mm margin (Figure 1). To reduce the effect of water content on concrete strength, all specimens were placed in a vacuum heating oven at 45°C for 24 h before testing.

TABLE 1. Chemical composition of the cement.

TABLE 2. Mixture proportions of concrete.
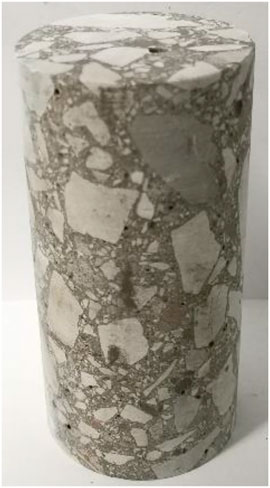
FIGURE 1. Photograph of the processed concrete samples.
Experimental Design and Conditions
The mechanical tests under uniaxial compression comprise four loading paths (Figure 2). 1) Conventional multi-step cyclic loading (CMCL, Figure 2A). The upper limit of the first stress path
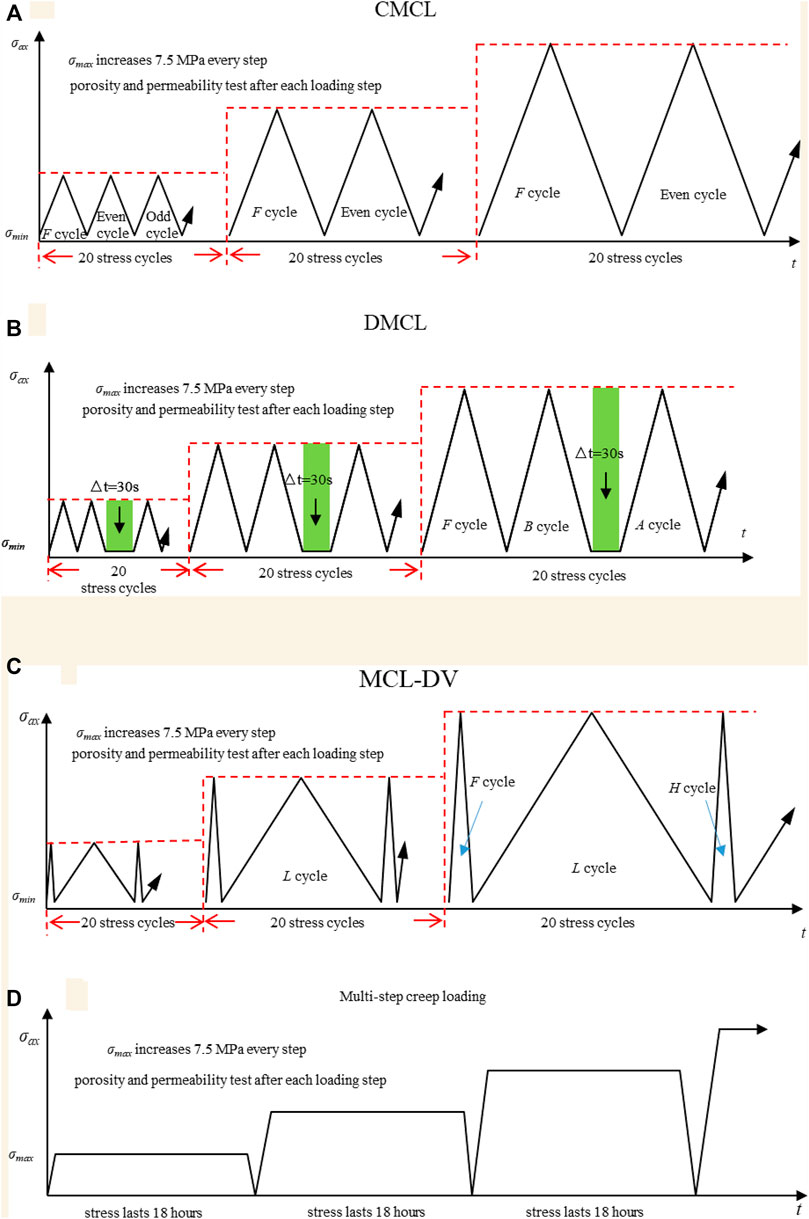
FIGURE 2. Loading pattern applied in three fatigue tests: (A) CMCL tests; (B) DMCL tests; (C) MCL-DV tests; (D) Multi-step creep test.
The room temperature was kept at 22 ± 3°C, and the stable relative humidity was kept at 50–70%. The mechanical tests of the concrete ware performed on MTS 815 (United States) machine with an axial force range of 600 kN. The axial deformation was measured by linear variable differential transformer (LVDT), which followed the piston position in real time. The porosity and permeability tests were conducted with LW-I core porosity and permeability automatic tester, which was developed independently by the State Key Laboratory of Coal Mine Disaster Dynamics and Control at Chongqing University, China. The schematic of the LW-I core porosity and permeability automatic tester is shown in Figure 3. In the permeability test module, the hydraulic pressure pump can provide confining pressures ranging from 0 to 25 MPa, and the inlet gas pressure ranges from 0 to 5 MPa. Fixed containers one and two were used to record the inlet and outlet pressures, respectively. The permeability test was performed under the conditions of 2 MPa confining pressure and 0.6 MPa inlet pressure.
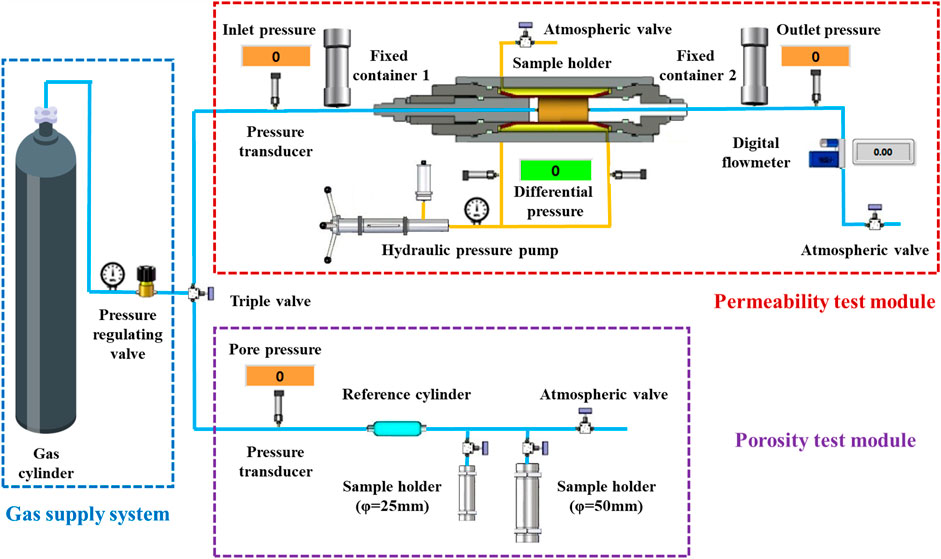
FIGURE 3. Schematic of the LW-I core porosity and permeability automatic tester.
The typical specimens were scanned using X-ray CT to obtain the coalescence patterns of the cracks before and after the mechanical tests. X-ray CT is a non-destructive tool for obtaining accurate images and three-dimensional data. The main settings of the X-ray CT scanner in this study were as follows: size measurement accuracy, 50 μm; CT image density measurement accuracy, 1.0%; spatial resolution ≥2.5 lp/mm; voltage, 130 kV; and power current, 81 μA.
Results and Discussion
Concrete can be deformed under the influence of external forces. Concrete exhibits elastic characteristics and reverses elastic deformation when acting external forces are removed. Concrete naturally contains complex porous structures (such as micro-cracks), causing it to exhibit certain plastic characteristics. After removing the external force, the elastic deformation is reversed; when the concrete cannot be restored to the original state, the deformation is said to be irreversible or residual.
The elastic modulus from the loading and unloading processes, irreversible deformation (
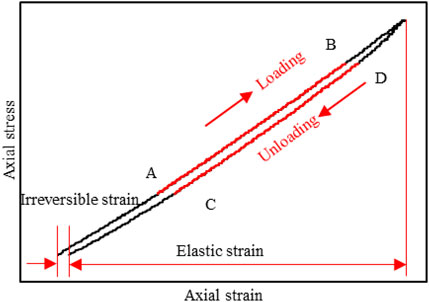
FIGURE 4. Schematic of elastic deformation and irreversible deformation calculation.
The elastic moduli from the loading and unloading processes are equal to the slope of the linear segment (AB and CD in Figure 4) of the stress–strain curve during the loading and unloading stages, respectively. The elastic modulus for the loading and unloading stages are given by Eq. 1 and Eq. 2.
where
Evolution of Elastic and Irreversible Deformations
By calculation and sorting, Figure 5 and Figure 6 illustrate the relationship between elastic deformation and irreversible deformation and the number of cycles in CMCM, DMCL and MCL-DV tests. Figure 5 illustrates a narrow fluctuation without an obvious regularity at each stress level, for the elastic deformation from even and odd cycles in the CMCM test, the
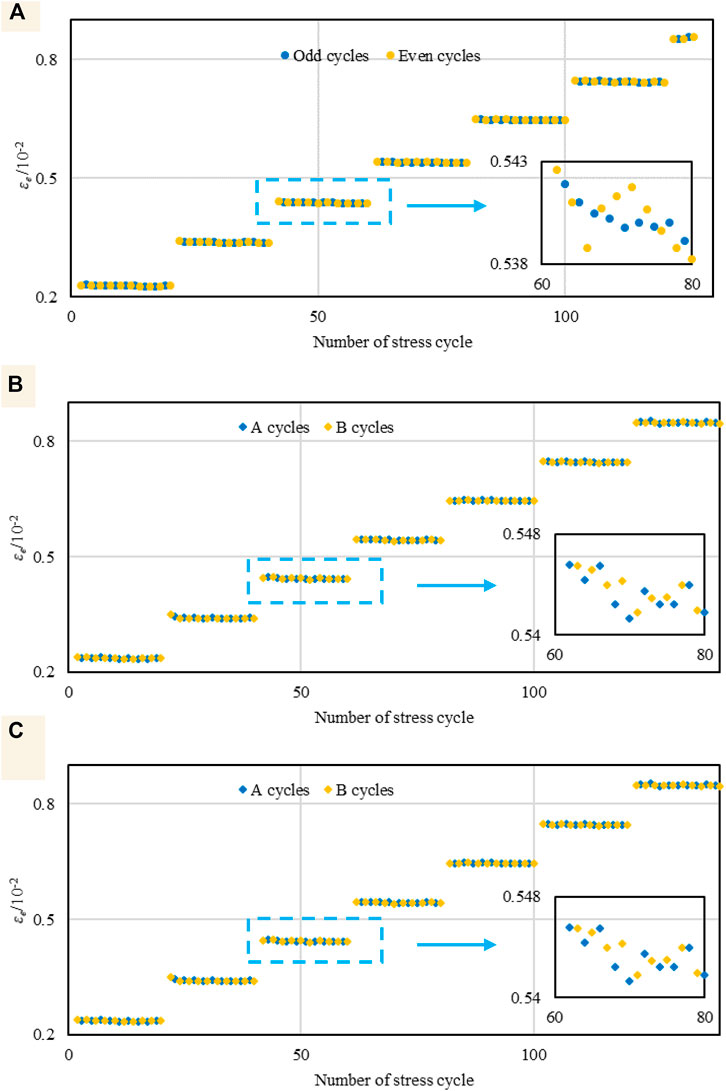
FIGURE 5. Elastic deformations
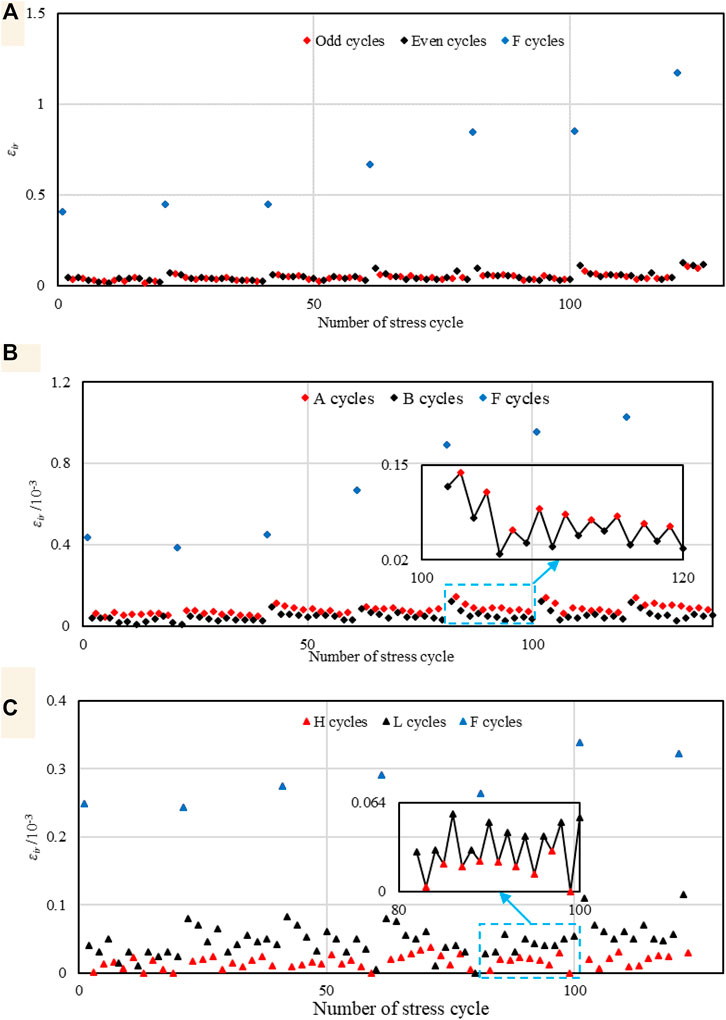
FIGURE 6. Irreversible deformations
The values of
The elastic modulus of concrete indicates the ability of concrete to resist deformation under the action of external forces; it also indicates the initiation, expansion, and connection of concrete cracks to a certain extent. Figure 7 illustrates that the elastic modulus of concrete generally exhibited an “increased–stabilized” trend as the stress level upper limit increased. Numerous pores were in the concrete. The fewer the microscopic defects in the concrete and the higher the degree of compaction, the stronger its ability to resist external forces. When the stress level increased from 0.27 to 0.37, the original microscopic defects of the concrete samples were gradually closed, the internal structure tended compactness, and the ability to resist external forces was enhanced. This behavior suggests that the elastic modulus gradually increased macroscopically. The elastic modulus of the concrete from the first loading cycle differed considerably from that of the other cycles at each step of the CMCL and DMCL tests. This difference was because the degree of consolidation between the aggregates in the concrete increased correspondingly as the loading progressed. When the upper limit stress reached 30 MPa, the elastic modulus increased substantially compared with that at the previous level. The value of the elastic modulus changed negligibly when the upper limit stress exceeded 45 MPa before finally decreasing. The average elastic modulus of the specimens under different stress levels in the CMCL test was 6.01, 6.22, 7.02, 7.21, 7.34, 7.34, and 7.18 GPa; the average elastic modulus from the DMCL test was 5.38, 6.16, 6.93, 7.16, 7.31, 7.28, and 7.25 GPa; and the average elastic modulus from the MCL-DV test was 6.21, 6.45, 7.08, 7.36, 7.54, 7.51, and 7.46 GPa. Moreover, the elastic modulus from the unloading segments was larger than that from the loading segments.
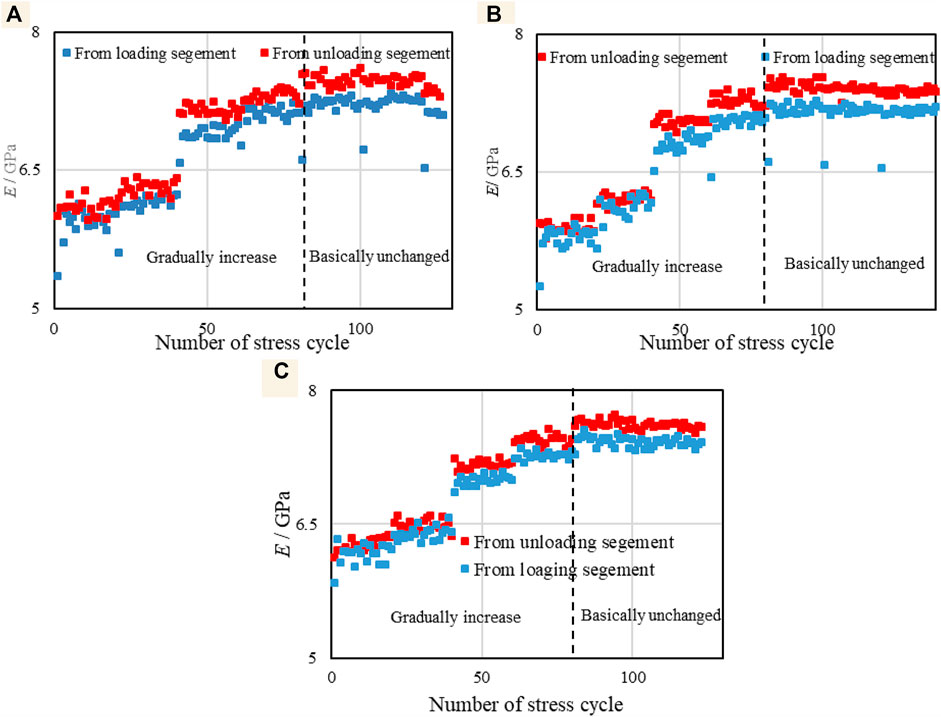
FIGURE 7. Irreversible deformations
Effect of Different Stress Levels on Concrete Fatigue
The average irreversible deformations at each stress level in A cycles, B cycles, H cycles, and L cycles were calculated separately; the results are shown in Figure 8. In the DMCL test, the average irreversible deformation of the A cycles differed from that of the B cycles at each stress stage; the average irreversible deformation of the A and B cycles increased as the stress level increased. In the MCL-DV test, the increase in the stress level did not influence the effect of loading velocity on concrete fatigue. Moreover, the irreversible deformation of L cycles increased with the increase in the stress level when the external stress became sufficiently large.
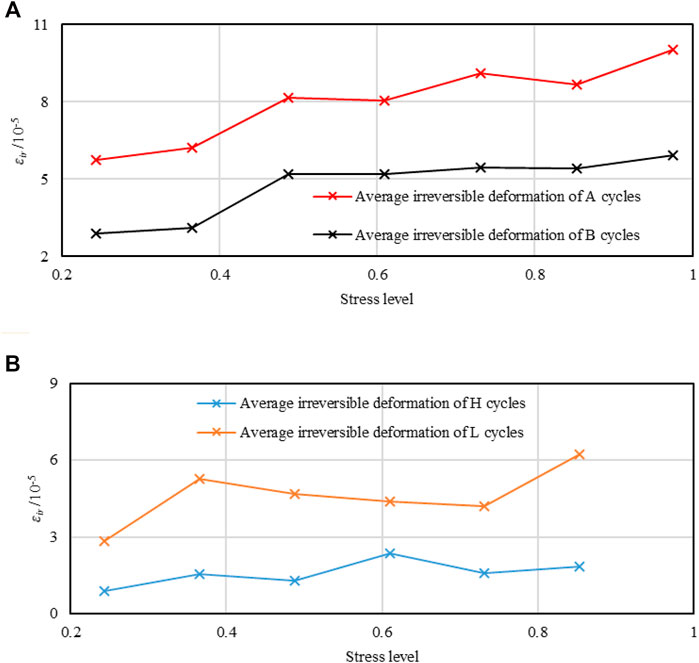
FIGURE 8. Irreversible deformations
The catalytic rate is defined as the growth rate of the
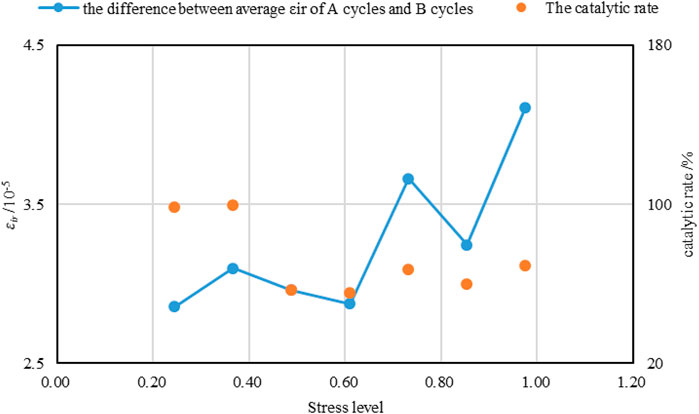
FIGURE 9. Catalytic rate and the difference between average
Creep Characteristics of Concrete Under Different Stress Levels
Figure 10 shows the strain curves under the different uniaxial creep stresses levels. It can be observed that the strain increased rapidly with force stress before the creep stage, and the total strain (including the strain before and after creep) increased with increasing stress levels. The creep strain was relatively stable and slowly increased with time during the creep stage when the stress level increased from 0.37 to 0.98. The relationship between the creep strain and stress level is illustrated in Figure 11. The creep strain increased gradually with increasing stress level. The concrete creep strain increased from 1.5 × 10⁻⁴ to 3.3 × 10⁻⁴ when the stress level increased from 0.37 to 0.98. The relationship between creep strain and stress level satisfies exponential growth, and the fitting equation can be expressed as
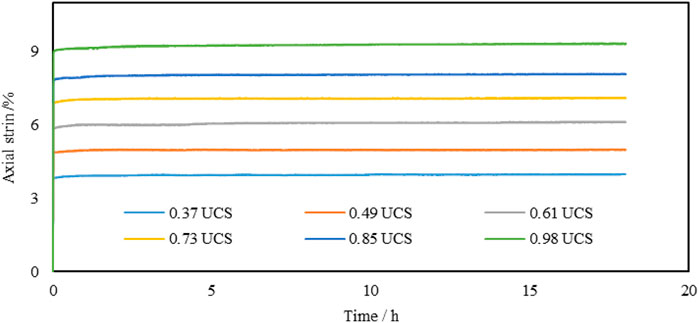
FIGURE 10. Axial strain with time in multi-step creep test.
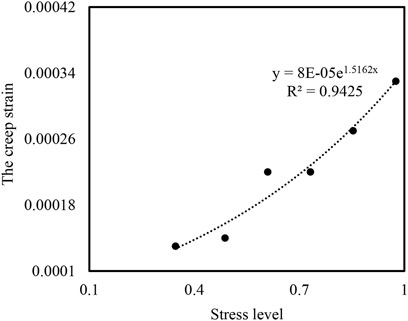
FIGURE 11. Creep strain versus stress level in multi-step creep test.
The creep deformation of concrete generally consists of three typical stages: the initial creep, steady creep, and accelerated creep stages. The original microcracks in the concrete do not expand in the short initial creep stage. In the steady creep stage, the original microcracks propagate gradually, and the new crack is produced and development. The concrete gradually develops to the accelerated creep stage with an increase in stress and time. Based on the definition of fractional derivative, Wu et al. built a new Fractional Derivative creep model, which uses Abel dashpot with strain triggered and Abel dashpot (Wu et al., 2020a; Wu et al., 2020b). The constitutive relationship of the Fractional Derivative creep model is
where
As shown in Figure 12, the initial creep and steady-state creep stages are considered in multi-step creep loading tests. Figure 12 depicts fitting results of the Fractional Derivative creep model and experimental data when the stress level was 0.98. It can be observed that the Fractional Derivative creep model is highly consistent with the experimental data from creep test of concrete. This observation demonstrates that the model can adequately describe the creep characteristics of concrete.
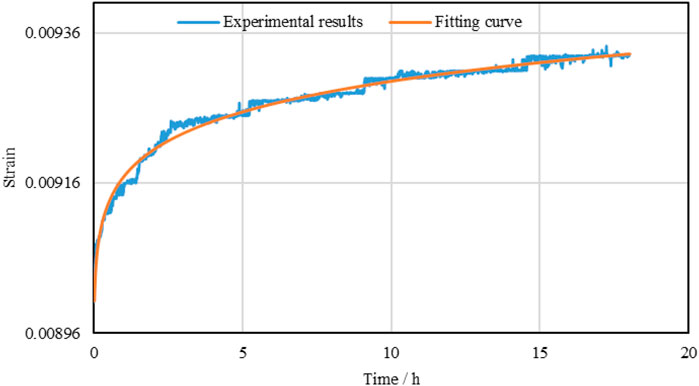
FIGURE 12. Comparison fitting curves and experimental results.
Gray Level Images by CT
The CT gray scanned images of four typical specimens are shown in Figure 13. The darker the grayscale color, the smaller the grayscale value; the larger the CT number, the greater the density of the material (Ge et al., 2001). As shown in Figure 13, the pixels of the CT grayscale images reflect different microstructures in the concrete; the coarse aggregate particles are in light gray while the hardened cement paste matrix is in dark gray. The CT images showed obvious pores (black in the images), which were caused by insufficient vibration during concrete forming. Numerous obvious developmental cracks and pores were observed in the CT images after the mechanical tests. Micro-cracks developed along the interfacial transition zone and connected with the original pores to form macroscopic shear cracks because of continuous loading in the tests. The macroscopic cracks throughout the coarse aggregate, branched cracks, and pores almost occupied the whole plane. Many micro-cracks were parallel to the loading direction because of the absence of the confining pressure. This failure pattern is consistent with the type of shear failure of concrete under uniaxial compression.
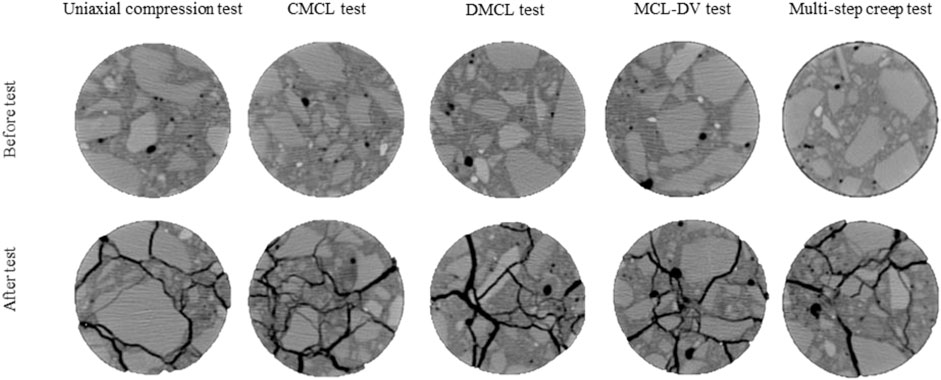
FIGURE 13. Comparisons of CT grayscale images before and after the tests.
Figure 14 illustrates the distribution of pores after 3D reconstruction by the CT images of the concrete before testing. This figure indicates that the concrete samples had many small-size pore structures and do not distribute obvious large-scale cracks. Thus, favorable conditions were lacking for the migration of gas in the concrete. The porosity of each sample calculated by the Avizo software was greater than that tested by the LW-I core porosity and permeability automatic tester. This difference was because the number of cracks was small, the gas flow and migration in the cracks were difficult, and some pores were not connected.
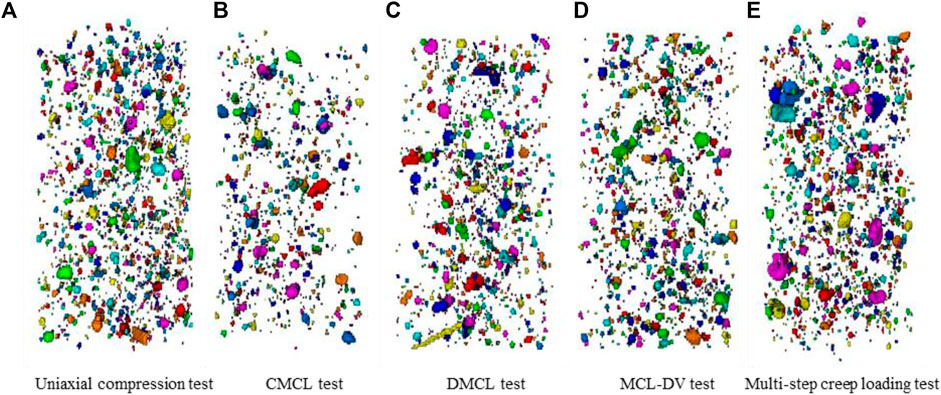
FIGURE 14. 3D fissure structures of concrete samples before testing.
Evolution of Porosity and Permeability
Figure 15 illustrates the variations in the ratio of permeability to initial permeability
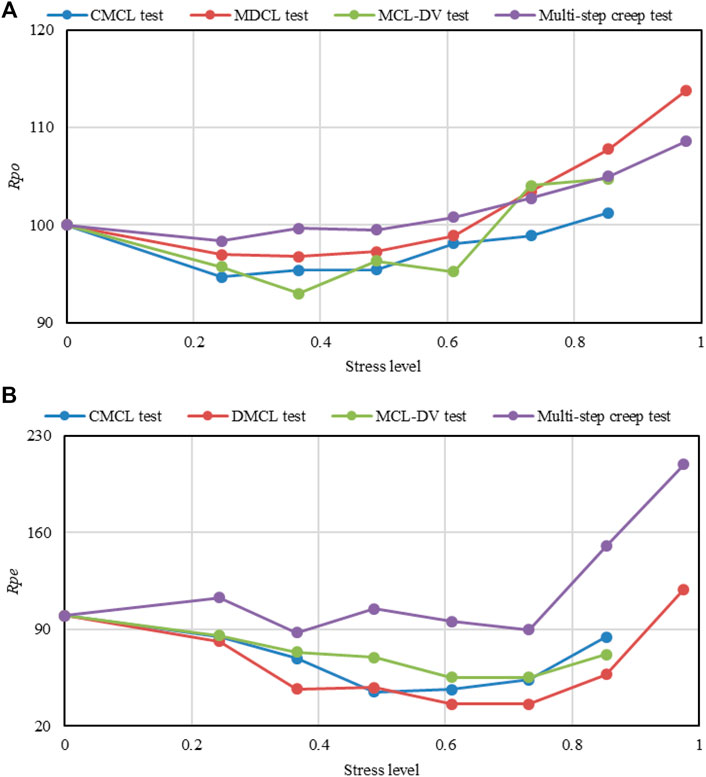
FIGURE 15. Variation in
Conclusion
In this study, the mechanical characteristics of ordinary concrete under three complex cyclic loading conditions and creep condition were investigated. Based on the experimental results, the main conclusions are as follows:
1) In the DMCL test, the interval-promoted plastic and irreversible deformations in A cycles were remarkably larger than those in B cycles. The loading velocity had a considerable influence on concrete. The irreversible deformations in H cycles were smaller than those in L cycles. The elastic modulus of concrete showed a trend of “increase—stabilize” with the stress level. The elastic modulus from the unloading segments was larger than that from the loading segments
2) The relationship between creep strain and stress level satisfied exponential growth, and the fractional derivative had better agreement with the creep strain.
3) The CT images directly reflected the internal structure and cracks in concrete.
4) The evolution of porosity and permeability showed a trend of an initial decrease followed by an increase. The porosity of concrete increased when the stress level reached 0.61, whereas the permeability increased when the stress level reached 0.73.
Data Availability Statement
The original contributions presented in the study are included in the article/supplementary material, further inquiries can be directed to the corresponding authors.
Author Contributions
WhL: Methodology, Investigation, Data Curation, Writing-Original Draft, Software. HP: Resources, Supervision, Funding acquisition, Writing-Review and Editing. PG: Resources, Validation, Software, Data Curation. WeL: Investigation, Writing-Review and Editing, Funding acquisition. SC: resources, validation, software, and data curatio. YK: Conceptualization, Methodology, Investigation, Funding acquisition.
Funding
This work was supported by the Natural Science Fund (No. 51834003, 51904039, 52022014, and 52178313), the Fundamental Research Funds for the Central Universities (No.2021CDJQY-030), Special Key Project of Chongqing Technology Innovation and Application Development (cstc2019jscx-tjsbX0015), Projects supported by Hunan Institute of Engineering (No. 21RC025, XJ2005) and Hunan Province Education Department (No.21B0664) which are all greatly appreciated.
Conflict of Interest
The authors declare that the research was conducted in the absence of any commercial or financial relationships that could be construed as a potential conflict of interest.
Publisher’s Note
All claims expressed in this article are solely those of the authors and do not necessarily represent those of their affiliated organizations, or those of the publisher, the editors and the reviewers. Any product that may be evaluated in this article, or claim that may be made by its manufacturer, is not guaranteed or endorsed by the publisher.
References
Abbass, W., Siddiqi, Z. A., Aslam, F., Hussain, R. R., and Ahmed, S. (2013). Bond Behaviour of High-Strength concrete Flexural Member under Low Cyclic Fatigue Loading. Fatigue Fract Engng Mater. Struct. 36, 602–613. doi:10.1111/ffe.12027
Ben Yosef, G., Navon, A., Poliak, O., Etzion, N., Gal, N., Belikov, J., et al. (2021). Frequency Stability of the Israeli Power Grid with High Penetration of Renewable Sources and Energy Storage Systems. Energ. Rep. 7, 6148–6161. doi:10.1016/j.egyr.2021.09.057
Chen, J., Liu, W., Jiang, D., Zhang, J., Ren, S., Li, L., et al. (2017). Preliminary Investigation on the Feasibility of a Clean CAES System Coupled with Wind and Solar Energy in China. Energy 127, 462–478. doi:10.1016/j.energy.2017.03.088
Du, Y., Wei, J., Yuan, J., Lai, Y., and Sun, D. (2020). Experimental Research on Fatigue Behavior of Prestressed concrete Beams under Constant-Amplitude and Variable-Amplitude Fatigue Loading. Construction Building Mater. 259, 119852. doi:10.1016/j.conbuildmat.2020.119852
Emmanouil, S., Nikolopoulos, E. I., François, B., Brown, C., and Anagnostou, E. N. (2021). Evaluating Existing Water Supply Reservoirs as Small-Scale Pumped Hydroelectric Storage Options - A Case Study in Connecticut. Energy 226, 120354. doi:10.1016/j.energy.2021.120354
Fan, J., Liu, W., Jiang, D., Chen, J., Tiedeu, W. N., and Daemen, J. J. K. (2020). Time Interval Effect in Triaxial Discontinuous Cyclic Compression Tests and Simulations for the Residual Stress in Rock Salt. Rock Mech. Rock Eng. 53, 4061–4076. doi:10.1007/s00603-020-02150-y
Ge, X., Ren, J., Pu, Y., Ma, W., and Zhu, Y. (2001). Real-in Time CT Test of the Rock Meso-Damage Propagation Law. Sci. China Ser. E-technol. Sci. 44, 328–336. doi:10.1007/BF02916710
Jiang, D., Fan, J., Chen, J., Li, L., and Cui, Y. (2016). A Mechanism of Fatigue in Salt under Discontinuous Cycle Loading. Int. J. Rock Mech. Mining Sci. 86, 255–260. doi:10.1016/j.ijrmms.2016.05.004
Jiang, C., Huang, Q., Gu, X., and Zhang, W. (2017). Experimental Investigation on Carbonation in Fatigue-Damaged concrete. Cement Concrete Res. 99, 38–52. doi:10.1016/j.cemconres.2017.04.019
Jiang, Z., Li, P., Tang, D., Zhao, H., and Li, Y. (2020). Experimental and Numerical Investigations of Small-Scale Lined Rock Cavern at Shallow Depth for Compressed Air Energy Storage. Rock Mech. Rock Eng. 53, 2671–2683. doi:10.1007/s00603-019-02009-x
Jiang, D., Li, Z., Liu, W., Ban, F., Chen, J., Wang, Y., et al. (2021). Construction Simulating and Controlling of the two-well-Vertical(TWV) Salt Caverns with Gas Blanket. J. Nat. Gas Sci. Eng. 96, 104291. doi:10.1016/j.jngse.2021.104291
Jurasz, J., Dąbek, P. B., Kaźmierczak, B., Kies, A., and Wdowikowski, M. (2018). Large Scale Complementary Solar and Wind Energy Sources Coupled with Pumped-Storage Hydroelectricity for Lower Silesia (Poland). Energy 161, 183–192. doi:10.1016/j.energy.2018.07.085
Kang, Y., Fan, J., Jiang, D., and Li, Z. (2021). Influence of Geological and Environmental Factors on the Reconsolidation Behavior of Fine Granular Salt. Nat. Resour. Res. 30, 805–826. doi:10.1007/s11053-020-09732-1
Kasu, S. R., Deb, S., Mitra, N., Muppireddy, A. R., and Kusam, S. R. (2019). Influence of Aggregate Size on Flexural Fatigue Response of concrete. Construction Building Mater. 229, 116922. doi:10.1016/j.conbuildmat.2019.116922
Kim, H.-M., Rutqvist, J., Jeong, J.-H., Choi, B.-H., Ryu, D.-W., and Song, W.-K. (2013). Characterizing Excavation Damaged Zone and Stability of Pressurized Lined Rock Caverns for Underground Compressed Air Energy Storage. Rock Mech. Rock Eng. 46, 1113–1124. doi:10.1007/s00603-012-0312-4
Kim, H.-M., Rutqvist, J., Kim, H., Park, D., Ryu, D.-W., and Park, E.-S. (2016). Failure Monitoring and Leakage Detection for Underground Storage of Compressed Air Energy in Lined Rock Caverns. Rock Mech. Rock Eng. 49, 573–584. doi:10.1007/s00603-015-0761-7
Li, D., Huang, P., Guo, X., Zheng, X., Lin, J., and Chen, Z. (2018). Fatigue Crack Propagation Behavior of RC Beams Strengthened with CFRP under Cyclic Bending Loads. Fatigue Fract. Eng. Mater. Struct. 41, 212–222. doi:10.1111/ffe.12673
Li, D., Liu, W., Jiang, D., Chen, J., Fan, J., and Qiao, W. (2021). Quantitative Investigation on the Stability of Salt Cavity Gas Storage with Multiple Interlayers above the Cavity Roof. J. Energ. Storage 44, 103298. doi:10.1016/j.est.2021.103298
Liu, W., Zhang, X., Fan, J., Zuo, J., Zhang, Z., and Chen, J. (2020). Study on the Mechanical Properties of Man-Made Salt Rock Samples with Impurities. J. Nat. Gas Sci. Eng. 84, 103683. doi:10.1016/j.jngse.2020.103683
Liu, W., Zhang, Z., Fan, J., Jiang, D., Li, Z., and Chen, J. (2020). Research on Gas Leakage and Collapse in the Cavern Roof of Underground Natural Gas Storage in Thinly Bedded Salt Rocks. J. Energ. Storage 31, 101669. doi:10.1016/j.est.2020.101669
Liu, R., He, Y., Zhao, Y., Jiang, X., and Ren, S. (2020). Tunnel Construction Ventilation Frequency-Control Based on Radial Basis Function Neural Network. Automation in Construction 118, 103293. doi:10.1016/j.autcon.2020.103293
Liu, W., Zhang, Z., Chen, J., Jiang, D., Wu, F., Fan, J., et al. (2020). Feasibility Evaluation of Large-Scale Underground Hydrogen Storage in Bedded Salt Rocks of China: A Case Study in Jiangsu Province. Energy 198, 117348. doi:10.1016/j.energy.2020.117348
Liu, P., Fan, J., Jiang, D., and Li, J. (2021). Evaluation of Underground Coal Gas Drainage Performance: Mine Site Measurements and Parametric Sensitivity Analysis. Process Saf. Environ. Prot. 148, 711–723. doi:10.1016/j.psep.2021.01.054
Lv, J., Zhou, T., Du, Q., and Li, K. (2020). Experimental and Analytical Study on Uniaxial Compressive Fatigue Behavior of Self-Compacting Rubber Lightweight Aggregate concrete. Construction Building Mater. 237, 117623. doi:10.1016/j.conbuildmat.2019.117623
M. Of Housing, U.-R.D. of the People’s Republic of China, (2002). Standard for Test Method of Mechanical Properties on Ordinary concrete. GB/T 50081-2002. Beijing, China: China Architecture and Building Press.
Ma, D., Zhang, L., and Sun, B. (2021). An Interval Scheduling Method for the CCHP System Containing Renewable Energy Sources Based on Model Predictive Control. Energy 236, 121418. doi:10.1016/j.energy.2021.121418
Nair, P. N. S. B., Tan, R. R., and Foo, D. C. Y. (2021). A Generic Algebraic Targeting Approach for Integration of Renewable Energy Sources, CO2 Capture and Storage and Negative Emission Technologies in Carbon-Constrained Energy Planning. Energy 235, 121280. doi:10.1016/j.energy.2021.121280
Pan, X., and Hong, Y. (2019). High‐cycle and Very‐high‐cycle Fatigue Behaviour of a Titanium alloy with Equiaxed Microstructure under Different Mean Stresses. Fatigue Fract. Eng. Mater. Struct. 42, 1950–1964. doi:10.1111/ffe.13050
Rahal, S., and Sellier, A. (2019). Influence of Crack Reclosure on concrete Permeability. Theor. Appl. Fracture Mech. 100, 65–77. doi:10.1016/j.tafmec.2018.11.010
Raju, M., and Kumar Khaitan, S. (2012). Modeling and Simulation of Compressed Air Storage in Caverns: A Case Study of the Huntorf Plant. Appl. Energ. 89, 474–481. doi:10.1016/j.apenergy.2011.08.019
Rutqvist, J., Kim, H.-M., Ryu, D.-W., Synn, J.-H., and Song, W.-K. (2012). Modeling of Coupled Thermodynamic and Geomechanical Performance of Underground Compressed Air Energy Storage in Lined Rock Caverns. Int. J. Rock Mech. Mining Sci. 52, 71–81. doi:10.1016/j.ijrmms.2012.02.010
Shen, D., Shi, H., Tang, X., Ji, Y., and Jiang, G. (2016). Effect of Internal Curing with Super Absorbent Polymers on Residual Stress Development and Stress Relaxation in Restrained concrete Ring Specimens. Construction Building Mater. 120, 309–320. doi:10.1016/j.conbuildmat.2016.05.048
Shen, D., Jiao, Y., Kang, J., Feng, Z., and Shen, Y. (2020). Influence of Ground Granulated Blast Furnace Slag on Early-Age Cracking Potential of Internally Cured High Performance concrete. Construction Building Mater. 233, 117083. doi:10.1016/j.conbuildmat.2019.117083
Soltani, M., Nabat, M. H., Razmi, A. R., Dusseault, M. B., and Nathwani, J. (2020). A Comparative Study between ORC and Kalina Based Waste Heat Recovery Cycles Applied to a green Compressed Air Energy Storage (CAES) System. Energ. Convers. Manag. 222, 113203. doi:10.1016/j.enconman.2020.113203
Sultan, H. M., Zaki Diab, A. A., Kuznetsov Oleg, N., and Zubkova Irina, S. (2018). Design and Evaluation of PV-Wind Hybrid System with Hydroelectric Pumped Storage on the National Power System of Egypt. Glob. Energ. Interconnect. 1, 301–311. doi:10.14171/j.2096-5117.gei.2018.03.001
Toribio, J., Lorenzo, M., Vergara, D., and Aguado, L. (2016). Residual Stress Redistribution Induced by Fatigue in Cold-Drawn Prestressing Steel Wires. Construction Building Mater. 114, 317–322. doi:10.1016/j.conbuildmat.2016.03.037
Venkataramania, G., Parankusama, P., Ramalingama, V., and Wang, J. (2016). A Review On Compressed Air Energy Storage – A Pathway For Smart Grid And Polygeneration, Renew. Sustain. Energ. Rev. 62, 895–907. doi:10.1016/j.rser.2016.05.002
Wei, L., Jie, C., Deyi, J., Xilin, S., Yinping, L., Daemen, J. J. K., et al. (2016). Tightness and Suitability Evaluation of Abandoned Salt Caverns Served as Hydrocarbon Energies Storage under Adverse Geological Conditions (AGC). Appl. Energ. 178, 703–720. doi:10.1016/j.apenergy.2016.06.086
Winde, F., Kaiser, F., and Erasmus, E. (2017). Exploring the Use of Deep Level Gold Mines in South Africa for Underground Pumped Hydroelectric Energy Storage Schemes. Renew. Sustain. Energ. Rev. 78, 668–682. doi:10.1016/j.rser.2017.04.116
Wu, F., Gao, R., Liu, J., and Li, C. (2020). New Fractional Variable-Order Creep Model with Short Memory. Appl. Maths. Comput. 380, 125278. doi:10.1016/j.amc.2020.125278
Wu, F., Zhang, H., Zou, Q., Li, C., Chen, J., and Gao, R. (2020). Viscoelastic-plastic Damage Creep Model for Salt Rock Based on Fractional Derivative Theory. Mech. Mater. 150, 103600. doi:10.1016/j.mechmat.2020.103600
Xu, F., Xu, Z., Tang, S., Ren, Q., Guo, Y., Wang, L., et al. (2022). Evolution of Physical and Mechanical Properties of Cementing Materials during Underground Energy Exploitation and Storage. J. Energ. Storage 45, 103775. doi:10.1016/j.est.2021.103775
Yang, X., Yang, S., Wang, H., Yu, Z., Liu, Z., and Zhang, W. (2022). Parametric Assessment, Multi-Objective Optimization and Advanced Exergy Analysis of a Combined thermal-compressed Air Energy Storage with an Ejector-Assisted Kalina Cycle. Energy 239, 122148. doi:10.1016/j.energy.2021.122148
Ye, B., Cheng, Z., and Ni, X. (2018). Effects of Multiple Heating-Cooling Cycles on the Permeability and Microstructure of a Mortar. Construction Building Mater. 176, 156–164. doi:10.1016/j.conbuildmat.2018.05.009
Youshi, H., Brown, M. W., and Miller, K. J. (1992). Fatigue Crack Growth from a Circular Notch under High Levels of Biaxial Stress. Fat Frac Eng. Mat Struct. 15, 1185–1197. doi:10.1111/j.1460-2695.1992.tb01256.x
Zhang, D., and Li, K. (2019). Concrete Gas Permeability from Different Methods: Correlation Analysis. Cement and Concrete Composites 104, 103379. doi:10.1016/j.cemconcomp.2019.103379
Zhang, X., Zeng, R., Deng, Q., Gu, X., Liu, H., He, Y., et al. (2019). Energy, Exergy and Economic Analysis of Biomass and Geothermal Energy Based CCHP System Integrated with Compressed Air Energy Storage (CAES). Energ. Convers. Manag. 199, 111953. doi:10.1016/j.enconman.2019.111953
Zhao, P., Wang, J., and Dai, Y. (2015). Thermodynamic Analysis of an Integrated Energy System Based on Compressed Air Energy Storage (CAES) System and Kalina Cycle. Energ. Convers. Manag. 98, 161–172. doi:10.1016/j.enconman.2015.03.094
Zhou, S., Xia, C., and Zhou, Y. (2020). Long-term Stability of a Lined Rock Cavern for Compressed Air Energy Storage: Thermo-Mechanical Damage Modeling. Eur. J. Environ. Civil Eng. 24, 2070–2093. doi:10.1080/19648189.2018.1499556
Keywords: complex stress path, irreversible deformation, creep, permeability, concrete
Citation: Liu W, Peng H, Guo P, Chen S, Liu W and Kang Y (2022) Experimental Study on the Mechanical and Permeability Properties of Lining Concrete Under Different Complex Stress Paths. Front. Earth Sci. 10:810115. doi: 10.3389/feart.2022.810115
Received: 06 November 2021; Accepted: 07 January 2022;
Published: 01 February 2022.
Edited by:
Alexandre Chemenda, Géoazur (GEOAZUR), FranceCopyright © 2022 Liu, Peng, Guo, Chen, Liu and Kang. This is an open-access article distributed under the terms of the Creative Commons Attribution License (CC BY). The use, distribution or reproduction in other forums is permitted, provided the original author(s) and the copyright owner(s) are credited and that the original publication in this journal is cited, in accordance with accepted academic practice. No use, distribution or reproduction is permitted which does not comply with these terms.
*Correspondence: Huihua Peng, cGVuZ2h1aS1odWFAZm94bWFpbC5jb20=; Wei Liu, d2hyc21saXV3ZWlAMTI2LmNvbQ==