
94% of researchers rate our articles as excellent or good
Learn more about the work of our research integrity team to safeguard the quality of each article we publish.
Find out more
ORIGINAL RESEARCH article
Front. Earth Sci., 26 May 2022
Sec. Geohazards and Georisks
Volume 10 - 2022 | https://doi.org/10.3389/feart.2022.808931
This article is part of the Research TopicMine Engineering Geological Disaster Forecasting, Monitoring, and PreventionView all 27 articles
 Dong Feng1,2*
 Enke Hou1,2*Shuangming Wang1,2
 Xiaoshen Xie1,2Feng Yuan3Liangliang Guo4Gang Wang4Yongli Xie5Zhen Chen5
With the large-scale mining of coal resources in western China, coal resources are gradually shifting from shallow to deep mining. In coal seam mining, the overlying rock water-conducting fractured zone (WCFZ) is the main factor causing mine water damage and water resource damage. Accurately grasping the development height of the water-conducting fissure zone is the key to the prevention of water hazards and the protection of water resources in medium–deep coal seams. In this study, the 3D development form of the WCFZ in the middle and deep coal seam mining is studied by the integrated method of drilling and 3D seismic survey, taking the first mining face of Xiaobodang No.1 mine in Yushen such that the height of the WCFZ measured by drilling is 81.50–177.07 m. The height of WCFZ development in the 3D seismic survey was 79.83–178.03 m, and the morphology of the WCFZ was saddle-shaped. This study provides methodological guidance for predicting the 3D morphology and developmental characteristics of the WCFZ. The results obtained are of great significance for the safe, green, and efficient mining of coal seams in medium and deep buried ecologically fragile environments.
As the most important disposable energy source in China, according to forecasts, coal will remain the major contributor to more than 50% of China’s primary energy, so the coal-based energy mix will not change for a long time (Zhou et al., 2020; Dong et al., 2021).
When the coal seam is mined, the overlying rock layer will inevitably be damaged and the coal seam goaf was divided into three zones: caved zone, fracture zone, and continuous bending zone (Figure 1). The caved zone and fracture zone will be interconnected to form the WCFZ (Zhang et al., 2018). If the development of the WCFZ penetrates the overlying bedrock aquifer or the ground surface, it will cause the groundwater level to drop (Wang G et al., 2017; Gui et al., 2020; Wang S et al., 2017), ground collapse (Yan et al., 2018; Yang et al., 2019; Zhou et al., 2020; Dawei et al., 2019), land desertification (Sun et al., 2017; Li et al., 2018), and other environmental issues and even cause mine water gushing accidents, threatening the safety of mining. Mastering the development characteristics of the WCFZ is the key to ensuring the safe, green, and efficient mining of coal resources, and it is the basic condition to reduce the ecological environment damage. In response to the aforementioned hot issues, some scholars have explored the characteristics of the WCFZ using different methods. Development height of the WCFZ was analyzed by field actual measurement of drilling leakage fluid, borehole TV observation, and theoretical calculation (Sui et al., 2015; Zhang et al., 2018). Also, there are scholars who use UDEC (Gao et al., 2014; Du and Gao, 2017), FLAC (Gao et al., 2014; Liu et al., 2019), PFC (Liu et al., 2015), RFPA (Liu et al., 2019; Fan et al., 2020), similar material simulation (Liu et al., 2019; Xie et al., 2021), and other methods to study the development height of the WCFZ.
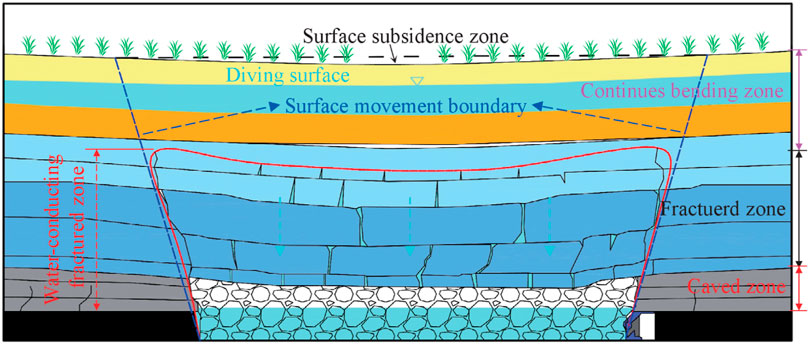
FIGURE 1. Division zones of the coal-roof strata after mining.
Most of the currently carried out methods include field measurements, theoretical calculations, numerical simulations, similar material simulations, and empirical formulae calculation. Although the use of geological drilling combined with logging curves to determine HWCFZ development is highly accurate, the detection effect is only seen in one hole, and the cost of drilling is high. With the development of mining equipment and advances in coal mining technology, some empirical formulas and theoretical studies are no longer sufficient to predict HWCFZ development in existing mines related to high-intensity mining. Physical and numerical modeling methods are scaled to actual mining conditions, and these methods are mainly suitable for predicting the height of HWCFZ in mines with relatively simple geological conditions; in complex and variable geological conditions, the simulation results may differ significantly from the field results due to scaling effects. In recent years, 3D seismic exploration technology is mostly used for geological formations, resource endowment, and exploration of stratigraphic undulations (Li et al., 2017; Pei, 2020). With the update of 3D seismic data processing software, the resolution accuracy of 3D seismic data is continuously improved, which achieves clearer imaging and more accurate location of underground exploration targets.
There are relatively few studies related to the developmental characteristics of the WCFZ generated after coal seam retrieval by means of 3D seismic technology. In summary, this study uses 3D seismic exploration to investigate its spatial morphology and a new method guide for predicting the 3D developmental morphology of the WCFZ. The 3D seismic survey results were also compared with the field actual WCFZ measurements to further verify the reliability of the 3D seismic survey results.
The Jurassic coalfield in northern Shaanxi is the largest coal base in China. The ecological environment is fragile and water resources are scarce. It is urgent to accurately grasp the 3D shape and development characteristics of the WCFZ to provide a theoretical reference for safe, green, and efficient mining of coal resources and down the ecological environment. This study takes the first mining face of Xiaobaodang No.1 as an example to carry out the study on the 3D morphology and development characteristics of the WCFZ.
The Yushen mine is located in the abdomen of the Jurassic coalfield in northern Shaanxi, with large reserves, simple geological structure, and excellent coal quality.
The Xiaobaodang No. 1 mine is located in the northeastern part of the Phase III planning area of the Yushen mine (Figure 2). Most of the surface is covered by quaternary wind-deposited semi-fixed sand dunes and fixed sand dunes, with wind erosion and wind-deposited desert hills as the main landforms. The general topographic trend is high in the southwest and low in the northeast, with the highest elevation at 1,346.60 m and the lowest elevation at 1,198 m and the general elevation at 1,250–1,300 m, with a maximum relative height difference of 148.60 m.
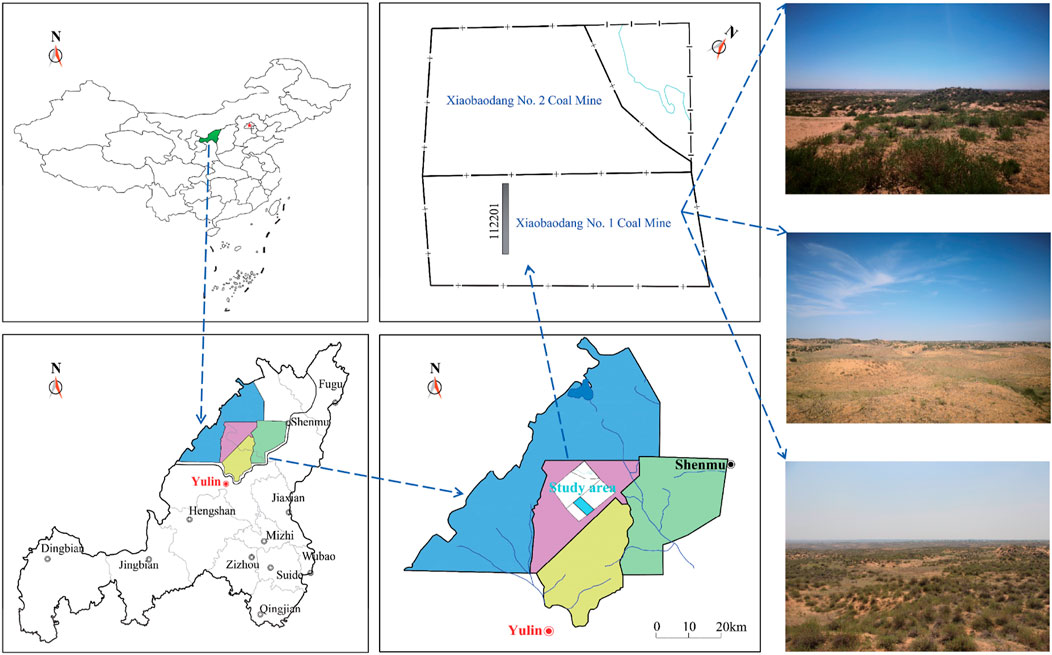
FIGURE 2. Location of the study site.
According to the geomorphic cause, geomorphic form, and composition material, the geomorphic unit of the Xiaobaodang No. 1 mine can be divided into three types of geomorphic features: sand dunes, windy sandy land, and sand-covered red soil mount landforms, among which sand dunes are divided into fixed sand dunes accounting for 14.3%; semi-fixed sand dunes accounting for 69.6%; flowing sand dunes accounting for 5.1%; windy sandy landforms accounting for 10.9%; and sand-covered red soil mount landforms accounting for 0.1%.
The first coal seam in the Xiaobaodang mine is 2−2 coal, with an average recoverable thickness of 5.80 m. The lithology of the coal seam roof is mainly siltstone and fine-grained sandstone, and the burial depth is about 199.69–401.22 m. The first working face is 112,201, with a strike length of 4,660 m and a width of 350 m, and uses a full-height integrated mining process with an average coal seam thickness of 5.8 m. The overlying bedrock of the 2−2 coal seam is mainly sandstone, with a thickness of about 180–260 m. A comprehensive bar chart of the stratigraphy of the study site is shown in Figure 3.
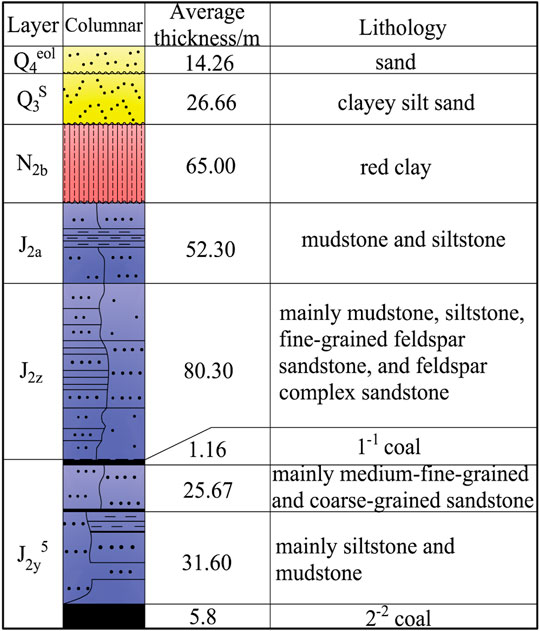
FIGURE 3. Comprehensive bar chart of the stratigraphy of the study site.
The 112,201 working face is the first of the Xiaobaodang coal mine. The previous holes D1 and D2 were drilled on the inclination of the workings, and only the development characteristics of the WCFZ in the dip direction were obtained. In order to further grasp the 3D development characteristics of the WCFZ, combined with the previous construction of boreholes, the drilling location of this arrangement satisfies the vertical arrangement along the advancing direction, the inclination direction of the working face, and the drilling location in Figure 4.
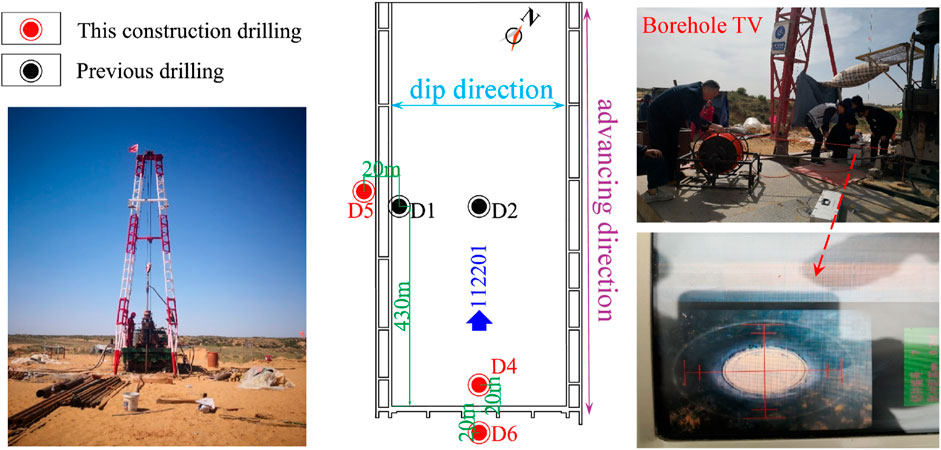
FIGURE 4. Drilling location.
The development height of the WCFZ was analyzed and studied using the leakage of flushing fluid and borehole TV during the construction of the drilling. Figure 4 shows the location of the drilling construction.
Figure 5 shows the extent of flushing fluid leakage and borehole TV detection results during the construction of different boreholes.
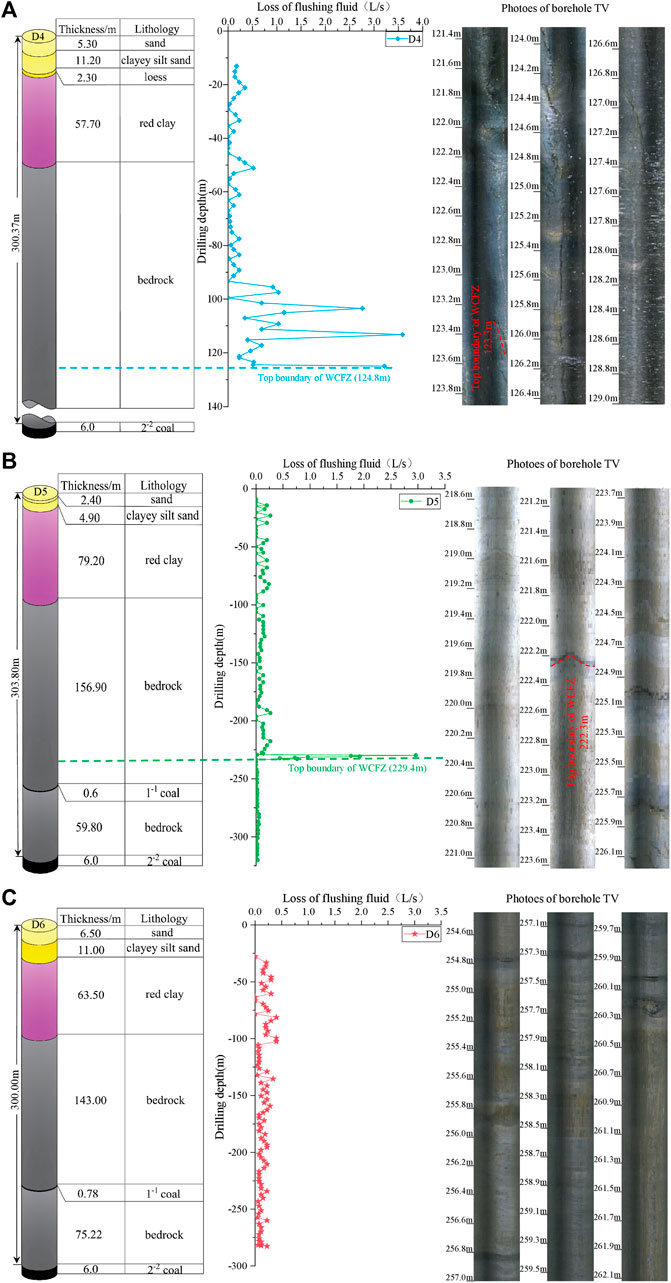
FIGURE 5. Hole flushing fluid leakage and borehole TV results: (A) D4, (B)D5, and (C) D6.
From Figure 5A, it can be seen that the flushing fluid leakage in borehole D4 varies from 0.0 to 0.46 L/S, with an average value of 0.16 L/S at a depth of 95 m. This indicates a very low leakage of borehole flushing fluid within 95 m, mainly due to development of fractures in the primary formation. When the depth is greater than 95 m, the leakage fluid suddenly rises to 1.95 L/s. The variation of flushing fluid leakage during drilling from 114.25 m to 121.84 m ranged from 0.18 to 0.3443 L/s, with an average value of 0.26 L/s. The amount of flushing fluid leakage during drilling was from 121.84 to 124.46 m, with the range varying from 0.7803 to 1.1475 L/s and the average value increased to 0.9639 L/s. Then, from 124.46 m drilling to 124.80 m, the flushing fluid circulation was suddenly interrupted, and all leakage fluid suddenly was lost. This indicates that the drill bit has entered the top boundary of the WCFZ. From this, it is determined that the top boundary position for the development of the WCFZ is 124.80 m. The borehole TV result shows that 123.3 m is the top boundary of the WCFZ in D4.
From Figure 5B, it can be seen that the flushing fluid circulates normally when the depth of the D5 borehole is less than 229.40 m, and the consumption ranges from 0.00 to 0.63 L/s, with an average value of 0.083 L/s. At a depth of 229.40 m, all the drilling flushing fluid was lost, and the leakage amount was 3.33 L/s. The drill bit has entered the top boundary of the WCFZ. From this, it is determined that the top boundary position for the development of the WCFZ is 229.40 m. The borehole TV result shows that 222.3 m is the top boundary of the WCFZ in D5.
From Figure 5C, it can be seen that the flushing fluid circulates normally in drilling D6 during drilling, and the flushing fluid leakage varies from 0.00 to 0.315 L/s, with an average value of 0.06 L/s. This means that the mining-induced WCFZ was not developed in D6. The borehole TV results in D6: the borehole wall was smooth without cracks, and no cracks were produced.
The borehole TV is a continuous real-time observation of the whole hole section and can intuitively locate and quantitatively describe WCFZ development and distribution position of the rock body accurately, with high accuracy, which can realize the visualization and digitalization of mining. When recording the flushing fluid loss in segments during drilling, there is an observation lag error, resulting in some deviation from the recorded result, which can only determine the approximate range of the developed height of the WCFZ. Therefore, the height of the WCFZ measured by borehole TV is the final result in this study, and the WCFZ development height of each drilling is shown in Table 1.
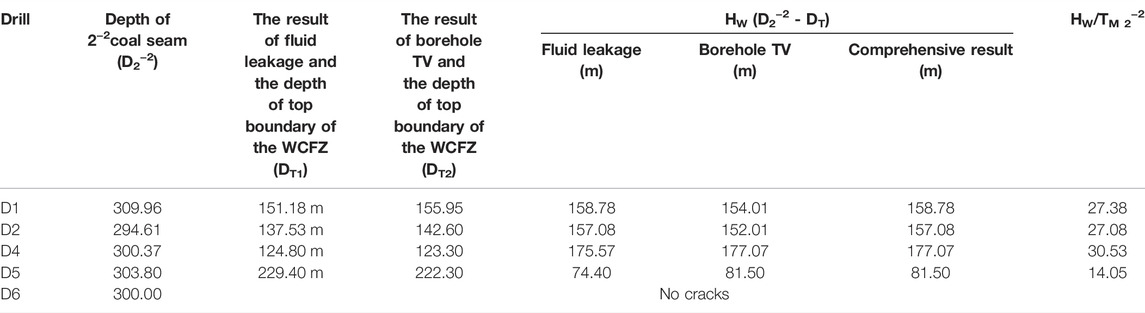
TABLE 1. Height of WCFZ development.
The 3D development characteristics of the WCFZ and 3D seismic exploration are carried out on the basis of the actual measurement of the WCFZ in the drilling. The development height of the WCFZ obtained by two different methods is compared to verify the accuracy of the interpretation results of 3D seismic exploration.
Based on this, the high-density 3D seismic field data acquisition range is arranged within the scope of the working face drilling construction, which is convenient for comparison and research. The data acquisition area is about 0.31 km2. The scope of 3D seismic construction is shown in Figure 6.
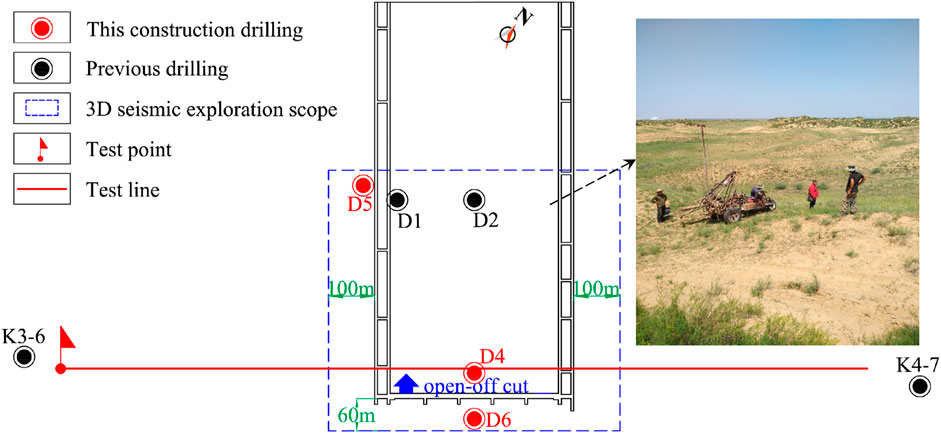
FIGURE 6. 3D seismic exploration scope.
Whether the observation system is selected correctly or not will directly affect the efficiency of field construction, accuracy of results, and cost of exploration. 3D seismic acquisition is an area acquisition technology, which is characterized by using a reasonable combination of shot grid and geophone grid to obtain a uniformly distributed grid of underground data points and required coverage times. Based on this, the seismic geological conditions of the selected test site locations are representative, no fracture structures are developed in the vicinity of the test site, and the test site is located at or near the borehole or through the borehole, as a result of actual field investigations and analysis of geological data prior to data acquisition. One test point and one test line were selected for testing in the exploration area, and the selected location is shown in Figure 6. It is better to ensure that the observed target layer is complete and continuous, facilitating the comparative analysis of test data and the analysis of reflected waves from the target layer.
The 3D seismic exploration test finally divided the optimal excitation parameters of the exploration area into two situations: excitation at 3 m below the red soil layer, drug dosage, phreatic well depth of 3 m, and chemical dosage of 2 kg. By comparing 10 Hz, 60 Hz, high-sensitive single-point 7 Hz geophone and digital geophone to the sensitivity of the information in this area, a high-sensitivity geophone with a natural frequency of 7 Hz is finally used for signal reception. An e-428 high-resolution digital seismometer with a sampling interval of 0.5 ms, a recording length of 2.0 s, recording format SEG-D, and full-band reception is used. The parameters of the observation system are shown in Table 2.
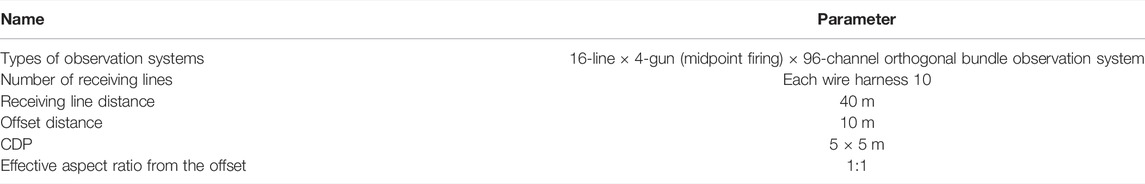
TABLE 2. Main parameters of the observation system.
In order to quantitatively interpret the developmental pattern of the WCFZ, seismic data, multi-attribute data, pre-stack elastic inversion, anisotropic interpretation, and fracture indicator curves were inverted using probabilistic neural network techniques.
Figure 7 shows the training data of the fracture inversion. Before training the neural network, the fracture indication curves of all boreholes were normalized to eliminate the influence caused by the difference in sampling value.

FIGURE 7. Training data for fracture inversion.
This 3D seismic survey has achieved good results within the study area, with the similarity coefficient between the inversion results, and the similarity coefficient is 0.97, with high accuracy (Figure 8) combined with the fracture indication curve to divide the fracture zone and caved zone. In the fracture indicator data, the value in the range of 0–1 denotes the undeveloped area of the fracture and is divided into the curved subsidence zone and normal zone. Values between 1 and 2.5 are classified as fracture zone; values greater than 2.5 are classified as the caved zone.

FIGURE 8. PNN inversion similarity coefficient (the similarity coefficient is 0.97).
The results of the fracture-indicating inversion profiles obtained by seismic geological interpretation are shown in Figure 9. As can be seen in Figure 9, in terms of depth, the development density in the upper area of the WCFZ to some extent is compared to that of the lower area as the distance between the HWCFZ and the mined coal seam increases. The characteristic of the development density of the WCFZ in the edge regions on both sides of the working face is higher than that in the inner working face.
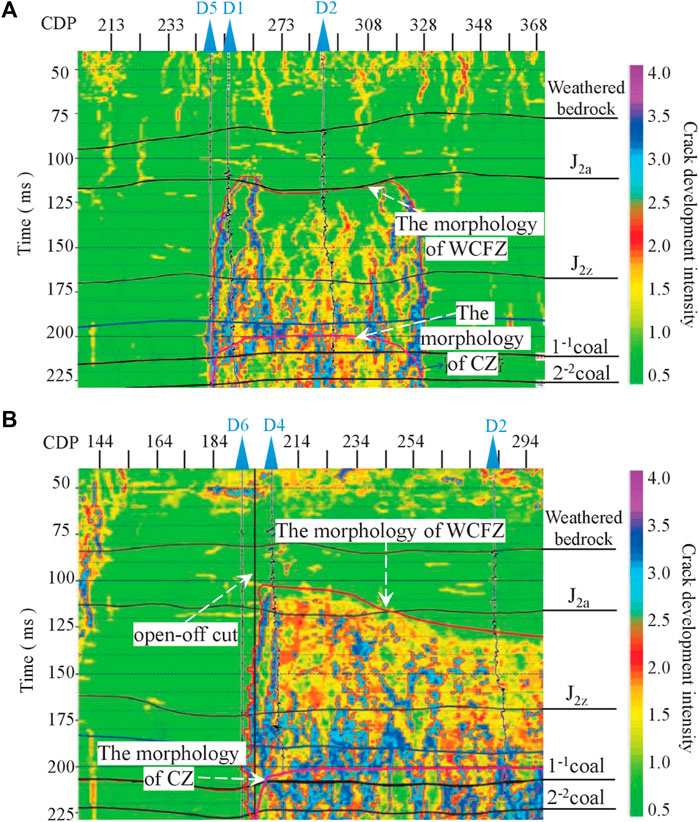
FIGURE 9. Fracture indicator inversion profile: (A) Inversion profile of working face incline and fissure indication and (B) inversion profile of working face strike crack indication.
The propagation velocity of seismic reflection waves is an important parameter for seismic data processing and interpretation, and it is the basis for time-depth conversion. Its accuracy directly affects the accuracy of interpretation results.
First of all, the velocity field is established according to the time–depth relationship calibrated by synthetic records (Figure 10A). According to the drilling data that have been constructed within the 3D seismic exploration range, the burial depth of the stratum and the t0 time of the corresponding stratum reflection wave are used to inversely calculate the interfacial velocity of the stratum and perform coefficient correction to obtain the final time-depth conversion velocity.
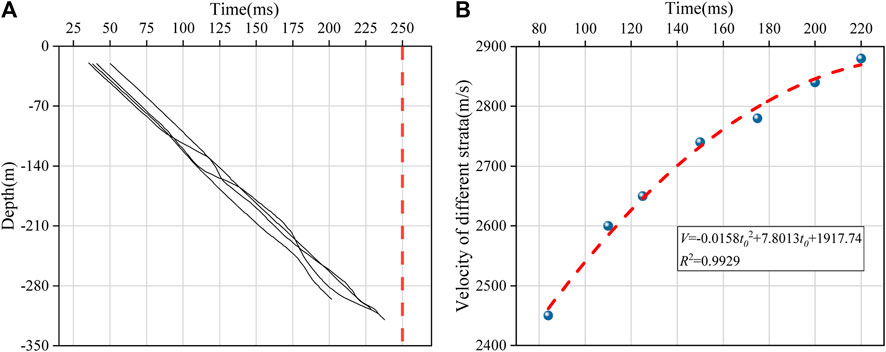
FIGURE 10. Time-depth conversion of the WCFZ: (A) Velocity field establishment and (B) time-depth conversion velocity diagram of the WCFZ.
In this study, a large number of experiments and parameter tests have been carried out to correct the time-depth conversion velocity of D1, D2, D4, D5, and D6 boreholes in the process of 3D seismic exploration and interpretation. The Green Mountain static correction method based on refractive wave theory uses the original single-gun first-arrival refractive wave data to first strip away the low-velocity layer and correct to the near-surface floating surface. The floating data are corrected to the uniform data by selecting uniform data of +1,300 in the whole area and using a substitution speed of 2000 m/s. After correction, the first arrivals were smooth, and the correction effect was obvious.
The final determination of the unified static calibration datum elevation for the whole region is +1300 m, and the alternative velocity is 2000 m/s to calibrate the floating data to the unified data. The mathematical equation for the velocity calibration is determined (Eq. 1).
where V is the calibration velocity of the borehole point.
H is the elevation of the stratum corresponding to the borehole point, and t0 is the two-way travel time of the reflected wave of the stratum corresponding to the borehole.
As can be seen in Figure 10, all boreholes in the survey area were back-calculated for stratigraphic interface velocities using their burial depth and the corresponding two-way travel time t0 of the stratigraphic reflected waves, and the resulting time-to-depth converted velocity data were finally fitted using Origin (Figure 10B).
It was found that there was a positive correlation between the calibration velocity V and the two-way travel time t0 of the corresponding stratigraphic reflected waves for boreholes in the medium-deep buried zone; however, the rate of increase of the calibration velocity V at the borehole sites decreased with time. The fitted time-to-depth conversion rate relationship for the WCFZ in the study area is specified in Eq. 2.
Combining Eq. 1 with Eq. 2 yields Eq. 3.
It can be seen from Figure 9 that after the mining of the 2−2 coal seam, the top time t0 of the development height of the WCFZ in different positions is 105–175 ms.
Substituting the obtained t0 into Eq. 3, the elevation range of the top of the WCFZ in different boreholes is 1,055.08 ∼ 1,165.46 m, and the development height relative to the coal bed roof is 79.83 ∼ 178.03 m.
Table 3 shows the comparison of the development heights of the WCFZ in D1, D2, D4, D5, and D6 obtained by field measurement and 3D seismic exploration.
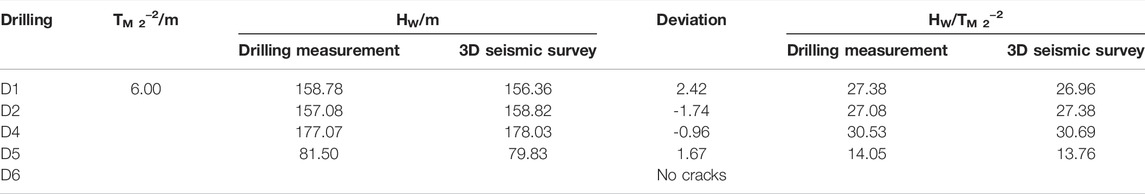
TABLE 3. WCFZ obtained by different methods.
It can be seen from Table 3 that the development height of the WCFZ obtained by 3D seismic exploration is basically consistent with the field measurement results, and the absolute value of the error is between 0.962 and 2.42 m. Therefore, it is considered that it is feasible to judge the 3D shape and development characteristics of the WCFZ after coal seam mining by 3D seismic exploration. This method can visually and clearly observe the spatial development of the WCFZ.
The specific interpretation result of 3D seismic exploration is that the development form of the water-conducting fractured zone is relatively high near the open-off cut. The height of development along the working face gradually decreases in the direction of pushing and mining and is “half saddle-shaped.” The development pattern of the WCFZ in the direction perpendicular to the working face is characterized by being high on both sides and slightly low in the middle, similar to “saddle-shaped” (Figure 11). The development of the WCFZ in the area on both sides of the working face and at the open-off cut is relatively strong during the mining process, and the area in the middle of the working face is relatively weakened. This result provides an important reference for the corresponding water resource protection in the mining process of other surrounding mines in the future.
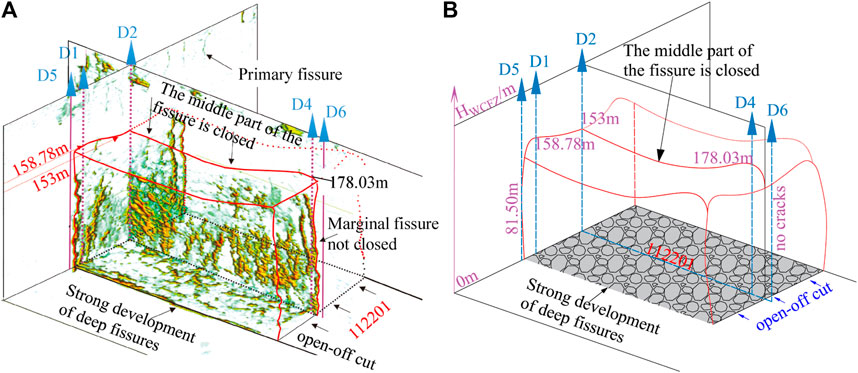
FIGURE 11. Fracture indication inversion data hollow display. (A) 3D seismic survey interpretation results of the WCFZ. (B) Schematic 3D morphology of WCFZ.
This study presents a method to interpret the 3D development characteristics of the WCFZ in the mining area by using the 3D seismic exploration method, and the results of borehole exploration and 3D seismic exploration are compared and analyzed to determine the 3D development characteristics of the WCFZ in the study site after coal seam mine. The conclusions are as follows:
1) By comparing the results of HWCFZ of field measurement and 3D seismic survey, the error range between the results of the 3D seismic survey and field measurement is within ±7 m, which shows the reliability and reasonableness of the 3D seismic survey, and the research results provide a new method to grasp the 3D morphological characteristics of the WCFZ of coal seam mining.
2) In this study, it is found that the development density of the upper area of the WCFZ decreases to a certain extent compared with the lower area as the distance between the HWCFZ and the mined coal seam increases, and the development density of the WCFZ as a whole is characterized by higher development density of the WCFZ in the marginal area on both sides of the working face than in the area inside the working face.
3) The results of this study of 3D morphology of HWCFZ after mining of the medium-deep buried coal seam. Specifically, the HWCFZ gradually decreases along the advancing direction in a “semi-saddle shape,” and the HWCFZ along the dip direction is characterized by being high on both sides and slightly low in the middle, similar to “saddle-shaped.” The development pattern of the WCFZ perpendicular to the working face direction is characterized by being high on both sides and slightly low in the middle, similar to a “saddle-shaped.”
The original contributions presented in the study are included in the article/Supplementary Material; further inquiries can be directed to the corresponding authors.
DF, EH, and SW designed the study; DF, XX, FY, and YX completed the analysis of the 3D seismic survey; DF, LG, GW, and ZC obtained the field measurement data and analyzed; DF, EH, and SW improved the manuscript draft; all authors have read and agreed to the published version of the manuscript.
This research was supported by the National Natural Science Foundation of China (No. 42177174), the Scientific Research Fund of the Shaanxi Coal Chemical Industry Group (2018MHKJ-B-J-24), the Central Government Guides, the Special Project of Local Science and Technology Innovation (2020ZY-JC-03), and the Shaanxi Province Joint Fund Project (2021JLM-09).
Authors LG and GW were employed by Shaanxi 185 Coal Field Geology Co., Ltd. Authors YX and ZC were employed by Shaanxi Xiaobaodang Mining Co., Ltd. Authors FY was employed by the company Shaanxi Institute of Geological Survey.
The remaining authors declare that the research was conducted in the absence of any commercial or financial relationships that could be construed as a potential conflict of interest.
All claims expressed in this article are solely those of the authors and do not necessarily represent those of their affiliated organizations, or those of the publisher, the editors, and the reviewers. Any product that may be evaluated in this article, or claim that may be made by its manufacturer, is not guaranteed or endorsed by the publisher.
Dawei, Z., Kan, W., Zhihui, B., Zhenqi, H., Liang, L., Yuankun, X., et al. (2019). Formation and Development Mechanism of Ground Crack Caused by Coal Mining: Effects of Overlying Key Strata. Bull. Eng. Geol. Environ. 78, 1025–1044. doi:10.1007/s10064-017-1108-2
Dong, S., Wang, H., Guo, X., and Zhou, Z. (2021). Characteristics of Water Hazards in China's Coal Mines: A Review. Mine Water Environ. 40, 325–333. doi:10.1007/s10230-021-00770-6
Du, F., and Gao, R. (2017). Development Patterns of Fractured Water-Conducting Zones in Longwall Mining of Thick Coal Seams-A Case Study on Safe Mining under the Zhuozhang River. Energies 10, 1856–1916. doi:10.3390/en10111856
Fan, H., Wang, L., Lu, Y., Li, Z., Li, W., and Wang, K. (2020). Height of Water-Conducting Fractured Zone in a Coal Seam Overlain by Thin Bedrock and Thick Clay Layer: a Case Study from the Sanyuan Coal Mine in North China. Environ. Earth Sci. 79, 1–11. doi:10.1007/s12665-020-8873-0
Gao, F., Stead, D., and Coggan, J. (2014). Evaluation of Coal Longwall Caving Characteristics Using an Innovative UDEC Trigon Approach. Comput. Geotechnics 55, 448–460. doi:10.1016/j.compgeo.2013.09.020
Gui, H., Qiu, H., Chen, Z., Ding, P., Zhao, H., and Li, J. (2020). An Overview of Surface Water Hazards in China Coal Mines and Disaster-Causing Mechanism. Arab. J. Geosci. 13, 1–11. doi:10.1007/s12517-019-5046-0
Li, H., Zhang, B., Bai, H., Wu, J., Meng, Q., Xiao, N., et al. (2018). Surface Water Resource Protection in a Mining Process under Varying Strata Thickness-A Case Study of Buliangou Coal Mine, China. Sustainability 10, 4634–4715. doi:10.3390/su10124634
Li, J., Li, F., Hu, M., Zhang, W., and Pan, D. (2017). Evaluation of Geological Conditions for Coalbed Methane Occurrence Based on 3D Seismic Information: a Case Study in Fowa Region, Xinjing Coal Mine, China. Acta Geophys. 65, 345–351. doi:10.1007/s11600-017-0027-8
Liu, W.-r. (2019). Experimental and Numerical Study of Rock Stratum Movement Characteristics in Longwall Mining. Shock Vib. 2019, 1–15. doi:10.1155/2019/5041536
Liu, X., Tan, Y., Ning, J., Tian, C., and Wang, J. (2015). The Height of Water-Conducting Fractured Zones in Longwall Mining of Shallow Coal Seams. Geotech. Geol. Eng. 33, 693–700. doi:10.1007/s10706-015-9851-2
Liu, Z., Fan, Z., and Zhang, Y. (2019). Fracture Characteristics of Overlying Bedrock and Clay Aquiclude Subjected to Shallow Coal Seam Mining. Mine Water Environ. 38, 136–147. doi:10.1007/s10230-018-0549-6
Pei, X. (2020). Signal Acquisition Method for 3D Seismic Exploration in High Density Coal Mining Area. Arab. J. Geosci. 13, 1–11. doi:10.1007/s12517-020-05599-x
Sui, W., Hang, Y., Ma, L., Wu, Z., Zhou, Y., Long, G., et al. (2015). Interactions of Overburden Failure Zones Due to Multiple-Seam Mining Using Longwall Caving. Bull. Eng. Geol. Environ. 74, 1019–1035. doi:10.1007/s10064-014-0674-9
Sun, Q., Zhang, J., Zhang, Q., and Zhao, X. (2017). Analysis and Prevention of Geo-Environmental Hazards with High-Intensive Coal Mining: A Case Study in China's Western Eco-Environment Frangible Area. Energies 10, 786–815. doi:10.3390/en10060786
Wang, G., Wu, M., Wang, R., Xu, H., and Song, X. (2017). Height of the Mining-Induced Fractured Zone above a Coal Face. Eng. Geol. 216, 140–152. doi:10.1016/j.enggeo.2016.11.024
Wang, S., Li, X., and Wang, S. (2017). Separation and Fracturing in Overlying Strata Disturbed by Longwall Mining in a Mineral Deposit Seam. Eng. Geol. 226, 257–266. doi:10.1016/j.enggeo.2017.06.015
Xie, X., Hou, E., Wang, S., Sun, X., Hou, P., Wang, S., et al. (2021). Formation Mechanism and the Height of the Water-Conducting Fractured Zone Induced by Middle Deep Coal Seam Mining in a Sandy Region: A Case Study from the Xiaobaodang Coal Mine. Adv. Civ. Eng. 2021, 1–11. doi:10.1155/2021/6684202
Yan, W., Dai, H., and Chen, J. (2018). Surface Crack and Sand Inrush Disaster Induced by High-Strength Mining: Example from the Shendong Coal Field, China. Geosci. J. 22, 347–357. doi:10.1007/s12303-017-0031-7
Yang, X., Wen, G., Dai, L., Sun, H., and Li, X. (2019). Ground Subsidence and Surface Cracks Evolution from Shallow-Buried Close-Distance Multi-Seam Mining: A Case Study in Bulianta Coal Mine. Rock Mech. Rock Eng. 52, 2835–2852. doi:10.1007/s00603-018-1726-4
Zhang, Y., Cao, S., Wan, T., and Wang, J. (2018). Field Measurement and Mechanical Analysis of Height of the Water Flowing Fracture Zone in Short-Wall Block Backfill Mining beneath the Aquifer: A Case Study in China. Geofluids 2018, 1–12. doi:10.1155/2018/7873682
Keywords: field measurement, 3D seismic survey, water-conducting fractured zone, 3D development characteristics, medium–deep coal seam
Citation: Feng D, Hou E, Wang S, Xie X, Yuan F, Guo L, Wang G, Xie Y and Chen Z (2022) Research on 3D Development Characteristics of Water-Conducting Fractured Zone Based on Field Measurement. Front. Earth Sci. 10:808931. doi: 10.3389/feart.2022.808931
Received: 04 November 2021; Accepted: 21 April 2022;
Published: 26 May 2022.
Edited by:
Wei Liu, Chongqing University, ChinaReviewed by:
Gang Wang, Shandong University of Science and Technology, ChinaCopyright © 2022 Feng, Hou, Wang, Xie, Yuan, Guo, Wang, Xie and Chen. This is an open-access article distributed under the terms of the Creative Commons Attribution License (CC BY). The use, distribution or reproduction in other forums is permitted, provided the original author(s) and the copyright owner(s) are credited and that the original publication in this journal is cited, in accordance with accepted academic practice. No use, distribution or reproduction is permitted which does not comply with these terms.
*Correspondence: Dong Feng, enlmZDIwMTgwNjE5QDE2My5jb20=; Enke Hou, aG91ZWtAeHVzdC5lZHUuY24=
Disclaimer: All claims expressed in this article are solely those of the authors and do not necessarily represent those of their affiliated organizations, or those of the publisher, the editors and the reviewers. Any product that may be evaluated in this article or claim that may be made by its manufacturer is not guaranteed or endorsed by the publisher.
Research integrity at Frontiers
Learn more about the work of our research integrity team to safeguard the quality of each article we publish.