 Zhen Wang
 Lifeng Yang1,2
 Rui Gao
 Guanshui Xu
95% of researchers rate our articles as excellent or good
Learn more about the work of our research integrity team to safeguard the quality of each article we publish.
Find out more
METHODS article
Front. Earth Sci. , 11 February 2022
Sec. Economic Geology
Volume 10 - 2022 | https://doi.org/10.3389/feart.2022.808183
This article is part of the Research Topic New Advances in Geology and Engineering Technology of Unconventional Oil and Gas View all 24 articles
Zipper fracturing has become one of the routine reservoir stimulation methods for developing unconventional resources such as shale oil and gas. A non-planar 3D fracture propagation model is used to study the fracture propagation behavior of zipper fracturing. The effects of stage time lag, staggered perforation cluster spacing, and horizontal principal stress contrast on the fracture geometry are analyzed through numerical simulation. The simulation results show that increasing the stage time lag can increase the fracture length and improve inter-well stimulation. For the formation with higher horizontal principal stress contrast, the staggered perforation cluster spacing has a minimum effect on the fracture configuration of zipper fracturing. For the formation with lower horizontal principal stress contrast, the fractures follow the curved paths and intersect with each other, which potentially has adverse effects on the stimulation of the subsequent stages.
The development of hydraulic fracturing technology for unconventional petroleum resources has been a subject of considerable interest in recent years (Soliman et al., 2008; Li et al., 2017; Zhang et al., 2017; Zhang et al., 2019; Xie et al., 2020; Zhang et al., 2021a; Zhang et al., 2021b). Multistage, multicluster fracturing (MMF) of horizontal wells has become widely used to produce hydrocarbon from unconventional reservoirs, such as shales and tight sandstones. As shown in Figure 1A, the consecutive-fracturing sequence is the most commonly used fracturing sequence of MMF for a single horizontal well. In consecutive fracturing, fractures are created sequentially stage by stage along the same wellbore. Another fracturing sequence of MMF in a single horizontal well, referred to as “alternate fracturing,” was proposed to decrease fracture spacing and generate additional fracture complexity (Roussel and Sharma 2011). This strategy places the second fracture at the location of what would traditionally be the third fracture, followed by the propagation of a “middle fracture” (Figure 1B). However, due to the limitations of fracturing tools and fracturing technique levels, the alternate fracturing method is rarely used for practical hydraulic-fracturing treatments. Zipper fracturing is also proposed as a method to improve production performance in wells in pad-drilling applications. Specifically, this method refers to fracturing two or more parallel horizontal wells. The fracturing treatment is performed stage by stage alternatively along the two wells. The method saves the pump-down and plug-and-perf standby time and, therefore improves operational efficiency compared with consecutive fracturing in one well. It is also expected that the treatment further promotes fracture network complexity to improve production performance (Qiu et al., 2015). Figure 2 illustrates the two completion scenarios of zipper fracturing. The so called “tip-to-tip” zipper fracturing is shown in Figure 2A, and staggered zipper fracturing is shown in Figure 2B. In a practical stimulation treatment, it is nearly impossible to guarantee the precise tip-to-tip fracture placement in two horizontal wells. Therefore, we consider the tip-to-tip configuration as the special case of staggered zipper fracturing. Only staggered zipper fracturing is studied in this paper.
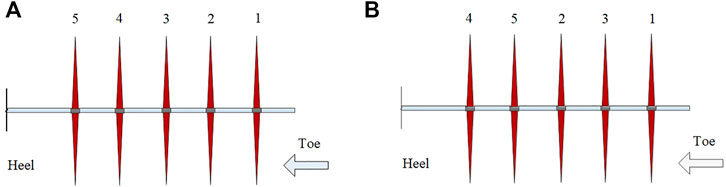
FIGURE 1. Sketch of two fracturing sequence in the single horizontal well. (A) Consecutive sequence (1-2-3-4-5); (B) alternate sequence (1-3-2-4-5).
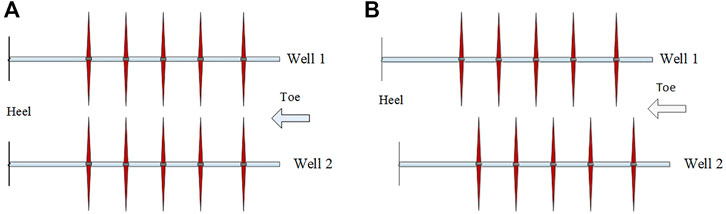
FIGURE 2. Sketch of two completion scenarios of zipper fracturing in two horizontal wells. (A) Tip-to-tip zipper fracturing configuration; (B) staggered zipper fracturing configuration.
Various mathematical models have been used to evaluate the effectiveness and performance of zipper fracturing. Rafiee et al. (2012) estimated both tip-to-tip and staggered zipper in terms of the fracture geometry, stress interference, and production performance through an analysis of different predefined planar fractures. The results demonstrated that the staggered zipper fracturing improves the performance of fracturing treatment compared with the tip-to-tip zipper fracturing due to increased contact area. Using a poroelastic model, Manchanda et al. (2014) studied the time-dependent stress interference behavior of induced unpropped fractures in both consecutive and zipper fracturing. The results showed that the time interval between adjacent fractures in a wellbore is a key parameter for the design of treatments. The longer time interval leads to stress shadow shrinking from the closure of the induced unpropped fractures, resulting in less fracture interference and improved performance. The model also assumed the predefined planar fracture in the numerical analysis. Shen (2014) investigated the influence of neighboring stimulation stages on generating the stimulated reservoir volume (SRV) with a continuum damage model based on a hydro-mechanical finite element method (FEM). The results indicated that the SRV generated by the sequential injection method is significantly less than that generated by the simultaneous injection method. Nagel et al. (2014) presented a study of multiwell completion using a hydromechanical coupled discrete element model. The results showed that the improvement in well stimulation using the zipper-fracturing completion technique is highly dependent on the in situ pore pressure, in situ stresses, and natural fracture characteristics. Sierra and Mayerhofer (2014) reviewed and discussed numerical reservoir-modeling results of zipper fracturing and demonstrated that the benefits of zipper fracturing could be maximized by generating proper fracture geometry and properly staggering the perforation/fracture system. Qiu et al. (2015) studied zipper fracturing using an unconventional fracture model capable of simulating branched fracture propagation. The quantitative results show that zipper fracturing may not deliver an obvious production benefit compared with sequential fracturing, depending on well spacing and perforation cluster spacing. Shi et al. (2018) applied the extended finite element method (XFEM), which is based on the cohesive zone method (CZM), to model fracture propagation at a reservoir with different mechanical homogeneities. The numerical studies confirmed that a staggered zipper fracturing scenario could assist hydraulic fracture propagation along a straight path.
The displacement discontinuity method (DDM) is widely used in dealing with fracture deformation problems for its high computational efficiency (Tang et al., 2018; Tang et al., 2019; Cong et al., 2021a; Cong et al., 2021b; Li et al., 2021). In this paper, we adopt a nonplanar 3D fracture model, based on 3D DDM, to investigate the fracture propagation behavior of zipper fracturing. The effects of the stage time lag, staggered perforation cluster spacing, and stress contrast will be studied in detail. Here the stage time lag refers to the time interval between the adjacent two fracturing stages. The nonplanar 3D fracture model simulates fracture propagation, fluid flow, and proppant transportation in a fully coupled hydromechanical manner (Xu and Wong 2013). The special feature of this model includes fracture closure in shut-in and curved fracture intersection, which makes quantitative analysis of time-dependent fracture interference and intersection possible.
The adopted non-planar 3D fracture model assumes that all fractures are vertical and can turn in the horizontal direction. The fractures are discretized into structured rectangular elements, and all field variables, such as fracture opening, shear displacement, fluid pressure, and proppant volumetric concentration, are registered and associated with these elements. Fractures are assumed to be filled with slurry (the mixture of fracturing fluid and proppants), and fluid lag at the crack tip region is neglected.
Specifically, the fracture deformation is described by the 3D displacement discontinuity method (Shou 1994):
where
The fluid flow and proppant transport within a fracture are represented by the volume conservation equations (Adachi et al., 2007):
where
where
where
where
Function
where
Blocking function
To include the limited entry technique, the perforation pressure drop pr is modeled by the Bernoulli equation (Long and Xu 2017):
where
The volume conservation Eqs. 2 and 3 for fluid and proppant are discretized by the finite volume method as follows:
where
The interface fluid flux
The interface proppant flux
where
The elasticity Eq. 1 and volume conservation Eqs 10–11 form a set of transient nonlinear coupled equations, with the fracture width
Fracture advances when the mode I (opening) stress intensity factor
where
The direction of fracture growth is oriented along with the maximum horizontal principal stress, which is expressed by:
where
The model is validated by comparing with existing asymptotic analytical solutions of penny-shaped hydraulic fracture propagation (Dontsov 2016), where the viscosity-dominated fracture configuration is described by:
where
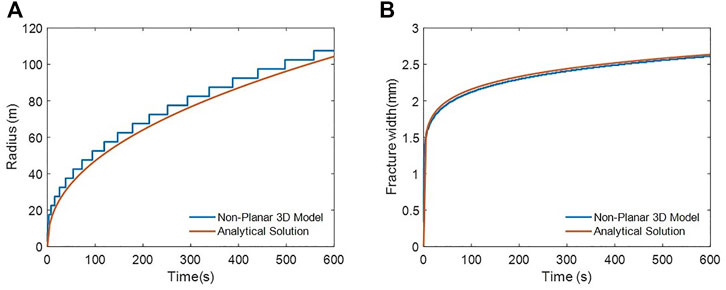
FIGURE 3. Comparisons between nonplanar 3D model and analytical solutions. (A) Radius; (B) fracture width.
This section presents a detailed study of the effects of various parameters on zipper fracturing, including the stage time lag, perforation cluster spacing, and stress contrast. A typical two-horizontal-well zipper fracturing with staggered fractures is considered as shown in Figure 4. Each stage has three perforation clusters. Without loss of generality, only stage 1 and stage 2 are selected to be analyzed. Here we define the length of the part of a fracture between two horizontal wells as penetration length, which can reflect the interwell stimulation effectiveness to some extent. The staggered perforation cluster spacing is also shown in Figure 4 as the spacing between two adjacent perforation clusters in the two horizontal wells. We assume that the perforation cluster has an even spacing in the single horizontal well.
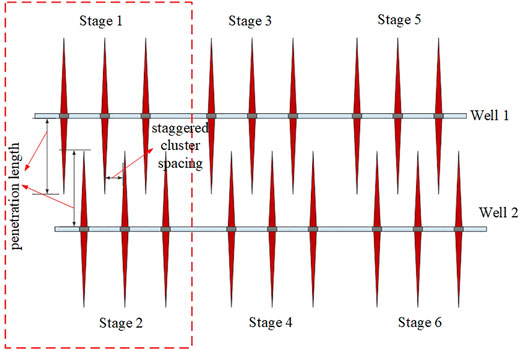
FIGURE 4. Sketch of zipper fracturing.
The basic inputs of the simulations, such as treatment, reservoir and completion parameters, are listed in Table 1. The formation is assumed to have three layers. The thickness of the perforated zone is 60 m and sandwiched by two stress-barrier zones with 5 MPa in situ stress confinement. The stress confinement contains the vertical height of the fracture; as a result, we can focus on the fracture-width distribution and length when performing sensitivity analysis. The horizontal principal stress contrast is 10 MPa, and the well spacing is 300 m. The perforation cluster spacing of both wells is 30 m, and the staggered perforation cluster spacing is 15 m. Table 2 presents the pumping schedule. The slurry injection rate is 12 m3/min, and the total injection time is 60 min for one stage with a total proppant of 277 tons. The time lag between stage 1 in well 1 and stage 2 in well 2 is 60 min. The two stages use the same pumping schedule. After slurry injection, a 120-min shut-in time ensures that the fracturing fluid can leak off adequately and release the fluid pressure thoroughly. If not specified, the above-mentioned parameters are used for all the simulations.
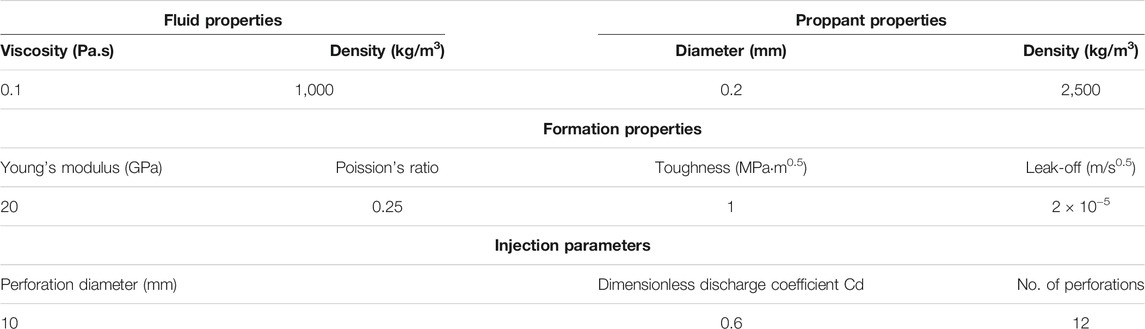
TABLE 1. Basic input parameters.
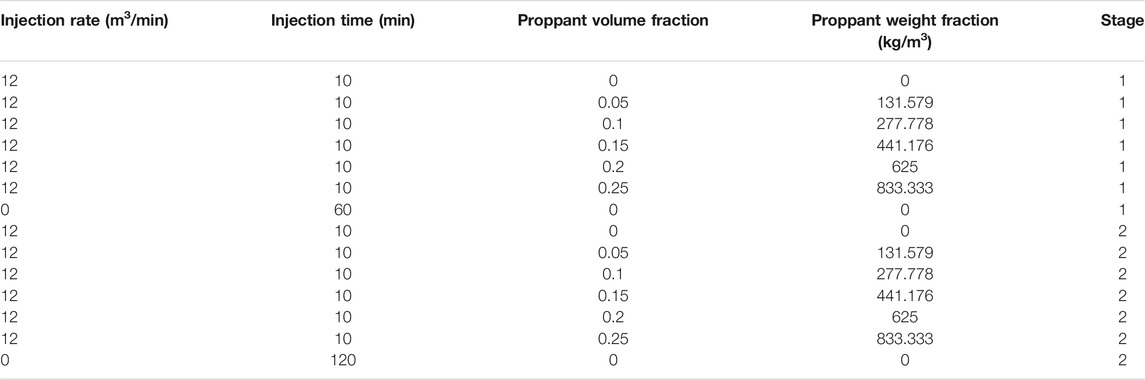
TABLE 2. Pumping schedule.
Three zipper fracturing scenarios are presented and analyzed to investigate the influence of the stage time lag of a two-horizontal-well zipper fracturing on fracture growth. Figure 5 shows the fracture configurations of different well completions. Figure 5A is side and top view of the basic model of sequential zipper fracturing with a 60-min stage time lag, as shown in the section 3.1. Figure 5B is side and top view of a sequential zipper fracturing without the stage time lag. Figure 5C is side and top view of a case of simultaneous zipper fracturing. Especially, for simultaneous zipper fracturing, the pumping schedule merges to one stage for the two wells, and the injection time doubles. Figure 6 presents the fracture length and penetration length of hydraulically induced fractures of the corresponding well completion.
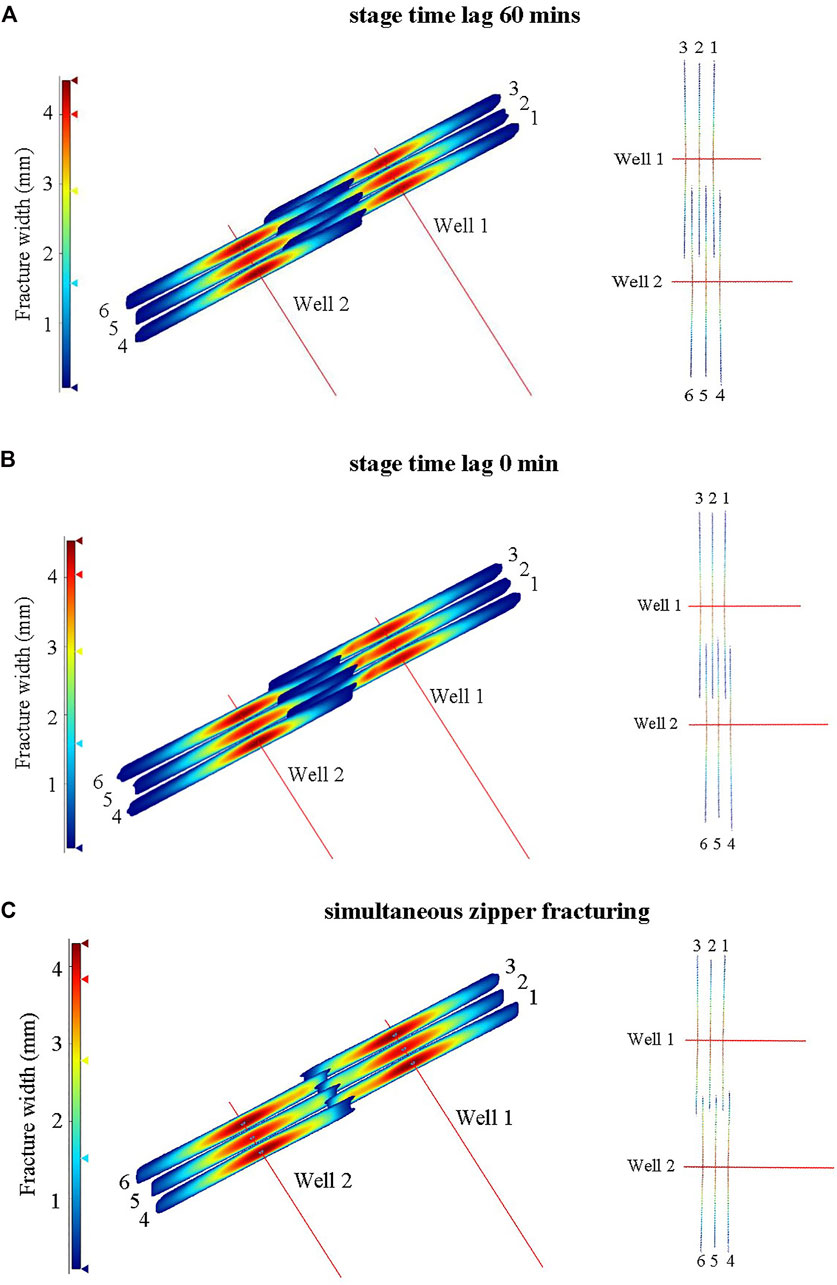
FIGURE 5. Fracture configuration of different well completions. (A) Side view (left) and top view (right) of sequential zipper fracturing, stage time lag 60 min; (B) side view (left) and top view (right) of sequential zipper fracturing, stage time lag 0 min; (C) side view (left) and top view (right) of simultaneous zipper fracturing.
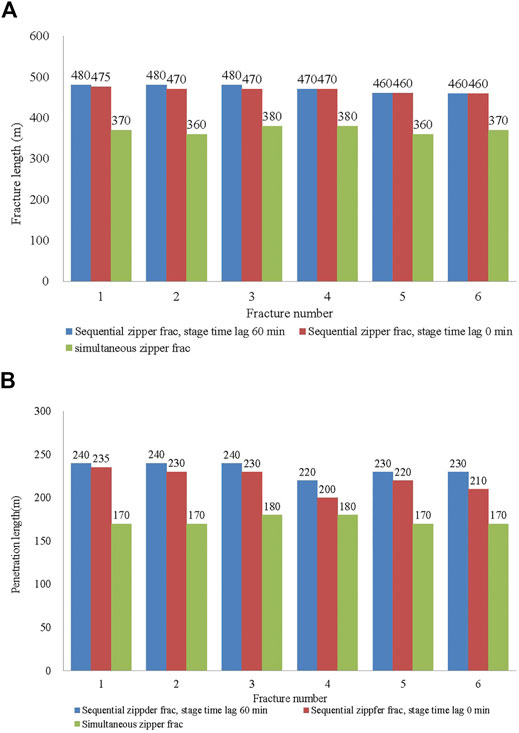
FIGURE 6. Fracture length and penetration length of different well completions. (A) Fracture length; (B) penetration length.
The results in Figures 5, 6 indicate that the stage time lag substantially influences fracture configuration. For the sequential zipper fracturing, as the stage time lag reduces, both the fracture length and the penetration length of well 1 decrease, as shown in Figures 5A,B, 6. This implies that during the stage time lag, the fractures in well 1 continue propagating while leak-off, and this is caused by the rebalancing of fluid pressure in the fracture even though there is no fluid injection. Although the two stages employ the same pumping schedule, the induced fractures of stage 1 changed the local stress field around fractures, so the hydraulically induced fractures of stage 2 in well 2 are suppressed, to some extent, by the fractures of stage 1 in well 1. When the stage time lag reduces to zero, the fracture growth of stage 2 influences the rebalancing of fluid pressure of fractures in stage 1 and, thus, suppresses the further growth of fractures in stage 1. This is why the fracture length of well 1 with no stage time lag is less than the fracture length of well 1 with a 60-min stage time lag as shown in Figure 6. It is noteworthy that interwell/interstage interference is mutual, i.e., all of the fracture propagation in stage 1 and stage 2 are influenced by each other. The fracture length of well 2 does not seem to change for the two scenarios of the sequential zipper fracturing, but the penetration length decreases for the well with less stage time lag. The fracture tends to propagate away from the interwell region, which may result in inefficient interwell stimulation. The simultaneous zipper fracturing has the most severe interwell/interstage interference; the fracture length and penetration length decrease about 20% compared with sequential zipper fracturing, as shown in Figures 5C, 6. The corresponding inter-well stimulation effectiveness is worst.
To study the influence of staggered perforation cluster spacing on zipper fracturing, we decrease the staggered perforation cluster spacing to 10m and 5 m. Compared with Figure 5A, Figure 7 shows that the fracture configuration still keeps nearly straight under the 10MPa horizontal principal stress contrast, even for the 5m perforation cluster spacing. Compared with Figure 6, Figure 8 shows that the fracture length and penetration length remain almost the same in the three scenarios. Decreasing the staggered perforation cluster spacing has virtually no effect on the fracture configuration of zipper fracturing in this stress contrast condition. Consequently, we may conclude that one can design small perforation cluster spacing in one stage and small staggered perforation cluster spacing of two wells to further improve interwell stimulation effectiveness under high stress contrast conditions.
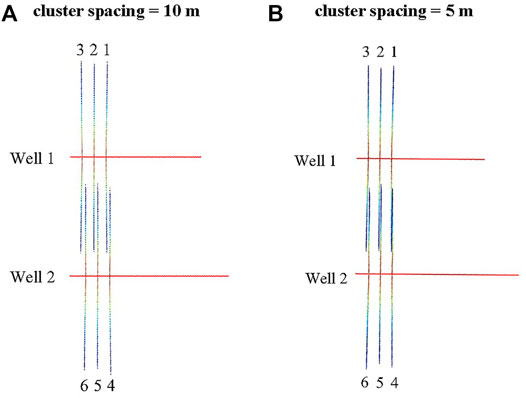
FIGURE 7. Fracture configuration of irregular staggered zipper fracturing. (A) Top view of fracture configuration with staggered perforation cluster spacing 10 m; (B): top view of fracture configuration with staggered perforation cluster spacing 5 m.
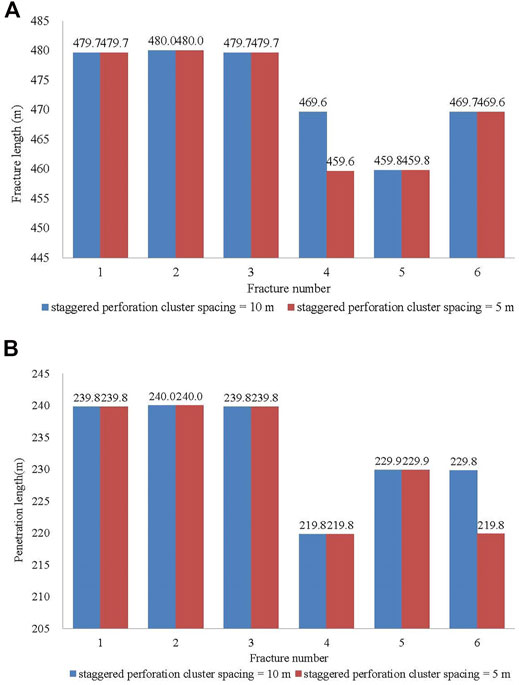
FIGURE 8. Fracture size of irregular staggered zipper fracturing. (A) Fracture length; (B) penetration length.
To study the influence of horizontal principal stress contrast on zipper fracturing, we decreased the horizontal principal stress contrast to 3MPa, 1MPa, and 0.1 MPa. Compared with Figure 5A, Figures 9, 10 show that fracture-induced stress interference and inter-well interference significantly affect the fracture configuration. As shown in Figure 9, the two outer fractures of well 1 curve more as the stress contrast decreases. After some curved distance, the two outer fractures propagate again along the direction of in situ maximum horizontal principal stress. This is due to the less stress interference with the increase in fracture spacing. The inner fracture always keeps straight propagation because of the balance of two opposite stress interference caused by the outer fractures. Overall, the three fractures of well 1 for different scenarios present a uniform propagation pattern. The fracture length difference is less than 4% as shown in Figure 10A. The propagation of the three fractures of well 2 are affected by the interwell interference of well 1 and their own interfracture interference. Hence, the fractures grow shorter than the ones of well 1 and curve noticeably. It is worth noting that fracture 4 intersects with fracture 1 of well 1 under 1 and 0.1 MPa stress contrast, resulting in “frac hits” between the two wells. The fracture width and proppant weight distribution (Figures 9C, 11) show that after frac hits, the fracturing fluid and proppant of fracture 4 enter fracture 1, which causes fracture 1 to reopen and proppant transport toward the wellbore of well 1. This may result in a negative effect on the successive stimulation treatment and production. The simulation results in this section also confirm the proppant sand production phenomenon during a frac-hit in a practical treatment, as shown in Figure 12 cited from Jacobs (2017).
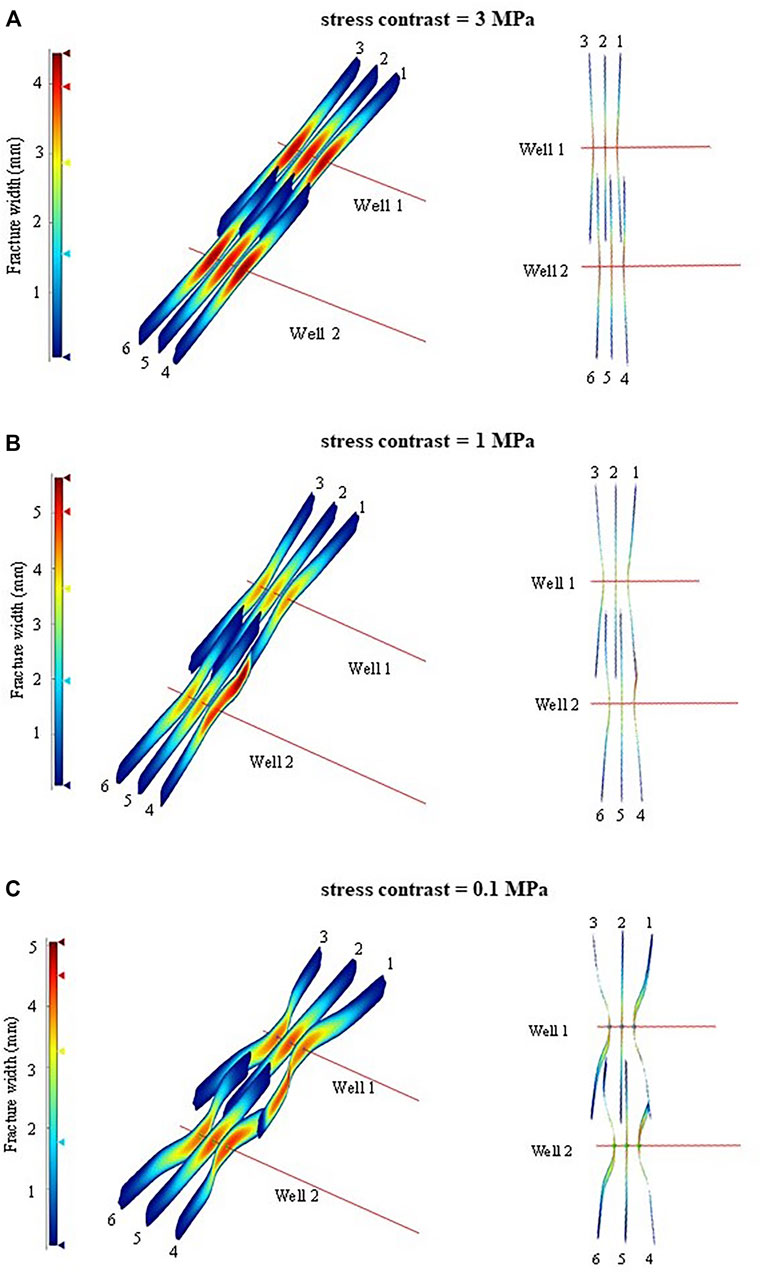
FIGURE 9. Fracture configuration of different stress contrast scenarios. (A) Side view (left) and top view (right), stress contrast 3 MPa; (B) side view (left) and top view (right), stress contrast 1 MPa; (C) side view (left) and top view (right), stress contrast 0.1 MPa.
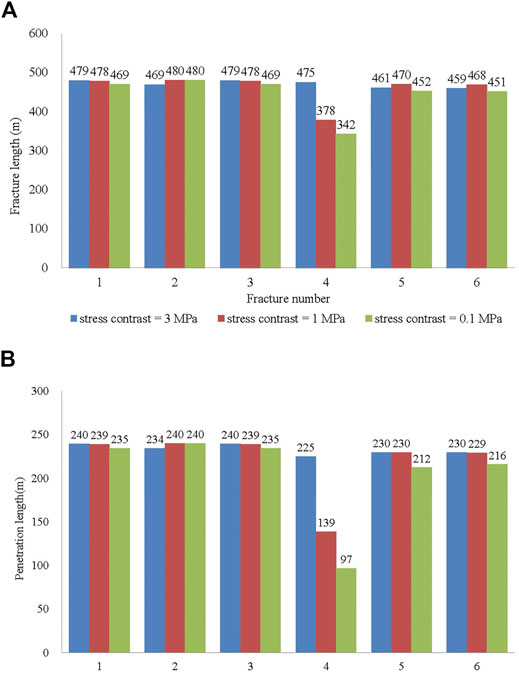
FIGURE 10. Fracture size under different stress contrast scenarios. (A) Fracture length; (B): penetration length.

FIGURE 11. Proppant weight distribution in fractures under 0.1-MPa stress contrast condition.
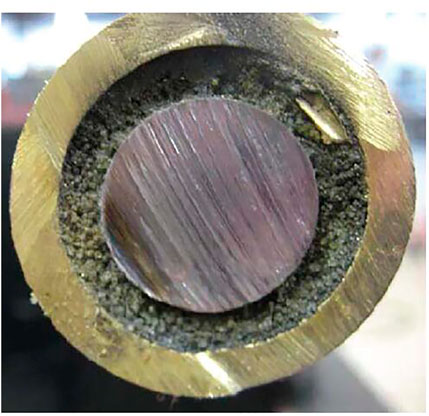
FIGURE 12. Rod tubing filled with proppant sand during a frac-hit; cited from Jacobs (2017).
In this paper, we investigate the effects of the stage time lag, staggered perforation cluster spacing, and horizontal principal stress contrast on the behavior of zipper fracturing. Based on our analyses, we have the following specific conclusions:
1) The stage time lag significantly affects the fracture configuration of zipper fracturing. The stress interference of simultaneous zipper fracturing is most severe, and hence, the fracture length and penetration length are affected the most, leading to the worst inter-well stimulation effectiveness. With the increase in the stage time lag, the pressurized fractures of the previous stage have more time to complete the final fracture propagation through rebalance of fluid pressure and fluid leak-off. The local stress field recovers to some extent, which leads to a weaker stress interference impact on the next stage. This may ensure that the fractures of the next stage grow longer and penetrate deeper between wells and, hence, improve interwell stimulation effectiveness.
2) For a formation with higher horizontal principal stress contrast, stress contrast dominates the fracture propagation. Decreasing the staggered perforation cluster spacing has almost no effect on the fracture configuration of zipper fracturing. One may design small perforation cluster spacing to improve interwell stimulation effectiveness.
3) For a formation with lower horizontal principal stress contrast, interfracture stress interference significantly affects fracture configurations of zipper fracturing. The treatment job may cause “frac hits” and sand production, which will result in an adverse effect on the successive stimulation treatment and production.
The original contributions presented in the study are included in the article/Supplementary Material, further inquiries can be directed to the corresponding author.
ZW and LY proposed the research. RG and ZL prepared figures and tables, and interpreted the structural data. ZW, LY, and XW developed the main ideas. GX, SM, and MF participated in the numerical simulation work. ZW, LY, and GX contributed to the writing the original manuscript. SM, MF, and XW contributed to revising the manuscript. All co-authors actively contributed to manuscript with comments, ideas, and suggestions.
This work was financially supported by Research and Application of Key Technical Equipment for Major Engineering (Phase II) of CNPC Scientific Research and Technology Development Project (2018E-2105), Software Development Project of CNPC on Volume Fracturing Optimization & Design (2020B-4118).
Authors ZW, LY, RG, ZL, SM, MF, and XW were employed by the company Research Institute of Petroleum Exploration and Development, PetroChina.
The remaining author declares that the research was conducted in the absence of any commercial or financial relationships that could be construed as a potential conflict of interest.
All claims expressed in this article are solely those of the authors and do not necessarily represent those of their affiliated organizations, or those of the publisher, the editors, and the reviewers. Any product that may be evaluated in this article, or claim that may be made by its manufacturer, is not guaranteed or endorsed by the publisher.
The authors would like to thank the editor and the reviewers of this article for their valuable comments that helped improve the quality of the paper.
Adachi, J., Siebrits, E., Peirce, A., and Desroches, J. (2007). Computer Simulation of Hydraulic Fractures. Int. J. Rock Mech. Mining Sci. 44 (5), 739–757. doi:10.1016/j.ijrmms.2006.11.006
Cong, Z., Li, Y., Pan, Y., Liu, B., Shi, Y., Wei, J., et al. (2021b). Study on CO2 Foam Fracturing Model and Fracture Propagation Simulation. Energy 238, 121778, doi:10.1016/j.energy.2021.121778
Cong, Z., Li, Y., Liu, Y., and Xiao, Y. (2021a). A New Method for Calculating the Direction of Fracture Propagation by Stress Numerical Search Based on the Displacement Discontinuity Method. Comput. Geotechnics 140, 104482. doi:10.1016/j.compgeo.2021.104482
Dontsov, E., and Peirce, A. (2015). Proppant Transport in Hydraulic Fracturing: Crack Tip Screen-Out in KGD and P3D Models. Int. J. Sol. Structures. 63, 206–218, doi:10.1016/j.ijsolstr.2015.02.051
Dontsov, E. V. (2016). An Approximate Solution for a Penny-Shaped Hydraulic Fracture that Accounts for Fracture Toughness, Fluid Viscosity and Leak-Off. R. Soc. Open Sci. 3, 160737. doi:10.1098/rsos.160737
Jacobs, T. (2017). Oil and Gas Producers Find Frac Hits in Shale wells a Major challenge. J. Pet. Tech. 69 (04), 29–34. doi:10.2118/0417-0029-jpt
Li, J., Liu, Y., and Wu, K. (2021). A New Higher Order Displacement Discontinuity Method Based on the Joint Element for Analysis of Close-Spacing Planar Fractures. SPE J. doi:10.2118/208614-PA
Li, Y., Jia, D., Rui, Z., Peng, J., Fu, C., and Zhang, J. (2017). Evaluation Method of Rock Brittleness Based on Statistical Constitutive Relations for Rock Damage. J. Pet. Sci. Eng. 153, 123–132. doi:10.1016/j.petrol.2017.03.041
Long, G B., and Xu, G S. (2017), The Effects of Perforation Erosion on Practical Hydraulic-Fracturing Applications, SPE J., 22 (2). 645–659, SPE-185173-PA. doi:10.2118/185173-pa
Manchanda, R., Sharma, M. M. M., and Holzhauser, S. (2014). Time-Dependent Fracture-Interference Effects in Pad Wells. SPE Prod. Operations 29 (04), 274–287. doi:10.2118/164534-pa
Nagel, N., Sheibani, F., Lee, B., Agharazi, A., and Zhagn, F. (2014). “Fully-Coupled Numerical Evaluations of Multiwell Completion Schemes: The Critical Role of In-Situ Pressure Changes and Well Configuration,” in SPE Hydraulic Fracturing Technology Conference (The Woodlands, Texas: Society of Petroleum Engineers) USASPE-168581-MS. doi:10.2118/168581-ms
Qiu, F., Porcu, M. M., Xu, J., Malpani, R., Pankaj, P., and Pope, T. L. (2015). “Simulation Study of Zipper Fracturing Using an Unconventional Fracture Model,” in SPE/CSUR Unconventional Resources Conference (Calgary, Alberta, Canada: Society of Petroleum Engineers). SPE-175980-MS. doi:10.2118/175980-MS
Rafiee, M., Soliman, M. Y., and Pirayesh, E. (2012). “Hydraulic Fracturing Design and Optimization: A Modification to Zipper Frac,” in SPE Annual Technical Conference and Exhibition (San Antonio, Texas, USA: Society of Petroleum Engineers). SPE-159786-MS. doi:10.2118/159786-ms
Roussel, N. P., and Sharma, M. M. (2011). Optimizing Fracture Spacing and Sequencing in Horizontal-Well Fracturing. Spe Prod. Operations 26 (02), 173–184. doi:10.2118/127986-pa
Shen, X. (2014). “Numerical Analysis on the Interaction between Two Zipper Frac Wells Using the Continuum Damage Method,” in Offshore Technology Conference-Asia (Kuala Lumpur, Malaysia: Offshore Technology Conference). OTC-24975-MS. doi:10.2118/24975-ms
Shi, X., Li, D. J., Liu, Y., Xu, H. X., and Du, Y. K. (2018). “Hydraulic Fracture Propagation in Horizontal Wells With Modified Zipper Fracturing in Heterogeneous Formation,” in 52nd U.S. Rock Mechanics/Geomechanics Symposium (Seattle, Washington: American Rock Mechanics Association). ARMA-2018-189.
Shou, K. (1994). Three-Dimensional Displacement Discontinuity Method with Application to Bonded Half-Space Problems. Ph.D. Dissertation. University of Minnesota.
Sierra, L., and Mayerhofer, M. (2014). “Evaluating the Benefits of Zipper Fracs in Unconventional Reservoirs,” in SPE Unconventional Resources Conference, April 1–3, 2014 (The Woodlands, Texas, USA: Society of Petroleum Engineers). SPE-168977-MS.
Soliman, M. Y., East, L. E., and Adams, D. L. (2008), 23. Geomechanics Aspects of Multiple Fracturing of Horizontal and Vertical Wells, SPE Drilling & Completion, 217–228. SPE-86992-PA. doi:10.2118/86992-PA
Tang, J., Wu, K., Zeng, B., Huang, H., Hu, X., Guo, X., et al. (2018). Investigate Effects of Weak Bedding Interfaces on Fracture Geometry in Unconventional Reservoirs. J. Pet. Sci. Eng. 165, 992–1009. doi:10.1016/j.petrol.2017.11.037
Tang, J., Wu, K., Zuo, L., Xiao, L., Sun, S., and Ehlig–Economides, C. (2019). Investigation of Rupture and Slip Mechanisms of Hydraulic Fractures in Multiple-Layered Formations. SPE J. 24 (05), 2292–2307. doi:10.2118/197054-PA
Xie, J., Tang, J., Yong, R., Fan, Y., Zuo, L., Chen, X., et al. (2020). A 3-D Hydraulic Fracture Propagation Model Applied for Shale Gas Reservoirs with Multiple Bedding Planes. Eng. Fracture Mech. 228, 106872. doi:10.1016/j.engfracmech.2020.106872
Xu, G. S., and Wong, S. W. (201317043). “Interaction of Multiple Non-planar Hydraulic Fractures in Horizontal wells,” in International Petroleum Technology Conference, 26–28, 2013 (Beijing, China: IPTC). doi:10.2523/17043-ms
Zhang, F., Damjanac, B., and Maxwell, S. (2019). Investigating Hydraulic Fracturing Complexity in Naturally Fractured Rock Masses Using Fully Coupled Multiscale Numerical Modeling. Rock Mech. Rock Eng. 52 (12), 5137–5160. doi:10.1007/s00603-019-01851-3
Zhang, F., Dontsov, E., and Mack, M. (2017). Fully Coupled Simulation of a Hydraulic Fracture Interacting with Natural Fractures with a Hybrid Discrete-Continuum Method. Int. J. Numer. Anal. Meth. Geomech. 41 (13), 1430–1452. doi:10.1002/nag.2682
Zhang, F., Wang, X., Tang, M., Du, X., Xu, C., Tang, J., et al. (2021b). Numerical Investigation on Hydraulic Fracturing of Extreme Limited Entry Perforating in Plug-And-Perforation Completion of Shale Oil Reservoir in Changqing Oilfield, China. Rock Mech. Rock Eng. 54, 2925–2941. doi:10.1007/s00603-021-02450-x
Keywords: zipper fracturing, stress interference, frac hit, 3D fracture propagation, proppant transport
Citation: Wang Z, Yang L, Gao R, Xu G, Liu Z, Mo S, Fan M and Wang X (2022) Numerical Analysis of Zipper Fracturing Using a Non-Planar 3D Fracture Model. Front. Earth Sci. 10:808183. doi: 10.3389/feart.2022.808183
Received: 03 November 2021; Accepted: 11 January 2022;
Published: 11 February 2022.
Edited by:
Shengnan Chen, University of Calgary, CanadaCopyright © 2022 Wang, Yang, Gao, Xu, Liu, Mo, Fan and Wang. This is an open-access article distributed under the terms of the Creative Commons Attribution License (CC BY). The use, distribution or reproduction in other forums is permitted, provided the original author(s) and the copyright owner(s) are credited and that the original publication in this journal is cited, in accordance with accepted academic practice. No use, distribution or reproduction is permitted which does not comply with these terms.
*Correspondence: Zhen Wang, d2FuZ3poZW42OUBwZXRyb2NoaW5hLmNvbS5jbg==
Disclaimer: All claims expressed in this article are solely those of the authors and do not necessarily represent those of their affiliated organizations, or those of the publisher, the editors and the reviewers. Any product that may be evaluated in this article or claim that may be made by its manufacturer is not guaranteed or endorsed by the publisher.
Research integrity at Frontiers
Learn more about the work of our research integrity team to safeguard the quality of each article we publish.