 Wenjie Sun
 Kai Liu2*
- 1National Engineering Research Center of Coal Mine Water Hazard Controlling, China University of Mining and Technology, Beijing, China
- 2Chinese Academy of Geological Sciences, Beijing, China
Introduction
Geothermal energy is a renewable geological resource with the potential to provide a reasonable amount of electricity, heating/cooling, and balneology (Anderson and Rezaie, 2019; Soltani et al., 2021). If only 1% of the total estimated available geothermal energy could be utilized by humanity, it could provide almost 2,800 years of power at a constant rate (around 500 EJ per annum) (Olasolo et al., 2016).
The availability, including renewability and sustainability of energy, is one of the most critical aspects of social development (Anderson and Rezaie, 2019; Neves et al., 2021; Palomo-Torrejón et al., 2021). Renewability describes the property of the resource, the ability of a system to replace an amount of removed resource on a fixed time scale, and it depends mainly on the geological and hydrogeological features of the regional system. In contrast, the term sustainability refers to how the resource is utilized. Sustainability refers to the development of a resource in such a way that meets the needs of the present without compromising the ability of future generations to meet their own needs (Fabbri et al., 2017). Sustainable exploitation is crucial to guarantee their long-term utilization, future maintenance, and environmental protection (Eyerer et al., 2020; Torresan et al., 2020). To achieve sustainable utilization, the flow rate of exploited water (and thermal), which mainly depends on the local hydraulic properties of the reservoir and the model of utilization, must be lower or equal to the renewable recharge of the system (Kaczmarczyk et al., 2020).
The Wentang hot spring is a well-known geothermal field in Jiangxi Province, which is called the homeland of hot springs in China (He and Zhu, 2021). Wentang hot spring has been used for 2,000 years, and the outflow amount could be up to 13,000 tons daily with a temperature range of 50°C–72°C. Due to the development of local tourism and health industries, the demand for hot water is increasing, which is met by drilling wellbores that exploited the thermal groundwater. The ongoing exploitation seems renewable for the utilization of the WGF geothermal resource.
Even though rigorous management policies have been established in WGF for energy production, the literature is lacking detailed information on the sustainable utilization of thermal water for tourism purposes. For now, the daily recharge water amount depends on the outflow. As we know, the cold water needs time to flow the warm rock and turn into geothermal water (De Simone et al., 2013). A large amount of hot water needed cannot be extracted immediately. This phenomenon is more obvious in winter with large consumption demand. During the recharge pumping test in 2012, the temperature decreased from 64°C to 58°C under the injection water amount of 20,181 m3/day, and the temperature has a five drop under the continuous pumping period with increasing consumption demand. A considerable increase in the flow rate could cause a higher drawdown depleting the resource for future generations. The sustainable use of a site-specific management plan accounts for the local hydrogeological characteristics of the system, the energy demand, and the long-term exploitation. For both high- and low-enthalpy geothermal systems, integration with other renewable sources, such as biomass and solar energy, can be an interesting way to upgrade, as well (Amoresano et al., 2013).
The question on how long would the water flow from the recharge area to the outflow wellbore need to be answered to make the fine management policy (Kiryukhin et al., 2018; Wang et al., 2020). The long-lasting utilization of the thermal resource, as well as the huge amount of data (i.e., hydrogeological data, flow rates, information about the utilization of the thermal resource, and tourism data), represent a probable unique case study. A numerical study dedicated to the prediction of the long-term sustainability of geothermal heat extraction in a fault-control geological setting while integrating site-specific information and monitoring data is of great value to both academia and industry (Meng et al., 2019). Hence, a proper site-wise parameterized model for geothermal use on a neighborhood scale is of great importance for sustainability utilization. Comprehensive analysis with operation data, preliminary 2D model, hydraulic connection test, and 3D hydrogeological reconstruction model, rather than a simplified conceptualization of the geological setting, can increase the consistency of the modeling results (Blöcher et al., 2010; Mottaghy et al., 2011; Zhao et al., 2015).
In the Geological and hydrogeological setting section, the geological setting of WGF is presented, and the main parameters are analyzed. In the Data analysis and model result discussion section, operation data and preliminary 2D model results are first introduced, and the results of hydraulic connection tests with 3D hydrological models are shown for quantitative analyses. The conclusions are presented and discussed in the Conclusion section.
Geological and Hydrogeological Setting
Geological Setting
The Wentang geothermal field (WGF) is located in the northwest wing of the Wugong Mountain anticline in Yichun City, Jiangxi Province, as shown in Figure 1. The strata and rocks in the Wentang area mainly include Quaternary, metamorphic rock series of Laohutang formation in Sinian Songshan group, migmatite, granite, and dyke of Yanshanian. The Wugongshan compound anticline, belonging to the Paleo-Cathaysian system, suffered severe damage and transformation due to late structural variation, especially the Caledonian mixed petrification and Yanshanian tectonic–magmatic activity, and became more fragmented and extremely fragmented.
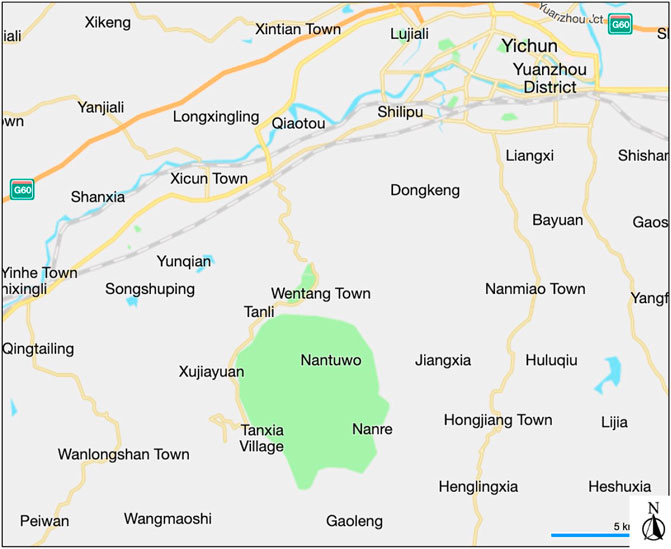
FIGURE 1. The location of Wentang geothermal field in Wentang Town, Jiangxi Province of China.
There are two main fault groups that are closely related to the recharge and outflow of WGF: NNE- and NW-trending faults, as shown in Figure 2. The F1 fault system consists of F11, F12, F13, F14, and some associated structures, with F11 as the main fault. The F11 is a large-scale compression torsion fault, with a strike of 55°–60°. The F2 fault system consists of a compression torsion fault (F21) and a tension torsion branch fault (F22), which is almost covered by Quaternary. As the main fault, F21 has a strike of 55°–60° and a dip angle of 55°–60°, in general, as shown in Figure 3.
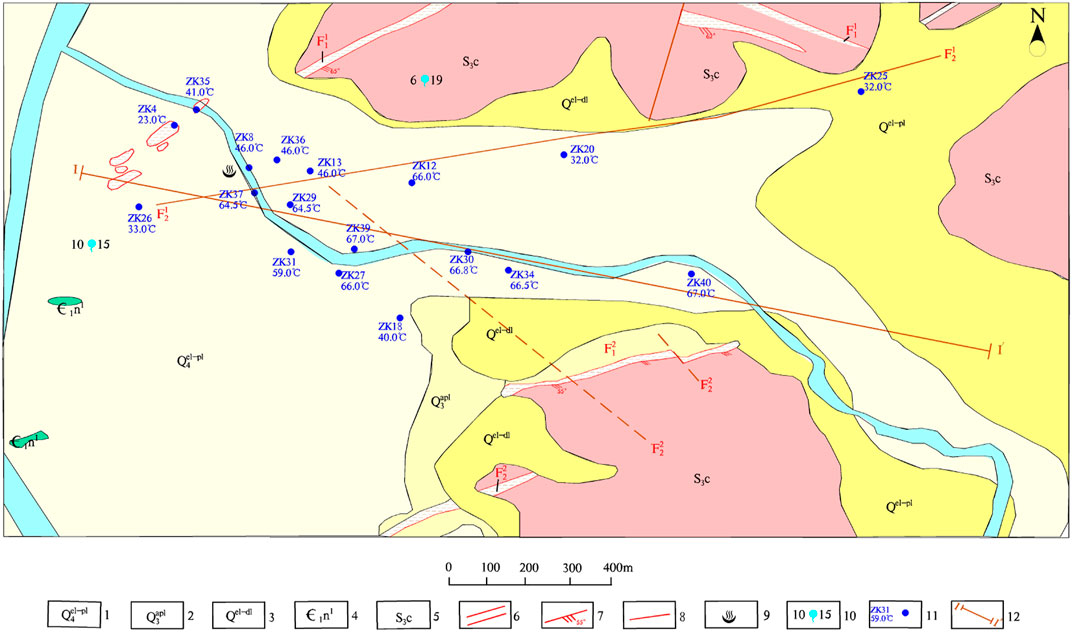
FIGURE 2. Geological map of Wentang geothermal field. 1 Quaternary Holocene flood alluvial layer. 2 Quaternary upper Pleistocene glacial deposit. 3 Quaternary eluvial layer. 4 Lower Cambrian Niujiaohe Formation. 5 Late Silurian Chouping Unit. 6 Silicified fracture zone. 7 Measured and speculated hidden compression-torsion fault. 8 Measured and speculated compression-torsion fault. 9 Hot spring. 10 Spring. 11 Borehole. 12 Cross section.
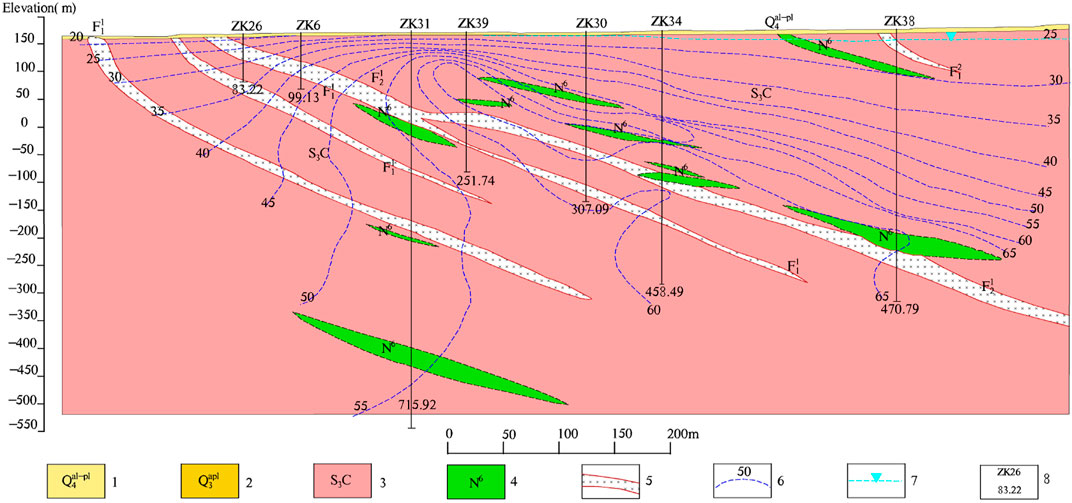
FIGURE 3. Structure profile of cross section I–I′ that is plotted in Figure 2. 1 and 2 are the same as in Figure 2. 3 Late Silurian Chouping Unit. 4 Himalayan period diabase. 5 Transtensional Fault (Silicified fracture zone). 6 Isotherm. 7 Geothermal water level. 8 Borehole number and depth.
Hydrogeological Conditions
In the process of infiltration, runoff, and storage, the geothermal water continuously dissolves the soluble substances in the rocks, forming the unique water chemical composition of WGF. The main characteristics of WGF geothermal water are as follows: the highest water temperature is 72°C, pH value is 7.1–7.8 (weakly alkaline), salinity is 0.08–0.263 g/L (freshwater), and the hydrochemical type is sodium bicarbonate–calcium water containing metasilicic acid and selenium.
The cold groundwater there mainly consists of Quaternary pore water and bedrock fissure water. Quaternary pore water is mainly distributed in intermountain valleys, which is composed of sandy soil and gravel layer. The aquifer is 2- to 5-m thick, and it is mainly supplied by atmospheric precipitation and bedrock fissure water and discharged into rivers and valleys. Only a small amount of spring water is exposed. Bedrock fissure water is mainly distributed in the middle and low mountain areas and slopes and occurs in the weathering fissures and structural fissures of metamorphic rock, migmatite, and granite. The runoff modulus is 3–6 L/s·km2, and the spring discharge is 0.1–1 L/s. The water temperature of bedrock fissure water is generally 13°C–19°C, the hydrochemical type is HCO3–Na or Na, Ca, and the salinity is 0.04–0.18 g/L. The recharge source of bedrock fissure water in the area is mainly meteoric water, which flows along the slope to the lower part, and then discharges into gullies in the form of down springs or scattered streams.
According to the groundwater head measurements, the groundwater flow direction was predominantly southeastward (Figure 4) toward the northwestward about 1.0 km away.
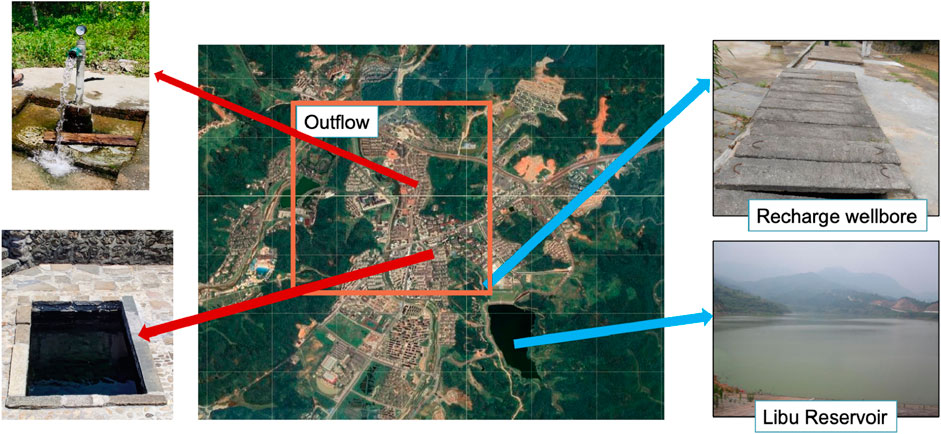
FIGURE 4. Recharge (the blue arrow line) and outflow (the orange square area and typical representative listed by the red arrow line) area of the Wentang geothermal field.
Pumping Test
The recharge and pumping test of WGF was carried out during the first exploration from 1971 to 1973. After the continuous exploration and development in 1982, 2005, 2008, and 2011, the recharge and outflow quantity has been greatly improved (see Table 1 for detailed data).
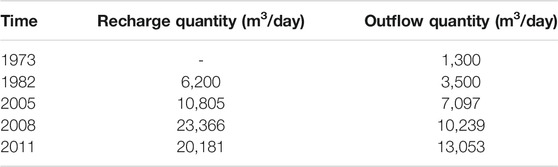
TABLE 1. Key results of the pumping test that was carried out in the Wentang geothermal field (WGF) over the years.
The results of the pumping test show that the distribution and movement of geothermal water are strictly controlled by the tension torsion fault (F22), which is manifested in water temperature, water level, and hydrochemistry. There is a great difference between the permeability and water abundance of rocks inside and outside the tension torsion zone. The tension torsion zone is the main channel of geothermal water, which has good water permeability and water abundance. During the pumping test, the water level in the borehole located inside the tension torsion zone has a small drawdown with a large discharge, and the temperature of pumping water is close to the highest water temperature before the pumping test. On the contrary, the water level draw-down of the borehole outside the tension torsion band is large with a small flow rate, which is 10 times smaller than that inside the tension torsion band, and the pumping temperature is 3°C–5.5°C lower than that before pumping. In addition, the pumping test indicates that there is a relatively impermeable boundary on the west side of the tension torsion zone.
Generally, the groundwater is recharged by the atmospheric precipitation infiltrated through rock fissures, joints, and structural fracture zones in the southern Wugong Mountain. Through the complex deep circulation, the cold groundwater absorbs the heat energy in the rock by the way of heat conduction and convection. The geothermal water gathers at a certain place in the deep and flows northward along the faulted channel including the torsional structural fissures and pores. The geothermal water flow is blocked by the fault structure near WGF and is discharged to the surface in the form of ascending hot spring.
Data Analysis and Model Result Discussion
Operation and Monitoring Data
The first systematic survey was conducted in 1971, and some wellbores located close to the thermal spring were drilled. After that, 56 wellbores were drilled, and only 16 of them were preserved until now. With the logging data, the main reservoir thickness of each wellbore is listed in Table 2.
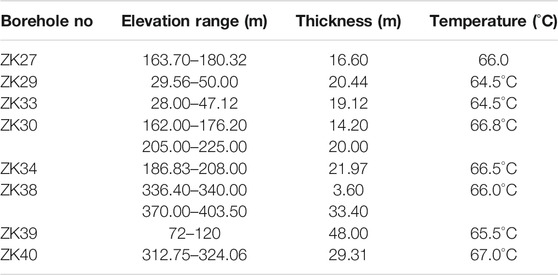
TABLE 2. Statistical table of thermal reservoir thickness in main movement zones of geothermal water.
The annual consumption of geothermal water increased gradually in the last 14 years, and the amount in 2019 is five times that in 2007, as shown in Figure 5. Due to the impact of COVID19, the consumption in 2020 was a little decreased. More detail can be seen from the monthly consumption data in Figure 6, and the results indicate that peak usage occurs during the winter. As the monthly consumption change, the temperature also fluctuates with a range of about 5°C. Specifically, when the consumption increases, the temperature decreases, but there is a certain delay. Figure 7 shows the daily monitoring data, which show the relation between geothermal water consumption and temperature variation.
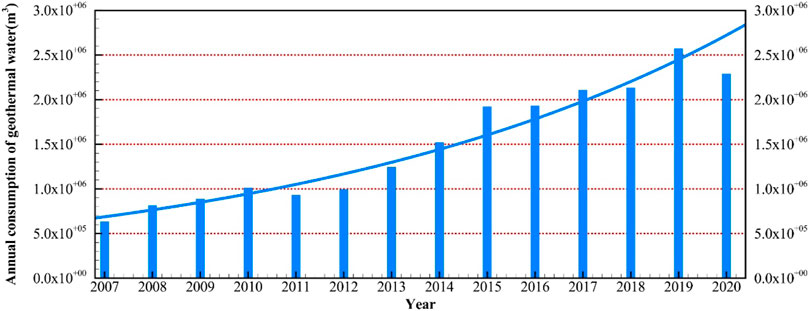
FIGURE 5. Annually increasing consumption of geothermal water in the last 14 years.
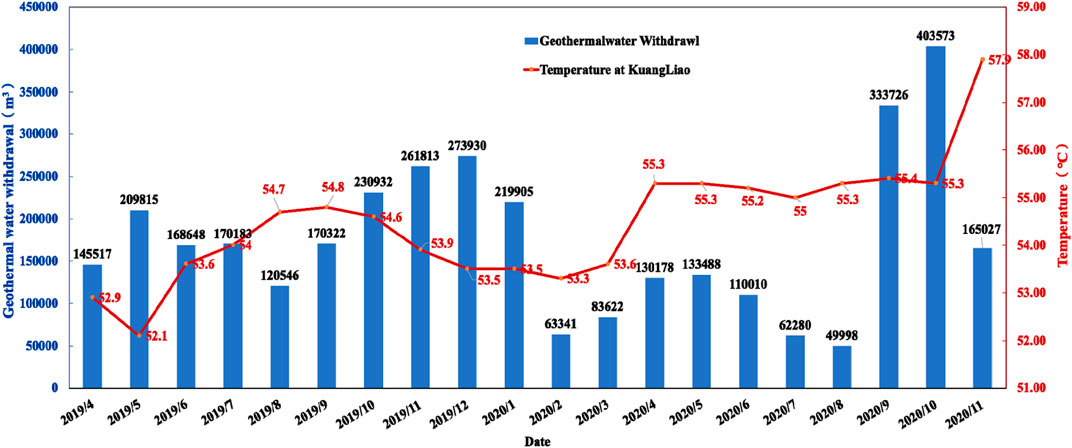
FIGURE 6. The monthly monitoring data of geothermal water withdrawn and temperature of Kuangliao from April 2019 to November 2020.
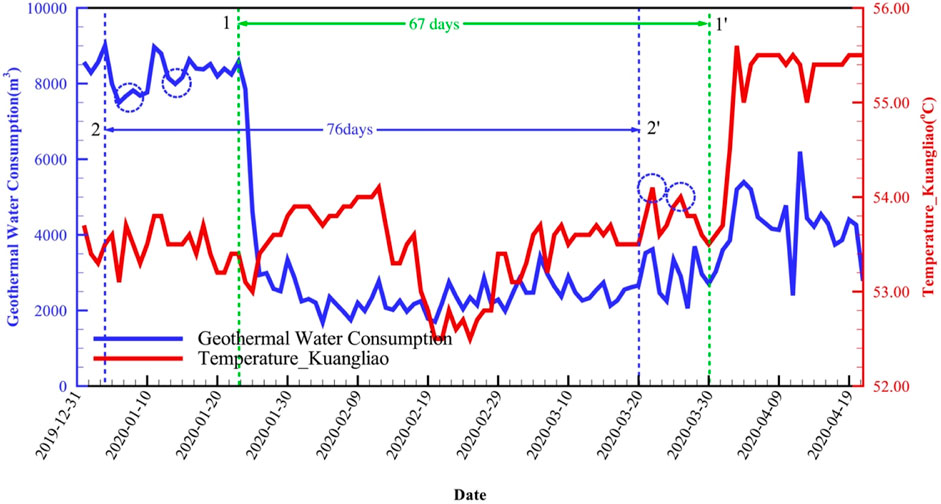
FIGURE 7. The daily monitoring data, which show the relation between geothermal water consumption and temperature variation of Kuangliao.
At point 1, the geothermal water consumption suddenly drops down due to the beginning of COVID-19, the temperature increases at point 1′ after a delay of 67 days. Following this clue, another changing trend is identified at point 2 to point 2′ with a delay of 76 days. Based on these two sets of data, it might take 2 months for the geothermal water to flow from the recharge area to the production well (named KL).
Preliminary Study With 2D Model
A 2D homogeneous model is built using the TOUGH3 simulator to preliminarily depict the geothermal water flow in the subsurface (Jung et al., 2017). The cross-section I–I′, which is shown in Figure 3, is selected as the model domain. The domain is discretized using the integral finite difference method (Narasimhan and Witherspoon, 1976), with mesh refinement in the fault zone, as shown in Figure 8. Focusing on the saturated section of the unconfined aquifer, the applied 2D model is idealized as a homogeneous layer with the fully saturated flow and heat transport properties. As for the boundary conditions, a fixed hydraulic head difference is assigned between the recharge and outflow boundaries.
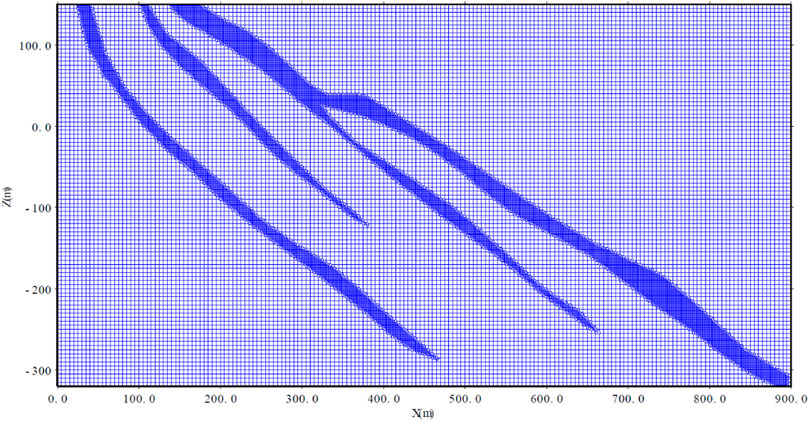
FIGURE 8. The 2D model discretization (the mesh around the fault has been refined, as shown in the dark blue area).
As shown in Figure 9, it takes about 90 days for the geothermal water to migrate from the bottom to the ground. The fracture zone in the model is represented by the so-called high-speed channel within a certain width by the large permeability. Several permeability schemes (1Darcy, 2Darcy, 5Darcy, 10Darcy, 20Darcy) are designed to conduct the sensitivity analysis (Figure 10). The results indicate the decline of migration time duration as the representative permeability of the fracture zone in the 2D model.
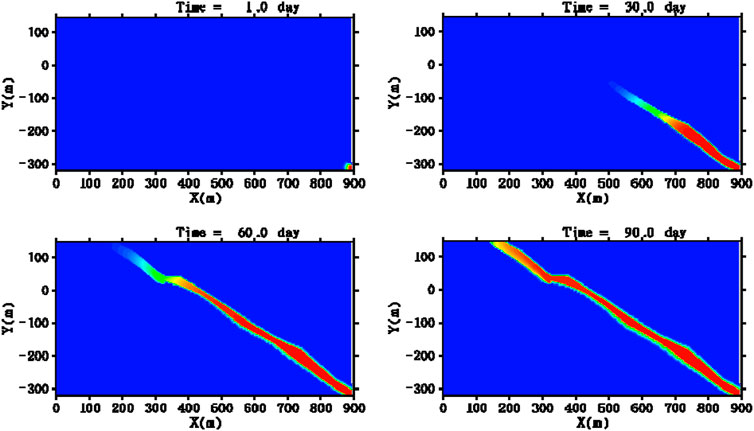
FIGURE 9. Geothermal water migration plume (the red color in the figure represents the geothermal water saturation).
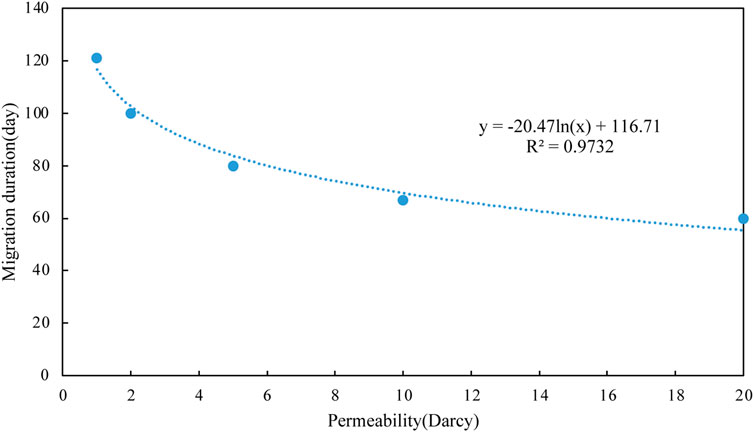
FIGURE 10. Migration duration under different representative permeabilities of fracture zone.
Hydraulic Connection Test and 3D Hydrological Model
The initial model results indicate a 60- to 100-day migration time duration. However, in realistic geological conditions, the time duration might differ. Therefore, a hydraulic connection test and a comprehensive 3D model are conducted to gain the time duration from the recharge area to the outflow area. The test started on August 15 and ended on November 15.
A certain amount of salt (60 kg NaCl) is injected into the recharge area within an hour, and the electrical conductivity (EC) and TDS of the nearest exploitation wellbore (named KL) are monitored with the automatic checkout equipment. Figure 11A shows that the EC is captured in the recharge area with a sudden increase. The monitoring data of KL, as shown in Figure 11B, indicate that there are multipeak of EC and TDS variations. The first fluctuation arrived on August 27, which is just 12 days after the injection. The second fluctuation is 38 days later on September 23. The third fluctuation happened on October 12, which is about 2 months after the injection.
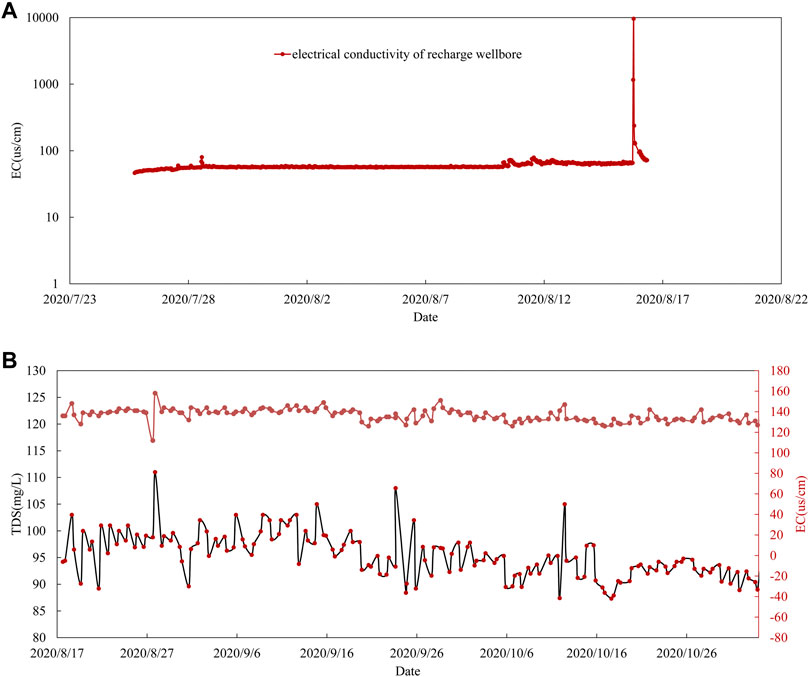
FIGURE 11. The monitoring data of the KL exploitation wellbore in the hydraulic connection test. (A) Electrical conductivity variation of the recharge area before and right after the hydraulic connection test; (B) the TDS and electrical conductivity (EC) during the later 3 months.
In order to avoid the indeterminacy of the 2D model, a comprehensive 3D model with multifaults is built based on the more detailed geological conditions, as shown in Figure 12. With limited parameters of the fault and fracture zone, it takes about 90 days for the geothermal water migration from the recharge area to the outflow wellbore (KL in this model). The 3D model results still differ from the hydraulic connection test result in which the numerical model only represented the third peak electrical conductivity captured. There are several reasons for the differences between the model and observation. One of the most important reasons is that there are several hydraulic tunnels between neighborhood wells. Some other methods, such as the lumped model, might be considered to further refine the model based on some generalized parameters.
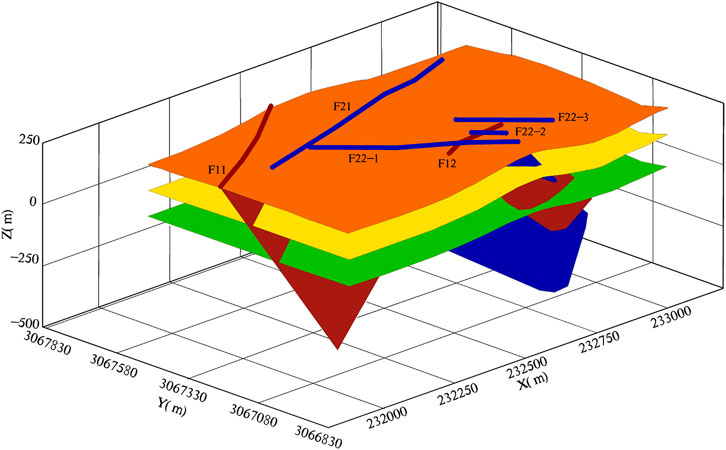
FIGURE 12. The 3D model with multifaults (the different colors represent the geological domain depicted in Figure 2, in which the blue color represents the focused fault area in the numerical model).
Conclusion
Sustainability utilization of the fault-controlled neighborhood-scale Wentang Geothermal Field is one of the most critical aspects of the local social development. The comprehensive analysis of operation data analysis, preliminary study with 2D model, and hydraulic connection test with 3D hydrological model indicate that the migration time duration for the geothermal water is within the range of 1–3 months. According to this conclusion, a dynamic management policy that recharges the groundwater 2 months earlier before a large amount of geothermal utilization is suggested to the local geothermal regulatory agency. It is beneficial to reduce possible hot water temperature fluctuations and to balance the water table. For more sustainable development, the use of geothermal water should be more strictly controlled.
In addition, more aspects should be given importance in future studies: 1. Detailed parameters of the fracture zone should be gained to get a better understanding of the geothermal flow migration. 2. A high efficiency parallel computing method should be involved to enhance the model simulation process; otherwise, the simulation will be inefficient, which leads to time-consuming work.
Author Contributions
WS, KL, JB, and YZ contributed to the conception and design of the study. WS wrote sections of the manuscript. KL organized the database. JB was in charge of the figures. YZ performed the statistical analysis. All authors contributed to the manuscript revision, and read and approved the submitted version.
Funding
This study is funded by the China Geological Survey (No. DD20201165, No. DD20221819), CGS Research Fund (No. JKY202004), National Natural Science Foundation of China (42172282, 42002255), Shanxi Key Laboratory of Coalmine Water Hazard Control (2021SKMS01), Fundamental Research Funds for the Central Universities (2021YJSDC06), and State Key Laboratory of Coal Resources and Safe Mining (SKLCRSM20DC02).
Conflict of Interest
The authors declare that the research was conducted in the absence of any commercial or financial relationships that could be construed as a potential conflict of interest.
Publisher’s Note
All claims expressed in this article are solely those of the authors and do not necessarily represent those of their affiliated organizations, or those of the publisher, the editors, and the reviewers. Any product that may be evaluated in this article, or claim that may be made by its manufacturer, is not guaranteed nor endorsed by the publisher.
References
Amoresano, A., De Sio, P., Langella, G., and Meo, S. (2013). Biomass and Solar Integration in Low Enthalpy Geothermal Plants. Int. Rev. Model. Simul. 6 (3), 981–987.
Anderson, A., and Rezaie, B. (2019). Geothermal Technology: Trends and Potential Role in a Sustainable Future. Appl. Energ. 248, 18–34. doi:10.1016/j.apenergy.2019.04.102
Blöcher, M., Zimmermann, G., Moeck, I., Brandt, W., Hassanzadegan, A., and Magri, F. (2010). 3D Numerical Modeling of Hydrothermal Processes during the Lifetime of a Deep Geothermal Reservoir. Geofluids 10, 406–421. doi:10.1111/j.1468-8123.2010.00284.x
De Simone, S., Vilarrasa, V., Carrera, J., Alcolea, A., and Meier, P. (2013). Thermal Coupling May Control Mechanical Stability of Geothermal Reservoirs during Cold Water Injection. Phys. Chem. Earth, Parts A/B/C 64, 117–126. doi:10.1016/j.pce.2013.01.001
Eyerer, S., Schifflechner, C., Hofbauer, S., Bauer, W., Wieland, C., and Spliethoff, H. (2020). Combined Heat and Power from Hydrothermal Geothermal Resources in Germany: An Assessment of the Potential. Renew. Sustainable Energ. Rev. 120, 109661. doi:10.1016/j.rser.2019.109661
Fabbri, P., Pola, M., Piccinini, L., Zampieri, D., Roghel, A., and Libera, N. D. (2017). Monitoring, Utilization and Sustainable Development of a Low-Temperature Geothermal Resource: A Case Study of the Euganean Geothermal Field (NE, Italy). Geothermics 70, 281–294. doi:10.1016/j.geothermics.2017.07.002
He, J., and Zhu, Z. a. (2021). Research on Sustainable Utilization of Rural Resources in Tourism Development in Mountain Area. IOP Conf. Ser. Earth Environ. Sci. 632 (2), 022083. doi:10.1088/1755-1315/632/2/022083
Jung, Y., Pau, G. S. H., Finsterle, S., and Pollyea, R. M. (2017). TOUGH3: A New Efficient Version of the TOUGH Suite of Multiphase Flow and Transport Simulators. Comput. Geosciences 108, 2–7. doi:10.1016/j.cageo.2016.09.009
Kaczmarczyk, M., Tomaszewska, B., and Operacz, A. (2020). Sustainable Utilization of Low Enthalpy Geothermal Resources to Electricity Generation through a cascade System. Energies 13 (10), 2495. doi:10.3390/en13102495
Kiryukhin, A. V., Polyakov, A. Y., Usacheva, O. O., and Kiryukhin, P. A. (2018). Thermal-permeability Structure and Recharge Conditions of the Mutnovsky High-Temperature Geothermal Field (Kamchatka, Russia). J. Volcanology Geothermal Res. 356, 36–55. doi:10.1016/j.jvolgeores.2018.02.010
Meng, B., Vienken, T., Kolditz, O., and Shao, H. (2019). Evaluating the thermal Impacts and Sustainability of Intensive Shallow Geothermal Utilization on a Neighborhood Scale: Lessons Learned from a Case Study. Energ. Convers. Management 199, 111913. doi:10.1016/j.enconman.2019.111913
Mottaghy, D., Pechnig, R., and Vogt, C. (2011). The Geothermal Project Den Haag: 3D Numerical Models for Temperature Prediction and Reservoir Simulation. Geothermics 40, 199–210. doi:10.1016/j.geothermics.2011.07.001
Narasimhan, T. N., and Witherspoon, P. A. (1976). An Integrated Finite Difference Method for Analyzing Fluid Flow in Porous media. Water Resour. Res. 12, 57–64. doi:10.1029/wr012i001p00057
Neves, R., Cho, H., and Zhang, J. (2021). Pairing Geothermal Technology and Solar Photovoltaics for Net-Zero Energy Homes. Renew. Sustainable Energ. Rev. 140, 110749. doi:10.1016/j.rser.2021.110749
Olasolo, P., Juárez, M. C., Morales, M. P., D´Amico, S., and Liarte, I. A. (2016). Enhanced Geothermal Systems (EGS): A Review. Renew. Sustainable Energ. Rev. 56, 133–144. doi:10.1016/j.rser.2015.11.031
Palomo-Torrejón, E., Colmenar-Santos, A., Rosales-Asensio, E., and Mur-Pérez, F. (2021). Economic and Environmental Benefits of Geo-thermal Energy in Industrial Processes. Renew. Energ. 174, 134–146. doi:10.1016/j.renene.2021.04.074
Soltani, M., Moradi Kashkooli, F., Souri, M., Rafiei, B., Jabarifar, M., Gharali, K., et al. (2021). Environmental, Economic, and Social Impacts of Geothermal Energy Systems. Renew. Sustainable Energ. Rev. 140, 110750. doi:10.1016/j.rser.2021.110750
Torresan, F., Piccinini, L., Pola, M., Zampieri, D., and Fabbri, P. (2020). 3D Hydrogeological Reconstruction of the Fault-Controlled Euganean Geothermal System (NE Italy). Eng. Geology. 274, 105740. doi:10.1016/j.enggeo.2020.105740
Wang, Y., Liu, Y., Dou, J., Li, M., and Zeng, M. (2020). Geothermal Energy in China: Status, Challenges, and Policy Recommendations. Utilities Policy 64, 101020. doi:10.1016/j.jup.2020.101020
Keywords: geothermal, sustainability utilization, numerical simulation, Wentang, hot spring
Citation: Sun W, Liu K, Bai J and Zhang Y (2022) Sustainability Utilization of the Fault-Controlled Wentang Geothermal Field With Hydrogeological Numerical Model at Site Scale. Front. Earth Sci. 10:805129. doi: 10.3389/feart.2022.805129
Received: 29 October 2021; Accepted: 11 January 2022;
Published: 17 February 2022.
Edited by:
Yanlong Kong, Institute of Geology and Geophysics (CAS), ChinaReviewed by:
Gang Lin, China University of Mining and Technology, ChinaShufang Wang, Beijing Institute of Hydrogeology and Engineering Geology, China
Copyright © 2022 Sun, Liu, Bai and Zhang. This is an open-access article distributed under the terms of the Creative Commons Attribution License (CC BY). The use, distribution or reproduction in other forums is permitted, provided the original author(s) and the copyright owner(s) are credited and that the original publication in this journal is cited, in accordance with accepted academic practice. No use, distribution or reproduction is permitted which does not comply with these terms.
*Correspondence: Wenjie Sun, c3dqQGN1bXRiLmVkdS5jbg==; Kai Liu, YWNhbmNlckAxNjMuY29t