 Hanwei Yang
 Hongyan Shen
 Yue Ma4
 Guolin Feng
95% of researchers rate our articles as excellent or good
Learn more about the work of our research integrity team to safeguard the quality of each article we publish.
Find out more
ORIGINAL RESEARCH article
Front. Earth Sci. , 22 February 2022
Sec. Atmospheric Science
Volume 10 - 2022 | https://doi.org/10.3389/feart.2022.801075
This article is part of the Research Topic Extreme Precipitation Events: Spatio-Temporal Connections, Forecasting, Generation, Impact Analysis, Vulnerability and Risk Assessment View all 13 articles
Using daily precipitation data of national meteorological stations in Qinghai Province and reanalysis data, the main patterns of autumn continuous rain (ACR) are extracted, and key SST areas and circulation factors are searched for to analyze the possible effects on the seasonal and sub-seasonal predictability of ACR in Qinghai Province. The factors with strong precursors mainly include sea surface temperature (SST), Arctic vortex, and subtropical high. The influence of oceanic factors on ACR is relatively independent, while there is an interaction between atmospheric circulation factors. The precursors in spring are from the equatorial east-central Pacific for the main pattern with consistent precipitation distribution, and the Indian Ocean for the pattern with “saddle type” distribution. SST anomalies from the Pacific and Indian Oceans force different circulation patterns that can enhance meridional circulation over Europe-Asia and lead to different precipitation pattern of ACR. The signals from the Arctic vortex and subtropical high in June to July are indicative for ACR. The southward, westward and strong Arctic vortex, together with the south-westward extension of subtropical high over the Atlantic and Pacific can promote more ACR in Qinghai Province. Under the SST forcing and configuration of high and low latitude circulation, the meridional circulation continues to be weak, and the latitudinal circulation to be enhanced over the Eurasia in the early period, and the circulation pattern changes from type-W to type-C, which lead to positive anomaly of ACR in Qinghai Province.
Autumn continuous rainfall (lasting for days or even more than 10 days, ACR) in Qinghai province has the characteristics of high frequency and long persistency, which is one of the dominant meteorological disasters in Qinghai Province (Shi, 2003). It comes along with the harvest of highland barley, spring wheat, rape and other plateau crop in Qinghai Province. ACR not only adversely affects autumn harvest works, but also easily cause food crops to go moldy (Yuan and Yan, 2017). In addition, the lasting lower temperatures along with ACR will lead to the delay of crop fertility or growth (Fu et al., 2004). Thus, it has important practical significance to guide agricultural production, effectively avoid disaster form ACR, and increase the meteorological disaster prevention and mitigation capacity by carrying out prediction research to strengthen the short-term climate prediction ability of ACR in Qinghai province.
ACR is always the study focus of many researchers. Some good research results have obtained in internal structure of cloud, the definition, climate characteristics and physical mechanism of ACR. Toit (2010) found that large concentrations of raindrops having diameters of less than 0.5 mm were observed in a few thousand feet above the ground by Doppler radar observation. Through the study on the relationship of the sunshine duration and cloud cover, the new Qinghai ACR monitoring index was revised, and space-time distribution and intensity change characteristics were analyzed (Li, et al., 2018). Sun et al. (2016) analyzed the climate characteristics of ACR in China, and found that the cumulative frequency is larger in upper and middle reaches of Yangtze River, and with the increase of strength, the region of greater value move toward the southwest from the southeast of China. In Qinghai, its climate characteristics of spatial-temporal variation was analyzed by Ma (2008), showing that the occurrences frequency of ACR is slowly decreasing, and it is more in southeast than northwest. In synoptic scale forecasting, A continuing heavy rain process occurred in west of Sichuan Basin from 22 September 2008 to 27 September 2008 was analyzed and predicted in wave-packet propagation diagnosis method, and concluded that the evolution of wave packet is meaningful for prediction (Xiao, et al., 2010). In short-term climatic forecasting, it is found that subtropical high over western Pacific and SST in the equatorial central and eastern Pacific has important effects on ACR in northwest of China by the study on typical cases occurred in 2000 and 2001 (Lin and Zhang, 2003). Based on the theory of isentropic potential vorticity, diagnostic analysis is carried out on a continuous rainfall process occurring in northwest of China in late May 2005 by Cheng et al. (2007), thinking that the continuous rainfall process is caused by continuous plateau low vortex and cold air separated from the north, and the positive vorticity area of isentropic surface is closely related to the precipitation area, which can be used as an important predictor.
However, in the forecasting and prediction of ACR in Qinghai Province, most of the previous studies focused on the synoptic scale (Xu et al., 2010). In the short-term climate prediction of ACR, the objective forecasting methods and tools is lacked. On the other hand, it is also a lack of in-depth understanding of the formation mechanism of ACR and intuitive conceptual model is still not given. Therefore, in this work, we use the daily precipitation data observed from 50 national meteorological stations in Qinghai Province to extract the main rainfall modes of ACR in Qinghai Province to analyze its spatial-temporal variation characteristic. The key SST areas and circulation factors related to ACR are then searched for to analyze their influence and indicative significance on ACR, and furthermore construct the conceptual model of impact factors. This study will expand the understanding of the mechanism of ACR in highland areas and lay a solid foundation for the development of a combined dynamical-statistical prediction method.
The quality controlled daily precipitation data from 2000 stations sorted out by National Climate Center (NCC) of China for 1961-2017 were used, from which 50 stations with good continuity in Qinghai Province were selected for analysis. The monthly mean geopotential height form NCEP/NCAR reanalysis from 1,000 hPa to 10 hPa (2.5 ° × 2.5 °, Kalnay et al., 1996), and monthly SST reanalysis data (2 ° × 2 °) from NOAA were selected. The SST and atmospheric circulation indices were extracted from the dataset of 142 circulation indices. The dataset is treated by the Climate Diagnostics and Prediction Division of NCC and widely used in research and monitoring/prediction work, including global subtropical high indices (strength, area and position indices), Arctic vortex indices (strength, area and position indices) in difference continent, SST indices in global key oceanic regions, ocean-atmosphere oscillation indices, circulation pattern indices, and other forcing indices (sea ice, snow cover). Details of the indices used can be found in the Supplementary Material.
ACR refers to the disaster of long-lasting cloudy and rainy weather with high air humidity, which affects crop ripening, harvesting, drying and other farming activities. Following the local meteorological disaster standard of Qinghai Province, the ACR events can be classified to light level and heavy level (Table 1). In this work, the ACR is defined including both light and heavy event as the process rainy days (D) ≥ 5 days, sunshine hours per day (S) < 2.5 h, the process precipitation (P) ≥ 10 mm, as well as rainless days (d) < 2 days.
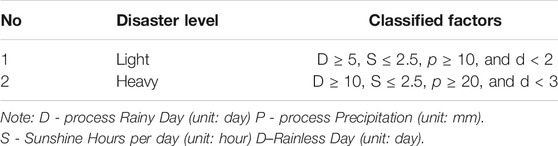
TABLE 1. ACR disaster lever and its classified factors.
We use the empirical orthogonal function (EOF) (Shi, 2009) to extract the main rainfall modes of ACR in Qinghai Province. Regression, correlation, partial correlation and anomaly analyses (Wei, 2007) were used to analyze the impact on seasonal and sub-seasonal precipitation of ACR. The square root of the coefficient of determination was used in the regression analysis to be tested according to the significance test of the correlation coefficient.
Based on the definition of ACR events, we count the number of station with ACR occurrence in each month from 1961 to 2017 (Table 2). During the period of 1961–2017, there were 2,157 stations of ACR, all of which occurred in August-November. Among them, it was most frequent in August-September, reaching 898 (41.6%) and 982 (45.5%) stations respectively, and reaching nearly 90% accumulated. It was less frequent in October, with only 274 stations, accounting for 12.7%. It rarely occurred in November, with only 3 stations, accounting for 0.1%. Therefore, August-September is the time of high incidence of ACR in Qinghai Province, and the analysis below is mainly for this time period.
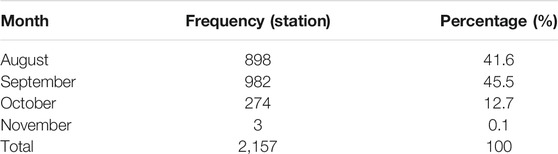
TABLE 2. The number of occurred stations in each month of ACR in Qinghai Province.
Using daily precipitation observations from 50 national meteorological stations in Qinghai Province, the anomaly of regional average continuous rainfall and rainday from August to September 1961-2017 are calculated (Figure 1). Similar variations are found in the time series of rainfall and rainday on both interannual and interdecadal scales. The correlation coefficient between the time series of rainfall and rainday in Qinghai Province reaches 0.97.
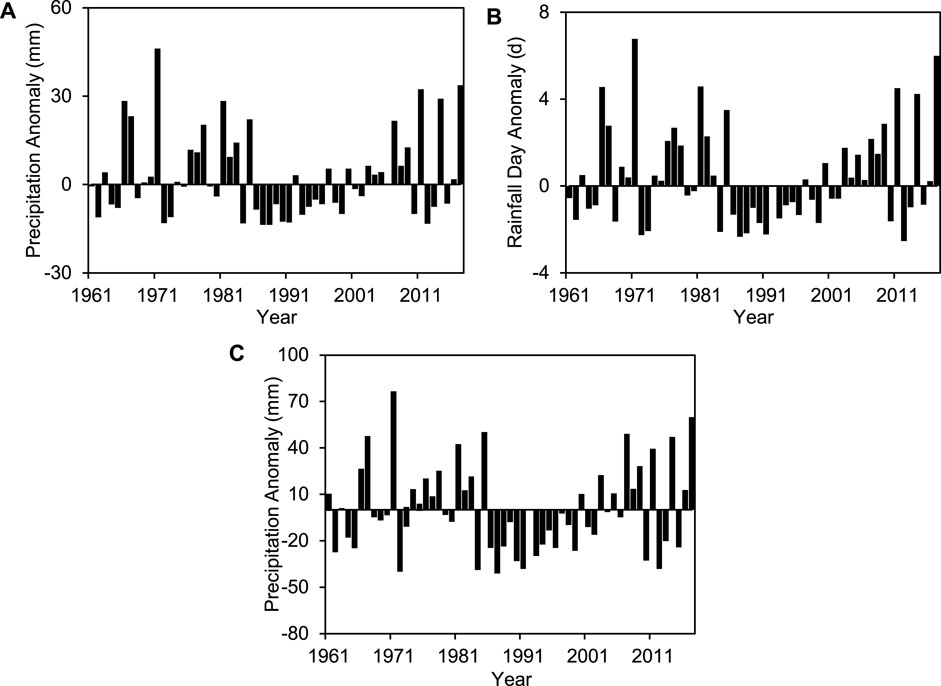
FIGURE 1. Regional average precipitation anomaly (A), unit: mm), rainday anomaly (B), unit: day) and concerned domain (C), unit: mm) average precipitation anomaly of ACR from August to September during 1961-2017.
On the interdecadal scale, the amount of rainfall and the number of rainday in Qinghai Province have positive anomaly from the 1960s to the mid-1980s and from the beginning of the 21st century to the 2010s. While from the mid-1980s to the end of the 21st century, they have negative anomaly. On the interannual scale, the interannual variation of ACR is large, and there is obvious interannual difference.
The EOF analysis is conducted to extract the main rainfall patterns of ACR in Qinghai Province from 1961 to 2017. The explained variances of the first two modes reach 35.8 and 11.0% respectively, and the cumulative explained variance is 46.8%. It is tested that the first two modes of EOF analysis can pass the North test (North et al., 1982), meaning that the both modes are independent.
Mode EOF1 (Figure 2A) shows a spatial-consistent distribution pattern, which characterizes the main spatial pattern of ACR, and is similar to its climatic mean state. Also, the variation characteristics of its temporal coefficient (Figure 2C) is similar to those of the rainfall anomaly (Figure 1A), and the correlation coefficient between them can reach 0.95, i.e., the spatial distribution pattern of EOF1 can basically characterize its average condition.
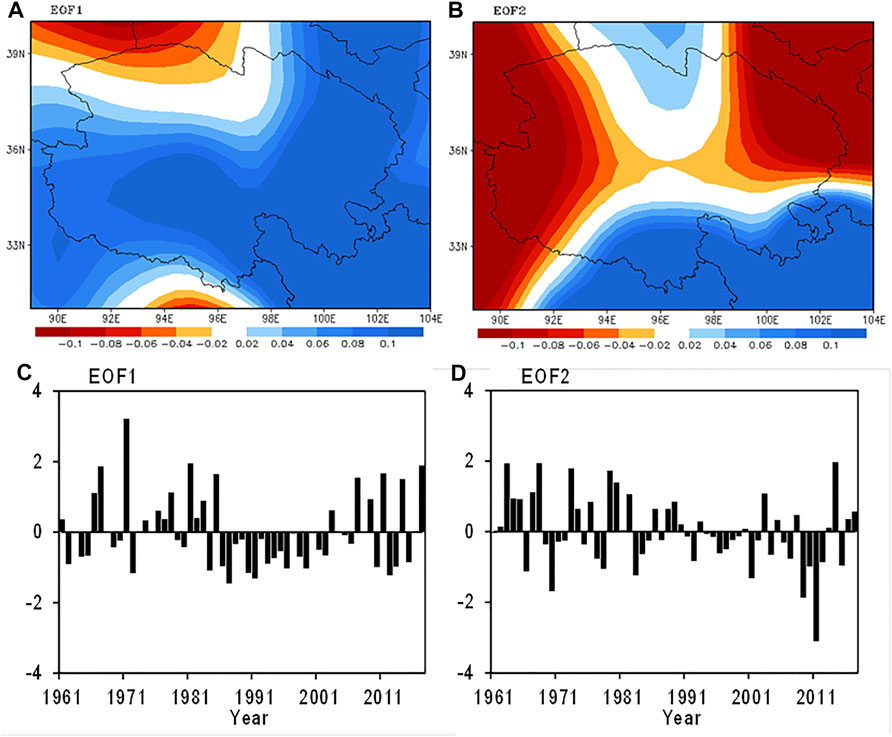
FIGURE 2. Main modes and their time coefficients of ACR from 1961 to 2017. (A): EOF1; (B): EOF2; (C): PC1; (D): PC2.
Mode EOF2 (Figure 2B) is the second main mode after the climatic mean state, showing a “saddle-shaped” spatial distribution pattern. Two types of precipitation distribution are formed when coupled with the phase of time coefficients, namely southern rainfall type and East-West rainfall type.
Based on the distribution of EOF1 (Figure 2A), the anomalous center of ACR is located in the southeastern part of the Qinghai Province. The concerned domain is designated according to the spatial distribution (Figure 3) of the year-to-year variability by standard deviation (STD) > 30 mm. It can be found that its precipitation anomaly (Figure 1C) is similar with the region’s, with the correlation coefficient reaching 0.94. Therefore, the rainfall of ACR can represent the temporal variations, which can be used to analyze the relationship between ACR and ocean/atmospheric circulation, and exploring its seasonal and subseasonal predictability.
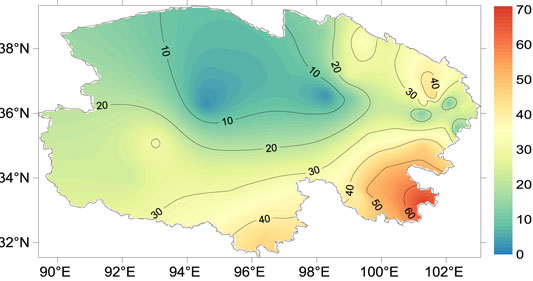
FIGURE 3. Standard deviation of ACR in Qinghai Province during 1961-2017 (unit: mm).
The oceanic forcing acts as one of the important driving factors affecting the occurrence and development of ACR in Qinghai Province. The temporal coefficients of the main rainfall patterns and the time series of ACR anomaly are correlated with SST and oceanic indexes from the ocean/circulation index dataset during the same and the previous period, respectively. To single out the effect of one factor on ACR, partial correlation analysis is also conducted and control variables are extracted by excluding factors of the same class. The key SST areas that influence the main rainfall distribution patterns are extracted, and their relationships are discussed to exploring their indicative effect.
A regression analysis was conducted using the temporal coefficients of the main modes of ACR on SST during the same period, respectively (Figures 4C–F). The key SST area for consistent precipitation distribution (EOF1) is located in the equatorial eastern central Pacific, and the relationship is significantly negatively correlated, i.e., the negative SST anomaly (La Niña event) in the equatorial eastern central Pacific is favorable to positive anomaly of ACR in Qinghai. The key SST region of “saddle-type” precipitation distribution (EOF2) is mainly located in the Indian Ocean, and presenting a significant negative correlation, i.e., the higher SST, especially in the western and southeastern Indian Ocean, is favorable to more ACR Qinghai during the same period.
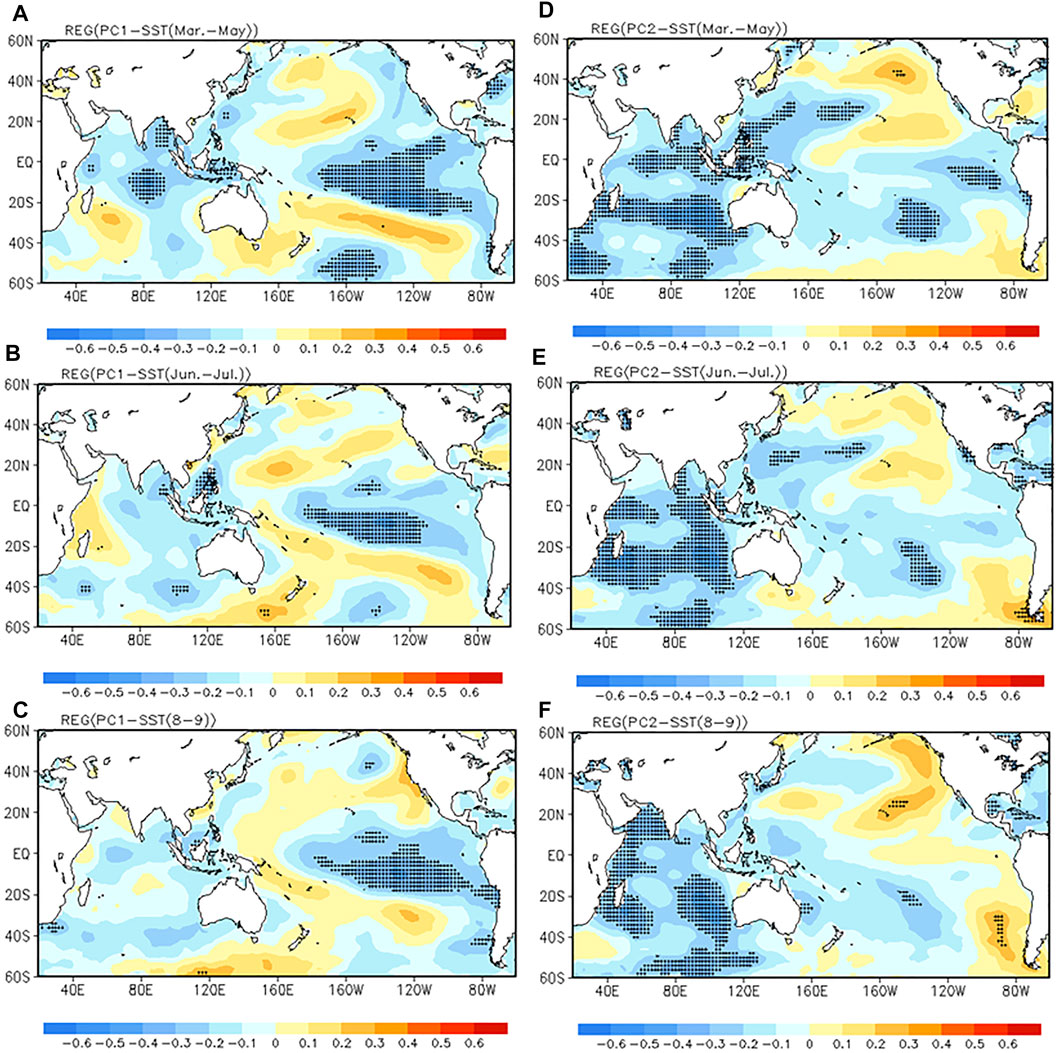
FIGURE 4. Regressions on global SST in spring (A,D), summer (B,E) and August-September (C,F) of PCs during 1961–2017. (A–C): PC1; (D–F): PC2; +: pass the significant level of 0.05).
The SST indices are selected from the index dataset, and correlated with the time series of ACR anomaly in August, September, and August-September from 1961 to 2017, respectively (Table 3). The SSTs of the same period in different areas have different indications for the sub-seasonal rainfall of ACR. The key area influencing the ACR in August is mainly from the tropical Indian Ocean, which shows a significant positive correlation between the TIOD with the rainfall of ACR. In September, the key areas shift to the Pacific Ocean, including NINO A and the Kuroshio region, both of which show a significant negative correlation. From the result of partial correlation, the correlation coefficients by excluding the influence for each other do not change, meaning that the effects from the equatorial eastern central Pacific and tropical Indian Ocean on ACR are independent.
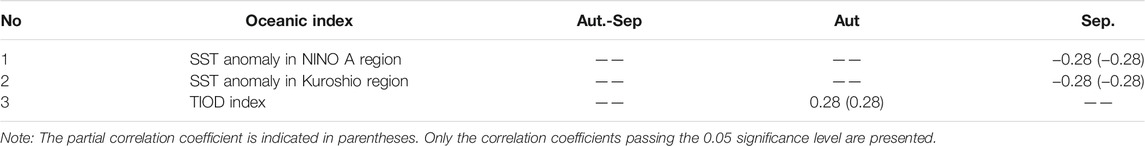
TABLE 3. Correlation and partial correlation coefficients between ACR and the oceanic indexes in the same period from 1961 to 2017.
Figures 4A,B shows the regression of EOF1 temporal coefficients on earlier global SST. It can be found that the early ocean signal in spring mainly comes from the equatorial central-east Pacific and the tropical central Indian Ocean. In summer, the precursor of the equatorial central-east Pacific narrows to the central region, and the Indian Ocean signal weakens. These relationships all show a significant negative correlation, i.e., the lower SST in the early period favors more precipitation in the main pattern of the consistent pattern of ACR. For EOF2 (Figures 4D,E), the precursory signal for the “saddle-type” precipitation distribution is mainly located in the Indian Ocean, and it can last from spring to summer. In addition, there is also some gradually weakening signal in the Kuroshio region from spring to summer.
The SST of tropical Indian Ocean in spring is indicative to the ACR in August-September. A positively correlated relationship is found between TIOD index and ACR. However, in sub-seasonal scale, the relationship from global SST is different. It is similar for ACR in August with a stronger signal in the tropical Indian Ocean, which can be advanced to the southern Indian Ocean in april and shift to the tropical Indian Ocean in May. While, the indicative signal of ACR in September appears in the equatorial east-central Pacific Ocean. Especially in March-April, the SST in NINO region shows a significant negative correlation with it. In addition, under the influence of SST, Southern Oscillation is also one of the indicative signals of the September ACR with significant positive correlation (Table 4). After excluding the influence from other oceans, the partial correlation coefficient can also pass the 0.05 significance level. Thus, the signals from tropical Indian Ocean and the equatorial east-central Pacific Ocean are with indicative significance and independence in the previous period.
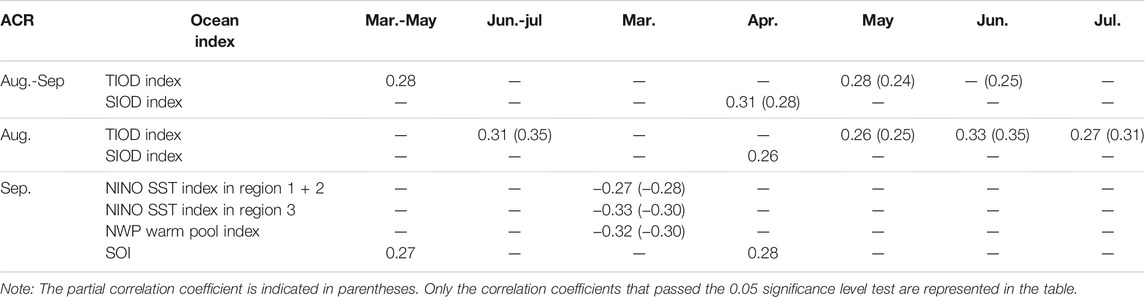
TABLE 4. Correlation and partial correlation coefficients between ACR and ocean indexes during the previous period from 1961 to 2017.
The SST anomaly in the equatorial eastern central Pacific and the tropical Indian Ocean correspond to precipitation pattern of EOF1 and EOF2 respectively, and their precursor signals can be advanced to spring. In order to explore the impact of SSTs on the ACR, composite analysis is conducted by extracting typical years with STD >1.7 of PC1 (1967, 1971, 1981, and 2017) and PC2 (1963, 1968, 1973, 1979, and 2014).
Consistent with the correlation analysis, a strong La Niña event can be found from spring to September for EOF1 (Figure 5A). The SST anomaly in the equatorial eastern central Pacific will cause anomalous circulation over the middle and high latitudes of Eurasia, forming a strong positive anomaly over Europe and negative anomaly over Asia (Figure 5C). This circulation pattern will strengthen the meridional circulation over the Eurasian. At the same time, the negative anomaly of SST is strong enough to extend to Equatorial Western Pacific, and causing a weak and easterly western Pacific subtropical high (WPSH) by weakening the Hadley circulation. Thus, it forms a warm advection over the main rainfall region of the ACR in Qinghai Province (Figure 6A), and brings water vapor from Indian Ocean (Figure 6C) to leading the precipitation pattern of EOF1.
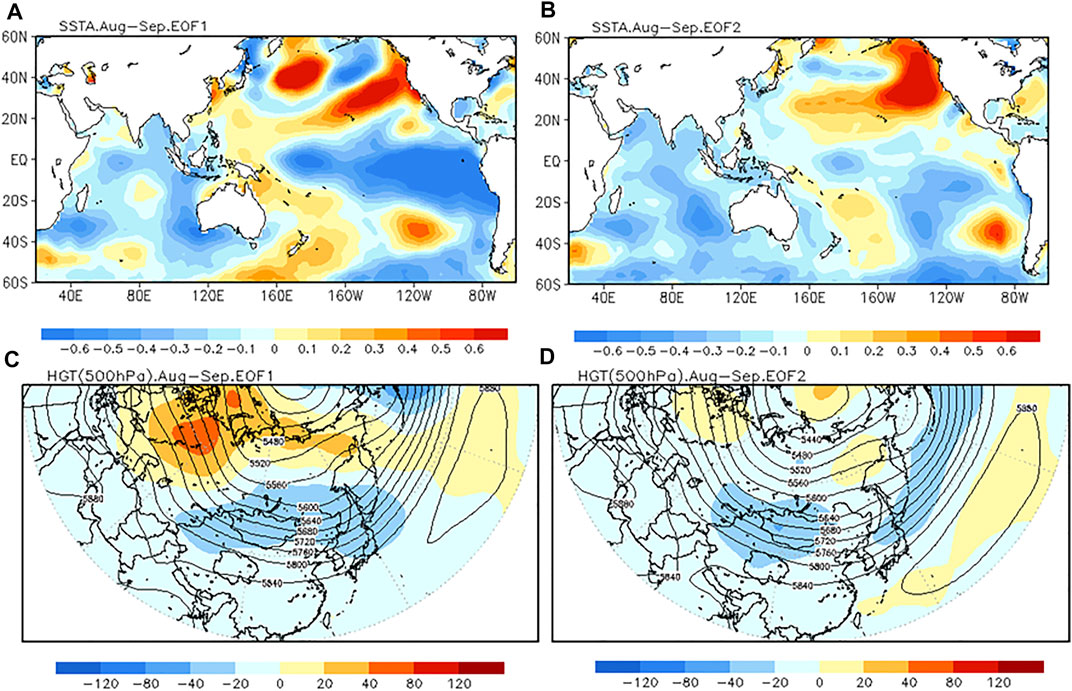
FIGURE 5. Composite analysis of SST and geopotential height in 500 hPa for EOF1 (A,C) and EOF2 (B,D). (A,B): SST anomaly, unit: °C; (C,D): geopotential height, contour line: geopotential height, shading: geopotential height anomaly, unit: gpm).
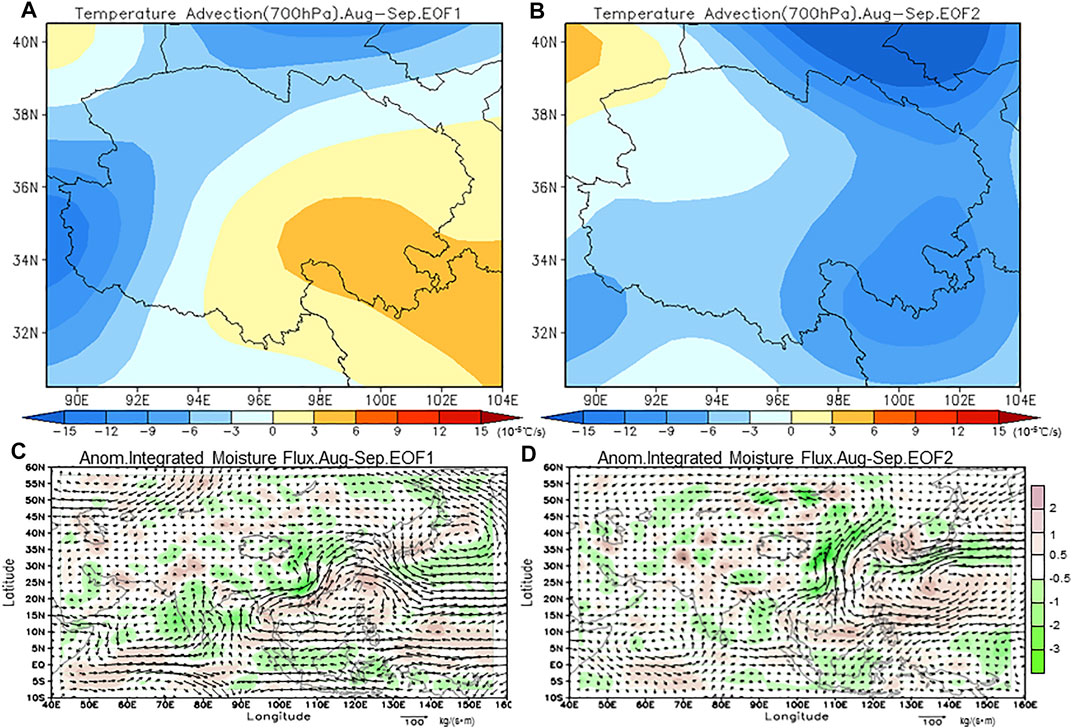
FIGURE 6. Composite analysis of temperature advection in 700 hPa and integrated moisture flux anomaly (1000 hPa–300 hPa) for EOF1 (A,C) and EOF2 (B,D). (A,B): temperature advection, unit: 10−5 °C/s; (C,D): integrated moisture flux anomaly, vector: moisture transport anomaly, unit: kg/s−1•m−1; shading: convergence and divergence anomaly field of moisture, unit: 10−5kg/s−1•m−2).
For the precipitation pattern of EOF2, the consistent negative anomaly of SST is also can be found in the tropical Indian Ocean (Figure 5B). The circulation anomaly caused is different with a La Niña event, forming a “+, -, +,-” pattern over the middle and high latitudes of Europe-Asia-Pacific (Figure 5D). This circulation pattern can also strengthen the meridional circulation over the Eurasian, especially the cyclonic circulation anomaly formed over north of Qinghai Province. Under this circulation pattern, water vapor from the Indian and Pacific Oceans mainly affects the eastern part of China and cannot be transported to Qinghai Province. The precipitation pattern of EOF2 is mainly due to the cyclonic circulation anomaly, which forms a cold advection over Qinghai Province and brings water vapor from the Arctic (Figures 6B–D).
Therefore, the enhanced meridional circulation is necessary to cause the ACR in Qinghai. However, SST anomalies from the Pacific and Indian Oceans force different circulation patterns that lead to different precipitation pattern of ACR.
The atmospheric circulation configuration between high and low levels, north and south latitudes forced by SST anomaly are the direct factors leading to the ACR anomaly. Similar to the SST, the possible impact on seasonal and sub-seasonal ACR of atmospheric circulation is analyzed to explore their indicative effects.
A regression analysis was conducted using the temporal coefficients of the main modes of ACR with the 500hPa geopotential height field during the same period. The key area, which can affect the consistent pattern of ACR by causing the change of the trough and ridge over Qinghai Province, is located in the middle and high latitudes of the upper Eurasian continent showing a significant positive correlation (Figure 7A). The remote correlation wave train with significant correlation to the “saddle type” precipitation distribution pattern are located at middle and high latitudes, forming “-, +, -, +, -” from Central Asia to the west coast of North America, and this wave train plays an important role in the “saddle type” distribution of ACR (Figure 7B).
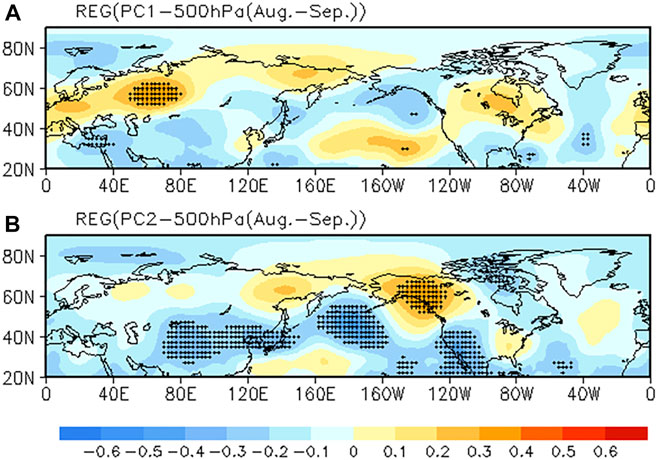
FIGURE 7. Regressions on 500 hPa geopotential height field of temporal coefficients of ACR in August-September during the 1961–2017 period.(A): PC1; (B): PC2; +: pass the significant level of 0.05).
The atmospheric circulation that have important influence on ACR in the same period mainly come from subtropical high (No. 1–8) and high latitude circulation and remote correlation circulation pattern (No. 9–11) in the northern hemisphere (Table 5), and presenting different characteristics in seasonal and sub-seasonal scale. In August, the ACR is mainly positively correlated with the Pacific subtropical high pressure, especially over the eastern Pacific Ocean, while in September it is negatively correlated with the northern boundary of subtropical high over the North American-Atlantic.
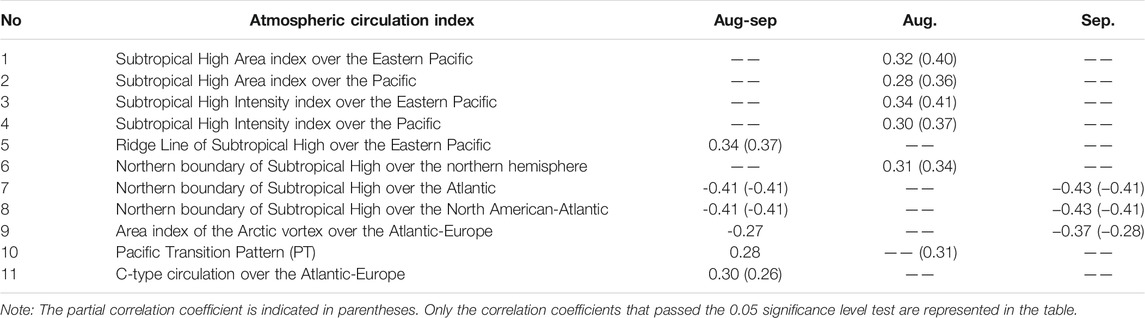
TABLE 5. Correlation and partial correlation coefficients between ACR and atmospheric circulation indexes in the same period from 1961 to 2017.
The relationships between the high latitude circulation/remote correlation circulation pattern in the northern hemisphere and the ACR are mainly reflected in the seasonal scale, including the area of the polar vortex over the Atlantic-Europe (negative correlation), the Pacific Transition Pattern (PT) remote correlation circulation pattern (positive correlation), and C-type circulation over the Atlantic-Europe (positive correlation). Therefore, The circulation configuration with strong subtropical high over the Pacific, southward subtropical high over the North American-Atlantic, lower area of polar vortex over the Atlantic-Europe, positive phase of PT circulation over the western Pacific, and the C-type circulation dominating the Atlantic-Europe, is conducive to the transmission and stable maintenance of the trough and ridge from upstream to the downstream Qinghai, leading to more ACR.
After excluding the influence from each other of the key atmospheric circulation factors, the partial correlation coefficients of subtropical high has improved, and other’s decreased. Therefore, subtropical high pressure is probably the most important circulation factor, which interacts with other circulation factors, and thus affects the ACR.
The areas significantly correlated with PC1 in the 500hPa geopotential height field in spring are mainly located over the North American continent at middle and high latitudes, which show significant negative correlations. By in June-July, these areas are shifted eastward and located over the northern Atlantic Ocean. In addition, the geopotential height over the Arctic in June-July shows a significant positive correlation with the EOF1 (Figures 8A,B).
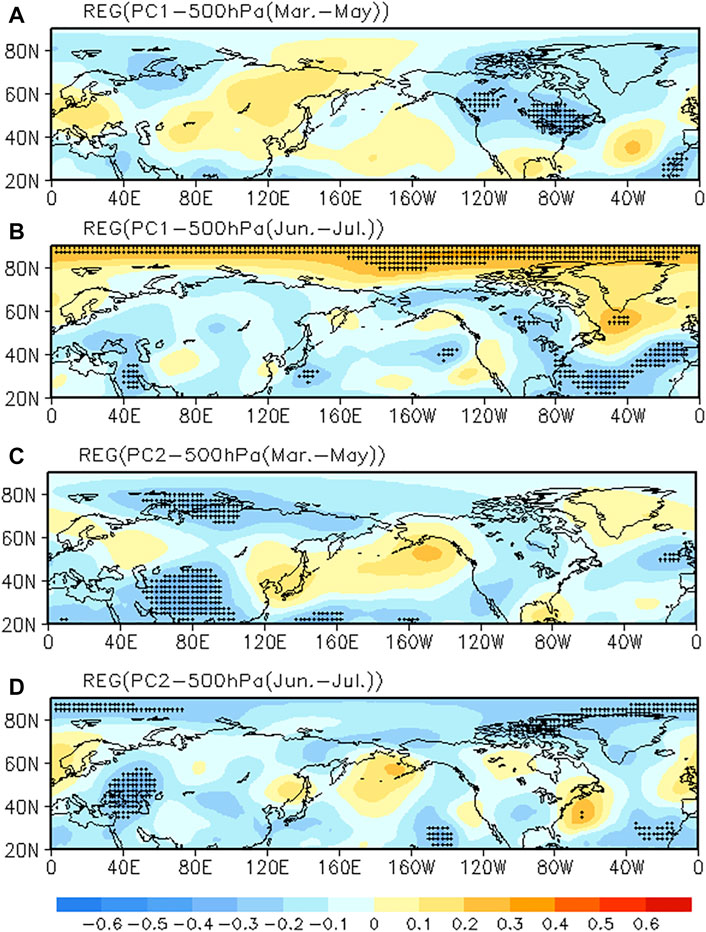
FIGURE 8. Regressions on 500hPa geopotential height fields during the previous period of PC1 (A,B) and PC2 (C,D) from 1961 to 2017. (A,C): March-May; (B,D): June-July; +: pass the significant level of 0.05.
In spring, the key areas of EOF2 in 500hPa geopotential height field are located in the Eurasia, showing a “saddle type” distribution with negative correlation. In June-July, the correlation circulation pattern is adjusted, and the areas shift to the upstream area of Qinghai Province and the Arctic, both of which show significant negative correlation (Figures 8C,D).
On seasonal and sub-seasonal time scales, the indications of atmospheric circulation in previous period for ACR are relatively similar. The predictable factors can be divided into four categories: subtropical high, Arctic vortex/Oscillation, Eurasian meridional/latitudinal circulation and Atlantic-Europe circulation pattern (Table 6). The earlier Subtropical high and Arctic vortex/Oscillation in June-July are the main factors affecting the ACR. It is favorable to more ACR under the circulation configuration in June-July like: the location of the center of the Arctic vortex is southward and strong; the area of the Arctic vortex is large in the Atlantic-Europe region and small in the Asian region; the AO shows negative phase; the subtropical high is southward and the westward extension over western Pacific; in Eurasia, the meridional circulation weaks, and the latitudinal circulation strengthens; in Atlantic-Europe, it is dominated by the latitudinal westerly circulation pattern (W-type). From the result of partial correlation analysis, different key circulation factors are interacting with each other, just like the same period.
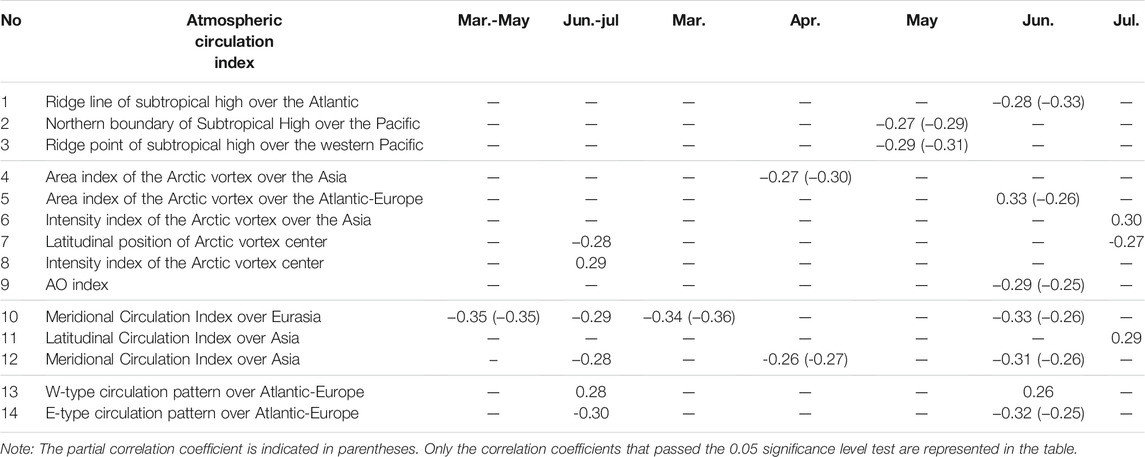
TABLE 6. Correlation and partial correlation coefficients between ACR and atmospheric circulation indexes in previous period from 1961 to 2017.
Obviously, subtropical High, Arctic vortex, and circulation pattern over Atlantic-Eurasian are the key factors affecting on ACR in Qinghai Province. The position and intensity of subtropical high especially over west Pacific and north Indian Ocean influenced by sea-air oscillation both in Pacific Ocean and Indian Ocean will lead to anomaly of water vapor transport (Chao and Zhou, 2014; Li et al., 2014). Arctic vortex, and circulation pattern over Atlantic-Eurasian forcing by SST anomaly in Pacific Ocean and Indian Ocean (Calvo et al., 2009; Gu et al., 2017) with teleconnection wave train will lead to anomaly of clod/warm advection and the structure of atmospheric baroclinicity (Lin and Zhang, 2003).
ACR precipitation mainly appears in the consistent type and “saddle-type” distribution across the Qinghai Province. SST and atmospheric circulation are important indicators of both seasonal and sub-seasonal rainfall of ACR. Since the ACR often occurs spanning the high summer and early autumn, the impacts on ACR from SST and atmospheric circulation vary.
In general, the significant factors for ACR include SST, Arctic vortex, subtropical high, Atlantic-Europe circulation pattern and Eurasian meridional/latitudinal circulation (Figure 9). The influence of oceanic factors on ACR is relatively independent, while there is an interaction between atmospheric circulation factors. In spring, the indicative signals appeared in the equatorial central eastern pacific and the tropical Indian Ocean, with the former corresponding to consistent precipitation and the latter corresponding to “saddle-type” precipitation. In terms of sub-seasonal precipitation, the tropical Indian Ocean and the equatorial central eastern pacific correspond to ACR in August and September, respectively. In the tropical Indian Ocean, its early signal can be advanced to the southern Indian Ocean in april, and it transfers to the tropical Indian Ocean in May. SST anomalies from the Pacific and Indian Oceans force different circulation patterns that can enhance meridional circulation over Europe-Asia and lead to different precipitation pattern of ACR. In June-July, the indicative signal for ACR comes from subtropical high and Arctic vortex/Oscillation. Under the north-south circulation configuration, the meridional circulation continues to be weak, and the latitudinal circulation strengthens in Eurasia, and it is dominated by the latitudinal westerly circulation pattern in Atlantic-Europe, which is favorable to more ACR in Qinghai Province.
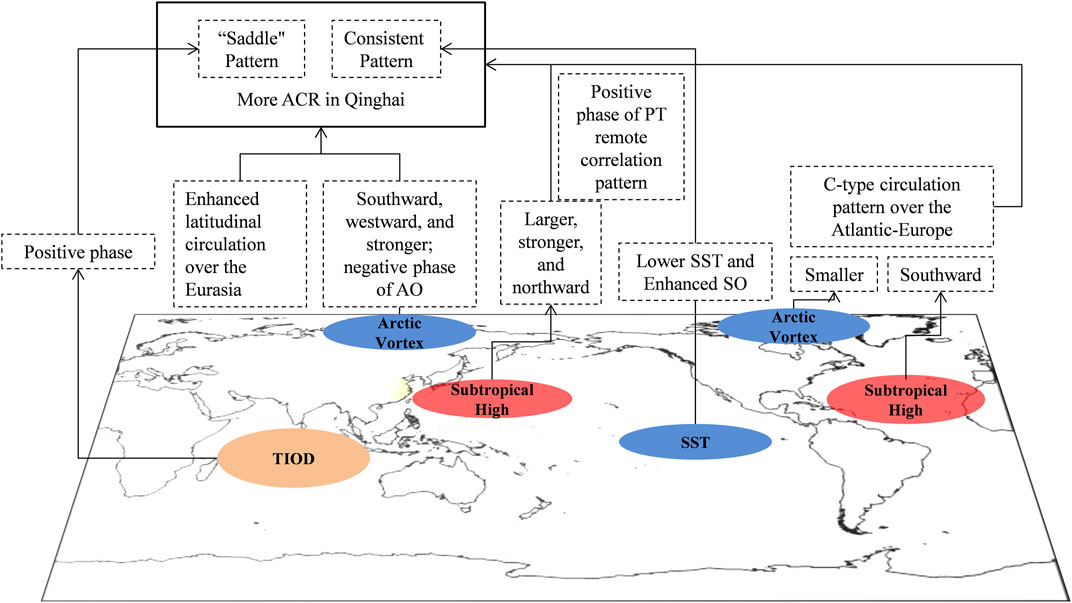
FIGURE 9. Diagnostic model of ACR in Qinghai Province.
In this work, the main patterns of ACR are extracted, and the possible impact is analyzed to explore the indication of global SST and atmospheric circulation on seasonal and sub-seasonal precipitation of ACR. This is only a basic work. The underlying mechanisms effecting on ACR of each factors are still not clear enough, and need specialized research to explore the dynamic and thermal process in the future. Besides, to carry out quantitative and refined short-term climate prediction on seasonal and sub-seasonal scales, it is necessary to further integrate the diagnostic analysis and the dynamical model, effectively revise the dynamical model using key factors from SST and atmospheric circulation, and carry out combined dynamical-statistical forecast tests (Feng et al., 2013) to improve the ability of short-term climate prediction on seasonal and sub-seasonal precipitation of ACR.
The original contributions presented in the study are included in the article/Supplementary Material, further inquiries can be directed to the corresponding author.
HY: writing original draft preparation. HS: providing some of the required data. YM and YY: visualization. XW and GF: review and editing. All authors contributed to the article and approved the submitted version.
This work was funded by the National Key Research and Development Program of China (Grant No. 2018YFA0606301), the National Natural Science Foundation of China Project (Grant Nos. 42075057 and 41875100) and Natural Science Foundation of Shanghai (Grant No. 21ZR1457600).
The authors declare that the research was conducted in the absence of any commercial or financial relationships that could be construed as a potential conflict of interest.
All claims expressed in this article are solely those of the authors and do not necessarily represent those of their affiliated organizations, or those of the publisher, the editors and the reviewers. Any product that may be evaluated in this article, or claim that may be made by its manufacturer, is not guaranteed or endorsed by the publisher.
The Supplementary Material for this article can be found online at: https://www.frontiersin.org/articles/10.3389/feart.2022.801075/full#supplementary-material
Calvo, N., Giorgetta, M. A., Garcia-Herrera, R., and Manzini, E. (2009). Nonlinearity of the Combined Warm ENSO and QBO Effects on the Northern Hemisphere Polar Vortex in MAECHAM5 Simulations. J. Geophys. Res. 114, D13109. doi:10.1029/2008JD011445
Chao, H., and Zhou, T. (2014). The Two Interannual Variability Modes of the Western north pacific Subtropical High Simulated by 28 Cmip5-Amip Models. Clim. Dyn. 43 (9-10), 2455–2469. doi:10.1007/s00382-014-2068-x
Cheng, P., Zhao, Q. Y., Li, J. P., and Sun, G. (2007). Analysis of Isentropic Potential Vorticity of a Continuous Rain Process in the East of Northwest China. Arid Meteorology 25 (1), 58–62. doi:10.3969/j.issn.1006-7639.2007.01.011
Feng, G. L., Zhao, J. H., and Zhi, R. (2013). Recent Progress on the Objective and Quantifiable Forecast of Summer Precipitation Based on Dynamical-Statistical Method. J. Appl. Meteorol. Sci. 24 (6), 656–665.
Fu, Y., Li, F. X., and Guo, G. (2004). Natural Disasters in Qinghai Province and Characteristics Analysis. Earthquake Res. Plateau 16 (4), 59–67. doi:10.3969/j.issn.1005-586X.2004.04.010
Gu, B., Zheng, Z., Feng, G., and Wang, X. (2017). Interdecadal Transition in the Relationship between the Western pacific Subtropical High and Sea Surface Temperature. Int. J. Climatol. 37 (5), 2667–2678. doi:10.1002/joc.4872
Kalnay, E., Kanamitsu, M., Kistler, R., Collins, W., Deaven, D., Gandin, L., et al. (1996). The NCEP/NCAR 40-year Reanalysis Project. Bull. Amer. Meteorol. Soc. 77 (3), 437–471. doi:10.1175/1520-0477(1996)077<0437:tnyrp>2.0.co;2
Li, W. Z., Tong, Y. Z., and Yang, Y. H. (2018). Monitoring Indicators of Continuous Rain in Qinghai: Revision and Spatial-Temporal Characteristics. Chin. Agric. Sci. Bull. 34 (31), 125–130.
Li, X., Zhou, W., Chen, D., Li, C., and Song, J. (2014). Water Vapor Transport and Moisture Budget over Eastern China: Remote Forcing from the Two Types of El Niño. J. Clim. 27 (23), 8778–8792. doi:10.1175/jcli-d-14-00049.1
Lin, S., and Zhang, K. J. (2003). Analysis of Continuous Autumn Rain in Northwest China in 2000 and 2001. Meteorol. Monthly 29 (2), 34–38.
Ma, Z. L. (2008). Analysis of the Weather Characteristics of Autumn Rainfall in Qinghai Province. Qinghai Sci. Tech. 2, 31–33. doi:10.3969/j.issn.1005-9393.2008.02.013
North, G. R., Bell, T. L., and Cahalan, R. F. (1982). Sampling Errors in the Estimation of Empirical Orthogonal Functions. Mon. Wea Rev. 110, 699–706.
Sun, Z. B., Huang, Y. Y., and Ni, D. H. (2016). Climate and Circulation Characteristics of Continuous Autumn Rain in China. Trans. Atmos. Sci. 39 (4), 480–489. doi:10.13878/j.cnki.dqkxxb.20140413001
Toit, P. (2010). Doppler Radar Observation of Drop Sizes in Continuous Rain. J. Appl. Meteorology 6, 1082–1087.
Wei, F. Y. (2007). Modern Statistical Diagnosis and Prediction Technology on Climate. Beijing: China Meteorological Press.
Xiao Tiangui, T., Jin Ronghua, R., Wang Minghuan, M., and Jia Lha, fnm. (2010). in Wave energy signal features and prediction research of the continuing heavy rain process in Sichuan Basin (IEEE). doi:10.1109/mace.2010.5535482
Xu, Y. X., Dangzhou, Z. M., and Pei, S. Y. (2010). Research on Weather Forecasting Service for Continuous Rainy Weather along Qinghai Section of Qinghai-Tibet Railway. Qinghai Sci. Tech. 17 (5), 58–61. doi:10.3969/j.issn.1005-9393.2010.05.020
Keywords: autumn continuous rain, main patterns of rainfall, sea surface temperature anomaly, atmospheric circulation, predictable factors
Citation: Yang H, Shen H, Ma Y, Yang Y, Wang X and Feng G (2022) Research on the Characteristics and Influence Factors of Autumn Continuous Rain in Qinghai Province. Front. Earth Sci. 10:801075. doi: 10.3389/feart.2022.801075
Received: 24 October 2021; Accepted: 21 January 2022;
Published: 22 February 2022.
Edited by:
Sanjeev Kumar Jha, Indian Institute of Science Education and Research, Bhopal, IndiaReviewed by:
Xichen Li, Institute of Atmospheric Physics (CAS), ChinaCopyright © 2022 Yang, Shen, Ma, Yang, Wang and Feng. This is an open-access article distributed under the terms of the Creative Commons Attribution License (CC BY). The use, distribution or reproduction in other forums is permitted, provided the original author(s) and the copyright owner(s) are credited and that the original publication in this journal is cited, in accordance with accepted academic practice. No use, distribution or reproduction is permitted which does not comply with these terms.
*Correspondence: Xiaojuan Wang, bW91c2UwOTAzQDEyNi5jb20=
Disclaimer: All claims expressed in this article are solely those of the authors and do not necessarily represent those of their affiliated organizations, or those of the publisher, the editors and the reviewers. Any product that may be evaluated in this article or claim that may be made by its manufacturer is not guaranteed or endorsed by the publisher.
Research integrity at Frontiers
Learn more about the work of our research integrity team to safeguard the quality of each article we publish.