 Wen Nie
 Minghua Luo
 Yunmin Wang
 Ruixiang Li4
- 1School of Geoscience and Technology, Southwest Petroleum University, Chengdu, China
- 2State Key Laboratory of Safety and Health for Metal Mines, Maanshan, China
- 3Sinosteel Maanshan General Institute of Mining Research Co., LTD, Maanshan, China
- 4Zijin Mining Company Limited, Shanghang, China
A 3D tailings dam visualization early warning system was developed based on GIS (geographic information system) combining ARIMA (autoregressive integrated moving average model) and 3S (RS, GIS, GPS) technology for prediction of phreatic line changes and tailing dam deformation. It was applied for monitoring and early warning for the gold–copper tailing dam in Zijinshan Dadongbei tailing pond. The system consists of equipment management, data management, prediction, monitoring and early warning, and 3D visualization modules. It is able to do data management, visualization and disaster prediction, and early warning based on 79 monitoring points of rainfall, infiltration line, and deformation of the tailing dam in the Zijinshan mine. The design and application of the system reflect its features of rich functionality, high practicality, intuitive effect, and high reference value. The system solves the problems of low visualization of monitoring data, poor management of multiple data, and feasible prediction and early warning of point–surface combination. It realizes high-precision prediction of key factors and real-time warning of disaster.
1 Introduction
Tailings have a great impact on environmental pollution and the ecological landscape (Jiang et al., 2021; Luo et al., 2021; Zhang et al., 2021). There are many kinds and quantities of tailing ponds in China, and most of them are in mountainous and upstream water source areas. Tailings mainly stored in tailing ponds are the largest bulk industrial solid waste produced by industrial and mining enterprises. Thus, the tailing pond is a facility with high environmental risk. The factors affecting the stability problem of the dam are complex (Hu et al., 2016; Clarkson and Williams, 2021a). Besides, safety events, such as tailing dam break, cause huge economic and property losses. The leakage of highly toxic chemicals, such as heavy metals and beneficiation agents contained in tailings, also very easily pollutes the surrounding soil, surface water, and groundwater, causing sudden environmental disasters (Del Rio-Salas et al., 2019; Ouyang et al., 2019). According to incomplete statistics, more than 100 tailing pond accidents have occurred in China since 2001. At present, the situation of tailing environmental risk management in China is still very serious, and the high incidence of environmental emergencies in tailing ponds has not been alleviated (Peng et al., 2020).
The early safety assessment of tailing dams in China was mainly based on manual monitoring (Yang et al., 2019). With the development and promotion of monitoring equipment, many tailing dams have used automatic monitoring devices and established a variety of monitoring systems based on wireless sensor network, the Internet of things, CAN-bus, and ZigBee technology (Wenxue et al., 2011; Wang and Yong, 2014; Bo and Shan, 2018; Meng, 2019; Gamperl et al., 2021). The installation of various types of automatic monitoring equipment on a tailing dam improves the monitoring efficiency and degree of automation (Pirsiavash et al., 2017; Ayhan and Almuslmani, 2021; Sarantsev, 2021; Zheng et al., 2021). However, some problems, such as isolation of multiple monitoring systems, invalid management of various types of data, and low visualization of data system are inevitable (Padsala et al., 2021). Therefore, the main aim of this study is to carry out the design and research of tailing dam monitoring and early warning system based on computer, cloud computing (Kanakaraja et al., 2021), GIS (geographic information system) (Kong, 2017; Thatcher, 2018), and time series prediction technology (Wen et al., 2021). 3D geographic information system can manage multisource data effectively and realize two- and three-dimensional visual displays (Cahyono et al., 2021). The system is built by cloud-side collaborative technology (Erbao et al., 2019), which is a widely used technology at present. It can solve the problems of data management and transmission. The system adopts the data-driven method for monitoring and early warning. Furthermore, it helps to improve prediction and early warning and also the three-dimensional visual display of tailing dam key factors, and finally promotes the construction of smart mine (Xu et al., 2019).
2 Design of System
2.1 Theoretical Basis
This study is based on geographic information system (GIS), cloud computing, computer technology, time series prediction, and so on. GIS is a computer system integrating data acquisition, transmission, management, storage, analysis, display, and output. Until now, the data processing and spatial analysis functions of GIS are continuously developed, and have been widely used in all walks of life (Al Faisal et al., 2018). In this project, the system framework was built based on the idea of GIS. GIS can manage multisource data effectively and realize two- and three-dimensional visual displays (Li N. et al., 2021). Cloud computing is a dynamically scalable service related to information technology, software, and the Internet. It has the characteristics of large scale, distributed, high availability and scalability, virtualization, security, on-demand service, economy, and reliability. In recent years, cloud computing and big data have developed rapidly. Compared with local servers, cloud computing has higher data-processing efficiency, larger data volume, and less demand for local resources. Cloud computing is based on cloud servers, and in this study, ECS (Elastic Compute Service) has been chosen. The rapid development of the mobile network is also an important guarantee for the rapid development of cloud computing technology in recent years (Zhang, 2021). The system is built by cloud-side collaborative technology, and this technology is more conducive to system integration. Time series prediction analysis uses the time characteristics of an event in the past to predict the characteristics of the event in the future (Al-Zahrani and Abo-Monasar, 2015). The time series model is divided into stationary and nonstationary series, which depends on the sequence of events. Time series usually contains rich information. In many scenarios, this information can help people understand the phenomenon and predict the future. This technology has been widely used in many fields. In the proposed monitoring and early warning system, the time series method is used to predict the trend changed of phreatic line and dam deformation in the future.
2.2 Design Idea
The early warning system uses the remote sensing image (RS), DEM (digital elevation model) data, monitoring point distribution data, sensor information, and collected monitoring data to establish the data storage system, data processing model, and three-dimensional visualization model. The monitoring data can be collected, predicted, stored, managed, displayed, and output in real time. The stability state of tailing dam can be accurately analyzed in order to reduce the risk of tailing dam failure and environmental pollution, and prevent potential economic and property losses (Zhou et al., 2015).
2.3 System Framework
The overall framework of the system is built by using cloud-side collaborative technology (Figure 1) (Erbao et al., 2019). The system server is deployed to the cloud server, and cloud computing is used to calculate data on the cloud server. Combined with edge computing and network transmission, the results are transmitted to the front end, and the front end is used for data rendering and display output.
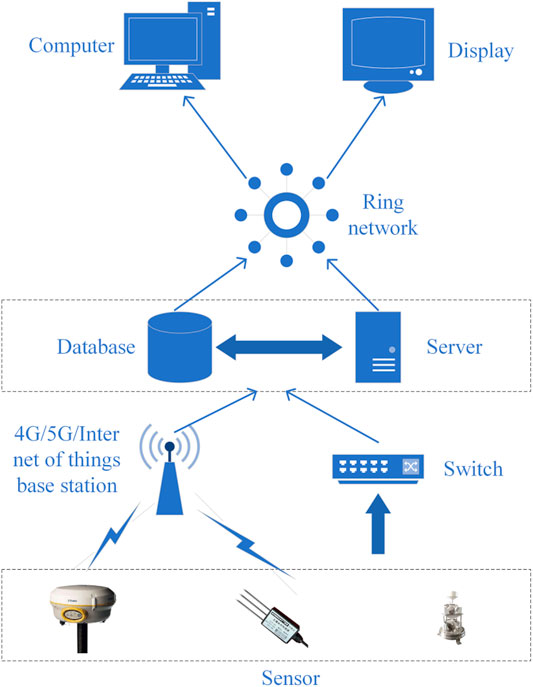
FIGURE 1. System workflow framework.
2.3.1 System Data Flow
The system data are mainly stored in the cloud database, including monitoring data, basic geological and geographic information data, model processing data, and manual monitoring data. The real-time monitoring data collected by the monitoring device are uploaded to the cloud database for storage through the transmission protocol, and the data processing model of the cloud server is called for data analysis and processing. The analysis results are stored in the database. The basic geological and geographic information data are stored in the database when the database is established, which is mainly used for front-end call and display. The manual monitoring data are stored in the database through the manual input of the front end for calling and processing by the data processing model. The front end can store the above data manually or display its call, and output it for display.
2.3.2 Frame Module
The monitoring and early warning system of the tailing dam is composed of multiple modules, which cooperate with each other to achieve the purpose of comprehensive management of the dam. The system mainly includes equipment management, data management, prediction, early warning, and visualization modules (Figure 2). The main functions of each module are as follows:
1) The main function of the equipment management module is to manage the monitoring equipment. Various types of monitoring equipment shall be classified and managed. The equipment management module can add or delete stations.
2) The data management module mainly manages various data, including data collection, storage, display, and output. It can accurately add, delete, modify, and view single or multiple monitoring data.
3) The prediction module is to predict the change in phreatic line and dam deformation. The prediction module adopts the differential autoregressive integrated moving average model (ARIMA), which predicts future data changes through learning historical data (Yadav and Balakrishnan, 2014).
4) The early warning module can give the early warning signal for the monitoring area. The system uses the method of the cloud model (Peng et al., 2020). The early warning threshold of each level is determined with reference to the provisions of the engineering technical code for the online safety monitoring system of tailing ponds (GB51108-2015).
5) The visualization module is used for a visual display of monitoring and prediction data and areas. The visualization of sensor monitoring data is realized by ECharts. According to UAV images, DEM data, and monitoring point data, the three-dimensional model of the tailing dam is established, and the visualization of the model is realized by rendering at the front end with three.js.
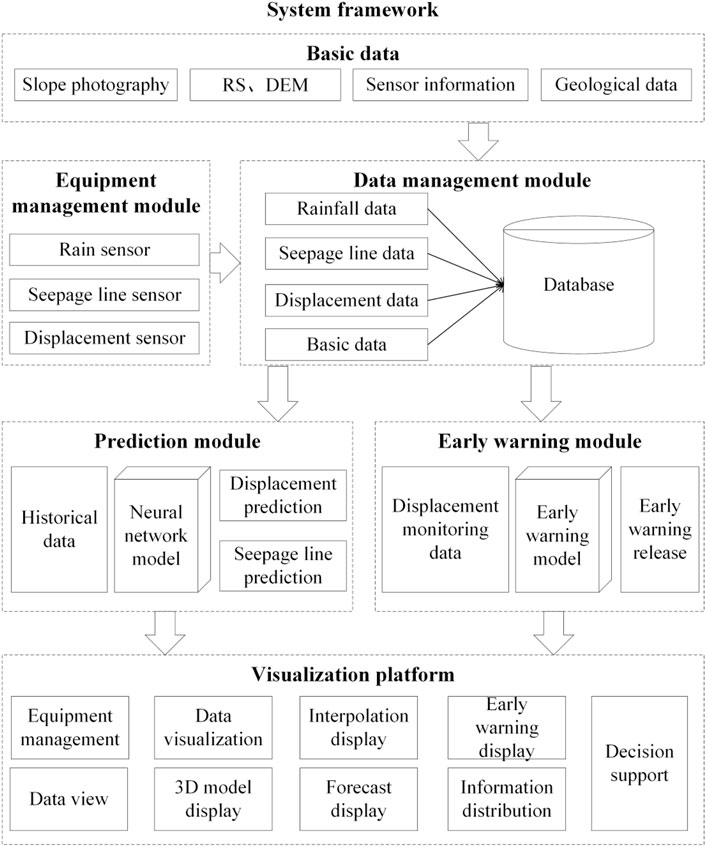
FIGURE 2. System modules.
2.4 Algorithm Models
2.4.1 Prediction Model
The prediction model is based on time series to do an analysis of previous monitoring data (Aggarwal et al., 2020). The time series model operation proposed in this study is divided into two stages (Figure 3): the first stage is mainly for interpolation and preprocessing of data loss, and the second stage is mainly for 20% future prediction of the overall data by using the nonlinear autoregressive model (NARX) (Ma et al., 2020; Du et al., 2021) and multilayer perceptron (MLP-NN). The NARX model with a three-layer neural network and including nine climate variables and eight neurons is the best model (Pu et al., 2019).
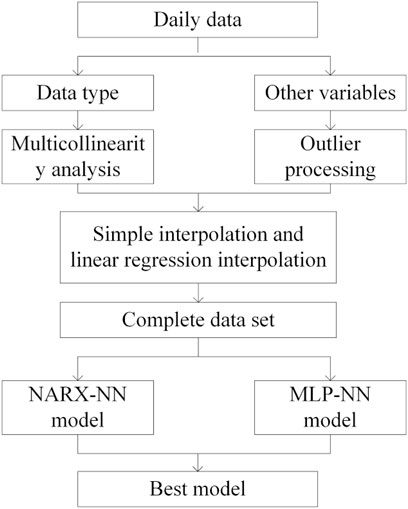
FIGURE 3. Flowchart of the prediction method.
2.4.2 Early Warning Model
For monitoring and early warning of tailing dam failures, it is necessary to study the early warning threshold. Four methods were considered: acceleration method, reciprocal velocity method, displacement rate ratio method, and cloud model, and finally, a suitable method to judge the early warning threshold was selected (Du et al., 2021).
1) The acceleration method divides the deformation into three stages: initial deformation, constant velocity deformation, and accelerated deformation. The acceleration method cannot provide a clear threshold (Xu and Zeng, 2009). 2) The reciprocal velocity method obtains the deformation rate according to the relationship between the monitored deformation and time. It also cannot provide a clear threshold (Wang et al., 2015). 3) The deformation rate ratio method judges the deformation of landslide mass through multipoint deformation changes and determines a unified index for multiple points. This method is also uncertain about the selection of the threshold (Wang et al., 2014). 4) The cloud model method is an effective way to transform quantitative data into qualitative concepts, and this method can be used to establish the mapping between the monitoring data and the normal operation state of the tailing dam. By reading the monitoring data of the tailing dam in normal operation and converting the forward cloud and reverse cloud, the corresponding relationship between the monitoring data and the risk levels of the tailing dam is established. Finally, the functions of hierarchical early warning and prediction, decision making and hierarchical management, and control of the tailing dam based on massive data are realized (Peng et al., 2020) (Figure 4). The key calculation formula of the cloud model method is as follows:
1) Sample expectation of calculated data
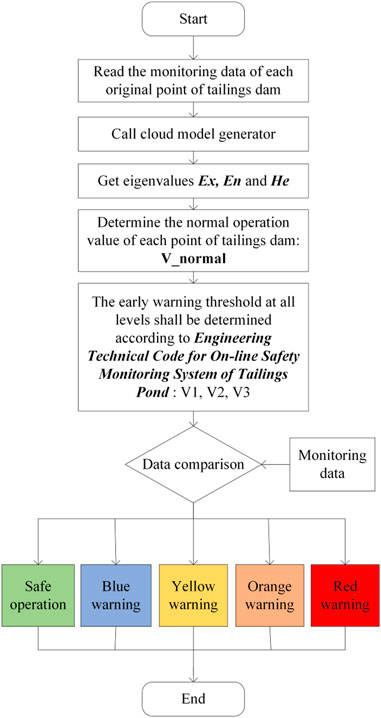
FIGURE 4. Early warning flowchart.
In Equation 1,
2) In data
In Equation 2:
The sample expectation (E (
3) The entropy (
4) According to the 3E rule of the cloud model, if the deformation rate of the tailing dam is within the interval
Compared with the other three methods, the cloud model can calculate the specific early warning threshold more effectively. The cloud model method has been applied in the tailing dam (Peng et al., 2020), and the early warning threshold of each level of early warning can be calculated according to the historical monitoring data of the tailing dam stability. Therefore, in this study the cloud model method was employed to build the early warning model.
2.4.3 Interpolation Model
Through the interpolation method, the monitoring and early warning mode of point-to-area can be realized. This study mainly considers inverse distance weight interpolation as the interpolation model (Liu et al., 2021).
The implementation steps of inverse distance weight interpolation are as follows:
(1) Sort out the coordinates and monitoring data of monitoring points;
(2) Mesh the interpolation area, obtain the center coordinates of each grid, and take the coordinates of the grid as the coordinates interpolated;
(3) Calculate the distance between the known discrete points, and then these points are interpolated. In two-dimensional plane space, the distance from discrete points (
(4) Find out the distance of N discrete points nearest the grid point (A, B), then the value estimated on the grid point (a, b) is:
(5) By estimating each grid point according to the appeal step, the values estimated of all unknown points can be obtained. Furthermore, the interpolation of the whole monitoring area can be realized.
2.5 System Implementation
The system adopts B/S (browser/server) structure, which unifies the client. The core business processing is completed on the server, realizing the function that any client can request data interaction through the network using the browser (Figure 5). The system uses Alibaba cloud host CentOS, and the database uses Alibaba cloud MySQL server for data storage. The background data interaction is mainly realized by Java, and the front-end page display is mainly realized by HTML. The background framework is mainly built by Maven, Springboot, Mybatis, Python, and other tools in order to realize the management and control of the background. The front end mainly uses Vue, Element, three.js, ECharts, and other tools to realize the construction of front-end framework, data visualization, 3D rendering, etc.
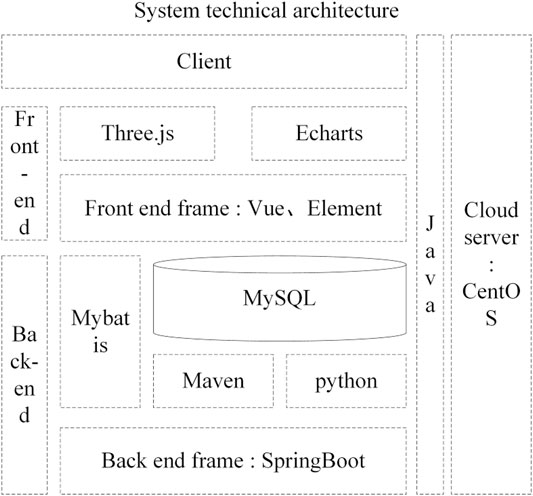
FIGURE 5. System implementation technical framework.
3. Application and Analysis
3.1 Study Area
The Zijinshan gold–copper mine in Fujian Province is a proven super large metal mine. Its mining area is located in the southern end of the Donglie mountain in the southern section of the Wuyi mountain range, which belongs to the middle and low mountain of structural erosion. This mine is a typical upper gold and lower copper mine. The mine has proven gold resource reserves of more than 300 tons and copper resource reserves of more than 5 million tons. It has a large open-pit mining site and underground mining site, as well as a large tailing pond. The Dadongbei tailing pond is in the northwest of the Zijinshan mining area. The gully trend is distributed in a nearly north–south direction. The cross section is in a “U” shape, and the slope gradient on the East and west sides is 25°–35°. The vegetation is developed, and the natural slope around is stable (Figure 6).
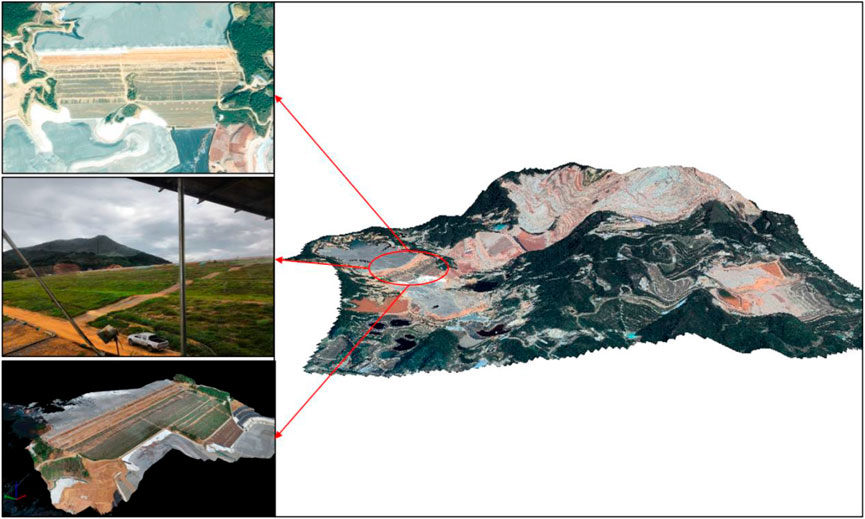
FIGURE 6. Gold–copper mine tailing dam in Zijinshan.
Currently, the tailing dam has a monitoring system in terms of manual monitoring, GNSS online monitoring, radar monitoring, phreatic line automatic monitoring, and rainfall automatic monitoring, including 1 rainfall monitoring point, 10 phreatic line monitoring points, and 68 deformation monitoring points. The existing monitoring system has some deficiencies: 1) There are many kinds of monitoring devices, but there is no comprehensive management of data. Therefore, it is not easy to conduct a comprehensive analysis. 2) There is no centralized management and postprocessing of the data collected, which is a waste of digital resources. “Data island” is outstanding, and the ability of prediction and early warning of the system is weak. 3) Most of the monitoring data are one- or two-dimensional plane data. The deficiencies in three-dimensional modeling and data analysis do not give a strong sense of intuition for decision makers.
3.2 Application
Based on the current information of the Zijinshan gold–copper mine tailing dam, a tailing dam monitoring and early warning system was developed, which integrates data acquisition, transmission, management, storage, analysis, calculation, display, and output (Figure 7). The system is composed of equipment management, data management, prediction, early warning, and visualization modules. Through these modules, multisource data were more effectively applied, and the visualization ability was improved.
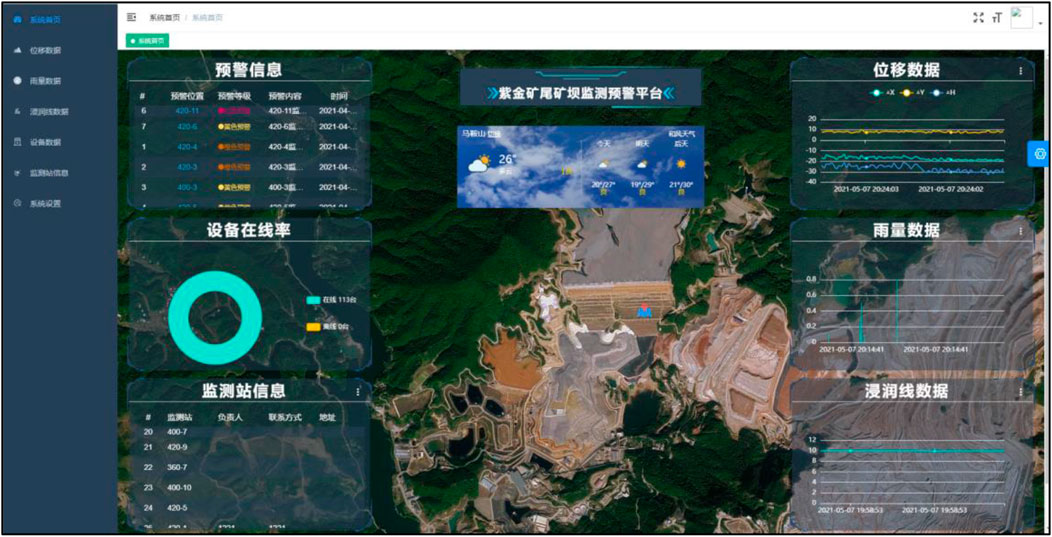
FIGURE 7. Interface of tailing dam monitoring and early warning system.
3.2.1 Equipment Management Module
In the monitoring and early warning system of the Zijinshan gold and copper mine tailing dam, the equipment management module mainly considers three kinds of equipment: phreatic line, rainfall, and deformation monitoring equipment. The equipment management module sets and manages grouping information. The system can automatically judge whether the equipment works normally. The system sets up the personnel information in charge of the equipment for effective equipment management (Figure 8A).

FIGURE 8. Management module (A: Equipment management module; B: Data management module).
3.2.2 Data Management Module
The management of various types of data is a necessary function of the system. In this system, the data management module realizes the management of phreatic line, rainfall, and deformation data. Through the data management module, the monitoring data can be queried, added, deleted, and modified, and also, a modification log can be set up to record the modification of each data (Figure 8B).
3.2.3 Prediction Module
The prediction module mainly includes phreatic line and deformation prediction. Through the historical monitoring data and real-time monitoring data, the change in data can be predicted. The accuracy of deformation prediction can reach more than 90%, and the accuracy of phreatic line prediction can be over 95%. For the deformation change, the deformations in X, Y, and Z directions are considered, respectively. The stationarity of the data is first analyzed (Figure 9). The autocorrelation coefficient and partial autocorrelation coefficient are tested in the X, Y, and Z directions (Figure 10), and the prediction model in the X direction is determined as:
Prediction model in the Y direction:
Prediction model in the Z direction:

FIGURE 9. Stationarity analysis of data in X, Y, and Z.
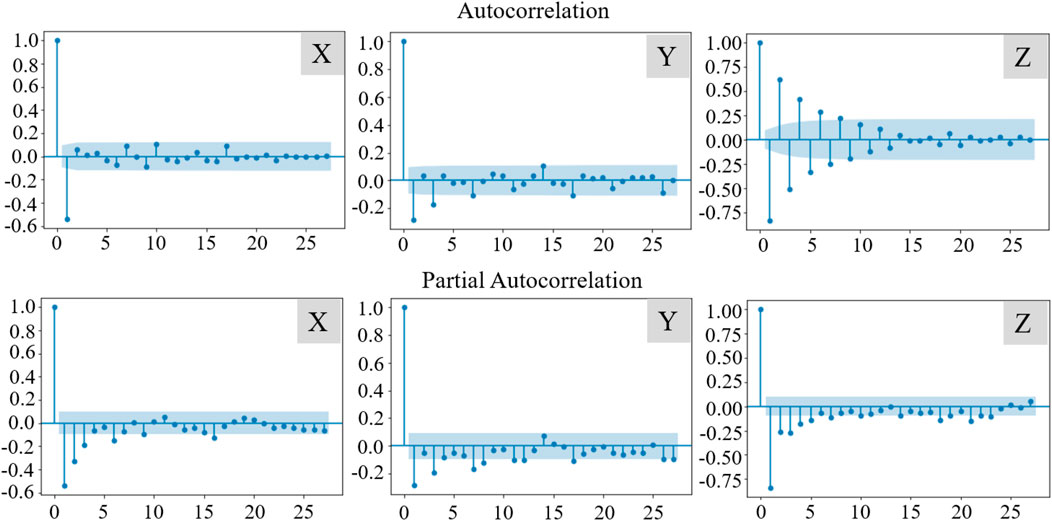
FIGURE 10. Test of autocorrelation coefficient and partial autocorrelation coefficient in X, Y, and Z.
For the evaluation of prediction accuracy, MSE (mean squared error) (Tsukuma, 2019) is used to evaluate the accuracy of regression results:
In Equation 13, yi represents the predicted value, qi represents the actual value, and n is the number of test samples.
The monitoring data of deformation and phreatic line is from July 15, 2019 to March 29, 2020. There are 68 displacement monitoring points, with 403 monitoring data at each monitoring point. Historical monitoring data (70%) of the tailing dam (deformation and phreatic line) is as the training set, and 30% data are as the test set. The accuracy of the above model has been tested many times. For example, prediction of the deformation data in the three directions of X, Y, and Z and real monitoring data are as shown in Table 1; the monitoring data and prediction data of displacement monitoring point 410-2 are from March 30 to April 1, 2020. For phreatic line data, there are 10 monitoring points in total, with 5,918 data at each monitoring point. The same method was used to analyze and predict the phreatic line prediction model, and the results also have a high accuracy (Table 2). In Table 2, the monitoring data and prediction data of the phreatic line on March 30, 2020 are given.
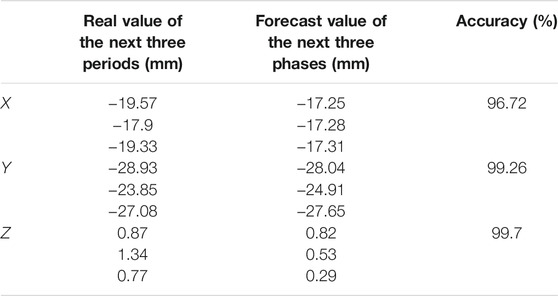
TABLE 1. Display of deformation prediction data and real data.
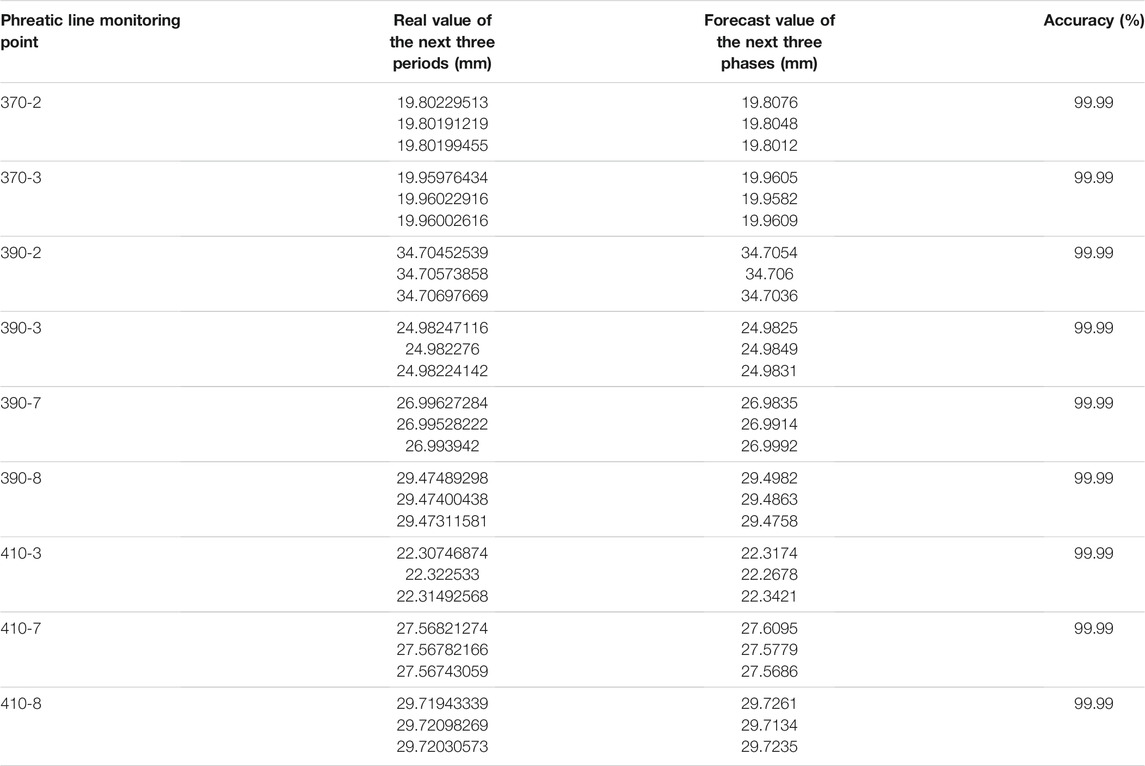
TABLE 2. Display of phreatic line prediction data and real data.
3.2.4 Early Warning Module
The tailing dam of the Zijin mine has been monitored for 2 years, with a large amount of deformation monitoring data (n = 68,000). The historical monitoring data are imported into the early warning model to calculate the early warning threshold at all levels. First, the model is adopted to calculate a normal operation value of 1.0709 cm/h. The early warning threshold of each level is determined through the standard: the threshold of yellow alert is 1.3922 cm/h, the threshold of orange alert is 2.1419 cm/h, and the threshold of red alert is 3.2128 cm/h. Through the comparison between the real-time monitoring data and the early warning threshold at all levels, the stability evaluation of each monitoring point is realized to achieve the purpose of monitoring and early warning. With the continuous increase in monitoring data, the more accurate thresholds can be adjusted automotively. In the case of early warning, the information is released in real time, and the corresponding early warning level is displayed at the early warning monitoring point for a more intuitive effect.
3.2.5 Visualization Module
The system visualization mainly includes the visualizations of monitoring data, three-dimensional model, phreatic line and deformation prediction, and early warning (Figure 11). These visualizations are mainly completed by the ECharts tool as shown in Figure 7. The monitoring data curve of monitoring points can be displayed and updated with the real data input.
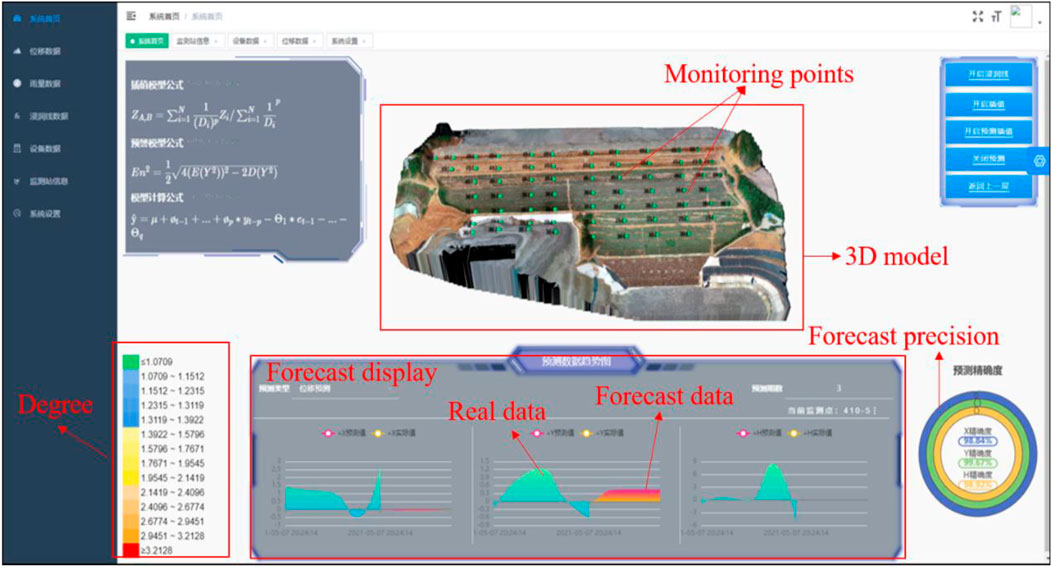
FIGURE 11. Visual interface of 3D model and prediction early warning.
3.2.5.1 Interpolation Visualization
There are 68 deformation monitoring points on the tailings dam with average equal intervals on the dam body. The area without monitoring points around is interpolated. First, the dam surface is meshed, and then the coordinate information of each grid is obtained. Using the known monitoring data of 68 points, the grid area is interpolated by the inverse distance weight interpolation method. The surface of the tailings dam is divided into more than 2000 grids, and more than 2000 interpolation data are obtained, realizing point-to-area coverage (Figure 12A).
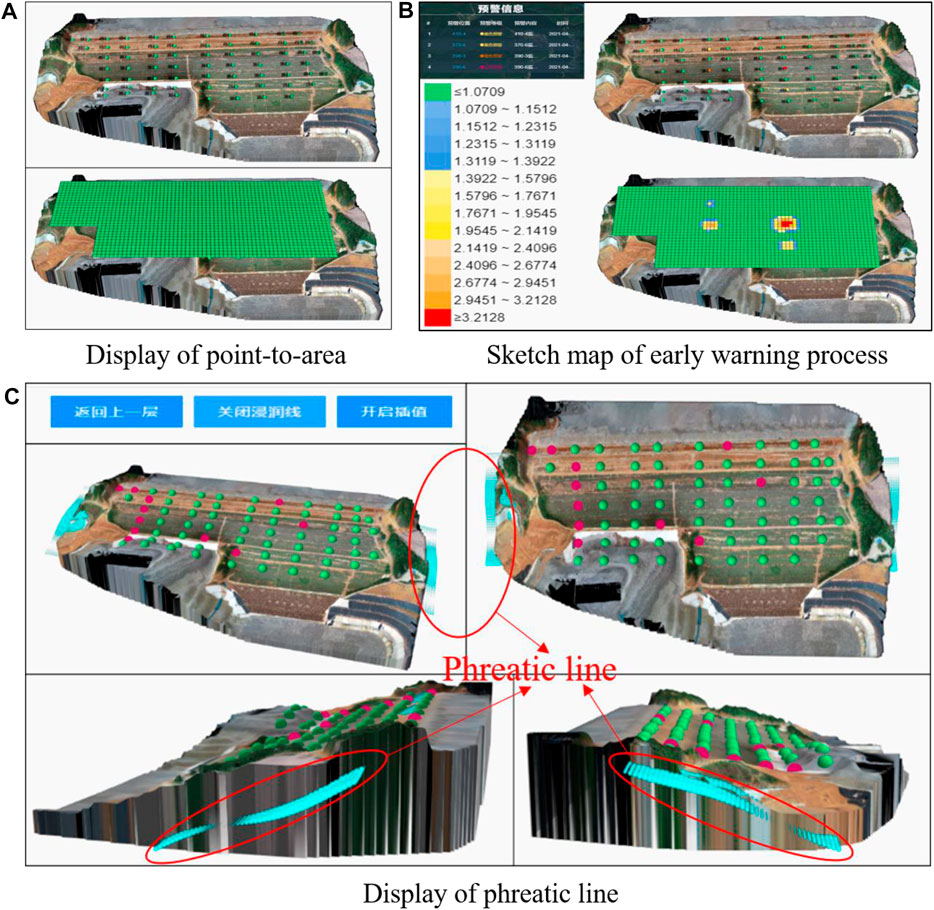
FIGURE 12. 3D visualization module (A: Visual display of point-to-area; B: Visual display of early warning information; C: Visual display of phreatic line).
3.2.5.2 Early Warning Visualization
Using the 2-year historical monitoring data of the tailing dam deformation, the normal operation value of the tailing dam can be calculated to obtain the threshold of each level of early warning. Once there is real-time monitoring data over the threshold, the early warning system begins to work (Figure 12B).
3.2.5.3 Phreatic Line Visualization
According to the data collected by the phreatic line sensor, the three.js tool is used and combined with the parabola principle to show the dynamic effect of water surface fluctuation at the front end (Figure 12C).
4 Discussion
Compared with other existing systems, such as DAMSAT (Lumbroso et al., 2021), the proposed system has richer functions, stronger prediction and early warning ability, and more timely response. The establishment of the three-dimensional model and visual display can provide more intuitive and effective decision support for decision makers. Currently, some mainstream systems are shown in Table 3. In the table, the systems are evaluated by eight indicators. The performance levels of each indicator from low to high are average, good, and great, respectively. A monitoring system based on Micro-UAV (Torrero et al., 2015) only uses Micro-UAV monitoring, no other monitoring methods, and no prediction function. The Monitoring and early warning system based on aperture radar (Xu, 2021) can accurately analyze the surface change, but it does not have the ability of prediction and comprehensive analysis. The online safety monitoring system for tailing ponds (Bai, 2020) can manage and comprehensively analyze data, but it does not have the ability of prediction and 3D visualization, and the display effect is not good. The safety management system of tailing pond based on UAV intelligent cruise (Liao et al., 2021) also does not have the ability of comprehensive analysis and prediction of data. The mine geological disaster monitoring and early warning system based on Lora Technology (Zhu et al., 2021) reduces the time delay of the system, but the system function is relatively single, and the functions of 3D visualization and prediction are lacking. The currently proposed system is fully functional. The system designed in this research has the following advantages: 1) Comprehensive management capability. The system can comprehensively manage and analyze various types of monitoring data. 2) Strong forecasting and early warning function. The system is equipped with the prediction module and early warning module, which can monitor and warn the monitoring area in real time. The combination of the prediction module and early warning module can provide a more accurate safety assessment. 3) Strong visualization ability. The system includes the visualization of monitoring data, three-dimensional model, monitoring station, and early warning information. It is not only a digital display but also is combined with a three-dimensional model, which is more visual and intuitive.
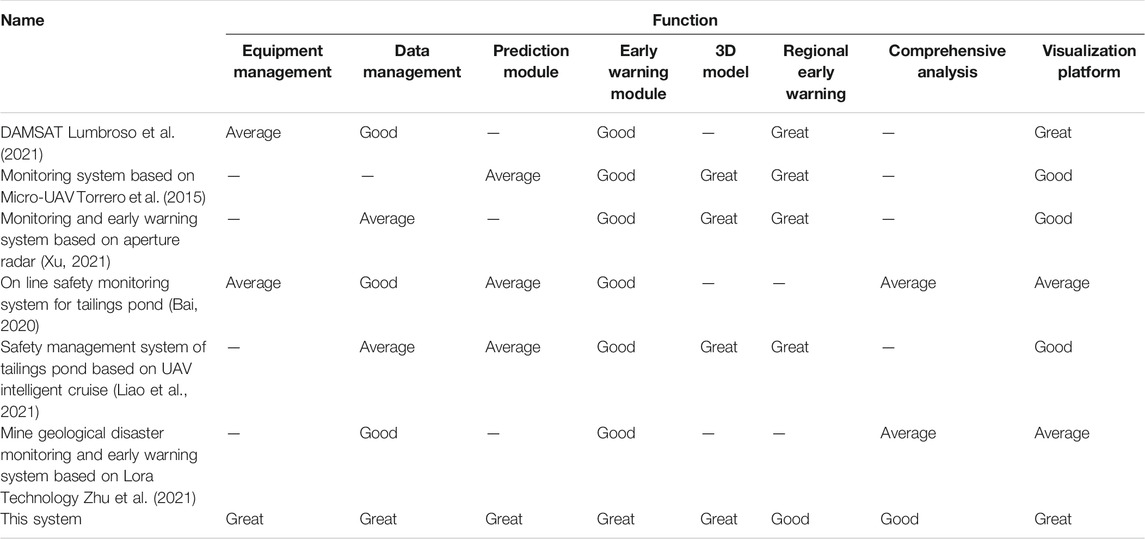
TABLE 3. Function of some existing systems.
The system has some advantages. It also has room for progress. First, in the data acquisition and transmission mode of this system, the system uses the wireless transmission mode of sensor equipment by default. According to the current research, there are many data transmission methods, such as the wireless network and GPRS network (Li et al., 2021b). The development of this system is not compared with several other different transmission modes. Therefore, it is unknown which transmission method is more effective. Second, the design and development of this system are based on some existing data, such as data type, number, and location of sensors. These data cannot be changed, so the accuracy of different sensors and the economic efficiency of sensor placement are not considered (Clarkson and Williams, 2021b; Clarkson et al., 2021). Then in terms of data processing, this paper adopts the ARIMA and cloud model methods (Li H. et al., 2020). In the current research, there are a variety of data processing methods, such as normal distribution curve, random forest, and numerical simulation (Li S. et al., 2020, 2021c; Shi et al., 2020). Each method has its own advantages. For different actual situations, the application of each method is also different. Finally, in terms of visualization, the interpolation rendering and 3D rendering of the system adopt the three.js tool (Li, 2021), which has strong display ability and weak computing ability. When a large amount of data need to be calculated at the same time, there will be a loading delay in the front-end display. In this regard, a better tool needs to be discovered to realize 3D rendering display. At present, the interpolation interface is meshed and then interpolated. It does not fit the dam and is parallel to the dam. Cesium is also a tool to implement WebGL (Nishioka et al., 2015; Wang et al., 2021). Some scholars also used it for map visualization. In the later improvement, this tool can be tried.
5 Conclusion
This early warning system integrates data acquisition, transmission, storage, processing, analysis, output, and display. It is also a geographic information system containing various geographic elements and a visualization system including table curve display, and two- and three-dimensional model display. The following conclusions can be drawn:
1) The establishment of the three-dimensional visualization model solves the problem of low visualization. It can show the shape of the dam more intuitively than two dimensional. Combined with the abnormal information of monitoring points, it can quickly identify the location information of early warning monitoring points.
2) The system prediction and early warning module is a linkage mode. When the monitoring data is updated, it can respond in time, compared with the warning threshold, and release the early warning information in real time. Through the operation of the prediction model, it can accurately predict the deformation value of the dam in the future, offering a great reference.
3) The interpolation model is introduced into the system to combine point areas to achieve the purpose of regional risk assessment. It solves the problem of point and area early warning, visualizes the risk area, obtains a more intuitive effect, and gives a better decision support.
4) The system integrates data management, equipment management, interpolation, prediction, early warning, two- and three-dimensional visualization modules, and adopts the technical framework of cloud edge end cooperation to solve the problems of isolation of multiple monitoring systems and the “data island” phenomenon. The novel system can work reliably for a long time without cumulative errors.
Data Availability Statement
The data analyzed in this study is subject to the following licenses/restrictions: Only by obtaining the permission of Zijin Mining Company Limited. Requests to access these datasets should be directed to RL, ODI2NzE3NjQ0QHFxLmNvbQ==.
Author Contributions
WN directed and revised the writing content of the paper. ML completed the writing of the paper, the design and construction of the system, and the data processing model. YW directed the writing of the paper. RL provided the data for the whole system. All authors contributed to the article and approved the submitted version.
Funding
This research was supported by the Major Science and Technology Projects of Anhui Province (Nos. 201903a07020008 and 202003a0702002) and the Technology Development Project of Zijin Mining Company Limited (No. FW-2020-00091).
Conflict of Interest
Authors WN and YW were employed by Sinosteel Maanshan General Institute of Mining Research Company Limited, and RL was employed by the company Zijin Mining Company Limited.
The remaining authors declare that the research was conducted in the absence of any commercial or financial relationships that could be construed as a potential conflict of interest.
Publisher’s Note
All claims expressed in this article are solely those of the authors and do not necessarily represent those of their affiliated organizations, or those of the publisher, the editors, and the reviewers. Any product that may be evaluated in this article, or claim that may be made by its manufacturer, is not guaranteed nor endorsed by the publisher.
Acknowledgments
We gratefully acknowledge the funding provided by the Major Science and Technology Projects of Anhui Province and the Technology Development Project of Zijin Mining Company Limited. We would also like to thank the handling editor and reviewers whose valuable and constructive comments greatly improved this article.
References
Aggarwal, A., Alshehri, M., Kumar, M., Alfarraj, O., Sharma, P., and Pardasani, K. R. (2020). Landslide Data Analysis Using Various Time-Series Forecasting Models. Comput. Electr. Eng. 88, 106858. doi:10.1016/j.compeleceng.2020.106858
Al Faisal, A., Al Kafy, A., and Roy, S. (2018). Integration of Remote Sensing and GIS Techniques for Flood Monitoring and Damage Assessment: A Case Study of Naogaon District, Bangladesh. J. Remote Sensing GIS 07. doi:10.4172/2469-4134.1000236
Al-Zahrani, M. A., and Abo-Monasar, A. (2015). Urban Residential Water Demand Prediction Based on Artificial Neural Networks and Time Series Models. Water Resour. Manage. 29, 3651–3662. doi:10.1007/s11269-015-1021-z
Ayhan, M. E., and Almuslmani, B. (2021). Positional Accuracy and Convergence Time Assessment of GPS Precise point Positioning in Static Mode. Arab. J. Geosci. 14, 1263. doi:10.1007/s12517-021-07428-1
Bai, Y. (2020). Application of On-Line Safety Monitoring System in Tailings Pond (In Chinese). China Metal Bulletin, 65
Bo, G., and Shan, J. (2018). Design of Early Warning System Based on Wireless Sensor Network. Int. J. Onl. Eng. 14, 66. doi:10.3991/ijoe.v14i01.8060
Cahyono, A. B., Budisusanto, Y., and Hidayat, H. (2021). Geovisualization of 3D Modeling Representation of Topographic Relief Based on Open Source GIS. IOP Conf. Ser. Earth Environ. Sci. 731, 012023. doi:10.1088/1755-1315/731/1/012023
Clarkson, L., and Williams, D. (2021a). An Overview of Conventional Tailings Dam Geotechnical Failure Mechanisms. Mining, Metall. Exploration 38, 1305–1328. doi:10.1007/s42461-021-00381-3
Clarkson, L., and Williams, D. (2021b). Catalogue of Example Instrumentation and Monitoring Systems for Tailings Dams in Australia. Mining Techn. 130, 1–11. doi:10.1080/25726668.2021.1901026
Clarkson, L., Williams, D., and Seppälä, J. (2021). Real-time Monitoring of Tailings Dams. Georisk: Assess. Manag. Risk Engineered Syst. Geohazards 15, 113–127. doi:10.1080/17499518.2020.1740280
Del Rio-Salas, R., Ayala-Ramírez, Y., Loredo-Portales, R., Romero, F., Molina-Freaner, F., Minjarez-Osorio, C., et al. (2019). Mineralogy and Geochemistry of Rural Road Dust and Nearby Mine Tailings: A Case of Ignored Pollution Hazard from an Abandoned Mining Site in Semi-arid Zone. Nat. Resour. Res. 28, 1485–1503. doi:10.1007/s11053-019-09472-x
Du, J., Chen, J., Pu, Y., Jiang, D., Chen, L., and Zhang, Y. (2021). Risk Assessment of Dynamic Disasters in Deep Coal Mines Based on Multi-Source, Multi-Parameter Indexes, and Engineering Application. Process Saf. Environ. Prot. 155, 575–586. doi:10.1016/j.psep.2021.09.034
Erbao, X., Yan, L., Mingshun, Y., and Xi, C. (2019). “Design of Intelligent Monitoring System for Power Distribution Equipment Based on Cloud Edge Collaborative Computing,” in Proceedings of the 2019 International Conference on Precision Machining, Non-traditional Machining and Intelligent Manufacturing (PNTIM 2019) (Xi’an, China: Atlantis Press). doi:10.2991/pntim-19.2019.3
Gamperl, M., Singer, J., and Thuro, K. (2021). Internet of Things Geosensor Network for Cost-Effective Landslide Early Warning Systems. Sensors 21, 2609. doi:10.3390/s21082609
Hu, Z.-N., Li, G.-Q., and Hu, N.-L. (2016). Research on Catastrophe Risk Financing Mode for Tailings Pond Dam Break. dtem. doi:10.12783/dtem/iceme-ebm2016/4161
Jiang, L., Sun, H., Peng, T., Ding, W., Liu, B., and Liu, Q. (2021). Comprehensive Evaluation of Environmental Availability, Pollution Level and Leaching Heavy Metals Behavior in Non-ferrous Metal Tailings. J. Environ. Manage. 290, 112639. doi:10.1016/j.jenvman.2021.112639
Kanakaraja, P., Aswin Kumer, S. V., Kotamraju, S. K., Jhansi Lakshmi, M., Irfan, S., and Chandra Lekha, U. (2021). Environment Quality Monitoring System Based on Cloud Computing Analysis. Mater. Today Proc. 46, 3864–3870. doi:10.1016/j.matpr.2021.02.332
Kong, N. (2017). Getting to Know Web GIS. Cartographic J. 54, 188–189. doi:10.1080/00087041.2017.1307041
Li, D. (2021). Application of Webgl Technology in Web Graphics Based on Three.Js (In Chinese). J. Inner Mongolia Agric. Univ. (Natural Sci. Edition) 42, 99–103. doi:10.16853/j.cnki.1009-3575.2021.02.019
Li, H., Li, Z., Ma, F., and Liu, C. (2020a). Similarity Analysis of Dam Behavior Characterized by Multi-Monitoring Points Based on Cloud Model. Int. J. Distributed Sensor Networks 16, 155014772092022. doi:10.1177/1550147720920226
Li, N., Li, C., Chu, W., Xiao, K., Tao, W., Song, X., et al. (2021a). Uncertainty Visualisation of a 3D Geological Geometry Model and its Application in GIS-Based Mineral Resource Assessment: A Case Study in Huayuan District, Northwestern Hunan Province, China. J. Earth Sci. 32, 358–369. doi:10.1007/s12583-021-1434-y
Li, S., Yuan, L., Yang, H., An, H., and Wang, G. (2020b). Tailings Dam Safety Monitoring and Early Warning Based on Spatial Evolution Process of Mud-Sand Flow. Saf. Sci. 124, 104579. doi:10.1016/j.ssci.2019.104579
Li, X., Li, J., Liu, C., and Chen, C. (2021b). Safety Monitoring System Based on Internet of Things Tailings Dam. Ifs 40, 3005–3014. doi:10.3233/JIFS-189339
Li, X., Wen, Z., and Su, H. (2021c). An Approach Using Random forest Intelligent Algorithm to Construct a Monitoring Model for Dam Safety. Eng. Comput. 37, 39–56. doi:10.1007/s00366-019-00806-0
Liao, W., Zhu, Y., and Wang, Q. (2021). Research on Safety Management System of Tailings Pond Based on UAV Intelligent Cruise (In Chinese). Mining Res. Develop. 41, 165–170. doi:10.13827/j.cnki.kyyk.2021.09.031
Liu, Z.-N., Yu, X.-Y., Jia, L.-F., Wang, Y.-S., Song, Y.-C., and Meng, H.-D. (2021). The Influence of Distance Weight on the Inverse Distance Weighted Method for Ore-Grade Estimation. Sci. Rep. 11, 2689. doi:10.1038/s41598-021-82227-y
Lumbroso, D., Collell, M. R., Petkovsek, G., Davison, M., Liu, Y., Goff, C., et al. (2021). DAMSAT: An Eye in the Sky for Monitoring Tailings Dams. Mine Water Environ. 40, 113–127. doi:10.1007/s10230-020-00727-1
Luo, G., Han, Z., Xiong, J., He, Y., Liao, J., and Wu, P. (2021). Heavy Metal Pollution and Ecological Risk Assessment of Tailings in the Qinglong Dachang Antimony Mine, China. Environ. Sci. Pollut. Res. 28, 33491–33504. doi:10.1007/s11356-021-12987-7
Ma, Q., Liu, S., Fan, X., Chai, C., Wang, Y., and Yang, K. (2020). A Time Series Prediction Model of Foundation Pit Deformation Based on Empirical Wavelet Transform and NARX Network. Mathematics 8, 1535. doi:10.3390/math8091535
Meng, X. (2019). Research on Monitoring and Early Warning System of Tailings Dam Deformation Based on Wireless Sensor Network. Beijing, China: China Metal Bulletin, 6.
Nishioka, Y., Shiroki, M., and Takizawa, T. (2015). Publishing of New Seamless Geological Map 3D in Japan Using WebGL. Annu. Meet. Geol. Soc. Jpn. 061. doi:10.14863/geosocabst.2015.0_061
Ouyang, J., Liu, Z., Ye, T., and Zhang, L. (2019). Uranium Pollution Status and Speciation Analysis in the farmland-rice System Around a Uranium Tailings Mine in southeastern China. J. Radioanal. Nucl. Chem. 322, 1011–1022. doi:10.1007/s10967-019-06783-4
Padsala, R., Gebetsroither-Geringer, E., Peters-Anders, J., and Coors, V. (2021). Inception of Harmonising Data Silos and Urban Simulation Tools Using 3d City Models for Sustainable Management of the Urban Food Water and Energy Resources. ISPRS Ann. Photogramm. Remote Sens. Spat. Inf. Sci. VIII-4/W1-2021, 81–88. doi:10.5194/isprs-annals-VIII-4-W1-2021-81-2021
Pirsiavash, A., Broumandan, A., and Lachapelle, G. (2017). Characterization of Signal Quality Monitoring Techniques for Multipath Detection in GNSS Applications. Sensors 17, 1579. doi:10.3390/s17071579
Pu, Y., Apel, D. B., Liu, V., and Mitri, H. (2019). Machine Learning Methods for Rockburst Prediction-State-Of-The-Art Review. Int. J. Mining Sci. Techn. 29, 565–570. doi:10.1016/j.ijmst.2019.06.009
Sarantsev, M. I. (2021). From an Observation System to an Automatic Monitoring System: Engineering-Seismometric and Engineering-Seismological Observations at the Sayano-Shushenskaya HPP. Power Technol. Eng. 54, 771–781. doi:10.1007/s10749-021-01286-3
Shi, Z., Gu, C., Zhao, E., and Xu, B. (2020). A Novel Seepage Safety Monitoring Model of CFRD with Slab Cracks Using Monitoring Data. Math. Probl. Eng. 2020, 1–13. doi:10.1155/2020/1641747
Thatcher, J. (2018). Yes, We Can (Do GIS): a Review of New Lines: Critical GIS and the Trouble of the Map. Int. J. Geographical Inf. Sci. 32, 1272–1274. doi:10.1080/13658816.2018.1440398
Torrero, L., Seoli, L., Molino, A., Giordan, D., Manconi, A., Allasia, P., et al. (2015). “The Use of Micro-UAV to Monitor Active Landslide Scenarios,” in ” in Engineering Geology For Society And Territory - Volume 5. Editors G. Lollino, A. Manconi, F. Guzzetti, M. Culshaw, P. Bobrowsky, and F. Luino (Cham: Springer International Publishing, 701–704. doi:10.1007/978-3-319-09048-1_136
Tsukuma, H. (2019). Exact Finite-Sample Bias and MSE Reduction in a Simple Linear Regression Model with Measurement Error. Jpn. J. Stat. Data Sci. 2, 1–29. doi:10.1007/s42081-018-0025-3
Wang, H. J., and Yong, Z. Q. (2014). A Design of Coal Mine Security Monitoring Substation Based on ZIGBEE and CAN Bus. Amr 971-973, 1033–1036. doi:10.4028/www.scientific.net/AMR.971-973.1033
Wang, L., Xie, M., and Cai, X. (2014). Research on Method of Displacement Speed Ratio for Spatial Evaluation of Landslide Deformation (In Chinese). Rock Soil Mech. 35, 519–528. doi:10.16285/j.rsm.2014.02.019
Wang, M., Dong, Z., Shi, K., and Su, Z. (2021). Exploration of Webgl Technology and Comparison of Several Webgl Based Engines (In Chinese). China Sci. Techn. Inf., 89–90. doi:10.3969/j.issn.1001-8972.2021.05.030
Wang, Y., Xu, Q., Zheng, G., and Zheng, H. (2015). A Rheology Experimental Investigation on Early Warning Model for Landslide Based on Inverse-Velocity Method (In Chinese). Rock Soil Mech. 36, 1606–1614. doi:10.16285/j.rsm.2015.06.011
Wen, J., Yang, J., Jiang, B., Song, H., and Wang, H. (2021). Big Data Driven Marine Environment Information Forecasting: A Time Series Prediction Network. IEEE Trans. Fuzzy Syst. 29, 4–18. doi:10.1109/TFUZZ.2020.3012393
Wenxue, C., Longkang, W., Hui, W., and Zhuwu, Z. (2011). Zigbee-Based Prediction System for Coal Rock Dynamic Disasters. Proced. Eng. 26, 2253–2260. doi:10.1016/j.proeng.2011.11.2432
Xu, Q., and Zeng, Y. (2009). Research on Acceleration Variation Characteristics of Creep Landslide and Early-Warning Prediction Indicator of Critical Sliding (In Chinese). Chin. J. Rock Mech. Eng. 28, 109
Xu, Y. (2021). Application of Slope Stability Radar Monitoring and Early Warning System in a Mine (In Chinese). Mod. Mining 37, 159
Xu, Y., Wei, J., Zhou, X., and Sun, F. (2019). Application and Development of Smart Mine in China. MATEC Web Conf. 295, 02005. doi:10.1051/matecconf/201929502005
Yadav, R. K., and Balakrishnan, M. (2014). Comparative Evaluation of ARIMA and ANFIS for Modeling of Wireless Network Traffic Time Series. J. Wireless Com Netw. 2014, 15. doi:10.1186/1687-1499-2014-15
Yang, P., Wang, N., Jiang, Z., Yang, Y., and Yan, H. (2019). Overview of Slope Monitoring Technology. IOP Conf. Ser. Mater. Sci. Eng. 472, 012009. doi:10.1088/1757-899X/472/1/012009
Zhang, C., Wang, X., Jiang, S., Zhou, M., Li, F., Bi, X., et al. (2021). Heavy Metal Pollution Caused by Cyanide Gold Leaching: a Case Study of Gold Tailings in central China. Environ. Sci. Pollut. Res. 28, 29231–29240. doi:10.1007/s11356-021-12728-w
Zhang, X. (2021). Prediction of Fire Risk Based on Cloud Computing. Alexandria Eng. J. 60, 1537–1544. doi:10.1016/j.aej.2020.11.008
Zheng, N., Chen, P., and Li, Z. (2021). Accuracy Analysis of Ground-Based GNSS-R Sea Level Monitoring Based on Multi GNSS and Multi SNR. Adv. Space Res. 68, 1789–1801. doi:10.1016/j.asr.2021.04.024
Zhou, H., Yuan, Z., Su, J., Yang, X., and Zhang, D. (2015). The Present Situation and Prospects for Safety Online-Monitoring System of Tailings Pond. Shenzhen, China: Shenzhen. doi:10.2991/icmra-15.2015.94
Keywords: tailings dam, 3D geographic information system, cloud-side collaborative technique, monitoring and early warning system, 3D visualization
Citation: Nie W, Luo M, Wang Y and Li R (2022) 3D Visualization Monitoring and Early Warning System of a Tailings Dam—Gold Copper Mine Tailings Dam in Zijinshan, Fujian, China. Front. Earth Sci. 10:800924. doi: 10.3389/feart.2022.800924
Received: 24 October 2021; Accepted: 17 January 2022;
Published: 08 March 2022.
Edited by:
Jie Chen, Chongqing University, ChinaReviewed by:
Chen Qiusong, Central South University, ChinaWei Shao, Nanjing University of Information Science and Technology, China
Yulong Chen, China University of Mining and Technology, China
Copyright © 2022 Nie, Luo, Wang and Li. This is an open-access article distributed under the terms of the Creative Commons Attribution License (CC BY). The use, distribution or reproduction in other forums is permitted, provided the original author(s) and the copyright owner(s) are credited and that the original publication in this journal is cited, in accordance with accepted academic practice. No use, distribution or reproduction is permitted which does not comply with these terms.
*Correspondence: Wen Nie, d2VuLm5pZUB2aXAudG9tLmNvbQ==