- 1Key Laboratory of Deep Coal Resource Mining, Ministry of Education, China University of Mining and Technology, Xuzhou, China
- 2School of Mines, China University of Mining and Technology, Xuzhou, China
- 3School of Energy Resources and Safety, Anhui University of Science and Technology, Huainan, China
- 4Zienkiewicz Centre for Computational Engineering, College of Engineering, Swansea University, Swansea, United Kingdom
Some industrial activities in mines, such as underground coal mining, destress blasting for preventing rockburst, and ground blasting for mining, can cause microseismic occurrence. The microseismic waveform contains abundant information on the hypocenter and propagation path, which is valuable to study the microseismic mechanism and propagation. Therefore, this study adopts the multifractal detrended fluctuation analysis (MF-DFA) and the Hilbert–Huang transform (HHT) method to study the nonlinear and time–frequency–energy characteristics of different types of microseismic waveforms. The microseismic waveform induced by mining and destress blasting has a higher dominant frequency (above 100 Hz) and shorter duration (less than 0.5 s) than ground blasting-induced microseismic waveforms (dominant frequency below 25 Hz and duration more than 3 s). Furthermore, for destress blasting-induced microseismic waveforms, the waveform is characterized by rich spectrum, complex energy attenuation, developed coda wave, and clear multifractal characteristics, which indicate that the waveform is more complex and variable. The complex underground geological environment and the superposition effect of blasting stress and mining stress are the main reasons. Moreover, the propagation distance and source energy of microseismic waveforms also greatly affect waveform characteristics. The results show that the waveform information of destress blasting-induced microseismic waveforms can describe the release process of blasting stress and mining stress. Based on this, a blasting efficiency index Be was proposed to evaluate the effect of pressure relief, and the classification system was developed. Then, the evaluation index was successfully applied to 63 rounds of destress blasting in the Yutian coal mine. The research results can provide a certain reference for some work such as the identification of different microseismic, rock dynamic failure process analysis, and evaluation of the destress blasting effect.
Introduction
Microseismic emission during the rock failure process is a common phenomenon in mines around the world. The elastic vibration wave will be produced in the failure process of rocks under external disturbance (such as blasting, drilling, hydraulic fracturing, and mining), which will propagate in the rock and be recorded by microseismic sensors. In general, most induced microseismic events with small magnitude are unfelt and nondestructive. However, more and more engineering practices have shown that microseismic events with large magnitude occur in mines due to coal mining, fracture of the hard roof, or destress blasting. These large-magnitude microseismic events may cause the destruction of underground structures or even induce the dynamic disaster of rockburst and casualties (Li et al., 2007; Dou et al., 2018; Yin et al., 2020; Cai et al., 2021). For example, in August 2007, a magnitude 3.9 seismic event induced by the coal pillar burst occurred in the Utah coal mine, resulting in casualties (Dreger et al., 2008; Pechmann et al., 2008). Microseismic events induced by hydraulic fracturing for the development of gas and geothermal resources or the massive rupture of underground rock strata are also pervasive in mining countries around the world (Bao and David, 2016; Brudzinski and Kozłowska, 2019; Tan et al., 2020). Destress blasting for preventing rockburst in coal mines also induces large-magnitude microseismic events, which may cause damage to roadway and equipment (Konicek and Waclawik, 2018; Drover and Villaescusa, 2019). Research studies on induced microseismic events have been carried out fruitfully in recent decades. For example, Zhu et al. (2016), He et al. (2017), Cai et al. (2019), and Wojtecki et al. (2021) predicted rockburst based on mining-induced microseismic event parameters (source energy, frequency, and location) in coal mines. They found that the occurrence of a microseismic event is highly correlated with the coal and rock failure processes, and microseismic data can provide valuable information for the prediction of rockburst. Moreover, the microseismic waveform induced by destress blasting was also used to evaluate pressure-relief effects, which can guide the parameter design of destress blasting (Wojtecki and Konicek, 2016; Wen et al., 2020). Therefore, it is essential to study induced microseismic waveforms deeply, which can improve the understanding of the destruction process of large-magnitude microseismic events or the utilization of microseismic data for some useful work.
Microseismic signals can be regarded as the response of rock medium to the dynamic disturbance at the microseismic source, which means it contains rich information of the hypocenter and propagation medium property. Different types of induced microseismic waveforms have different focal mechanisms and propagation characteristics due to different induced factors and propagation medium properties. Amplitude, frequency, and duration are the three basic parameters of microseismic waveforms, which have been concerned by many researchers. In the past few decades, the fast Fourier transform (FFT), short-time Fourier transform (STFT), and wavelet analysis theory have been successively used to study the time–frequency characteristics of natural earthquakes or induced microseismic waveforms (Stockwell et al., 1996; Chen et al., 2002; Mucciarelli et al., 2004; Salajegheh and Heidari 2005; Yin et al., 2018). However, the aforementioned methods have limitations in the analysis of nonlinear and non-stationary waveforms. To overcome this weakness, some new analysis methods, such as the Wigner–Ville distribution, Hilbert–Huang transform, and machine learning, have been developed for analyzing the microseismic waveforms and obtained many encouraging results (Huang et al., 1998; Li and Zheng, 2007; Reynen and Audet, 2017; Shang et al., 2017; Dong et al., 2020). Fan et al. (2017) and Danqing Song et al. (2020) investigated the time–frequency characteristics of the earthquake waveforms and the seismic failure mechanism using the HHT method. Liu and Gao (2020) and Ma et al. (2021) used the HHT method to study tunnel blasting vibration signals. Guangdong Song et al. (2020) used convolutional neural networks and the Stockwell transform to identify microseismic and blasting signals. Dong et al. (2015, 2016) established discriminators for mine seismic events and blasts using the Fisher classifier, naive Bayesian classifier, and logistic regression. In addition, as a powerful tool to describe nonlinear and unstable signals, multifractal analysis has been widely used to study microseismic signals generated during rock fracture. Qiu et al. (2020) and Li et al. (2020b) obtained rock failure signals at different loading stages in the laboratory and analyzed the nonlinear characteristics of signals by multifractal theory. Li et al. (2017, 2021) analyzed the multifractal characteristics of mining and blasting signals and then proposed a discriminant model to distinguish the microseismic events induced by coal mining and blasting. Li et al. (2020a) combined HHT and multifractal methods to analyze the waveform characteristics of three types of induced microseismic waveforms (natural earthquakes, microseismic induced by hydraulic fracturing, and mining activities). Based on the results mentioned before, a foundation for the understanding of the focal mechanism, assessment of seismic damage effects, and identification of different microseismic events was constructed.
Compared to natural earthquakes, due to the diversity of production operations (coal mining, destress measures, and ground blasting) and complex underground geological conditions in coal mines (roadway, gob, geological structure, joint, etc.), the induced microseismic in coal mines is more complex in the focal mechanism and propagation process. However, research on induced microseismic events in coal mines has just been unfolding. At present, there is little literature that makes systematic research on waveform characteristics of induced microseismic and analysis of the influencing factors. Therefore, by taking the Yutian coal mine, Xinjiang province, China, as an example, this study investigated waveform characteristics (time–frequency, attenuation, and nonlinear characteristics) of some typical induced microseismic in coal mines (microseismic induced by coal mining, ground blasting, and destress blasting) through multifractal and HHT methods. Furthermore, the internal relations among waveform characteristics with focal mechanisms, microseismic source energy, and propagation distance were also discussed. Finally, a blasting efficiency index Be was proposed to evaluate the effect of pressure relief, and the classification system was developed. This research is meaningful for further revealing the failure mechanism of microseismic waveforms, distinguishing different types of microseismic events, and evaluating pressure-relief effects of destress blasting.
Data Preparation and Preprocessing
Data Acquisition and Selection
The induced microseismic waveforms were collected in the Yutian coal mine, which locates in the middle west of the Kerjian mining area of Xinjiang province, China. In this coal mine, the coal seam 3-3# with 400–600 m depth and 4.5 m height was mainly mined. By October 2019, longwall panel (LW) 1103 is being mined, LW 1101 and 1102 have been mined, and LW 1104 and 1105 are planned to be mined later (see Figure 1A). There are multiple thick and hard sandstone above the 3-3# coal seam (see Figure 1B). In coal mines, the microseismic signal can be divided into two types according to the source; the first is generated by human production operations, such as blasting for mining and destress measures. The second is induced by mining activities, such as coal-rock failure, strata caving, and fault slip. However, influenced by the propagation medium and environment, the microseismic signal with the same type of source may also show great differences. At this time, the microseismic signals need to be further divided. In this research, three types of induced microseismic waveforms were divided as follows. First, coal and rock mass are destroyed accompanied by the release of accumulated elastic energy during coal mining. At this time, microseismic events are generated and propagated. This type of microseismic event can be named as the mining-induced microseismic event (see Figure 1C). Moreover, LW 1103 suffers from a severe rockburst risk under the thick and hard conglomerate roof during mining, and underground destress blasting was implemented to prevent rockburst. Blasting in rocks will cause elastic vibration of rock around the blasting location, which propagates outward in the form of elastic waves. This type of microseismic event belongs to destress blasting-induced microseismic (see Figure 1D). In addition, there are multiple layers of the shallow coal seam in the Kerjian mining area, and coal seam outcrops are distributed in the Yutian coal mine. It is easy to cause spontaneous combustion in coal seam outcrops, resulting in environmental pollution, resource waste, and threats to personnel safety. Therefore, blasting in coal mine outcrops areas was carried out to remove the coal and avoid its spontaneous combustion (see Figure 1E). Similarly, ground blasting will also produce seismic waves, which are received by underground microseismic sensors and can be recorded as ground blasting-induced microseismic waveforms.
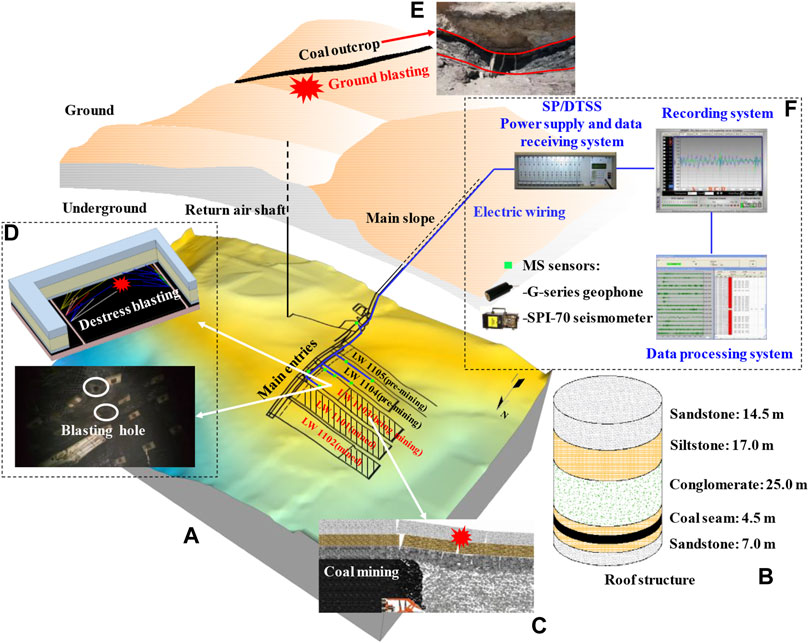
FIGURE 1. Related information of 3-3# coal seam in the Yutian coal mine. (A) 3–3# coal mine floor and layout of longwall panel; (B) roof structure; (C) coal mining and roof breakage; (D) destress blasting in the roof; (E) ground blasting in coal outcrop; and (F) microseismic monitoring system.
Since July 2015, a microseismic monitoring system “ARAMIS M/E” has been installed in the Yutian coal mine. This system includes underground microseismic sensors (G-series geophone and SPI-70 seismometer) and the ground analysis system (power supply and data receiving system, recording system, and data processing system). The underground hardware allows for automatic triggering and recording of various induced microseismic events. The piece of software enables data processing to obtain source location and energy calculation information of microseismic events (see Figure 1F). For destress blasting or ground blasting, the blasting operator will inform the technicians who operated the monitoring system information about the blasting position, time, and type in advance. Then, the corresponding microseismic event will be marked and saved. The waveform received by each microseismic sensor can be recorded and exported. The following study focuses on the microseismic waveform characteristics of different types of induced microseismic waveforms (microseismic induced by coal mining, ground blasting, and destress blasting). Two ground blasting-induced microseismic events (GB-M-1 and GB-M-1), two mining-induced microseismic events (M-M-1 and M-M-2), and four destress blasting-induced microseismic events (DB-M-1, DB-M-2, DB-M-3, and DB-M-4) were selected as research objects. The information of eight induced microseismic events is shown in Table 1.
Figure 2 shows the waveforms of some typical induced microseismic events in Table 1. For all the induced microseismic waveforms, the arrival time of the P wave can be accurately picked. However, limited by the coal mine conditions, both the source rupture scale and the distance between the microseismic sensors and the source are relatively small, resulting in a small-time difference in the arrival of P and S waves to microseismic sensors. Therefore, the exact arrival time pickup of the S wave is a challenging task. The duration of the ground blasting-induced microseismic waveform is generally 3–4 s, which is far longer than that of mining and destress blasting-induced microseismic waveforms (less than 0.5 s). The waveform appearance of the ground blasting-induced microseismic is more clear, simple, and regular. Existing research studies show that microseismic waveforms are related to the magnitude, propagation distance, propagation medium, and sensor property. Due to the existence of underground roadway, gob, and fault structures, the propagation path of microseismic in the underground is more complicated. Moreover, the distance between the source of microseismic induced by mining and destress blasting and the sensor is relatively small (generally 30–500 m), which leads to the microseismic wave being greatly affected by the propagation medium and path. However, the distance between the source of ground blasting-induced microseismic and the sensor is relatively far (more than 1000 m), and the rock structure and properties along the propagation path are more stable and uniform. Therefore, in terms of the propagation medium and path, the microseismic waveforms induced by mining and destress blasting are usually more complicated.
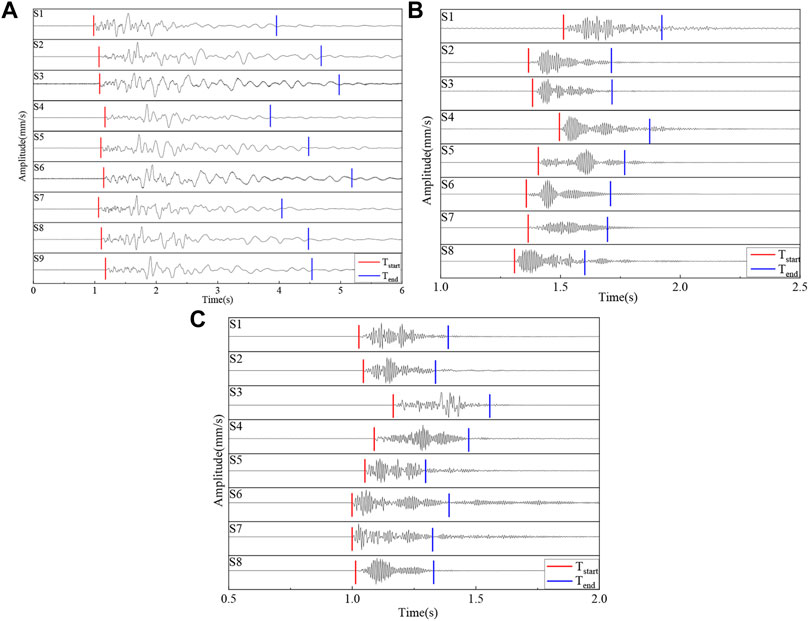
FIGURE 2. Waveforms of different types of induced microseismic waveforms. (A) Ground blasting-induced microseismic (GB-M-1); (B) mining-induced microseismic (M-M-1); and (C) destress blasting-induced microseismic (DB-M-1).
Data Preprocessing
In general, there are lots of machines used for production activities in underground roadways, including the shearer, transport machine, drilling machine, and microseismic monitoring system. These machines are usually powered by alternating current or AC/DC transformers. During the operation of the microseismic monitoring system, it is inevitable to be interfered by the power frequency of the aforementioned machines, which leads to the distortion of microseismic signals. For instance, a waveform recorded by one of the sensors in the microseismic induced by underground destress blasting is shown in Figure 3A. There are noise signals with fixed amplitude in the original waveform. FFT was performed on the original signal. The result shows that there is an interference signal with a frequency of 50 Hz (Figure 3B). Therefore, the noise signals in the microseismic waveforms need to be filtered out before the formal analysis. This study used the complete EEMD with adaptive noise (CEEMDAN) and the wavelet packet threshold de-noising method to de-noise. The signal de-noising steps are as follows (Wang et al., 2021; Zhao et al., 2021). The method first uses the CEEMDAN method to decompose the original signal and obtain the finite number of modal components. Then, the correlation coefficient between the modal component and the original signal is calculated. Next, the modal components with high correlation are retained, and the modal components with low correlation are removed. The retained modal components are reconstructed to obtain a new signal. Finally, the wavelet packet threshold method was used to perform noise reduction on the reconstructed signal. The waveform and frequency spectrum of the de-noised signal by the aforementioned method are shown in Figures 3C,D, respectively. The results show the interference signals have been removed, and the main characteristics of the original signal are retained.
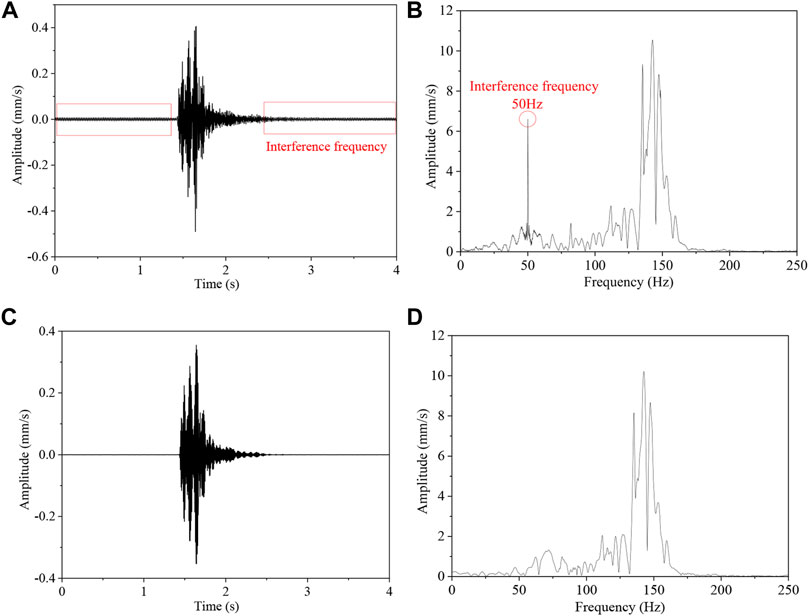
FIGURE 3. Waveform and frequency spectrum of original and de-noising waveform. (A) Original waveform; (B) frequency spectrum of the original waveform; (C) de-noising waveform; and (D) frequency spectrum of the de-noising waveform.
Time–Frequency–Energy and Multifractal Characteristics of Waveforms
Hilbert–Huang Transform Theory
The microseismic signals are typically nonlinear and non-stationary random signals, which have the characteristics of instantaneousness and fast mutation, so it is particularly important to analyze the local characteristics of the microseismic signal. HHT is a time–frequency local analytical method suitable for nonlinear and unstable signals. The HHT method first uses EMD to decompose a complex signal into finite inherent mode functions (IMF), and then performs the Hilbert transform on the decomposed IMF components to obtain the time–frequency distribution. The calculation steps of the EMD and Hilbert transform algorithm are as follows (Huang et al., 1998; Peng et al., 2005; Li et al., 2016).
All the maximum and minimum points of signal time–velocity curve X(t) are found first, and then, the upper and lower envelopments of the original sequence are fitted using the cubic spline function. Second, a new sequence h1(t) can be created by subtracting the mean of the upper and lower envelopments m1(t) from X(t):
The IMF must meet the following two conditions: first, the extreme point of the signal is equal to the number of zero-crossing points or at most one difference, and second, the average value between the upper and lower envelopes defined by the local extreme points is zero. If h1(t) satisfies the aforementioned two conditions, then h1(t) is an IMF. Otherwise, repeat the screening process k times until the h1k(t) becomes a certain IMF:
The first eigenmode function component c1 is obtained, which represents the highest frequency of the data sequence X(t).
A new data sequence r1(t) can be constructed by subtracting c1 from X(t):
r1(t) has performed the aforementioned decomposition to obtain the second eigenmode function component c2, and this process is repeated until the last data sequence rn cannot be decomposed. At this time, rn represents the trend of the data sequence X(t).
Multiple IMF components are obtained by EMD decomposition of signal X(t), and each IMF component is subjected to the Hilbert transform:
where PV denotes the Cauchy principal value and then constructs the analytical signal Z(t):
The instantaneous frequency is defined as follows:
The Hilbert spectrum can be calculated as follows:
The Hilbert marginal energy spectrum E(ω) and Hilbert instantaneous energy spectrum IE(t) can be obtained by integrating the square of H (ω, t) in the time and frequency domain, respectively.
Multifractal Detrended Fluctuation Analysis Method
Fractal theory, first proposed by Mandelbrot, is an effective tool to describe unstable and complex signals. Fractal establishes the relationship between the local-scale characteristics and global characteristics of signals. Multifractal analysis has been applied to study the nonlinear characteristics of natural earthquakes and induced microseismic signals. However, the current multifractal analysis based on the partition function method is not enough to highlight the local singularity feature of non-stationary signals. Kantelhardt et al. (2002) proposed the MF-DFA method, which can effectively analyze the multifractal property of non-stationary signals. Xu et al. (2011) and Fu et al. (2020) introduced the MF-DFA method into the analysis of blasting signal and rock failure signals. This research used the MF-DFA method to analyze the nonlinear characteristics of different types of induced microseismic signals.
The induced microseismic signals are one-dimensional time series. For a nonlinear and non-stationary microseismic signal xk with length N, the steps of the MF-DFA method are as follows (Telesca et al., 2004):
1) Removing the mean value of xk and constructing a sum sequence.
2) Dividing y(i) into Ns non-overlapping segments with length s. Because the signal data length N is usually not a multiple of s, the remainder segment of data is unusable. Therefore, the same division is performed for the reverse sequence of the signal, and the 2Ns segment is obtained.
3) Using the least square method to local trends on each subinterval v (v = 1, ..., 2Ns). Then, the variance of each segment is calculated after removing the fluctuation trend.
4) Calculating the average value of fluctuation function with q-order.
5) If the microseismic signal xk has self-similar characteristics, there is an exponential relationship between F (q, s) and s.
where h(q) is the generalized Hurst exponent. If the microseismic signal xk is a multifractal time series, h(q) will change with q.
6) The multifractal scaling exponent τ(q) can be calculated based on h(q).
Two parameters describing multifractals can be obtained by the Legendre transformation.
Multifractal spectral width ∆α (∆α = αmax − αmin) can describe the unevenness degree of microseismic waveforms. The greater the value, the more severe is the fluctuation of the microseismic waveform. Otherwise, the microseismic waveform fluctuates stably. ∆f(α) = f(αmax) − f(αmin) represents the ratio of large and small peaks in the microseismic waveform. When Δf(α) < 0, the large amplitude occupies a higher proportion, and when Δf(α) > 0, the proportion of small amplitude is higher.
To prove microseismic waveforms can be studied using the MF-DFA method, one of the waveforms in the GB-M-1 microseismic event was analyzed. The MF-DFA results of the microseismic waveform are shown in Figure 4. The q-order fluctuation function F(q, s) has a power-law relationship with time scale s, which indicates that the time series of the microseismic waveform has scale invariance in a certain scale or has fractal characteristics. Moreover, the q-order Hurst exponent is a decreasing function, that is, h(q) varies with q. The curve of the q-order mass exponent shows a concave shape, and the relationship between τ(q) and q is nonlinear. Therefore, the time series of the microseismic waveform not only has scale invariance but also has multifractal characteristics. In the multifractal spectrum, the opening width of the curve represents the degree of inhomogeneity of the microseismic waveform, and the curve shape (left hook and right hook) can reflect the proportion of small and large amplitude.
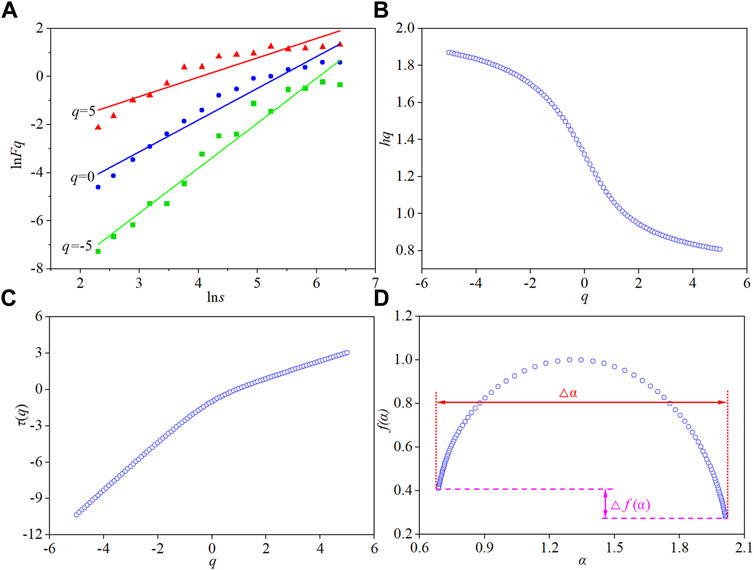
FIGURE 4. MF-DFA results of the microseismic waveform. (A) Relationship between ln s and ln Fq; (B) q-order Hurst exponent; (C) q-order mass exponent; and (D) multifractal spectrum.
Time–Frequency–Energy and Multifractal Characteristics of Microseismic Waveforms
For any induced microseismic, the vibration intensity decreases with the increase of the propagation distance, and its effect on the near-field area is the objective for researchers. In addition, the influence of the underground complex environment (roadway, gob, geological structure, and joint) on vibration propagation should be avoided as far as possible. Therefore, the waveforms received from microseismic sensors close to the source in each induced microseismic event are selected in Table 1. The Hilbert spectrum and multifractal spectrum of the selected waveforms were obtained using HHT and MF-DFA methods. Figure 5 shows the original waveform 1), Hilbert spectrum 2), marginal energy spectrum 3), instantaneous energy spectrum 4), and multifractal spectrum 5) of different induced microseismic waveforms.
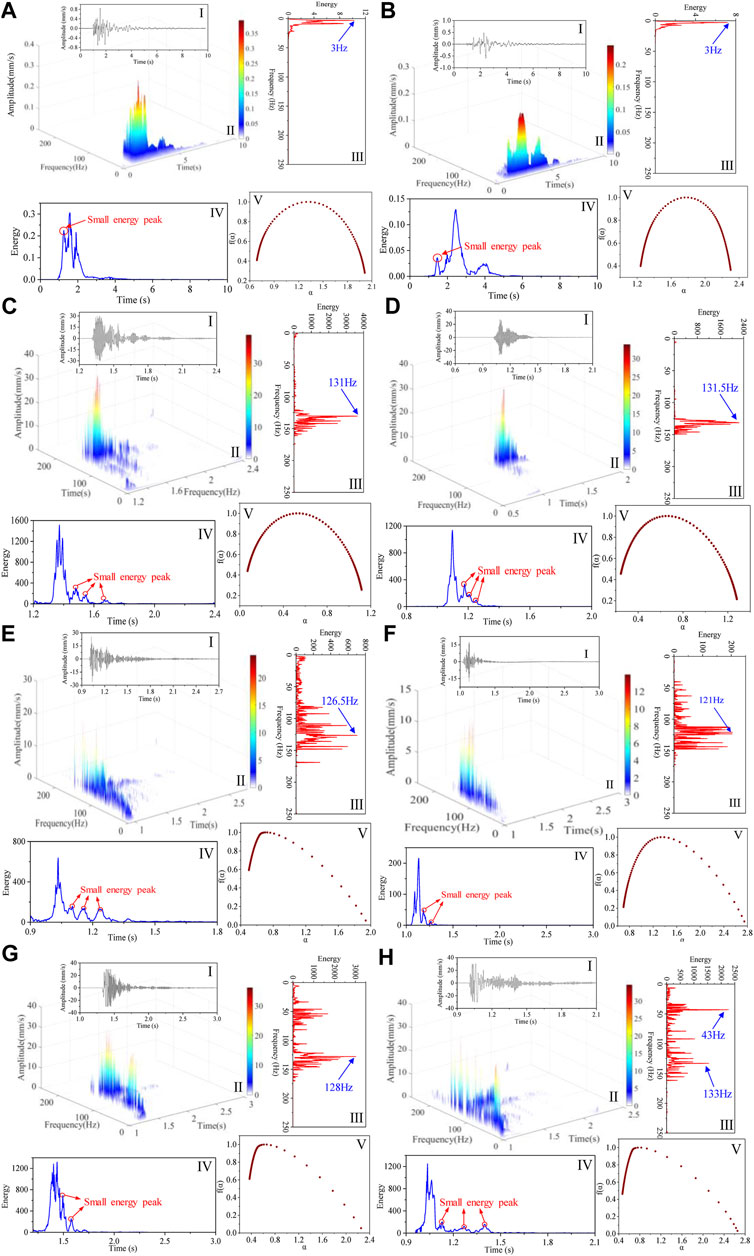
FIGURE 5. Hilbert spectrum and multifractal spectra f(α)-α of different induced microseismic waveforms (A) GB-M-1; (B) GB-M-2; (C) M-M-1; (D) M-M-2; (E) DB-M-1; (F) DB-M-2; (G) DB-M-3; and (H) DB-M-4.
First, the frequency characteristic of different types of the induced microseismic waveforms was analyzed. The frequency distribution range of the ground blasting-induced microseismic waveform is 0–25 Hz, and the dominant frequency of the GB-M-1 and GB-M-2 waveform is 3 Hz. However, the dominant frequency of mining-induced microseismic waveform (M-M-1 and M-M-2) is 131 and 131.5 Hz, respectively, while those of destress blast-induced microseismic waveform (DB-M-1, DB-M-2, DB-M-3, and DB-M-4) is 126.5 Hz, 121 Hz, 128 Hz, and 43 Hz, respectively. For the DB-M-4 waveform, the first dominant frequency is 43 Hz, but the high-frequency components account for a large proportion, and the second dominant frequency is 133 Hz. Therefore, the dominant frequency of mining and destress blasting-induced microseismic waveform is much higher than that of the ground blasting-induced microseismic waveform. Moreover, the dominant frequency difference between the mining and destress blasting- induced microseismic waveform is small, but there are great differences in the marginal energy spectrum. The frequency band of the mining-induced microseismic waveform is narrow, ranging from 120 to 160 Hz, which accounts for almost all the signal energy. The marginal energy spectrum is relatively concentrated and follows the unimodal distribution. However, the frequency band of destress blasting-induced microseismic waveforms is relatively wide, ranging from 1 to 160 Hz. Compared with mining-induced microseismic waveform, the proportion of low-frequency components increases significantly, and multiple peaks appear in the marginal energy spectrum. There is even no absolute dominant frequency in the DB-M-2 waveform. The aforementioned results indicate that the three types of induced microseismic waveforms are significantly different in frequency characteristics. Generally speaking, the frequency characteristic of the destress blasting-induced microseismic waveform is more complex than the other two types of induced microseismic waveforms.
From the instantaneous energy spectrum of the ground blasting-induced microseismic waveform, it can be seen that there is a relatively small energy peak before the energy reaches the maximum. The instantaneous energy gradually attenuates and stabilizes after reaching the maximum, and the coda is not developed. The results suggest that the rise and fall process of the instantaneous energy of ground blasting-induced microseismic waveforms is relatively regular. However, for the instantaneous energy spectrum of mining and destress blasting-induced microseismic waveforms, the energy generally rises to the maximum instantly without large fluctuation. The instantaneous energy attenuation is complicated after the peak, and there are multiple energy peaks and relatively developed coda. In particular, the microseismic waveform induced by underground destress blasting is more prominent in the complexity of the instantaneous energy spectrum.
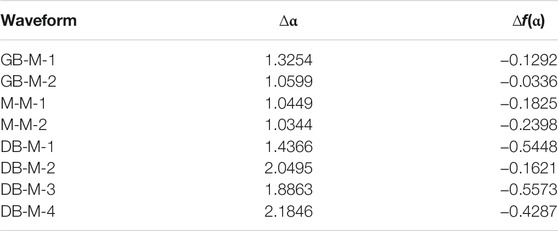
As can be seen from Figure 5V, the multifractal spectrum of ground blasting-induced microseismic waveform is in approximately symmetrical distribution, while that of mining and destress blasting-induced microseismic waveform shows a slightly left hook shape and a significant left hook shape, respectively. The multifractal parameters of ∆α and ∆f(α) of all the selected waveforms are calculated and listed in Table 2. We can see that the parameter ∆α of destress blasting-induced microseismic waveforms is higher than that of ground blasting and mining-induced microseismic waveforms. In particular, the waveform amplitude of some microseismic induced by mining is very close to that induced by underground destress blasting, but there is a large difference in parameter ∆α. For example, the amplitude of M-M-1, M-M-2, DB-M-3, and DB-M-4 waveform is close to 30 mm/s, but the parameters ∆α of M-M-1 and M-M-2 waveforms is only about 1.0, while the parameter ∆α of DB-M-3 and DB-M-4 waveforms is 1.8863 and 2.1846, respectively. According to the physical meaning of ∆α discussed before, the relative fluctuation of microseismic waveform induced by underground destress blasting is more violent, and the multifractal characteristic is more prominent. However, for the waveform of mining-induced microseismic, because the waveform fluctuation is not violent, the multifractal feature is not evident even though its amplitude is large, which indicated the waveform amplitude attenuation is relatively regular. Moreover, the parameters ∆f(α) of the ground blasting-induced microseismic waveforms are close to 0, indicating that the proportion of small and large peaks in the waveform is approximately equal, that is, the waveform is relatively stable. For the waveform of microseismic induced by mining and destress blasting, the parameter ∆f(α) of the waveform is less than 0, indicating the large peak accounts for a larger proportion. The ∆f(α) of microseismic waveforms induced by underground destress blasting is much smaller than that induced by mining, which further proves that its relative fluctuation is more violent.
By comparing and analyzing the Hilbert spectrum and multifractal spectrum of three types of induced microseismic waveforms, there is a large difference in frequency, energy attenuation, and multifractal characteristics. In particular, the magnitude, propagation distance, and medium of microseismic induced by mining and destress blasting are very close, but both the Hilbert spectrum and multifractal spectrum are quite different. Generally speaking, the microseismic waveforms induced by underground destress blasting are more complex and variable. All induced microseismic events in the coal mine are elastic waves caused by rock deformation and fracture under external disturbance. Therefore, the external disturbance characteristics are the decisive factors affecting the waveform characteristics. For ground blasting, most explosion energy is consumed to destroy the coal and rock, and small partial energy is released in the form of seismic waves and received by underground microseismic sensors, that is, ground blasting-induced microseismic. During coal mining, rock deformation and failure under the mining stress will induce microseismic. As shown in Figure 6, ground blasting-induced microseismic is caused by the blasting stress, while mining-induced microseismic is caused by the mining stress, and both of them are caused by the single external stress. However, for destress blasting-induced microseismic, the cavity and crack are formed near the blasting hole in the rock under the blasting stress. Then, the elastic energy accumulated in the rock will be released on the free surface of the cavity and crack. Therefore, the microseismic is caused by the coupling action of blasting stress and mining stress. Different types of external disturbances have different action mechanisms on the rock, which leads to different microseismic source rupture types. The superposition of the elastic waves induced by the blasting stress and mining stress lead to a complex source rupture type, which means that the destress blasting-induced microseismic waveforms are complex and variable. The complexity of waveform features is mainly manifested by rich frequency spectrum, violent energy fluctuation, and clear multifractal features. The Hilbert spectrum of microseismic waveforms induced by underground destress blasting is further analyzed; we can see that the low-frequency components are concentrated in the early stage of the vibration and significantly decrease in the post-stage. According to the action process of destress blasting on the rock, the blasting stress is first released to destroy the rock and attenuation rapidly, and then, the mining stress begins to be released. Combined with the frequency distribution of the other two types of induced microseismic waveforms, it can be concluded that the low-frequency components are mainly induced by the blasting stress, while the high-frequency components are mainly induced by the instantaneous release of mining stress.
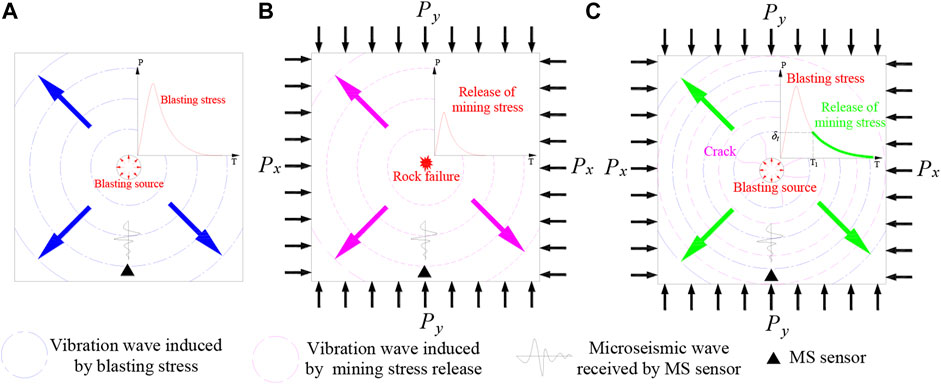
FIGURE 6. External disturbance characteristics of different types of induced microseismic waveforms. (A) Ground blasting-induced microseismic; (B) mining-induced microseismic; and (C) destress blasting-induced microseismic.
Effects of Propagation Distance and Magnitude on Waveform Characteristics
Existing research studies show that waveform characteristics are not only related to the source rupture type and mechanism but also the magnitude and propagation distance, so it is necessary to study the effects of propagation distance and magnitude on waveform characteristics.
Two mining-induced microseismic events (M-M-1 and M-M-2) and two destress blasting-induced microseismic events (DB-M-2 and DB-M-4) were selected to discuss the variation in maximum instantaneous energy and dominant frequency of waveforms with the propagation distance, as shown in Figure 7. We can see that the maximum instantaneous energy of all induced microseismic events decreases nonlinearly with the increase of propagation distance. However, the relationship between the dominant frequency and propagation distance of the two types of induced microseismic waveforms shows an opposite law. With the increase in the propagation distance, the dominant frequency of mining-induced microseismic waveforms decreases, while that of destress blasting-induced microseismic waveforms increases. Moreover, according to the previous analysis, the frequency spectrum of destress blasting-induced microseismic waveforms is rich and complex, and there is even no absolute dominant frequency. Therefore, it is not enough to study the waveform spectrum only by discussing the variation of the dominant frequency. To further study the energy distribution of each frequency band in the waveform, frequency is relatively divided into the low-frequency band (0–100 Hz) and high-frequency band (101–200 Hz). The relationship between the energy ratio of the two frequency bands with the propagation distance is shown in Figures 7C,D. The proportion of the low-frequency band of waveforms decreases gradually, while that of the high-frequency band increases. Actually, for the waveforms recorded by microseismic sensors near the source, the blasting stress is much higher than the mining stress. At this time, the vibration caused by blasting is also stronger than that induced by the mining stress. Therefore, blasting vibration characteristics are dominant in the waveform, resulting in the higher energy proportion of the low-frequency band in the waveform. However, with the increase of the distance between the microseismic senor and the blast source, the blasting stress first attenuates, and blasting vibration weakens. When the mining stress release effect is greater than the blasting stress, the vibration induced by the mining stress will play a dominant role in the waveform, resulting in a decrease in the energy proportion of the low-frequency band, while a relative increase in that of the high-frequency band.
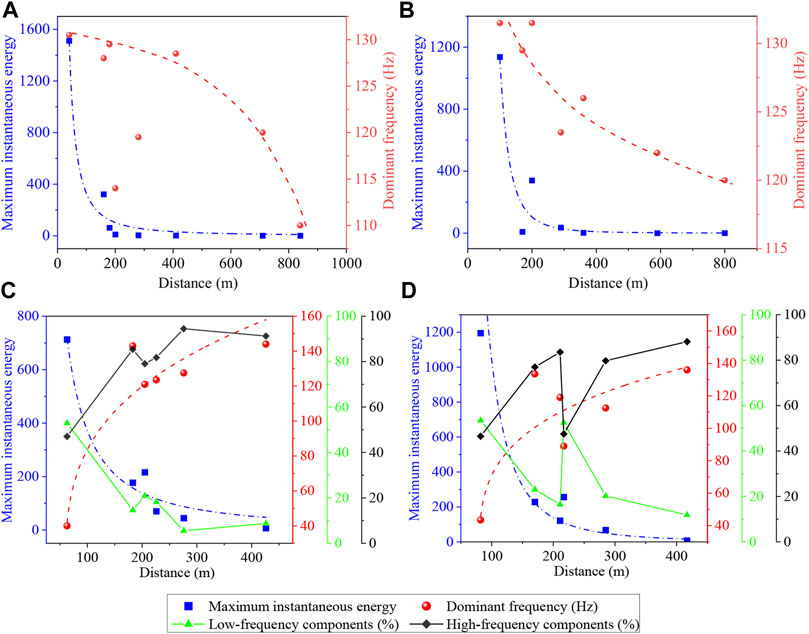
FIGURE 7. Maximum instantaneous energy, frequency, and propagation distance. (A) M-M-1; (B) M-M-2; (C) DB-M-2; and (D) DB-M-4.
To study the influence of source energy on waveform frequency distribution, the dominant frequency and low-frequency components of the two destress blasting-induced microseismic waveforms are compared and analyzed, as shown in Figure 8. According to Table 1, the source energy of the DB-M-4 microseismic event is higher than that of DB-M-2. Generally speaking, the dominant frequencies of DB-M-4 microseismic waveforms are lower than those of DB-M-2, while the proportion of low-frequency components in DB-M-4 microseismic waveform is higher. The results show that with the increase of source energy, the dominant frequency of waveform decreases, and the proportion of low-frequency components increases, which means that the frequency components of waveforms become more abundant. Due to the increase of source energy, the rock damage degree and scope are larger, resulting in more energy in the rock being released. The superposition effect of vibration induced by blasting stress and mining stress is more complex, and the frequency distribution of the waveform is more complex. The aforementioned results show that the waveform characteristics are correlated with the release process of mining stress. For example, the low-frequency components of waveforms can reflect the blasting stress strength, while the high-frequency components can reflect the mining stress release effect, which can provide a reference for the evaluation of the destress blasting effect for preventing rockburst.
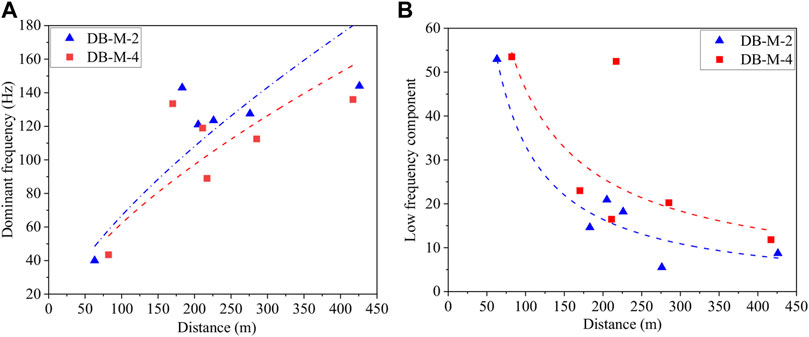
FIGURE 8. Comparison of frequency distribution of DB-M-2 and DB-M-4 microseismic. (A) Dominant frequency; (B) low-frequency components.
Discussion
The underground destress blasting technology is an important method to prevent rockburst. The evaluation of the pressure relief effect is necessary for mine safety production and destress blasting parameter design. The aforementioned results verify that the waveform information of destress blasting-induced microseismic can reflect the release process of blasting stress and mining stress. Therefore, the microseismic source energy consists of explosion energy and rock strain energy, and the amount of energy released by the mining stress can be used to evaluate the effect of pressure relief. Based on the aforementioned analysis, a blasting efficiency index Be was proposed to evaluate the effect of pressure relief, and the classification system was developed. The calculation formula of the Be index is as follows:
where Es is the destress blasting-induced microseismic source energy calculated using the microseismic system, Ep is the seismic energy converted from the explosive chemical energy, and Pe is the explosive charge.
The parameter of Ep can be calculated by Eq. 22.
where Epi is the theoretical chemical energy per kilogram of explosive, and the value of emulsified explosive is 3,200 kJ/kg in this research; ks is blasting seismic energy conversion coefficient.
For the blasting seismic energy conversion coefficient ks, many researchers have studied its value by theoretical analysis, blasting experiments, and empirical methods. However, their results are not unanimous because there are great differences in the properties of explosives and propagation media, the types of microseismic sensor, and energy calculation methods. For example, Sanchidrián et al. (2007) collected 10 production blasts in two ground quarries and analyzed that the seismic energy was 1–3% of the total energy of explosives. Zhang and Guo (1984) found that the blasting seismic energy conversion coefficient of underground mine blasting ranges from 0.00183% to 0.203% using statistical analysis methods. For blasting-induced microseismic events received using the ARAMIS A/E microseismic monitoring system in coal mines, the empirical value of this coefficient is generally 0.01%. In this study, the seismic energy conversion coefficient of blasting was determined using the statistical analysis of 63 destress blasting-induced microseismic data of the Yutian coal mine, which includes the correlation analysis of independent variables, dispersion analysis, and error elimination. As shown in Figure 9, the logarithmic transformation was performed for microseismic source energy and explosive charge, and a linear dependence between the transformed microseismic source energy (log Es) and transformed explosive charge (log Pe) was obtained. The standard deviation of the transformed microseismic source energy (log Es) is 0.70. Data located under the straight line parallel to the regression line and shifted by the standard deviation were then selected. It is assumed that the microseismic source energy of the selected data is only converted from the explosive energy; in other words, the accumulated strain energy in the rock mass is not released in destress blasting. The average ks of the selected dataset was calculated to be 0.015%. Therefore, the blasting seismic energy conversion coefficient ks in this research is 0.015%.
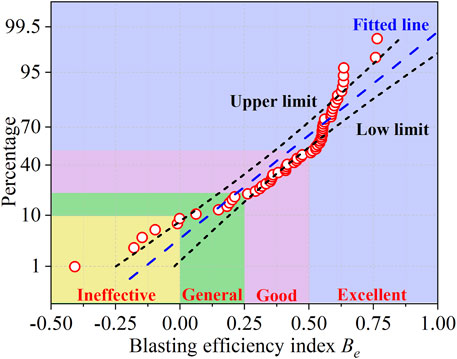
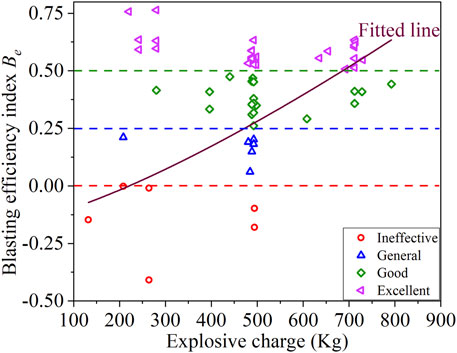
According to Eqs 21, 22, the blasting efficiency index Be for 63 rounds of destress blasting was calculated. The normal probability distribution of the blasting efficiency index (Be) is shown in Figure 10, and a classification system was developed to evaluate Be based on the distribution probabilities of Be, as shown in Table 3. In this classification system, the critical values of blasting efficiency indexes are 0, 0.25, and 0.50, respectively, and the four classification systems are ineffective (Be ≤ 0), general (0 < Be ≤ 0.25), good (0.25 < Be ≤ 0.50), and excellent (Be > 0.50), respectively. Among the 63 rounds of destress blasting, the effect of pressure relief varied from ineffective to excellent, with 51% being excellent and approximately 30% good, while both the ineffective and general are 9.5%. The results show that destress blasting in the Yutian coal mine has achieved good results, which can play a beneficial role in the control of rockburst disasters. Moreover, the relationship between the blasting efficiency index (Be) and explosive charge (Pe) is shown in Figure 11. With the increase of explosive charge, the blasting efficiency index presents an upward trend, indicating that destress blasting with a large explosive charge is more likely to obtain a better pressure relief effect.
Conclusion
By analyzing time–frequency, energy attenuation, and the multifractal spectrum of different types of induced microseismic waveforms, the main conclusions are as follows.
1) Generally, the ground blasting-induced microseismic waveforms have a longer duration (more than 3 s) than the other two types of induced microseismic waveforms (both less than 0.5 s). Both the dominant frequency and band range of microseismic waveforms induced by mining and destress blasting are much higher than those of ground blasting-induced microseismic waveforms. Moreover, there is a large number of low-frequency components distributed in the microseismic waveform induced by destress blasting, which is more abundant in the frequency spectrum than mining-induced microseismic waveforms. The ground blasting-induced microseismic waveforms have regular energy attenuation and undeveloped coda waves. However, for mining and destress blasting-induced microseismic, there are multiple energy peaks in the energy attenuation process and relatively developed coda waves in waveforms. With the increase in the propagation distance, both the dominant frequency and the proportion of high-frequency components of destress blasting-induced microseismic waveforms show a nonlinear upward trend, while those of the mining-induced microseismic waveform are opposite. For destress blasting-induced microseismic waveforms, with the increase of source energy, the dominant frequency decreases, and the proportion of low-frequency components increases.
2) All the induced microseismic waveforms show clear multifractal characteristics. The multifractal parameters ∆α and ∆f(α) of three types of induced microseismic waveforms indicate that ground blasting-induced microseismic waveform fluctuations are relatively stable; the mining-induced microseismic waveforms have a moderate fluctuation, while the destress blasting-induced microseismic waveforms are more violent. The results further prove that destress blasting-induced microseismic waveforms are more complex and changeable.
3) The destress blasting-induced microseismic is induced by the coupling effect of blasting stress and mining stress. The superposition of the elastic waves leads to complex source rupture types. Moreover, the complex underground geological environment also greatly affects the propagation of microseismic waveforms. Therefore, destress blasting-induced microseismic waveforms are clearly different from the other two kinds of microseismic waveforms, which are manifested as rich frequency, complex energy attenuation, and clear multifractal characteristics.
4) A blasting efficiency index Be was proposed to evaluate the effect of pressure relief, and the classification system was developed. For 63 rounds of destress blasting in the Yutian coal mine, the effect of pressure relief varied from ineffective to excellent, with 51% being excellent and approximately 30% good, while both the ineffective and general are 9.5%. Moreover, a large explosive charge is more likely to obtain a better pressure relief effect.
Data Availability Statement
The original contributions presented in the study are included in the article/Supplementary Material, further inquiries can be directed to the corresponding authors.
Author Contributions
Conceptualization: JK, LD, and XL; methodology: JK, and JL; formal analysis and investigation: JK, JB, and MW; validation: JL and JB; writing—review and editing: JK, LD, JL, XL, JB, and MW.
Funding
We gratefully acknowledge the financial support for this work provided by the Postgraduate Research and Practice Innovation Program of Jiangsu Province (Grant No. KYCX21_2378), the National Natural Science Foundation of China (Grant No. 51874292, 51804303), and the Natural Science Foundation of Jiangsu Province, China (Grant No. BK20180643).
Conflict of Interest
The authors declare that the research was conducted in the absence of any commercial or financial relationships that could be construed as a potential conflict of interest.
Publisher’s Note
All claims expressed in this article are solely those of the authors and do not necessarily represent those of their affiliated organizations, or those of the publisher, the editors, and the reviewers. Any product that may be evaluated in this article, or claim that may be made by its manufacturer, is not guaranteed or endorsed by the publisher.
Acknowledgments
The authors thank the members of the Yutian coal mine for their support during the fieldwork.
References
Bao, X., and Eaton, D. W. (2016). Fault Activation by Hydraulic Fracturing in Western Canada. Science 354, 1406–1409. doi:10.1126/science.aag2583
Brudzinski, M. R., and Kozłowska, M. (2019). Seismicity Induced by Hydraulic Fracturing and Wastewater Disposal in the Appalachian Basin, USA: a Review. Acta Geophys. 67, 351–364. doi:10.1007/s11600-019-00249-7
Cai, W., Dou, L., Si, G., Cao, A., Gong, S., Wang, G., et al. (2019). A New Seismic-Based Strain Energy Methodology for Coal Burst Forecasting in Underground Coal Mines. Int. J. Rock Mech. Mining Sci. 123, 104086. doi:10.1016/j.ijrmms.2019.104086
Cai, W., Dou, L., Si, G., and Hu, Y. (2021). Fault-Induced Coal Burst Mechanism under Mining-Induced Static and Dynamic Stresses. Engineering 7, 687–700. doi:10.1016/j.eng.2020.03.017
Chen, J., Wald, D. J., and Helmberger, V. D. (2002). Source Description of the 1999 Hector Mine, California, Earthquake, Part I: Wavelet Domain Inversion Theory and Resolution Analysis. Bull. Seismol. Soc. Am. 92, 1192–1207.
Song, D., Liu, X., Huang, J., and Zhang, J. (2020). Energy-based Analysis of Seismic Failure Mechanism of a Rock Slope with Discontinuities Using Hilbert-Huang Transform and Marginal Spectrum in the Time-Frequency Domain. Landslides 18, 105–123. doi:10.1007/s10346-020-01491-7
Dong, L., Wesseloo, J., Potvin, Y., and Li, X. (2015). Discrimination of Mine Seismic Events and Blasts Using the Fisher Classifier, Naive Bayesian Classifier and Logistic Regression. Rock Mech. Rock Eng. 49, 183–211. doi:10.1007/s00603-015-0733-y
Dong, L.-J., Wesseloo, J., Potvin, Y., and Li, X.-B. (2016). Discriminant Models of Blasts and Seismic Events in Mine Seismology. Int. J. Rock Mech. Mining Sci. 86, 282–291. doi:10.1016/j.ijrmms.2016.04.021
Dong, L.-j., Tang, Z., Li, X.-b., Chen, Y.-c., and Xue, J.-c. (2020). Discrimination of Mining Microseismic Events and Blasts Using Convolutional Neural Networks and Original Waveform. J. Cent. South. Univ. 27, 3078–3089. doi:10.1007/s11771-020-4530-8
Dou, L., Cai, W., Cao, A., and Guo, W. (2018). Comprehensive Early Warning of Rock Burst Utilizing Microseismic Multi-Parameter Indices. Int. J. Mining Sci. Technol. 28, 767–774. doi:10.1016/j.ijmst.2018.08.007
Dreger, D. S., Ford, S. R., and Walter, W. R. (2008). Source Analysis of the Crandall Canyon, Utah, Mine Collapse. Science 321, 217. doi:10.1126/science.1157392
Drover, C., and Villaescusa, E. (2019). A Comparison of Seismic Response to Conventional and Face Destress Blasting during Deep Tunnel Development. J. Rock Mech. Geotech. Eng. 11, 965–978. doi:10.1016/j.jrmge.2019.07.002
Fan, G., Zhang, L.-M., Zhang, J.-J., and Yang, C.-W. (2017). Time-frequency Analysis of Instantaneous Seismic Safety of Bedding Rock Slopes. Soil Dyn. Earthquake Eng. 94, 92–101. doi:10.1016/j.soildyn.2017.01.008
Fu, X. Q., Yang, R. S., Cui, X. Q., Liu, X., Liu, J. F., and Lei, Z. (2020). Multi-fractal Detrended Fluctuation Analysis of the Blasting Vibration Signal in a Frozen Shaft. J. Vib. Shock 39, 51–58. doi:10.13465/j.cnki.jvs.2020.06.008
He, J., Dou, L., Gong, S., Li, J., and Ma, Z. (2017). Rock Burst Assessment and Prediction by Dynamic and Static Stress Analysis Based on Micro-seismic Monitoring. Int. J. Rock Mech. Mining Sci. 93, 46–53. doi:10.1016/j.ijrmms.2017.01.005
Huang, N. E., Shen, Z., Long, S. R., Wu, M. C., Shih, H. H., Zheng, Q., et al. (1998). The Empirical Mode Decomposition and the Hilbert Spectrum for Nonlinear and Non-stationary Time Series Analysis. Proc. R. Soc. Lond. A. 454, 903–995. doi:10.1098/rspa.1998.0193
Kantelhardt, J. W., Zschiegner, S. A., Koscielny-Bunde, E., Havlin, S., Bunde, A., and Stanley, H. E. (2002). Multifractal Detrended Fluctuation Analysis of Nonstationary Time Series. Physica A: Stat. Mech. its Appl. 316, 87–114. doi:10.1016/s0378-4371(02)01383-3
Konicek, P., and Waclawik, P. (2018). Stress Changes and Seismicity Monitoring of Hard Coal Longwall Mining in High Rockburst Risk Areas. Tunnelling Underground Space Technol. 81, 237–251. doi:10.1016/j.tust.2018.07.019
Li, Y., and Zheng, X. (2007). Wigner-Ville Distribution and its Application in Seismic Attenuation Estimation. Appl. Geophys. 4, 245–254. doi:10.1007/s11770-007-0034-7
Li, T., Cai, M. F., and Cai, M. (2007). A Review of Mining-Induced Seismicity in China. Int. J. Rock Mech. Mining Sci. 44, 1149–1171. doi:10.1016/j.ijrmms.2007.06.002
Li, X., Li, Z., Wang, E., Feng, J., Chen, L., Li, N., et al. (2016). Extraction of Microseismic Waveforms Characteristics Prior to Rock Burst Using Hilbert-Huang Transform. Measurement 91, 101–113. doi:10.1016/j.measurement.2016.05.045
Li, B., Li, N., Wang, E., Li, X., Niu, Y., and Zhang, X. (2017). Characteristics of Coal Mining Microseismic and Blasting Signals at Qianqiu Coal Mine. Environ. Earth Sci. 76, 722. doi:10.1007/s12665-017-7070-2
Li, N., Li, B., Chen, D., Wang, E., Tan, Y., Qian, J., et al. (2020a). Waveform Characteristics of Earthquakes Induced by Hydraulic Fracturing and Mining Activities: Comparison with Those of Natural Earthquakes. Nat. Resour. Res. 29, 3653–3674. doi:10.1007/s11053-020-09699-z
Li, N., Zhang, Z., Khan, M., Zhang, S., Liu, X., and Li, S. (2020b). Research on Anisotropic Characteristics of Rock and Intelligent Recognition of Precursory Signal. Adv. Civil Eng. 2020, 1–11. doi:10.1155/2020/3147203
Li, B., Wang, E., Li, Z., Niu, Y., Li, N., and Li, X. (2021). Discrimination of Different Blasting and Mine Microseismic Waveforms Using FFT, SPWVD and Multifractal Method. Environ. Earth Sci. 80, 36. doi:10.1007/s12665-020-09330-7
Liu, J.-c., and Gao, W.-x. (2020). Vibration Signal Analysis of Water Seal Blasting Based on Wavelet Threshold Denoising and HHT Transformation. Adv. Civil Eng. 2020, 1–14. doi:10.1155/2020/4381480
Ma, C.-y., Wu, L., Sun, M., and Yuan, Q. (2021). Time-Frequency Analysis and Application of a Vibration Signal of Tunnel Excavation Blasting Based on CEEMD-MPE-HT. Shock and Vib. 2021, 1–10. doi:10.1155/2021/6672942
Mucciarelli, M., Masi, A., Gallipoli, M. R., Harabaglia, P., Vona, M., and Ponzo, F. (2004). Analysis of RC Building Dynamic Response and Soil-Building Resonance Based on Data Recorded during a Damaging Earthquake (Molise, Italy, 2002). Bull. Seismol. Soc. Am. 94, 1943–1953. doi:10.1785/012003186
Pechmann, J. C., Arabasz, W. J., Pankow, K. L., Burlacu, R., and McCarter, M. K. (2008). Seismological Report on the 6 August 2007 Crandall Canyon Mine Collapse in Utah. Seismol. Res. Lett. 79, 620–636. doi:10.1785/gssrl.79.5.620
Peng, Z. K., Tse, P. W., and Chu, F. L. (2005). An Improved Hilbert-Huang Transform and its Application in Vibration Signal Analysis. J. Sound Vib. 286, 187–205. doi:10.1016/j.jsv.2004.10.005
Qiu, L., Song, D., He, X., Wang, E., Li, Z., Yin, S., et al. (2020). Multifractal of Electromagnetic Waveform and Spectrum about Coal Rock Samples Subjected to Uniaxial Compression. Fractals 28, 2050061. doi:10.1142/s0218348x20500619
Reynen, A., and Audet, P. (2017). Supervised Machine Learning on a Network Scale: Application to Seismic Event Classification and Detection. Geophys. J. Int. 210, 1394–1409. doi:10.1093/gji/ggx238
Salajegheh, E., and Heidari, A. (2005). Time History Dynamic Analysis of Structures Using Filter banks and Wavelet Transforms. Comput. Struct. 83, 53–68. doi:10.1016/j.compstruc.2004.08.008
Sanchidrián, J. A., Segarra, P., and López, L. M. (2007). Energy Components in Rock Blasting. Int. J. Rock Mech. Mining Sci. 44, 130–147. doi:10.1016/j.ijrmms.2006.05.002
Shang, X., Li, X., Morales-Esteban, A., and Chen, G. (2017). Improving Microseismic Event and Quarry Blast Classification Using Artificial Neural Networks Based on Principal Component Analysis. Soil Dyn. Earthquake Eng. 99, 142–149. doi:10.1016/j.soildyn.2017.05.008
Song, G., Cheng, J., and Grattan, K. T. V. (2020). Recognition of Microseismic and Blasting Signals in Mines Based on Convolutional Neural Network and Stockwell Transform. IEEE Access 8, 45523–45530. doi:10.1109/access.2020.2978392
Stockwell, R. G., Mansinha, L., and Lowe, R. P. (1996). Localization of the Complex Spectrum: the S Transform. IEEE Trans. Signal. Process. 44, 998–1001. doi:10.1109/78.492555
Tan, Y., Hu, J., Zhang, H., Chen, Y., Qian, J., Wang, Q., et al. (2020). Hydraulic Fracturing Induced Seismicity in the Southern Sichuan Basin Due to Fluid Diffusion Inferred from Seismic and Injection Data Analysis. Geophys. Res. Lett. 47, e2019GL084885. doi:10.1029/2019gl084885
Telesca, L., Colangelo, G., Lapenna, V., and Macchiato, M. (2004). Fluctuation Dynamics in Geoelectrical Data: an Investigation by Using Multifractal Detrended Fluctuation Analysis. Phys. Lett. A 332398, 404. doi:10.1016/j.physleta.2004.10.011
Wang, H. L., Zhao, Y., Wang, H. J., Peng, C. Y., and Tong, X. (2021). De-noising Method of Tunnel Blasting Signal Based on CEEMDAN Decomposition-Wavelet Packet Analysis. Explosion Shock Waves 41, 125–137. doi:10.11883/bzycj-2020-0123
Wen, Y. Y., Guo, Z. G., Cao, A. Y., Wang, S. W., Bai, X. X., and Jiang, S. Q. (2020). Analysis of Prssure Relief Effect of Roof Deep Hole Blasting Parameters Based on Micro-seismic Data Evaluation. Coal Sci. Technol. 48 (6), 57–63. doi:10.13199/j.cnki.cst.2020.06.006
Wojtecki, Ł., and Konicek, P. (2016). Estimation of Active Rockburst Prevention Effectiveness during Longwall Mining under Disadvantageous Geological and Mining Conditions. J. Sustain. Mining 15, 1–7. doi:10.1016/j.jsm.2016.04.003
Wojtecki, Ł., Kurzeja, J., and Knopik, M. (2021). The Influence of Mining Factors on Seismic Activity during Longwall Mining of a Coal Seam. Int. J. Mining Sci. Technol. 31, 429–437. doi:10.1016/j.ijmst.2021.01.010
Xu, F. L., Wang, E. Y., Song, D. Z., Song, X. Y., and Wei, M. Y. (2011). Long-range Correlation and Multifractal Distribution of Acoustic Emission of Coal-Rock. Rock Soil Mech. 32, 2111–2116. doi:10.16285/j.rsm.2011.07.028
Yin, Z.-q., Hu, Z.-x., Wei, Z.-d., Zhao, G.-m., Hai-feng, M., Zhang, Z., et al. (2018). Assessment of Blasting-Induced Ground Vibration in an Open-Pit Mine under Different Rock Properties. Adv. Civil Eng. 2018, 1–10. doi:10.1155/2018/4603687
Yin, Z., Chen, W., Hao, H., Chang, J., Zhao, G., Chen, Z., et al. (2020). Dynamic Compressive Test of Gas-Containing Coal Using a Modified Split Hopkinson Pressure Bar System. Rock Mech. Rock Eng. 53, 815–829. doi:10.1007/s00603-019-01955-w
Zhang, S., and Guo, J. (1984). Calculation and Application of Energy Conversion Coefficient of Explosion Seismic. Chin. J. Geophys. 27, 537–547.
Zhao, Y., Shan, R. L., and Wang, H. L. (2021). Research on Vibration Effect of Tunnel Blasting Based on an Improved Hilbert-Huang Transform. Environ. Earth Sci. 80, 206. doi:10.1007/s12665-021-09506-9
Keywords: induced microseismic, microseismic waveform, multifractal characteristics, time–frequency–energy characteristics, blasting efficiency index
Citation: Kan J, Dou L, Li J, Li X, Bai J and Wang M (2022) Characteristics of Microseismic Waveforms Induced by Underground Destress Blasting: Comparison With Those Induced by Ground Blasting and Coal Mining. Front. Earth Sci. 10:797358. doi: 10.3389/feart.2022.797358
Received: 18 October 2021; Accepted: 07 March 2022;
Published: 28 March 2022.
Edited by:
Yilin Gui, Queensland University of Technology, AustraliaReviewed by:
Zhenlei Li, University of Science and Technology Beijing, ChinaLongjun Dong, Central South University, China
Copyright © 2022 Kan, Dou, Li, Li, Bai and Wang. This is an open-access article distributed under the terms of the Creative Commons Attribution License (CC BY). The use, distribution or reproduction in other forums is permitted, provided the original author(s) and the copyright owner(s) are credited and that the original publication in this journal is cited, in accordance with accepted academic practice. No use, distribution or reproduction is permitted which does not comply with these terms.
*Correspondence: Linming Dou, bG1kb3VAMTI2LmNvbQ==
 Jiliang Kan
 Linming Dou1,2*
 Jiazhuo Li
 Jinzheng Bai
