- 1Engineering Research Center of Health Diagnosis Technology of Hydro-Construction, Chongqing Jiaotong University, Chongqing, China
- 2Key Laboratory of Hydraulic and Waterway Engineering of the Ministry of Education, Chongqing Jiaotong University, Chongqing, China
- 3CCCC Highway Consultants CO., Ltd., Ningxia Branch, Beijing, China
Retaining walls may become unstable when the steep slope angle of the top of the wall (β) is greater than the internal friction angle of the earth behind the wall (φ). To examine this behaviour, an active earth pressure model test setup was designed with inclined backfill behind the wall, and corresponding finite element simulations were performed at the same dimensions. The active earth pressure variation patterns of the retaining wall under two displacement modes were studied: translation (T mode) and rotation around the bottom of the wall (RB mode). The experimental results corresponded well to the finite element simulation results. The study found that the experimental results coincided well with the results of the finite element simulation. The active earth pressure and the location of the resultant force points are both connected to the wall displacement pattern and slope angle.
Introduction
Large steep slopes are frequently encountered when engineering buildings. A steep slope may become unstable if the steep slope angle is greater than the internal friction angle within the soil (β > φ). As such, the reverse construction technique is frequently used in engineering (first support the soil on the steep slope, then support the soil on the horizontal part), which results in the working condition β > φ. Classic earth pressure theories (Coulomb, 1773; Rankine, 1857) were predicated on the slope being horizontal (β = 0) or having a slope angle less than the internal friction angle of the backfill (β < φ). Consequently, when these conditions are violated, this theory is no longer applicable to the satisfactory computation of earth pressure.
Many researchers have investigated the active earth pressure on retaining walls using theoretical derivations, model tests, and numerical simulations. From these investigations it has been found that the distribution of active earth pressure along the wall height is nonlinear, and that the active earth pressure is related to the retaining wall displacement mode and displacement magnitude (Sherif and Fang, 1984; Wang, 2000; Paik and Salgado, 2003; Liu, 2014; Lin et al., 2020; Patel and Deb, 2020) (Khosravi et al., 2016)investigated the problem of rigid retaining walls with uniform loads placed on horizontal backfill in the retaining wall active translation mode. Moreover, certain researchers have employed the arch effect to explain the nonlinear distribution of active earth pressure (Jiang et al., 2005; O’Neal and Hagerty, 2011; Nadukuru and Michalowski, 2012; Cao et al., 2020).
It is well known that when the backfill soil is horizontal and inclined, the regularity of the active earth pressure distribution is not consistent. As such, the effect of the backfill soil inclination angle on passive and active earth pressure coefficients has been studied both theoretically and numerically (Fang et al., 1997; Benmeddour et al., 2012; Khosravi et al., 2013). The studies showed that the displacement required for the backfill soil to become active or passive increased with an increase in the backfill soil inclination angle. (Das and Puri, 1996). discovered that increasing the backfill slope causes an increase in the dynamic active earth pressure. Further, (Greco, 2013; Yang and Deng, 2019), investigated the sloping and horizontal backfill units using the limit equilibrium approach to generate analytical equations for active earth pressure. They discovered that the geometry of the sliding rupture surface altered the active earth pressure. (Evangelista et al., 2010; Zhu et al., 2018).further investigated the influence of backfill inclination on the active earth pressure during seismic conditions. Relatedly, the active earth pressures on retaining walls with sloped backfill have also been researched (Mazindrani and Ganjali, 1997; Soubra and Macuh, 2002; Ghosh and Sharma, 2012).
The research on retaining walls has shown that the active earth pressure from narrow backfill behind the wall is related to the retaining wall displacement mode, slope face inclination, wall-soil inter-friction angle, as well as other factors (Dewaikar et al., 2012; Choudhury et al., 2014; Xu et al., 2020; Chen et al., 2021) (Fan and Fang, 2010; Tom Wörden and Achmus, 2013) investigated retaining walls with thin backfill and discovered a substantial association between active earth pressure coefficients and fill space geometry aspect ratio. In addition, researchers have also investigated the earth pressure when recycled tire chips are mixed with sand as backfill material (Reddy and Krishna, 2015; 2019).
The majority of previous studies have been conducted where the backfill surface level and backfill surface dip angle were less than the backfill internal friction angle. Conversely, few studies have been conducted on the active earth pressure variation law of the retaining wall when the backfill surface level and backfill surface dip angle are greater than the backfill soil internal friction angle. As such, this study seeks to elucidate the change law of the active earth pressure on a retaining wall when the slope inclination is greater than the internal friction angle of the soil using a combination of both model tests and numerical simulations. The experimental data were compared to the numerical simulations and the results of other researchers to corroborate the findings and reveal the active earth pressure change law.
Materials and Methods
Backfill Material Properties
Sand with a reasonably fine particle size (see Table 1) was used to balance the ratio of the particle size to the effective area of the pressure cell. The particle size distribution of the backfill material was shown in Supplementary Figure S1. The strength properties of this material were tested under dry conditions using a direct shear test for four distinct normal stresses, as shown in Supplementary Figure S2. In this study, it is assumed that the internal friction angle of the backfill material is constant and its value does not change as the wall moves, given that, (1) there is no peak shear stress even for low levels of normal effective stress (see Supplementary Figure S3); and (2) the friction angle of the contact surface between the retaining wall and the backfill is 1/3 of the internal friction angle of the sand (Benmebarek et al., 2016).
Experimental Set-up
The model test box was composed of upper and lower parts as shown in Figure 1. The upper model box shown in Figure 1A had a length of 1.38 m, a width of 1.0 m, and a height of 0.7 m, with wooden boards used to simulate different inclination angles of the steep slope by changing the angle of the upper baffle. The lower model box shown in Figure 1B had a box frame made of angles, channels, and panels welded together. To facilitate observation of changes in the filling body during test, only one side of the model box was made of steel plate, while the other side was made of tempered glass. The specific structure of the lower model box is shown in Figures 1C,D. To simulate the RB displacement mode of the retaining wall, a 1.4 m high controllable rotating baffle was set at 0.95 m from the front edge of the box, whilst to simulate the T displacement mode of the retaining wall, a baffle limited to horizontal translation was set at the lower rear wall of the model box. The upper and lower parts were stacked directly on top of each other to form the complete model test box.
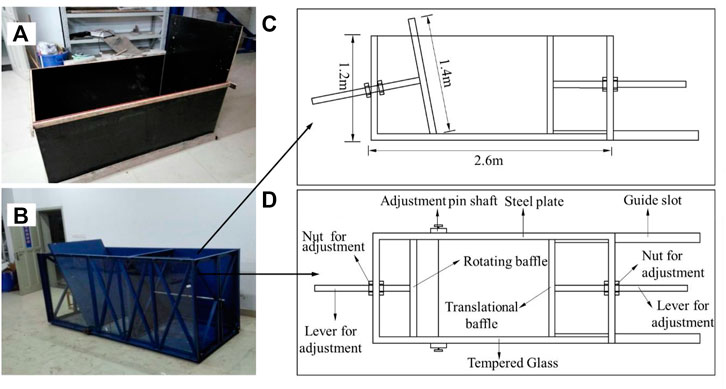
FIGURE 1. Model box diagram: (A) Upper model box. (B) Lower model box. (C) Side view of the lower model box. (D) Top view of the lower model box.
Measurement Systems
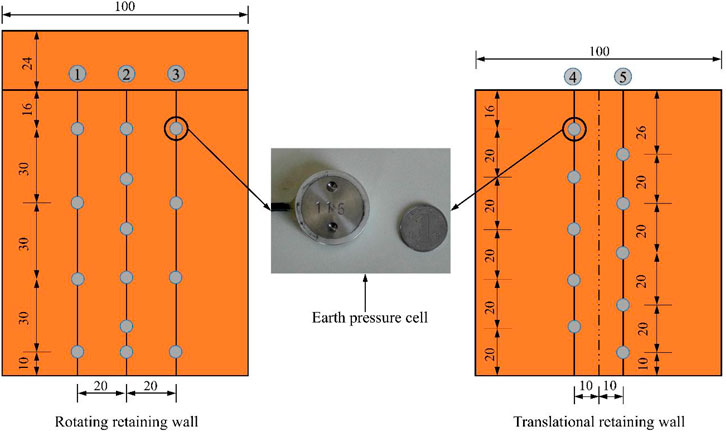
The active earth pressure was measured using the LY-350 resistance-strain micro earth pressure sensor manufactured by Shandong Haoshou Mining Safety Equipment Co. The earth pressure cells were arranged on the two baffles at the lower part of the model box, with measurement lines No. 1 to No. 3 arranged on the rotating baffle. Measurement lines No. 1 and No. 3 were located 20 cm to the left and right of the centre axis, respectively, with four soil pressure cells arranged on each line, whereas measurement line No. 2 was located on the centre axis with six earth pressure cells. Measurement lines No. 4 and No. 5 were arranged on the translation baffle, 10 cm to the left and right of the centre axis, respectively, for which the vertical spacing of the soil pressure cells was 20 cm. The specific arrangement of the earth pressure cells is shown in Figure 2. Calibration of earth pressure box: The calibration curve was obtained by calibrating the earth pressure cell with a triaxial press. Rate of curve was the calibration parameter K. Strain value was measured by DH3821 static strain test system, and then the actual stress was calculated by Eq. 1. The calibration curve of the earth pressure cell was shown in Supplementary Figure S4.
Where p was the pressure acting on the earth pressure cell, με was strain value.
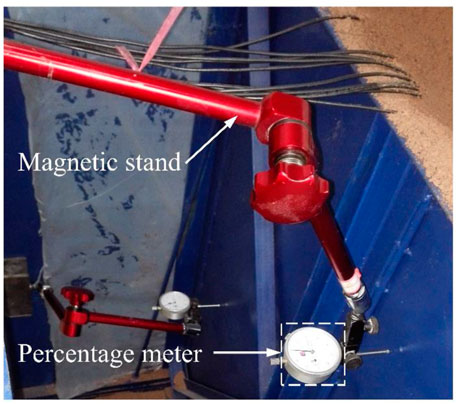
To study the relationship between the active earth pressure and displacement in the T and RB displacement modes, displacement measurement devices were arranged on the two retaining plates as shown in Figure 3. Each displacement measurement device consisted of a magnetic frame and a dial gauge with a measurement range of 0–30 mm.
Experimental Scheme
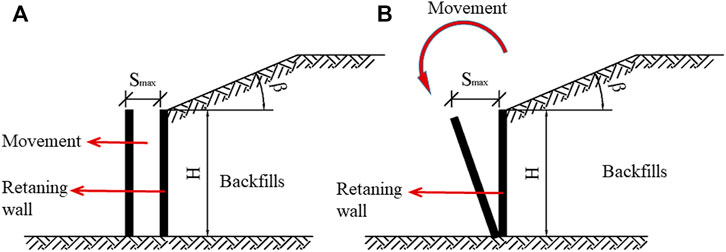
In this experiment, two basic displacement modes were simulated to study the active earth pressure variation law. A schematic diagram of the T and RB displacement modes of the rigid retaining wall is shown in Figure 4. The experimental test included the following steps: (1) white Vaseline was applied inside the model box to reduce friction; (2) the earth pressure cells were arranged at the bottom of the baffles on the model box; (3) the measurement devices were connected for debugging; (4) the soil was filled into the box in layers and compacted (with the real-time density of each layer measured by the ring knife method); (5) the power unit was turned on and the experiment started; (6) when the data from the earth pressure cells at a given measurement time point became smooth or repeated, the test was considered to have reached the ultimate equilibrium state, and power was turned off to close out the test.
Experimental Results
Active Lateral Earth Pressure Measured for the T Displacement Mode
Typical changes of active lateral earth pressure distribution with different stages of wall translation are plotted in Figure 5. It can be seen from the figure that active lateral earth pressure exhibits a nonlinear distribution along with wall height. The distribution of active earth pressure behind the wall was non-linear. In the middle and upper areas of the retaining wall, the earth pressure increases approximately proportionally with the increase in depth. However, near the wall base (z = 0.9 H, where z is backfill depth; H is wall height), the active lateral earth pressure contracts. This behaviour may be related to the friction resistance at the bottom of the retaining wall; that is, in the translation mode, the active earth pressure curve is a downward parabola around the centre of gravity. In addition, with increase in the retaining wall displacement, the active earth pressure at the same depth gradually decreases. Moreover, in approach to the ultimate equilibrium state, there is less decrease in the active lateral earth pressure. Further, with increase in the inclination angle, the displacement required to reach the ultimate equilibrium state gradually decreases.
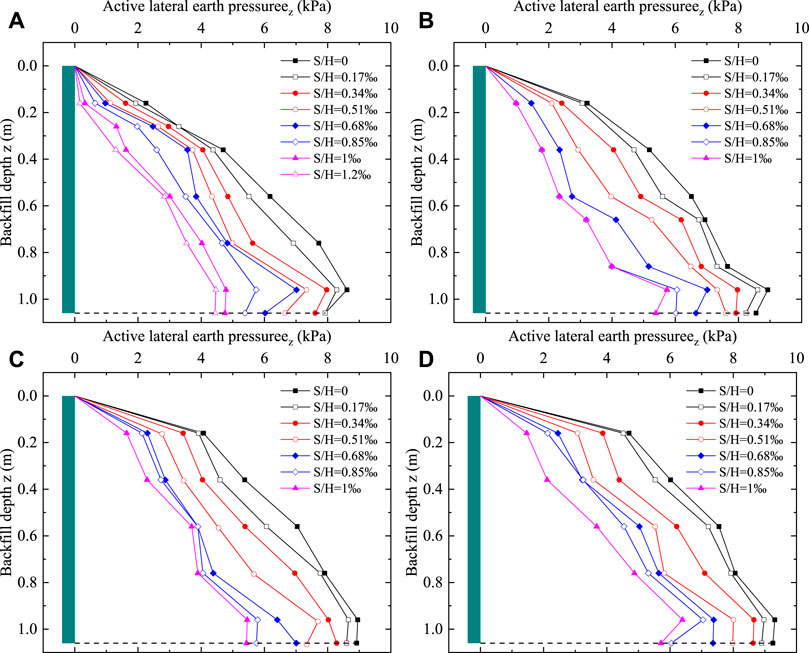
FIGURE 5. Active lateral earth pressure distribution during wall translation at different slope angles. (A) β = 40°. (B) β = 50°. (C) β = 60°. (D) β = 70°.
Figure 6 displays the connection between active lateral earth pressure and wall displacement when the retaining wall was translated away from the backfill soils. Active lateral earth pressure decreases as the wall displacement increases. When wall displacement reaches a critical magnitude, the backfill approaches the ultimate equilibrium state. As the slope angle increases, the wall displacement that causes the soil behind the wall to attain the ultimate equilibrium condition gradually decreases. Furthermore, active lateral earth pressure was nearly the same at the bottom of the wall (z = 0.96 m, 1.06 m).
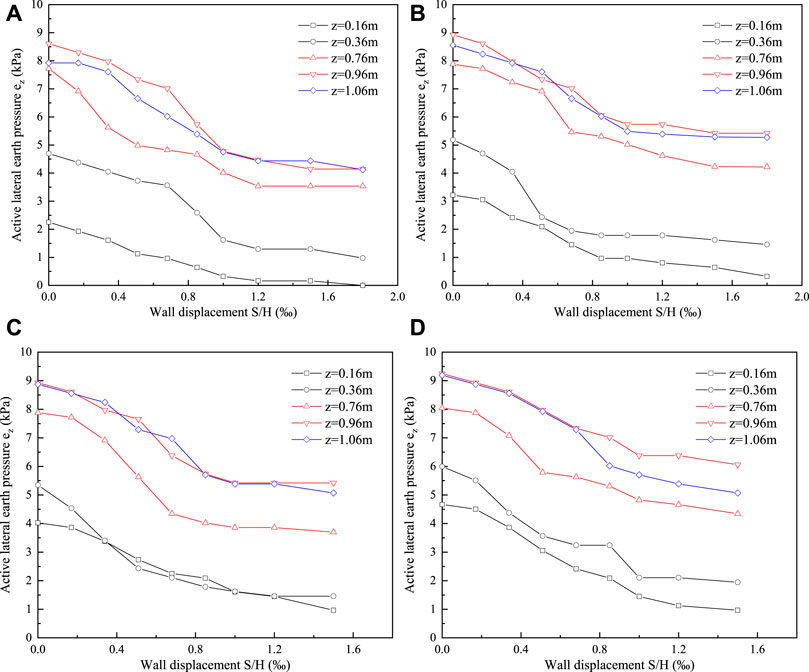
FIGURE 6. Changes of Active Lateral Earth Pressure with Wall Translation Displacement in Model Experimental. (A) β = 40°. (B) β = 50°. (C) β = 60°. (D) β = 70°.
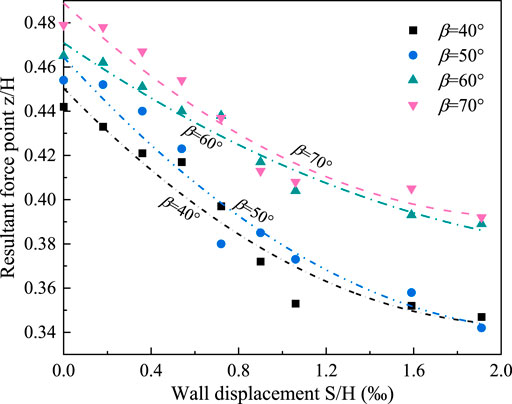
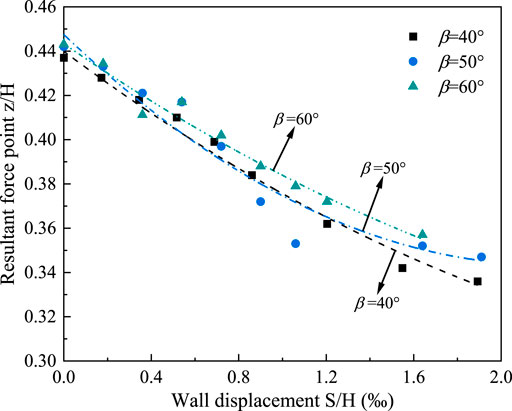
The magnitude of the resulting force on the retaining wall is obtained by integrating the active lateral earth pressure with the area enclosed by the retaining wall (vertical axis) along the wall height variation curve, for which the centroid position is the resultant force point. Figure 7 shows the relationship between the resultant force point and the wall displacement in T mode. The resultant force point height was quadratically linked to the retaining wall displacement, as shown in the figure, and as the retaining wall displacement grows, the active earth pressure reduces, causing the resultant force point height to reduce. The resultant force point height approaches a stable value when the retaining wall displacement rises to 1.20 × 10⁻³H. When the retaining wall displacement was minor, the resulting force point height was proportional to the slope angle.
Active Lateral Earth Pressure Measured for the RB Displacement Mode
Figure 8 shows the active lateral earth pressure variation curve with depth given change in displacement. When the retaining wall rotates around the bottom, the active lateral earth pressure gradually decreases from the static earth pressure with increase in retaining wall displacement. The distribution of the active lateral earth pressure along the backfill depth in each displacement state showed a nonlinear distribution and did not reach the ultimate equilibrium state simultaneously. During the rotation around the bottom of the wall, the reduction in active lateral earth pressure in the middle and upper part of the retaining wall (approximately 0.5 m below the top of the retaining wall) was greater than that in the lower part of the rotating retaining wall; in fact, the active lateral earth pressure at any slope angle shows this regularity. The reason for this regularity is that there is no displacement at the bottom of the retaining wall, whilst the displacement along the height direction of the wall gradually increases, hence the reduction in active lateral earth pressure gradually increases. In addition, the maximum displacement (Sa) to reach the ultimate equilibrium state gradually decreased as the slope angle increased. Overall, when the backfill was cracked and the data from the earth pressure cells at a given measurement point was repeated or had excessive abrupt changes (which were subsequently were rounded off in data processing), it was determined that the limit for the equilibrium state had been reached.
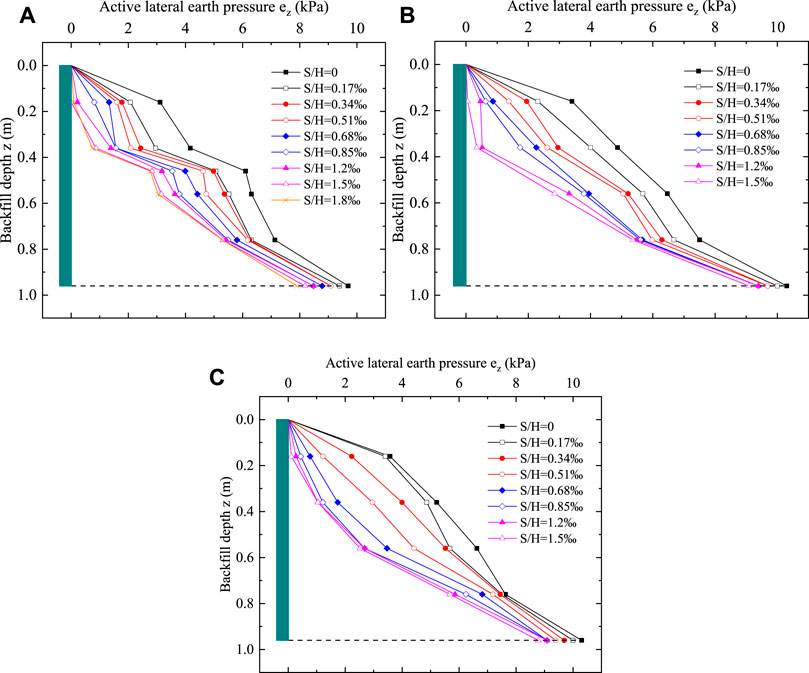
FIGURE 8. Distribution of active lateral earth pressure with rotational displacement around the wall bottom at different slope angles. (A) β = 40°. (B) β = 50°. (C) β = 60°.
Changes of active lateral earth pressure with displacement when the retaining wall rotates around the base as shown in Figure 9. The experimental results show that active lateral earth pressure reduces with the increase of wall rotational displacement and the backfill gradually approaches the active limit state. It is remarkable that during the rotation of the wall around the base, the drop of active lateral earth pressure at the bottom of the retaining wall (z = 1.06 m) was obviously smaller than other parts of the wall.
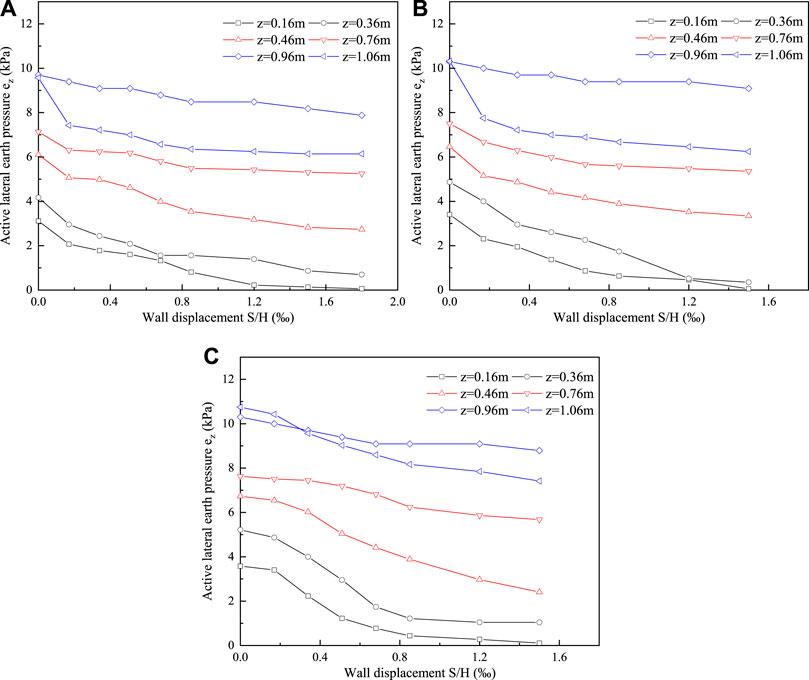
FIGURE 9. Changes of Active Lateral Earth Pressure with Wall Rotation Displacement in Model Experimental. (A) β = 40°. (B) β = 50°. (C) β = 60°.
Figure 10 illustrates the change in height of the resultant force action point during rotational displacement of the retaining wall. It is evident that the height of the resultant force action point decreases when the retaining wall rotates. The height of the resultant force point at different slope angles is approximately the same in the initial rotation stage of the retaining wall. The height reduction of the resultant force point is inversely proportional to the slope angle as rotation displacement increases.
Numerical Simulations
Model Size and Parameters
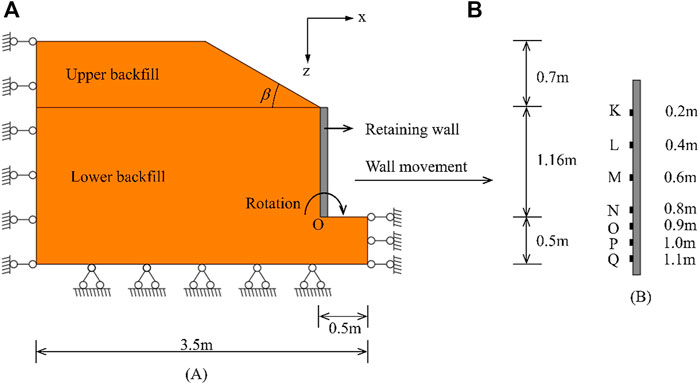
The finite element model was set to the same dimensions of the model test box as shown in Figure 11A, to facilitate comparison of the calculation results and to eliminate any errors caused by dimensional differences. Overall, the model was composed of four parts: the foundation, retaining wall, upper backfill, and lower backfill. The model was 3.5 m wide and 2.36 m high, with a foundation 0.5 m in height, a retaining wall 1.16 m high, and an upper backfill height of 0.7 m. The model was assumed to be that of a plane strain problem (Bolton, 1986). Fixed constraints at the bottom of the model and no relative displacement, given the left boundary and the right lower boundary are horizontally constrained and vertically free. As shown in Figure 11B, seven stress points were selected at the back of the rigid retaining wall marked K, L, M, N, O, P and Q, for which the distances from the top of the wall were 0.2, 0.4, 0.6, 0.8, 0.9, 1.0 and 1.1 m respectively. The active lateral earth pressure variation law of the wall in movement away from the backfill was then obtained according to the stress state at these seven stress points.
The backfill was modelled using the Mohr-Coulomb elastoplastic model, and the rigid retaining wall was simulated using the plate unit (Fan and Fang, 2010), for which the model parameters are listed in Table 1. To study the relationship between active lateral earth pressure and depth and displacement of the fill under different slope inclinations (β = 40°, 50°, 60°, and 70°), the two displacement modes of the retaining wall were simulated from soil translation and rotation around the bottom of the wall. A uniform displacement of 0.2 mm per stage was applied to the retaining wall to simulate translation of the wall. A concentrated displacement of 0.2 mm per stage was applied to the top of the retaining wall to simulate rotation around the bottom of the wall. Both displacement modes were applied over 2 mm displacements and loaded in ten steps.
Meshing Grid
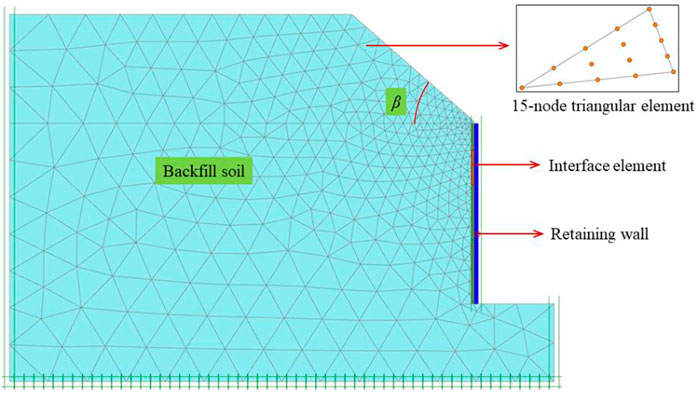
A triangular cell with 15 nodes was used to automatically divide the mesh (Fan and Fang, 2010). The grid of the wall-soil contact area was encrypted using the line encryption function. The number of units and nodes divided was different at each inclination angle. Taking the slope inclination angle β = 40° as an example, the final division result was 1329 meshes and 11,420 nodes. The complete mesh division results of the finite element model are shown in Figure 12.
Numerical Simulation Results
T Displacement Mode Active Lateral Earth Pressure
Figure 13 depicts the active lateral earth pressure variation curve as well as the depth of the backfill at various slope angles for the T displacement mode. As shown in the figure, when the displacement is small (S/H = 0.19‰), the active lateral earth pressure increases as the depth of the backfill increases. However, as the displacement increases further, the active lateral earth pressure near the bottom of the wall (z = 1.0 m) produces an abrupt change, which differs from the Rankine earth pressure, indicating that the active lateral earth pressure wa not linearly distributed. For different slope angles, the trend of the active lateral earth pressure with backfill depth was the similar.
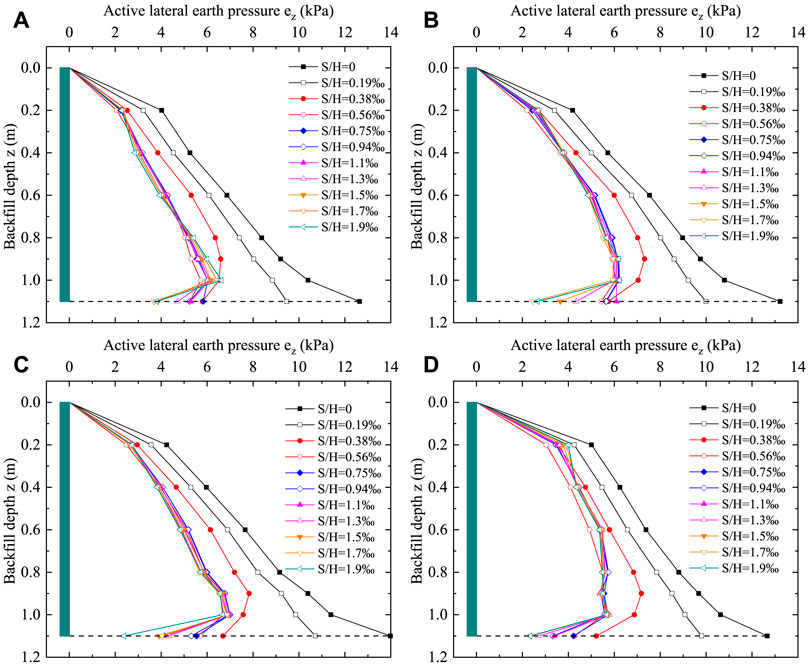
FIGURE 13. Finite element modeling of active lateral earth pressure in the T displacement mode of retaining walls. (A) β = 40°. (B) β = 50°. (C) β = 60°. (D) β = 70°.
Figure 14 depicts the relationship between the active lateral earth pressure and the retaining wall displacement at various points along the back of the wall for the T displacement mode. As shown in the figure, the active lateral earth pressure with displacement change curve can be divided into two stages during the translation of the retaining wall back from the soil. The wall displacement from 0 to 1.0 mm (S/H = 0–0.94‰) is the first stage, where the active lateral earth pressure and displacement are linearly and negatively correlated. For the second stage, the active lateral earth pressure decreases to a certain value that remains essentially constant. When the displacement reaches 1.0 mm (S/H = 0.94‰), the wall reaches the ultimate equilibrium state, and the active earth pressure at the bottom of the wall gradually decreases as the slope angle increases. The active lateral earth pressure at the bottom of the wall (point Q) decreases with displacement, and the greater the slope angle, the lower the earth pressure at the bottom of the retaining wall.
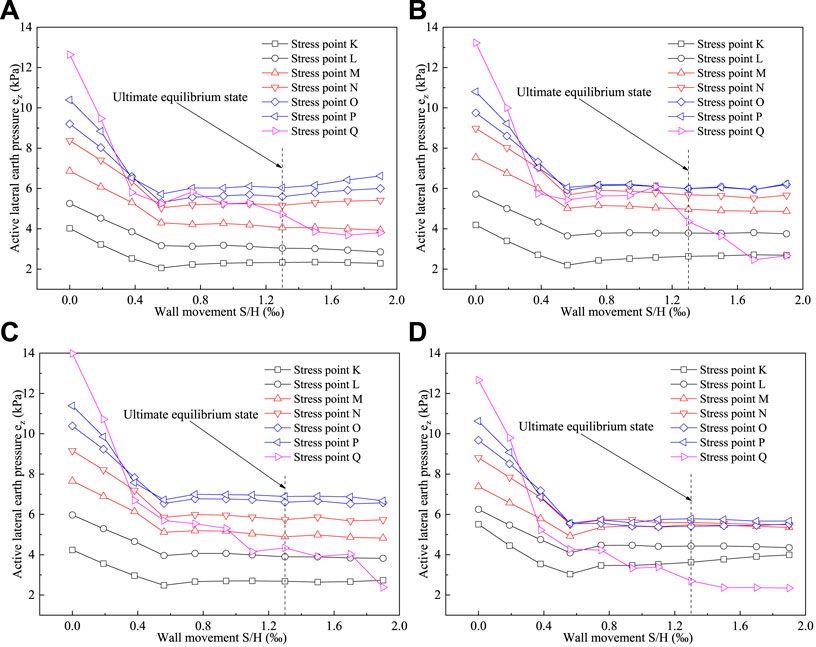
FIGURE 14. Active Lateral Earth Pressure Finite Element Modeling with Retaining Wall Displacement in T Displacement Mode. (A) β = 40°. (B) β = 50°. (C) β = 60°. (D) β = 70°.
RB Displacement Mode Active Lateral Earth Pressure
The active lateral earth pressure distributions at different slope angles with displacement changes are shown in Figure 15 for the RB displacement mode. From the figure, it can be seen that the active lateral earth pressure increases with increase in the backfill depth and changes into a concave curve. As the displacement of the retaining wall increased, the active lateral earth pressure gradually decreased from the static earth pressure. The rate of reduction of the active lateral earth pressure at the upper part of the retaining wall was significantly larger than at the lower part of the retaining wall, owing to the larger displacement of the upper part of the retaining wall compared to the lower part of the wall. The earth pressure at the bottom part of the wall was slightly greater than the static earth pressure given the earth arch effect. In explanation of this finding, during rotation of the retaining wall the principal stress is deflected, as the soil layer at the top of the wall (which has a larger displacement) is subjected to additional shear stress by the soil layer at the bottom of the wall (which has a smaller displacement), causing the earth pressure at the top of the wall to decrease and the earth pressure at the bottom to increase. Thus, the larger the rotation of the wall, the more obvious is the earth arch effect.
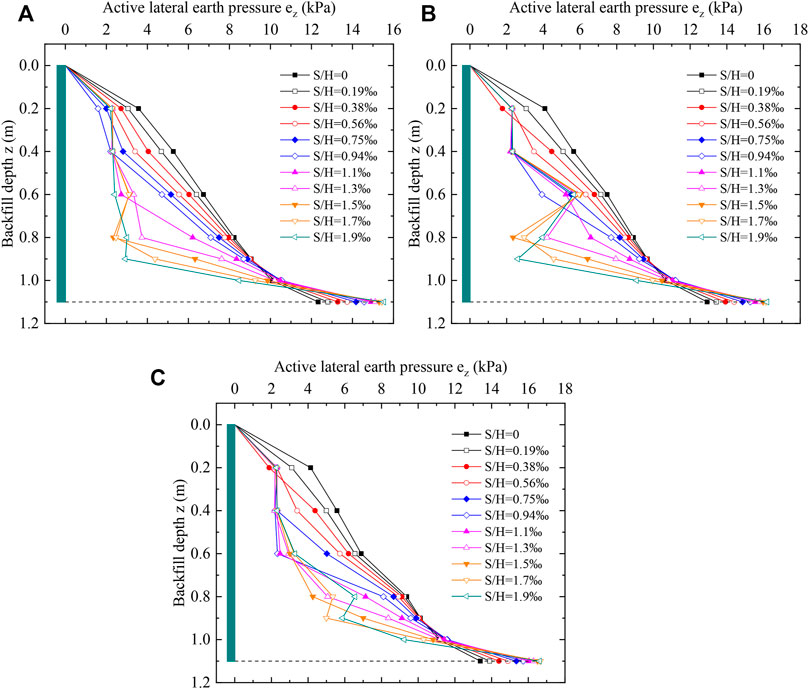
FIGURE 15. Finite element modeling of active lateral earth pressure in the RB displacement mode of retaining walls. (A) β = 40°. (B) β = 50°. (C) β = 60°.
Figure 16 shows the active lateral earth pressure variation curve with the wall displacement for the RB displacement mode. The figure shows that the active lateral earth pressure in the middle and upper part of the retaining wall (points K, L, M, and N) gradually decreased with the increase in displacement, whereas the active lateral earth pressure at the bottom of the retaining wall (points O, P, and Q) increased with the increase in displacement. For different slope angles, the active lateral earth pressure with displacement followed a similar trend, but the larger the slope angle, the greater the active lateral earth pressure for the same displacement state.
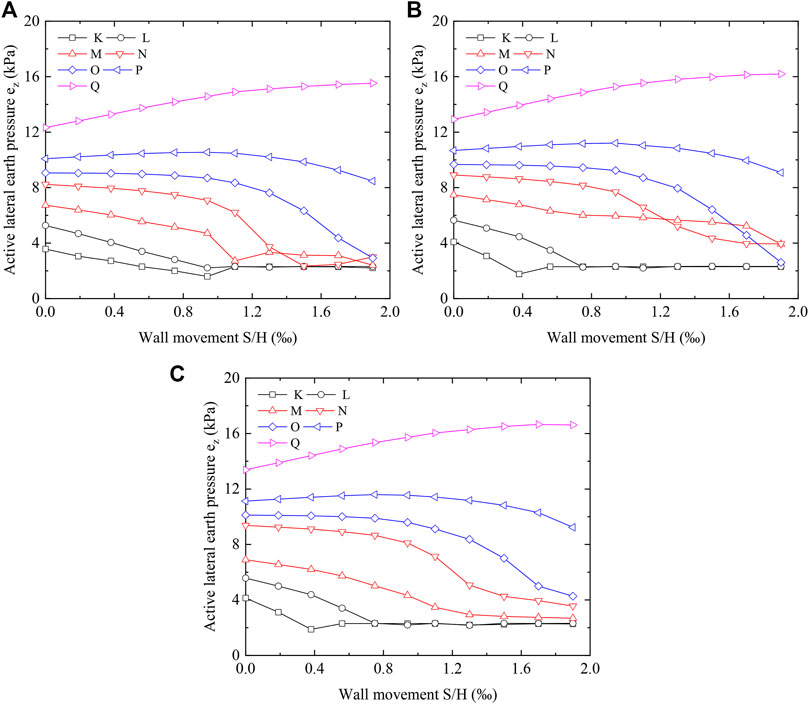
FIGURE 16. Active Lateral Earth Pressure Finite Element Modeling with Retaining Wall Displacement in RB Displacement Mode. (A) β = 40°. (B) β = 50°. (C) β = 60°.
Comparison
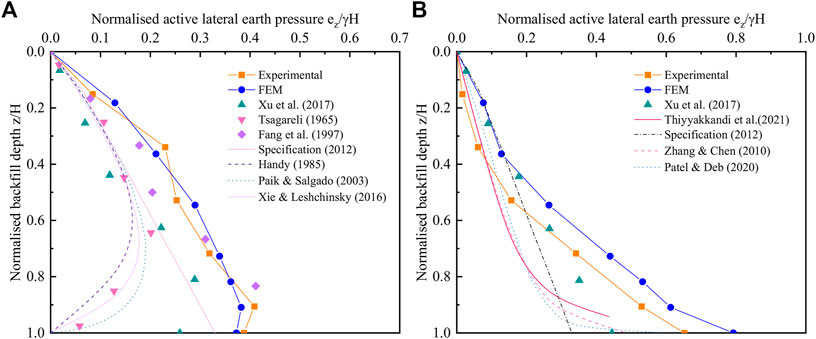
The experimental and FEM results in this study were compared to those obtained from investigations using horizontal backfill (Xu et al., 2017) and inclined backfill (Fang et al., 1997; Thiyyakkandi et al., 2021) in order to identify the difference between active lateral earth pressures for β>φ and β<φ.To analyze the earth pressure change pattern, the results were compared with those of arching-based theories (Handy, 1985; Paik and Salgado, 2003; Zhang and Chen, 2010; Xie and Leshchinsky, 2016; Patel and Deb, 2020). To compute the active lateral earth pressure for β>φ, the additional stress method (China Academy of Building Research, 2012) was suggested. To assess the applicability of both approaches, the findings of the tests and FEM were compared to the results of the extra stress method. The additional stress method (Figure 17 and Eqs.2, 3) entails converting the soil above the top of the walls into additional stresses superimposed on the lower soil, and calculating the active earth pressure of the lower backfill using Coulomb theory. Figure 18 shows the experimental, FEM and previous research results mentioned above.
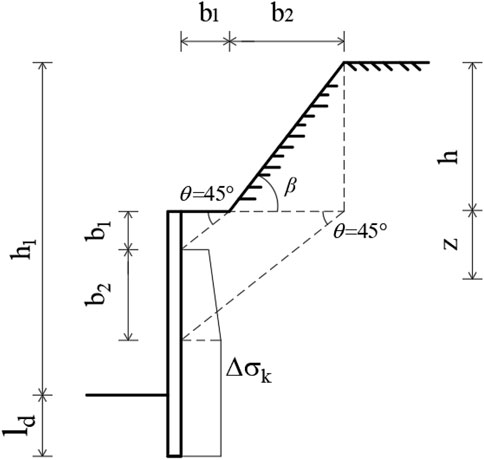
FIGURE 17. Calculation of additional vertical stresses in sloping earth at the top of retaining walls.
When,
Then,
Where Eak1 is the standard value of the active earth pressure from soil at the top of the retaining wall. Ka1 is coefficient of active earth pressure for sloping earth. Slope height h = 0.7m, horizontal distance from outer edge of retaining wall to slope angle b1 = 0, diffusion angle θ = 45°, horizontal length of slope b2 = h/tanβ.
Comparison of the Active Lateral Earth Pressure With Other Studies
In the T-mode, the FEM results match the experimental data better, as shown in Figure 18A. The experimental and FEM result showed a similar distribution with active earth pressure of horizontal backfill (Xu et al., 2017), while the latter has a smaller active lateral earth pressure. The results of inclined backfill (Fang et al., 1997) were more consistent with this study when z = 0–0.8H. The active earth pressure computed using the additional stress method (China Academy of Building Research, 2012) was more aggressive than the findings of experiments and FEM. As compared to arching-based theories (Handy, 1985; Paik and Salgado, 2003; Xie and Leshchinsky, 2016), active lateral earth pressures increased, then decreased, with increasing backfill depth under both working conditions, but lateral active pressure maximum for β>φ was obviously closer to the wall’s base.
Figure 18B depicts how active lateral earth pressure increases with increasing depth of backfill in RB mode for both β>φ, and β<φ,. Experimental and FEM data reveal similar patterns of variation; however, the FEM active earth pressure was higher than the experimental. Compared to the results of the additional stress method (Industry standard of the People’s Republic of China, 2012), the results of the test and FEM were much greater in the middle and lower areas of the retaining wall. In the case of z = 0–0.4H, the FEM results are more consistent with the active earth pressure of horizontal backfill (Xu et al., 2017). When z > 0.4H, the results of the test with FEM were higher than active earth pressure for horizontal backfill (Xu et al., 2017) and inclined backfill (Thiyyakkandi et al., 2021).
In summary, whenβ>φ, the distribution of active lateral earth pressure in T and RB mode was similar to that of horizontal and inclined backfill, but the active earth pressure was larger in β>φ,, especially in the middle and lower regions of retaining walls. As a result, the strength of the middle and lower parts of the walls should be considered in β>φ, engineering.
Comparison of the Resultant Force Point Position in Equilibrium
Figure 19 depicts the height of the active lateral earth pressure action point for each slope angle in the ultimate equilibrium state. For the T and RB displacement modes, the maximum differences between the locations of the resultant force points between the experiments and numerical simulations were 5.15 and 6.21%, respectively. This level of difference is considered to denote acceptable agreement between the experimental and numerical simulations and confirms the correctness of the experimental results. Furthermore, as the slope face inclination increases in the T displacement mode, the position of the resultant force point gradually moves up from below to above the Rankine resultant force point. In the ultimate equilibrium state, this behaviour can be attributed to a decrease in the lateral earth pressure as the slope angle increases. The location of the resultant force point in the RB displacement mode decreases with increasing slope angle and is always below the Rankine resultant force point. This decrease in the position of the resultant force point as the slope angle increases is owing to an increase in the lateral earth pressure as the slope inclination increases.
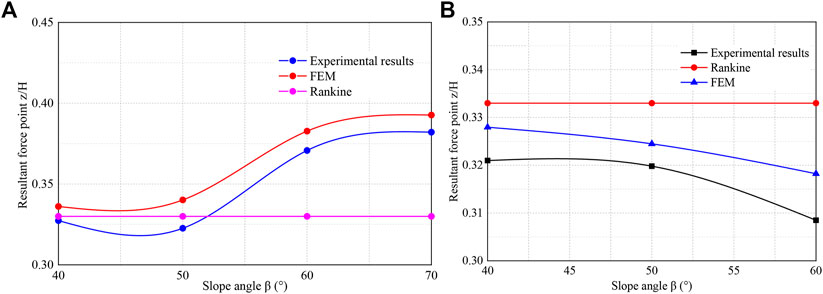
FIGURE 19. The relationship between the resultant force point and the slope angle. (A) Tmode. (B) RBmode.
Conclusion
In some engineering, the slope angle β at the top of the retaining wall exceeded the internal friction angle φ of the backfill. In this study, the distribution of active lateral earth pressure and the location of resultant force point when the retaining wall translation and rotation around the base were investigated by means of model tests and finite element simulation. Based on this, the following conclusions are made:
Both the distribution of active lateral earth pressure as well as the location of resultant force points were influenced by the displacement mode and slope angle of the retaining wall. In T mode, active earth pressure displayed a non-linear distribution and was negatively correlated with wall displacement. The maximum active lateral earth pressure was located at 0.9H, and it was negatively correlated with slope angle. In ultimate state, the resultant force point height correlated positively with slope angle and exceeded 1/3H. In RB mode. active earth pressure also displayed a nonlinear distribution, and it was negatively correlated with wall displacement. Maximum active lateral earth pressure was found at the bottom of walls, and it was positively correlated with slope angle. Resultant force point height was negatively correlated with slope angle in ultimate state, and it was less than 1/3H. In comparison with the research results of horizontal backfill and inclined backfill, it shows that when β>φ, the distribution of active earth pressure was similar to β<φ, However, in the middle and lower part of retaining wall, active lateral earth pressure of β>φ was significantly less than β<φ. Therefore, slope cutting or strengthening of the lower retaining wall should be considered in the engineering of β>φ.
Data Availability Statement
The original contributions presented in the study are included in the article/Supplementary Material, further inquiries can be directed to the corresponding author.
Author Contributions
KW: Conceptualization, Funding acquisition, Writing–review and editing. GL: Investigation, Methodology, Data curation, Writing—original draft, Writing—review and editing. YZ: Investigation, Data curation, Methodology. JL: Conceptualization, Resources, Project administration.
Funding
The Science and Technology Research Program of Chongqing Municipal Education Commission (Grant No. KJZD-K202100705), and the Chongqing Innovative research program for graduates (Grant No. CYS20302).
Conflict of Interest
YZ is employed by CCCC Highway Consultants CO. Ltd. Ningxia Branch.
The remaining authors declare that the research was conducted in the absence of any commercial or financial relationships that could be construed as a potential conflict of interest.
Publisher’s Note
All claims expressed in this article are solely those of the authors and do not necessarily represent those of their affiliated organizations, or those of the publisher, the editors and the reviewers. Any product that may be evaluated in this article, or claim that may be made by its manufacturer, is not guaranteed or endorsed by the publisher.
Acknowledgments
We would like to acknowledge Editage for their touch-ups to this article.
Supplementary Material
The Supplementary Material for this article can be found online at: https://www.frontiersin.org/articles/10.3389/feart.2022.796232/full#supplementary-material
References
Benmebarek, N., Labdi, H., and Benmebarek, S. (2016). A Numerical Study of the Active Earth Pressure on a Rigid Retaining Wall for Various Modes of Movements. Soil Mech. Found. Eng. 53, 39–45. doi:10.1007/s11204-016-9362-z
Benmeddour, D., Mellas, M., Frank, R., and Mabrouki, A. (2012). Numerical Study of Passive and Active Earth Pressures of Sands. Comput. Geotechnics 40, 34–44. doi:10.1016/j.compgeo.2011.10.002
Bolton, M. D. (1986). The Strength and Dilatancy of Sands. Géotechnique 36, 65–78. doi:10.1680/geot.1986.36.1.65
Cao, W., Zhang, H., Liu, T., and Tan, X. (2020). Analytical Solution for the Active Earth Pressure of Cohesionless Soil behind an Inclined Retaining wall Based on the Curved Thin-Layer Element Method. Comput. Geotechnics 128, 103851. doi:10.1016/j.compgeo.2020.103851
Chen, F.-q., Lin, C., Lin, L.-b., and Huang, M. (2021). Active Earth Pressure of Narrow Cohesive Backfill on Rigid Retaining wall of Rotation about the Bottom. Soils and Foundations 61, 95–112. doi:10.1016/j.sandf.2020.11.002
China Academy of Building Research (2012). Technical Specification for Retaining and Protection of Building Foundation Excavations. Beijing: China Architecture & Building Press.
Choudhury, D., Katdare, A. D., and Pain, A. (2014). New Method to Compute Seismic Active Earth Pressure on Retaining Wall Considering Seismic Waves. Geotech Geol. Eng. 32, 391–402. doi:10.1007/s10706-013-9721-8
Coulomb, C. A. (1773) Essai sur une application des règles de maximis & minimis à quelques problèmes de statique, relatifs à l'architecture, Paris, Mémoires de mathématique & de physique présentés à l'Académie Royale des Sciences par divers savans & lûs dans ses assemblées. 7 343–382.
Das, B. M., and Puri, V. K. (1996). Static and Dynamic Active Earth Pressure. Geotech Geol. Eng. 14, 353–366. doi:10.1007/bf00421949
Dewaikar, D. M., Pandey, S. R., and Dixit, J. (20122012). Active Thrust on an Inclined Retaining Wall with Inclined Cohesionless Backfill Due to Surcharge Effect. ISRN Soil Sci. 2012, 1–8. doi:10.5402/2012/750386
Evangelista, A., Scotto Di Santolo, A., and Simonelli, A. L. (2010). Evaluation of Pseudostatic Active Earth Pressure Coefficient of Cantilever Retaining walls. Soil Dyn. Earthquake Eng. 30, 1119–1128. doi:10.1016/j.soildyn.2010.06.018
Fan, C.-C., and Fang, Y.-S. (2010). Numerical Solution of Active Earth Pressures on Rigid Retaining walls Built Near Rock Faces. Comput. Geotechnics 37, 1023–1029. doi:10.1016/j.compgeo.2010.08.004
Fang, Y.-S., Chen, J.-M., and Chen, C.-Y. (1997). Earth Pressures with Sloping Backfill. J. Geotechnical Geoenvironmental Eng. 123, 250–259. doi:10.1061/(asce)1090-0241(1997)123:3(250)
Ghosh, S., and Prasad Sharma, R. (2012). Seismic Active Earth Pressure on the Back of Battered Retaining Wall Supporting Inclined Backfill. Int. J. Geomech. 12, 54–63. doi:10.1061/(asce)gm.1943-5622.0000112
Greco, V. (2013). Active Thrust on Retaining walls of Narrow Backfill Width. Comput. Geotechnics 50, 66–78. doi:10.1016/j.compgeo.2012.12.007
Handy, R. L. (1985). The Arch in Soil Arching. J. Geotechnical Eng. 111, 302–318. doi:10.1061/(asce)0733-9410(1985)111:3(302)
Jiang, B., Ying, H. W., and Xie, K. H. (2005). Analysis of Soil Arching Effect behind Retaining wall. J. Zhejiang University(Engineering Science) 39, 131–136. doi:10.3785/j.issn.1008-973X.2005.01.024
Khosravi, M. H., Pipatpongsa, T., and Takemura, J. (2013). Experimental Analysis of Earth Pressure against Rigid Retaining walls under Translation Mode. Géotechnique 63, 1020–1028. doi:10.1680/geot.12.p.021
Khosravi, M. H., Pipatpongsa, T., and Takemura, J. (2016). Theoretical Analysis of Earth Pressure against Rigid Retaining walls under Translation Mode. Soils and Foundations 56, 664–675. doi:10.1016/j.sandf.2016.07.007
Lin, Y. J., Chen, F. Q., Yang, J. T., and Li, D. (2020). Active Earth Pressure of Narrow Cohesionless Backfill on Inclined Rigid Retaining Walls Rotating about the Bottom. Int. J. Geomechanics 20, 04020102. doi:10.1061/(asce)gm.1943-5622.0001727
Liu, F. Q. (2014). Lateral Earth Pressures Acting on Circular Retaining Walls. Int. J. Geomechanics 14, 04014002. doi:10.1061/(asce)gm.1943-5622.0000291
Mazindrani, Z. H., and Ganjali, M. H. (1997). Lateral Earth Pressure Problem of Cohesive Backfill with Inclined Surface. J. Geotechnical Geoenvironmental Eng. 123, 110–112. doi:10.1061/(asce)1090-0241(1997)123:2(110)
Nadukuru, S. S., and Michalowski, R. L. (2012). Arching in Distribution of Active Load on Retaining Walls. J. Geotech. Geoenviron. Eng. 138, 575–584. doi:10.1061/(asce)gt.1943-5606.0000617
O’neal, T. S., and Hagerty, D. J. (2011). Earth Pressures in Confined Cohesionless Backfill against Tall Rigid walls — a Case History. Can. Geotechnical J. 48, 1188–1197. doi:10.1139/t11-033
Paik, K. H., and Salgado, R. (2003). Estimation of Active Earth Pressure against Rigid Retaining walls Considering Arching Effects. Géotechnique 53, 643–653. doi:10.1680/geot.2003.53.7.643
Patel, S., and Deb, K. (2020). Study of Active Earth Pressure behind a Vertical Retaining Wall Subjected to Rotation about the Base. Int. J. Geomechanics 20, 04020028. doi:10.1061/(asce)gm.1943-5622.0001639
Rankine, W. J. M. (1857). On the Stability of Loose Earth, Phil. Trans. R. Soc. Lond., 147 9–27. 10.1098/rstl.1857.0003.
Reddy, S. B., and Krishna, A. M. (2019). Sand–scrap Tyre Chip Mixtures for Improving the Dynamic Behaviour of Retaining walls. INT. J. GEOTECH ENG. 15, 1078–1092. doi:10.1080/19386362.2019.1652969
Reddy, S. B., and Krishna, A. M. (2015). Recycled Tire Chips Mixed with Sand as Lightweight Backfill Material in Retaining Wall Applications: An Experimental Investigation. Int. J. Geosynth. Ground Eng. 1, 31. doi:10.1007/s40891-015-0036-0
Sherif, M. A., and Fang, Y.-S. (1984). Dynamic Earth Pressures on Walls Rotating about the Top. Soils and Foundations 24, 109–117. doi:10.3208/sandf1972.24.4_109
Soubra, A.-H., and Macuh, B. (2002). Active and Passive Earth Pressure Coefficients by a Kinematical Approach. Geotechnical Eng. 155, 119–131. doi:10.1680/geng.155.2.119.38657
Thiyyakkandi, S., Shankar, P., Neeraj, C. R., and Lukose, A. (2021). Active Earth Pressure on Retaining walls with Sloping Backfill Considering Arching Effect under Rotation about Base. Innov. Infrastruct. Solut. 7, 126. doi:10.1007/s41062-021-00724-5
Tom Wörden, F., and Achmus, M. (2013). Numerical Modeling of Three-Dimensional Active Earth Pressure Acting on Rigid walls. Comput. Geotechnics 51, 83–90. doi:10.1016/j.compgeo.2013.02.004
Wang, Y.-Z. (2000). Distribution of Earth Pressure on a Retaining wall. Géotechnique 50, 83–88. doi:10.1680/geot.2000.50.1.83
Xie, Y., and Leshchinsky, B. (2016). Active Earth Pressures from a Log-Spiral Slip Surface with Arching Effects. Géotechnique Lett. 6, 149–155. doi:10.1680/jgele.16.00015
Xu, L.-W., Lin, Y.-J., and Zhou, J. W. (2020). Experimental Study on the Active Earth Pressure of Narrow Cohesionless Backfills against Rigid Retaining Wall under the Translation Mode. Adv. Civil Eng. 2020, 1–9. doi:10.1155/2020/8889749
Xu, L. T., Zhang, Z. C., Zhang, R. Z., and Qian, J. G. (2017). Active Earth Pressure Model Tests of Different Displacement Modes of Retaining wall in sandy Soil. Chin. J. Underground Space Eng. 13, 1296–1302.
Yang, M., and Deng, B. (2019). Simplified Method for Calculating the Active Earth Pressure on Retaining Walls of Narrow Backfill Width Based on DEM Analysis. Adv. Civil Eng. 2019, 1–12. doi:10.1155/2019/1507825
Zhang, Y., and Chen, L. (2010). Active Earth Pressure with Wall Rotation Movement about Base Considering Soil Arching. J. Civil Architectural & Environ. Eng. 32, 46–52. doi:10.11835/j.issn.1674-4764.2010.03.009
Keywords: steep slope, retaining wall, active earth pressure, finite element, displacement modes
Citation: Wang K, Liu G, Zhang Y and Lin J (2022) Quantification of the Active Lateral Earth Pressure Changes on Retaining Walls at the Leading Edge of Steep Slopes. Front. Earth Sci. 10:796232. doi: 10.3389/feart.2022.796232
Received: 16 October 2021; Accepted: 03 February 2022;
Published: 11 March 2022.
Edited by:
Chaojun Jia, Central South University, ChinaReviewed by:
Mohammad Hossein Khosravi, University of Tehran, IranSodom Bali Reddy, Madanapalle Institute of Technology & Science (MITS), India
Copyright © 2022 Wang, Liu, Zhang and Lin. This is an open-access article distributed under the terms of the Creative Commons Attribution License (CC BY). The use, distribution or reproduction in other forums is permitted, provided the original author(s) and the copyright owner(s) are credited and that the original publication in this journal is cited, in accordance with accepted academic practice. No use, distribution or reproduction is permitted which does not comply with these terms.
*Correspondence: Gang Liu, NjIyMTkwOTYwMDY2QG1haWxzLmNxanR1LmVkdS5jbg==
 Kui Wang
 Gang Liu
 Yuwei Zhang2,3
