 Richard H. Worden*
 James E. P. Utley
- Department of Earth Ocean and Ecological Sciences, University of Liverpool, Liverpool, United Kingdom
Porosity and permeability define the reservoir quality of a sandstone. Porosity and permeability are controlled by primary sedimentary characteristics and subsequent diagenetic modification. Grain size, sorting, detrital mineralogy, and matrix content are defined at the point of deposition. Bioturbation, infiltration, continued alteration of reactive minerals and soft sediment deformation can occur soon after deposition and, together with the primary characteristics, these condition, or define, how a sediment will behave during subsequent burial. Diagenetic modifications include compaction, initially mechanical and then chemical, mineral growth and, in some cases, grain dissolution and development of secondary pores. Porosity and permeability typically decrease as diagenesis progresses. Scanning Electron Microscopy-Energy Dispersive Spectroscopy (SEM-EDS) approaches can be applied to study many aspects of sandstone diagenesis including detrital mineralogy, grain size, sorting, grain shape, grain angularity and matrix content. SEM-EDS is also useful for defining quantities and location in the pore network of cements that are mineralogically distinct from detrital grains (e.g., calcite, dolomite, siderite, or anhydrite). SEM-EDS can be useful for studying clay mineral cements, especially when they occur in patches bigger than 5–10 μm. In sandstones, SEM-EDS is not so useful when the cements are mineralogically identical to detrital grains (e.g., quartz cement in quartz sandstones) where additional signals such as cathodoluminescence (CL) may be required. Macro- and meso-pores can be quantified using SEM-EDS but, on its own, it cannot automatically measure micro-porosity as it is below the minimum 1 µm spatial resolution of the approach. Mechanical compaction, a key process that causes porosity-loss in sandstones, is not easily quantified using SEM-EDS. Nonetheless, together with additional routine techniques, SEM-EDS can be used to solve most problems associated with sandstone diagenesis and reservoir quality.
Introduction
Reservoir quality represents the porosity and permeability of a rock sample in the subsurface. Reservoir quality matters for a number of areas of applied geoscience as porosity controls how much fluid a rock can store (petroleum fluids, CO2, geothermal fluids) and permeability dictates how quickly fluid can be produced from, or injected into, the subsurface (Worden et al., 2018a). Porosity relates to the volume of fluid in a given volume of rock and permeability relates to rate of movement of that fluid under a given pressure gradient. This contribution focusses upon the application of Scanning Electron Microscopy-Energy Dispersive Spectroscopy (SEM-EDS) techniques to sandstone reservoirs in the subsurface although SEM-EDS can be used for the study of carbonate and other reservoirs as well as unconsolidated sand (Wooldridge et al., 2019). The first part of the paper summarises primary and diagenetic controls on sandstone reservoir quality. The second part of the paper provides examples of a variety of different end-member types of sandstone in terms of images produced by SEM-EDS. The third part summarises the advantages and disadvantages of SEM-EDS techniques for the study of sandstone reservoir quality and diagenesis.
The objectives of the paper are, for sandstones, to 1) summarise the main detrital grain types, 2) summarise the main diagenetic mineral cements, 3) summarise the main pore-types, 4) provide illustrative SEM-EDS images of sandstone end-member types, cements and pore-types, 5) detail the main processes that alter the key sandstone reservoir properties of porosity and permeability, 6) explain the advantages of SEM-EDS and highlight where SEM-EDS needs to be accompanied by other analytical techniques. The objective is not to show every way that SEM-EDS analytical data can be generated or used. Nor is the objective to provide the fine details of how to go about an SEM-EDS study. The associated techniques of core analysis, optical petrography, back-scattered electron microscopy, X-ray diffraction analysis, cathodoluminescence microscopy, etc., are also not presented in detail as these have been well-described many times previously (Emery and Robinson, 1993; Moore and Reynolds Jr, 1997; Tiab and Donaldson, 2015).
Sandstone reservoir quality and diagenesis
The detrital minerals in sandstones tend to be dominated by quartz (Q) but feldspar (F) and lithic (L) grains (also known as rock fragments) are common. Sandstones can be classified in terms of their proportions of Q, F, and L. Feldspars are typically either K-feldspar (KAlSi3O8) or sodic plagioclase (NaAlSi3O8). As plagioclase becomes more calcic, it is increasingly rare in sandstones as Ca-feldspar is chemically very reactive during weathering and transport; detrital anorthite (CaAl2Si2O8) is not found in sandstones. Lithics can be further subdivided into three categories: sedimentary, igneous and metamorphic. Sandstones can also be classified in terms of the ratio of brittle (quartz and feldspars) to ductile (clay-rich) grains since this ratio strongly influences compactional behaviour during burial. Sandstones can also contain aragonite or calcite bioclasts if they are deposited in, or adjacent to, limpid and nutrient rich marine environments. Detrital heavy minerals represent a varied group of relatively weathering-resistant minerals including garnet, apatite, zircon, sphene, ilmenite and hornblende. Heavy minerals are typically present at no more than trace quantities that consequently do not influence reservoir quality but can be used to reveal details of sediment provenance.
Sandstone reservoir quality is the end-product of the combination of a sediment’s primary depositional characteristics and the series of secondary processes (Figure 1) that serve to convert the sand into sandstone (Worden and Burley, 2003). These secondary processes are collectively known as diagenesis. Sandstone diagenesis can be subdivided in different ways. Diagenesis includes physical compactional processes due to increasing effective stress as the thickness of overburden increases during progressive basinal subsidence (Paxton et al., 2002). Diagenesis also includes chemical processes that are a response to increasing temperature and effective stress, changing fluid composition and the drive for potentially unstable detrital minerals to attain thermodynamic equilibrium (Worden et al., 2018a). Sandstone properties can be influenced by biological diagenetic processes, especially in the near-surface, soon after deposition (Mcilroy et al., 2003; Needham et al., 2005; Needham et al., 2006; Worden et al., 2006; Wooldridge et al., 2017).
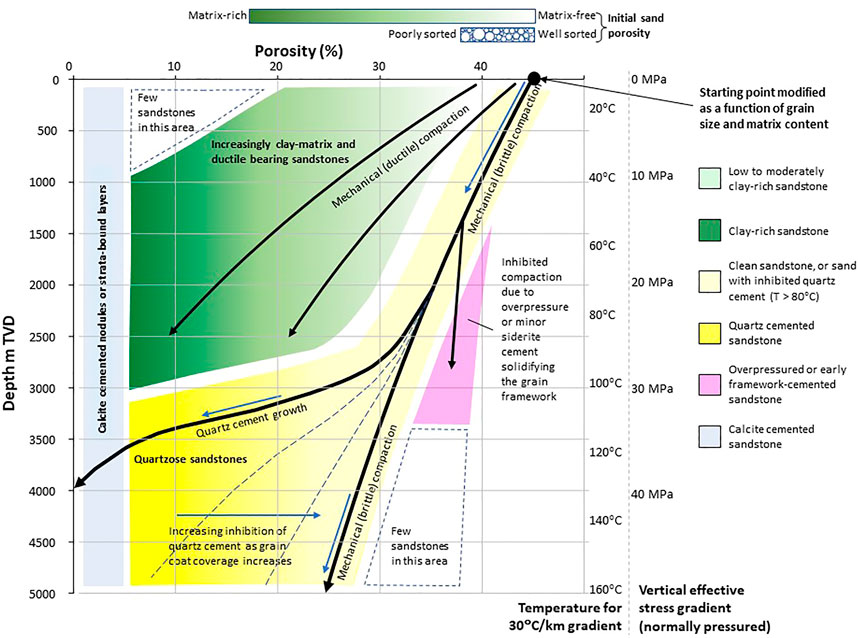
FIGURE 1. Porosity versus depth diagram for sandstones, with a second Y-axis representing temperature for a steady 30°C/km geothermal gradient and a surface temperature of 10°C, plus a third Y-axis representing effective stress for normally pressured porous rocks. Porosity at the time of deposition is a function of sorting and matrix content, with clean, randomly-packed sands having up to about 42%–48% porosity. Poorer sorting leads to lower porosity; more matrix leads to lower porosity. Burial of clean sandstones with few ductile grains or matrix (pale yellow area) reduces porosity to about 26% due to grain rearrangement and the adoption of a rhombohedrally close-packed fabric. Sands rich in weak, ductile grains or matrix (green area) lose porosity more quickly with increasing depth than sands composed of strong grains. Sands with calcite cement tend to acquire the cement soon after deposition and have very low porosity (blue area). Clean sands undergo chemical compaction and quartz cementation once the temperature exceeds about 80°C (bright yellow area). Quartz cement can be inhibited by chlorite-, microquartz- and siderite-grain coats and possibly by early oil emplacement and early overpressure leading to anomalously high porosity deep in sedimentary basins. Early overpressure and the growth a small amounts of framework stabilising cement, such as siderite, inhibit compaction and lead to anomalously high porosity at intermediate depths in sedimentary basins.
Sand-rich sediment’s primary textural attributes are dictated mainly by grain size and sorting (Beard and Weyl, 1973; Blatt et al., 1980; Cade et al., 1994). In sands that are composed of equally sized grains, porosity is grain-size independent but permeability decreases with decreasing grain size as pore throats get progressively narrower (Tiab and Donaldson, 2015) (Figure 2). The porosity of a material that is composed of randomly loose-packed spheres is about 45.4% (Weltje and Alberts, 2011) which is similar to the porosity of cubic-close packed spheres (47.6%) (Graton and Fraser, 1935). These values explain why the porosity in well-sorted natural sands at the time of deposition tends to be about 42%–48% (Beard and Weyl, 1973). Grain size-permeability relations in sands and sandstones can be assessed using Kozeny-Carman-type relationships (Kennedy, 2015). Sorting, a measure of the range of grain sizes in a sample, affects porosity as smaller grains fill the interstices between larger grains (Figure 2). Poor sorting, where there is a large range of grain sizes, also has a major effect on permeability as the small interstitial grains block the pores and lead to smaller pore throats (Beard and Weyl, 1973). The presence and quantity of fine-grained matrix have a major impact on sand properties. Most matrix is detrital (i.e., co-deposited with the sand) or due to in-environment physical and biological processes such as bioturbation, soft-sediment deformation or infiltration. Some matrix results from diagenetic alteration of lithic grains to clay minerals (Worden et al., 1997; Worden et al., 2000); this type of matrix is referred to as pseudomatrix. Matrix is composed of clay minerals and silt. Matrix reduces sandstone porosity and permeability because it blocks pores and pore throats (Armitage et al., 2010; Armitage et al., 2013). The addition of matrix to fine sand can lead to the resulting sandstone having very low porosity (<2%) and permeability (10–22 m2) (Armitage et al., 2011).
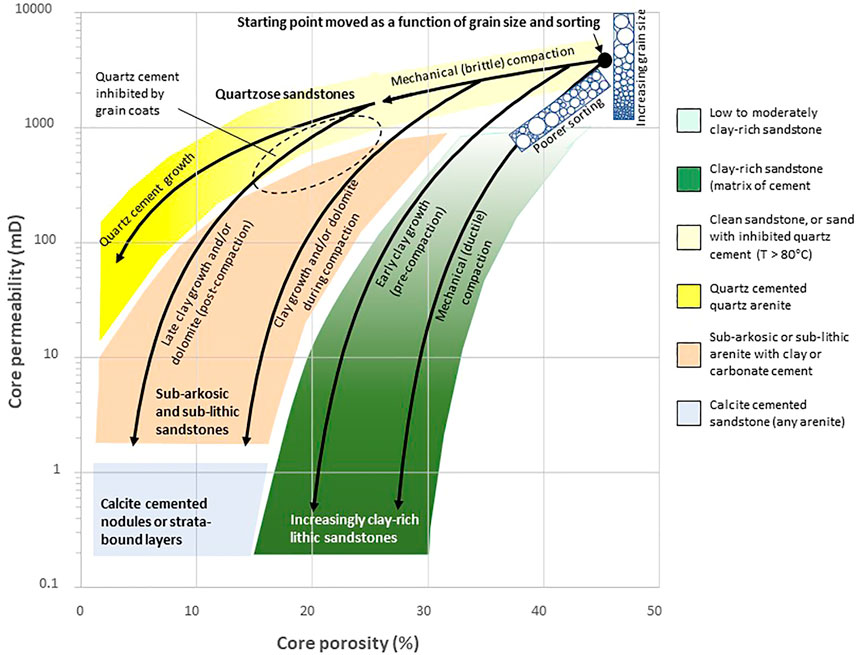
FIGURE 2. Core porosity versus core permeability for sandstones. Porosity and permeability at the time of deposition (large black dot) is a function of sorting (shown by cartoon). Permeability of sand and sandstone is also a function of grain size (also shown by cartoon), with coarser sandstone having higher permeability than fine sandstone. Burial of clean sandstones with few ductile grains or matrix (pale yellow area) reduces porosity to about 26% due to grain rearrangement and the adoption of a rhombohedrally close-packed fabric; permeability also decreases–in this diagram modelled using a Kozeny-Carman equation modified for tortuosity (Tiab and Donaldson, 2015). Sands rich in weak, ductile grains or matrix (green area) and sands with early clay cement lose porosity more quickly with increasing depth than sands composed solely of strong grains and the presence of clay in pore throats leads to very low permeability values even when the porosity is ∼20%. Sands with calcite cement tend to acquire the cement soon after deposition and have very low porosity and permeability (blue area). Clean sands undergo chemical compaction and quartz cementation once the temperature exceeds about 80°C (bright yellow area) with a muted loss of porosity and permeability (Bourbie and Zinszner, 1985). Quartz cement growth can be inhibited by chlorite-, microquartz- and siderite-grain coats (black dashed oval) leading to porosity close to the minimum caused by mechanical compaction and commensurately high permeability deep in sedimentary basins. Intermediate and late clay and carbonate cement growth (pale brown area), during or following mechanical compaction and typical of sub-arkosic and sub-lithic sandstones (Primmer et al., 1997), lead to porosity reduced below 26% and much-reduced permeability.
Mechanical compaction reduces porosity by converting a cubic- or randomly-packed fabric into a rhombohedral-close packed fabric; materials composed of equal-sized spheres that are rhombohedral-close packed have a porosity of 26%, which is the minimum porosity for granular materials (Graton and Fraser, 1935) (Figure 1). Sandstones that have undergone mechanical compaction, and no other processes, have been shown to have a minimum porosity of about 26% (Paxton et al., 2002) showing that much sandstone porosity-loss (from ∼45% to 26%) is simply due to grain repacking as the overburden increases. Mechanical compaction can also include grain rotation and grain slippage in natural sand-dominated sediments that contain non-equant grains and that are imperfectly sorted. Porosity-loss due to mechanical compaction can further include bending or ductile compaction of any weak (clay-rich grains) (Ramm et al., 1997; Worden et al., 2000) and brittle grain fracture, e.g., in deformation bands (Griffiths et al., 2018) (Figure 1). Mechanical compaction due to grain fracturing can also occur in sandstones (Fisher et al., 1999; Makowitz and Milliken, 2003; Umar et al., 2011), with grain fracturing more common in coarse than fine grained sandstones, due to the stress being distributed over fewer point contacts for a given volume of sediment (Griffiths et al., 2018).
Chemical compaction, also known as pressure solution, occurs in sandstones at temperatures greater than about 100°C, in response to elevated effective stress (Sheldon et al., 2003) and local chemical environments (Kristiansen et al., 2011) (Figure 1). Chemical compaction leads to strain, evidenced by macroscopic stylolites and grain-to-grain sutures (Bjørkum et al., 1998; Worden and Burley, 2003; Worden et al., 2018a).
A large number of chemical processes contribute to burial diagenesis in sandstones. Some processes involve dissolution and replacement of unstable aluminosilicate minerals such as K-feldspar, (Wilkinson et al., 2001), plagioclase (Nguyen et al., 2018), muscovite, and biotite (Lawan et al., 2021). These processes typically lead to the growth of clay minerals and the development of secondary porosity. However, K-feldspar (KAlSi3O8) and albite (NaAlSi3O8) cements are not uncommon in arkosic (i.e., feldspar-rich) sandstones (Worden and Rushton, 1992; Schmid et al., 2004) proving that feldspars can be stable minerals in some diagenetic environments.
Carbonate cements are common in sandstones. Early diagenetic, pore-filling calcite (CaCO3) tends to occur in marine sands (Worden, 2006; Worden et al., 2019), where the calcite is probably derived from bioclasts or micrite, and in semi-arid sand-dominated soils and fluvial sediments (Purvis and Wright, 1991) where the calcite is derived from evaporation (calcrete). Early diagenetic dolomite cement [CaMg(CO3)2] can develop in fine grained, arid, sand-dominated soils and fluvial sediments (Schmid et al., 2004,2006) but dolomite is a common characteristic of burial diagenetic sandstones (Worden and Burley, 2003). Burial diagenetic dolomite can be locally Fe-rich, and is known as ankerite when iron accounts for more than 20% of the cations (Boles, 1978). Siderite (FeCO3) cement can develop during early and burial diagenesis; early diagenetic siderite grows in Fe-rich, bicarbonate-rich, sulphide-poor settings typical of some deltaic and fluvial sandstones. Burial diagenetic siderite occurs in Fe-rich sandstones and can develop as an outer rim on ankerite cement or as a discrete phase in sandstones flushed with CO2 during burial (Worden, 2006).
Pore-filling sulphate mineral cements, such as gypsum and anhydrite, can be locally abundant in sand- and silt-stones that are associated with playa deposits (Scorgie et al., 2021) or in sandstones that sit adjacent to evaporites (Sullivan et al., 1994). Natural barite can also be found in trace to low concentrations in sandstone (Gluyas et al., 1997), but if identified it is commonly (and perhaps not always correctly) assumed to be a contaminant from drilling mud when present in drill core. Sulphide minerals, predominantly pyrite, are common in sandstones although they are seldom a reservoir quality problem. Pyrite in sandstones originates from the routine presence of Fe in clastic materials and sulphide derived from sulphate reduction (Worden and Smalley, 2001), either bacterial at low temperature or thermochemical at high temperature, or from sulphur derived from the breakdown of organo-sulphur compounds in oil or kerogen (Worden et al., 2003).
Clay minerals in sandstones originate via many processes. Detrital clay minerals tend to reflect the ambient climate in the hinterland with smectite resulting from a low degree of weathering due to a combination of cold and/or arid climate and rapid transport from hinterland to site of deposition (McKinley et al., 2003). Kaolinite reflects more advanced weathering due to a warmer and wetter climate. Illite is an intermediate clay, between smectite and kaolinite. Very warm and wet climates lead to the formation of Al and Fe-oxides and hydroxides at the expense of clay minerals (Dowey et al., 2017). Chlorite can occur as a detrital clay in sandstones if the parent rock is chlorite-rich (Worden et al., 2020b). Other detrital or early diagenetic Fe-clay minerals, such as berthierine and odinite, tend to grow in marginal marine settings, require a significant supply of Fe, probably from fluvial sources, a lack of aqueous bicarbonate (otherwise siderite would grow) and a lack of sulphate-derived sulphide (otherwise pyrite would grow). Clay minerals become mixed into sand-dominated sediment by bioturbation, the creation of clay coats, infiltration, and soft-sediment deformation.
Early diagenetic kaolinite grows due to feldspar, and possibly mica, breakdown in the presence of low pH and low salinity formation water (Osborne et al., 1994). Relatively few chemical processes happen in most sandstones during the intermediate stages of burial (25–60 or 70°C), apart from kaolinite growth. This temperature range is dominated by the mechanical compaction processes described previously.
Burial diagenetic clay minerals grow as a result of the gradual attainment of thermodynamic equilibrium as temperature increases. Illite and chlorite are the main types of clay minerals that develop during burial diagenesis but the kaolin polymorph dickite can replace kaolinite in potassium-depleted diagenetic environments (Worden and Burley, 2003; Worden and Morad, 2003). Illite cement in sandstone has three main sources: conversion of Al-rich dioctahedral smectite (e.g., montmorillonite), breakdown of K-feldspar and reaction of K-feldspar with kaolinite (Bjørkum and Gjelsvik, 1988; Worden and Morad, 2003). Chlorite cement in sandstone has five main sources: conversion of Fe-Mg-rich trioctahedral smectite (e.g., saponite), reaction of siderite with kaolinite, conversion of berthierine, possibly supplied by Fe-ooids, reaction of Fe-oxides such as ilmenite and the breakdown of Fe-Mg lithics such as volcanic rock fragments (Worden and Morad, 2003; Gould et al., 2010; Worden et al., 2020b; Charlaftis et al., 2021; Griffiths et al., 2021).
Quartz cement growth is the dominant porosity-loss mechanism in sandstones once mechanical compaction has reduced porosity to about 26% (Paxton et al., 2002). Quartz cement develops as syntaxial overgrowths on detrital quartz grains and seems to develop at temperatures greater than about 80°C (Walderhaug, 1990; Ajdukiewicz and Lander, 2010) although there are plenty of examples of low temperature sandstones containing a few percent quartz cement (McKinley et al., 2012). Quartz cement has many possible sources in sandstones (Worden and Morad, 2000) including: feldspar-to-clay breakdown reactions (Bjørkum and Gjelsvik, 1988), smectite-illitisation (McKinley et al., 2003), dissolution of amorphous siliceous bioclasts (Vagle et al., 1994), inter-facies redistribution (Trewin and Fallick, 2000), as well as from quartz dissolution at macro- and micro-stylolites (Heald, 1955). Quartz cement can be inhibited by a number of processes such as the development of chlorite (Pittman and Lumsden, 1968; Worden et al., 2020b; Griffiths et al., 2021), illite (Pittman et al., 1992), microcrystalline quartz (Aase et al., 1996; French et al., 2012; Worden et al., 2012; French and Worden, 2013; French et al., 2021) or siderite (Karim et al., 2010) grain coats, the early emplacement of petroleum fluids (Worden et al., 1998; Worden et al., 2018a; Worden et al., 2018b) and the early development of overpressure (Osborne and Swarbrick, 1999; Nguyen et al., 2013). The effectiveness of oil emplacement and overpressure for the inhibition of quartz cement remains controversial although there are many precedents for both of these effects in well-studied and possible simpler carbonate reservoirs (Worden et al., 2018a).
Methods employed in the SEM-EDS analysis of sandstones
Scanning electron microscopy and energy dispersive spectroscopy (SEM-EDS) can be used to give spatially-resolved mineralogy of sandstone samples, to assist with reservoir quality studies, based on elemental chemistries using polished thin sections (Pirrie et al., 2004; Armitage et al., 2010; Worden et al., 2018c). Details of the methods employed in SEM-EDS studies of sandstones have been described in detail in numerous earlier publications (Armitage et al., 2010; Armitage et al., 2013; Daneshvar and Worden, 2018; Worden et al., 2018c; Allen et al., 2020; Lawan et al., 2021; Scorgie et al., 2021).
Quantitative evaluation of minerals by scanning electron microscopy (QEMSCAN) is the proprietary name for rapid, repeatable automated mineralogical SEM-EDS analysis. The outputs are detailed and repeatable mineral quantification and maps of mineral distribution that reveal the fabric of the rock. The SEM-EDS employed in this study was equipped with two high speed EDS detectors configured to acquire chemical data from secondary X-rays, at spatially pre-defined points, across any polished solid sample. The distance between these points, on any given grid, is user-defined primarily depending on how the data are to be used. As a result of the way that electron beams interact with sample, there is a minimum practical spacing (resolution) of approximately 1 μm. Wider step-sizes between the points are possible, resulting in a pixellated image with lower than optimum spatial resolution, but the calculated mineral proportions are robust even if analytical step size increases. Once a spectrum has been acquired at each point by the EDS detectors, this is then automatically assigned to a mineral definition based on the spectral characteristics and a library of mineral definitions. Each mineral is assigned a colour, and these data points are combined to form a contiguous false colour image of the sample. In addition to the images, the sum of each occurrence of an identified mineral is tabulated so that minerals and groups of minerals may be quantified.
In this series of analyses, we have subdivided chlorite into 11 sub-types based on Fe-Mg proportions. The SEM-EDS employed here therefore identified Fe-chlorite (chamosite) and Mg-chlorite (clinochlore) and nine classes of chlorite between these end-members. The same approach could be employed for other minerals that have extensive solid solution series although, due to thermodynamic reasons, many low temperature minerals found in diagenetic systems tend towards end-member compositions.
In the following sections, some of the dominant controls on sandstone reservoir quality are illustrated via SEM-EDS imaging studies.
Sandstone detrital mineralogy analysed by SEM-EDS
Quartz
Quartz is the dominant mineral in almost all fair-to-good (i.e., greater than about 15% total porosity and 10% effective porosity) reservoir quality sandstones (see Figures 3–14). Some sandstones contain few other minerals apart from detrital quartz. Such sandstones are known as quartz arenites and these tend to have the highest porosity of all sandstones (e.g., Figures 3, 7, 11, 12, 13A) although non-silicate (e.g., carbonate or sulphate minerals) cement growth can lead even quartz arenites to have poor reservoir quality (Figure 11A). Quartz is resistant to weathering except in the most extreme weathering conditions, e.g., as found in laterites (Hill et al., 2000). Successive cycles of uplift, weathering, erosion, transport, and deposition tends to progressively clean sandstones so that younger sediments in any given area tend to be increasingly quartz-rich. Detrital quartz can be monocrystalline or polycrystalline but SEM-EDS cannot differentiate these different types as they are wholly composed of SiO2. SEM-EDS can be used to reveal whether quartz grains are well-rounded (Figures 3A, 5, 10B, 11A,B, 13A), or relatively angular (Figures 4A, 7A,B, 9A,B), with roundness reflecting textural maturity. Detrital quartz can be difficult or impossible to differentiate from quartz cement so that SEM-EDS, on its own, is not usually the ideal technique to quantify quartz cement (e.g., Figures 3B, 14B). The presence of clay coats or semi-continuous dust rims can help to physically distinguish quartz grains and quartz overgrowths.
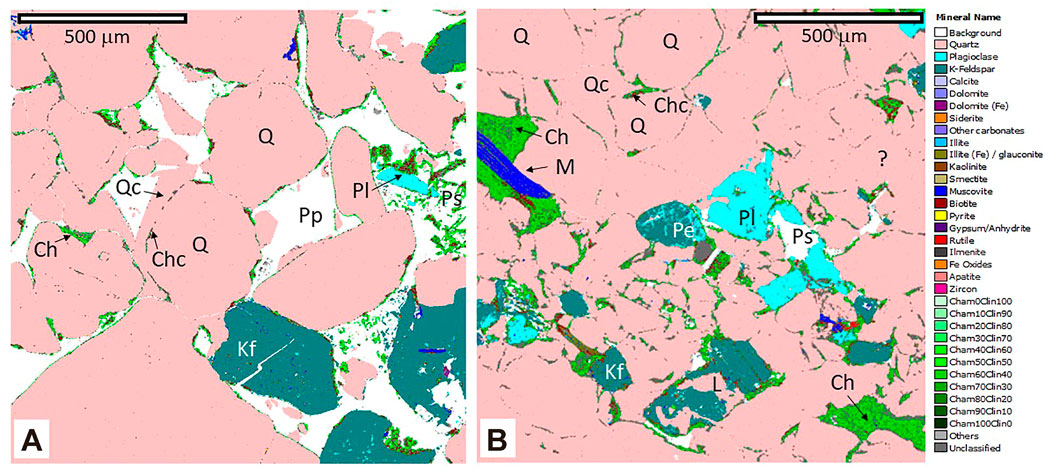
FIGURE 3. Detrital quartz-dominated Lower Jurassic deltaic sandstones from Halten Terrace, Norway, with minor feldspars (mineral colour index on the right hand side). (A) Patchy chlorite coats (Chc) have developed on detrital quartz (Q), K-feldspar (Kf) and plagioclase (PL) grains, leaving about 20% primary porosity (Pp). Quartz (Qc) has grown where there were gaps in the grain coat. Quartz cement can only be discerned from quartz grains by (i) the presence of the grain coat and (ii) the euhedral termination of the cement into the open pore. (B) Chlorite coats (Chc) are less well developed than (A), allowing extensive quartz cement and leaving only about 2% primary porosity but some secondary porosity (Ps) is also present. Quartz cement is generally hard to differentiate from quartz grains, leaving areas of the section containing quartz of unknown origin (e.g., marked by “?”). This sample contains muscovite flakes (M) and patches of pore filling chlorite (Ch). (Legend) The colour scheme for all SEM-EDS images (Figures 3–14) is added to this figure. The approach used in most images follows the method developed by Worden et al. (2018c) to identify eleven types of Fe-Mg-chlorite.
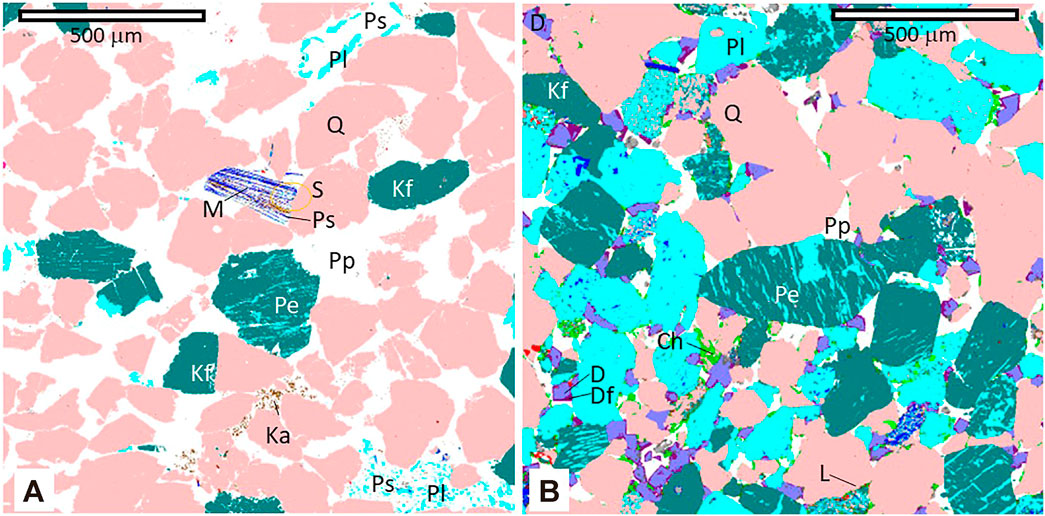
FIGURE 4. Feldspar fabrics in sandstones (mineral colour index in Figure 3). (A) Mid Jurassic mid shoreface sandstone from the North Viking Graben in the North Sea Basin with heavily altered (dissolved) plagioclase (Pl), K-feldspar (Kf) and perthite (Pe) grains undergoing alteration to illite as well as detrital quartz (Q). Dissolution of the plagioclase has led to secondary porosity (Ps). This sandstone has elevated primary porosity (Pp) (25%) as it seems to contain little cement apart from patches of kaolinite (Ka) despite being buried to 2,800 m (85°C). This rock also contains a muscovite grain (M) that has partly delaminated and developed secondary porosity (Ps) partly filled with siderite (S–in orange lozenge) which is close to the limit of resolution of measurement using SEM-EDS: 1 μm. (B) Detrital quartz, K-feldspar, plagioclase- and perthite (Pe) bearing, Lower Triassic continental red-bed sandstone from the Slyne Basin, Ireland, with minor lithic grains (L) and patchy growth of dolomite cement (D) with later ferroan dolomite rims (Df) leaving about 10% primary porosity. This sandstone has been buried to about 4,200 m (130°C) before some uplift (Schmid et al., 2004) and contains 3 to 8 percent each of quartz, K-feldspar and albite cements, that are indistinguishable from detrital host grains using SEM-EDS imaging.
FIGURE 5. (A) Detrital sand from the modern Ravenglass Estuary in NW England (mineral colour index in Figure 3) with sediment sourced from Devonian granite and Ordovician andesites that have undergone low-grade metamorphism. The sediment is quartz (Q)-dominated but contains detrital K-feldspar (Kf), and minor plagioclase (Pl), and a rich assemblage of rock fragments (L) of both granite and meta-andesite provenance. The sand also contains an array of heavy minerals inluding rutile (R), ilmenite (Im) and zircon (Z). (B) Detrital quartz-dominated Lower Jurassic deltaic sandstones from Halten Terrace, Norway (mineral colour index in Figure 3), with minor feldspars, locally pore-filling chlorite (Ch), Fe-ooids (FO) and some remaining primary porosity (Pp). The yellow dashed outline shows the outline of a burrow, possibly Skolithos (Griffiths et al., 2021). The creation of the burrow has disturbed the mineralogy, resulting in a relatively “clean” central burrow fill, an intermediate layer with pores filled with illite (Ilt) and then an outer layer with pore-filling chlorite. SEM-EDS is an ideal way to visualise and understand the relationship between trace fossils and reservoir quality as a function of the burrowing animal reorganising minerals and thus subsequent porosity and permeability after >4,000 m of burial.
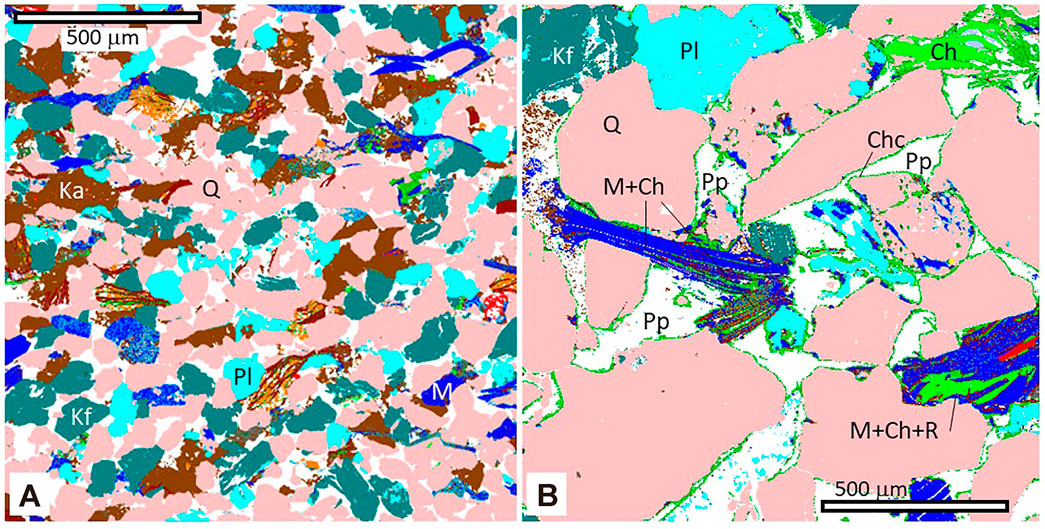
FIGURE 6. Muscovite and detrital chlorite fabrics in sandstones (mineral colour index in Figure 3). (A) Mid Jurassic lower shoreface sandstone from the North Viking Graben in the North Sea Basin with abundant quartz (Q), plagioclase (Pl), K-feldspar (Kf), and muscovite (M) grains. This sandstone contains (12%) primary porosity (Pp). Patches of kaolinite (Ka) are a similar size to grains suggesting the kaolinite has replaced a detrital mineral, such as feldspar. Muscovite (M) grains have bent around more rigid grains during mechanical compaction. (B) Lower Jurassic deltaic sandstone from North Sea, Norway, with quartz, K-feldspar, and plagioclase grains as well as complex intergrowths of muscovite and chlorite (probably metamorphic rock fragments with muscovite: M, chlorite: Ch and rutile: R). Sand grains contain chlorite coats (Chc). Detrital chlorite is more Mg-rich (lighter green) than grain-coating chlorite (darker green).
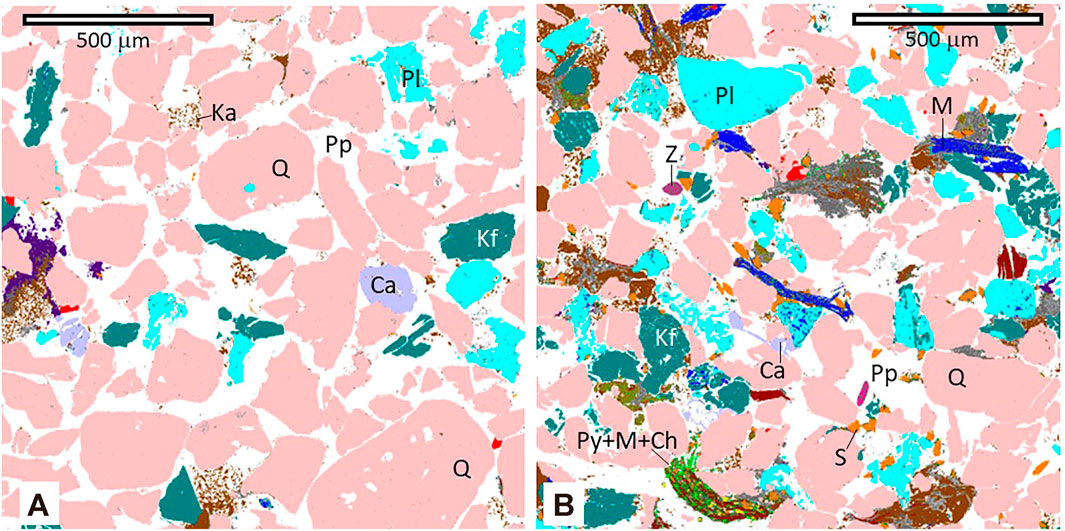
FIGURE 7. Lower Cretaceous marine fan sandstones from the Moray Firth Basin, Central North Sea, United Kingdom (mineral colour index in Figure 3). (A) Poorly-sorted, high porosity sand, rich in quartz (Q) containing grains with a wide variety of grain shapes. Detrital calcite (Ca), K-feldspar (Kf) and plagioclase (Pl) are present. This sandstone has a small amount of kaolinite but little other cement despite being buried to about 2,000 m (72°C). (B) Poorly-sorted, medium porosity, quartz-, lithic-, muscovite (M)-, plagioclase and K-feldspar-bearing sand containing grains with a wide variety of shapes, buried to the same depth as the sample in Figure 7A. Siderite (S) and calcite are present as minor cements. The lower porosity of the sample in 7B compared to 7A is due to the mechanical and chemical breakdown of lithic grains.
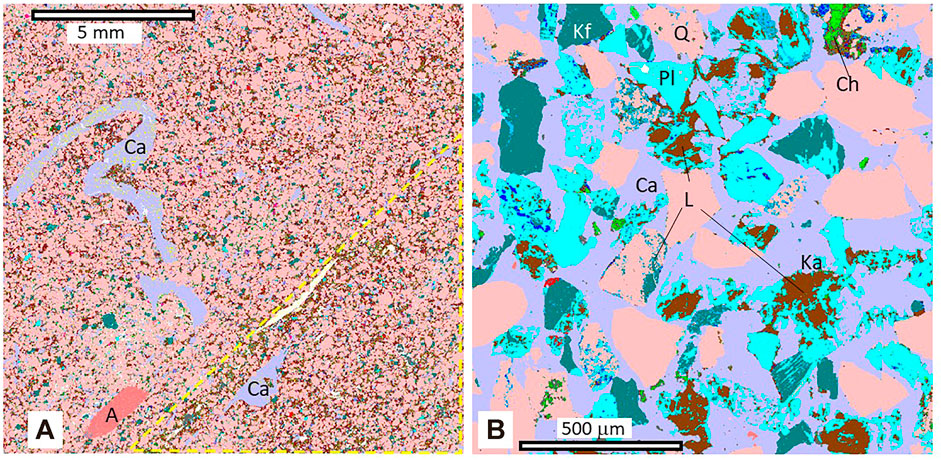
FIGURE 8. Calcite in sandstones (mineral colour index in Figure 3). (A) Low porosity Upper Jurassic shallow marine, quartz-rich sandstone from the Weald Basin with calcite (Ca) present as both recrystallised carbonate bioclasts (see complex shape centre left) and pore-filling cement. The sandstone also contains detrital apatite (A) (probably a tooth or bone fragment) and illite-rich clay-rich patches (yellow dashed outline) that probably represent burrows. (B) Low porosity Upper Triassic deltaic sandstones from the Ordos Basin, China with abundant quatz (Q), plagioclase (PL), K-feldspar (Kf) and lithic (L) grains as well as detrital quartz. The patches of chlorite (Ch) were probably from basic igneous rock fragments. This sandstone is extensively cemented with calcite that has filled both primary and secondary pores.
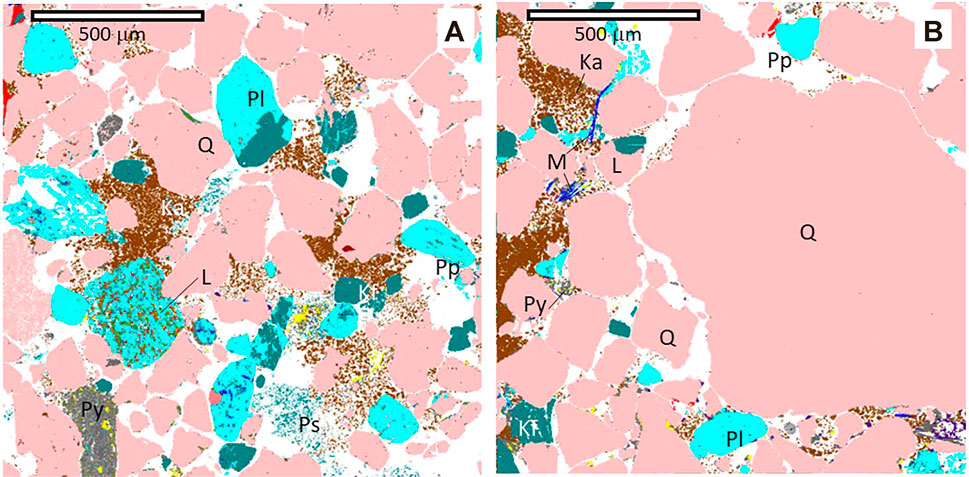
FIGURE 9. Palaeocene marine fan sandstones from the Outer Moray Firth Basin, Central North Sea, United Kingdom (mineral colour index in Figure 3). (A) Moderately-sorted, medium porosity, quartz (Q)-rich sand containing K-feldspar (Kf), plagioclase (Pl), lithic (L) grains and pyritised (Py) grains. There are large patches of kaolinite (Ka) that are approximately grain-sized suggesting that kaolinite has replaced a pre-existing grain (probably K-feldspar). Kaolinite growth seems to be the only significant diagenetic phase despite the sandstones being buried to about 2,000 m (72°C). (B) Very poorly-sorted, low-to medium-porosity, quartz-, plagioclase and K-feldspar- and muscovite (M-bearing sand containing grains with a wide variety of grain sizes. There are large patches of kaolinite that are grain-sized, as in Figure 9A, suggesting that kaolinite has replaced a pre-existing grain (probably K-feldspar). The lower porosity in image 9B compared to 9A is due to the poorer sorting in 9B.
FIGURE 10. Grain size and matrix effects on reservoir quality. (A) Low magnificantion image Lower Triassic aeolian sandstone from the East Irish Sea Basin, United Kingdom with the sand dominated by quartz (Q) with minor K-feldspar (Kf) and dispersed dolomite (D) cement with a outer rim of ferroan dolomite (Df) (mineral colour index in Figure 3). Beds, exemplified by the yellow dashed lines, result from grain flow down the slip face of large Triassic sand dunes. Beds have distinctly different grain sizes. These grain size differences will lead to bed-controlled variations of permeability as the coarser sands have larger pores and pore throats. (B) Triassic continental sandstone from the Irish Sea Basin, United Kingdom, with abundant pore filling muscovite-illite (M/Ilt) and little primary porosity (Pp). The muscovite-illite may have been a depositional component of the sandstones (i.e., matrix) or it may have resulted from the alteration of detrital K-feldspar before petroleum filling stopped this water-induced diagenetic reaction (Woodward and Curtis, 1987; Cowan and Boycott-Brown, 2003).
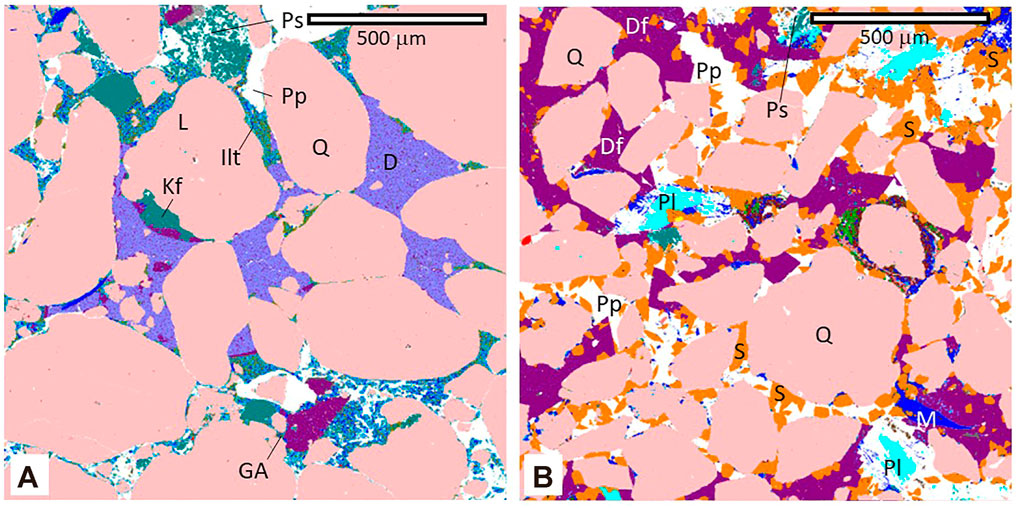
FIGURE 11. Dolomite and other pore-filling cements in sandstones (mineral colour index in Figure 3). (A) Detrital quartz (Q)-dominated Triassic continental red-bed sandstone from the Irish Sea Basin, United Kingdom, with minor K-feldspar (Kf), localised pore filling anhydrite (GA), later pore-filling illite (Ilt) with dolomite (D) cement being the latest mineral to develop. There is little primary porosity (Pp) remaining due to extensive cementation but some secondary porosity (Ps) is present within altered K-feldspar grains. (B) Detrital quartz-dominated Mid Jurassic deltaic sandstones from Halten Terrace, Norway, with minor plagioclase, from a sample at > 4,000 m and approximately 110°C. Extensive grain-coating siderite (S) is present that may have inhibited later quartz cement. Siderite was followed by the growth of pore-filling ferroan dolomite (Df). There are localised patches of remaining primary porosity. There may be localised development of quartz cement in this sample, but it cannot be discerned using SEM-EDS.
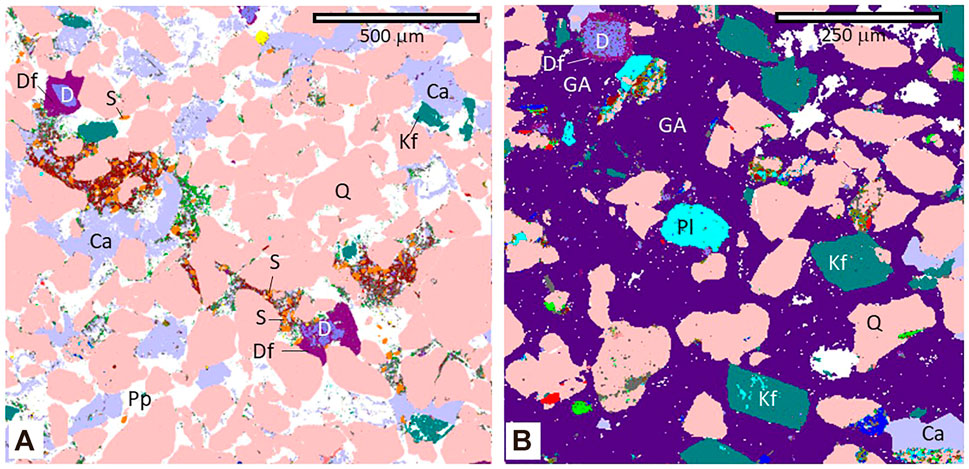
FIGURE 12. Dolomite, calcite and Ca-sulphate in sandstones (mineral colour index in Figure 3). (A) High primary porosity (Pp) Upper Jurassic shallow marine sandstone, dominated by quartz (Q) with minor K-feldspar (Kf) from the Weald Basin. Dolomite (D) occurs as dispersed crystals with ferroan-dolomite (Df) rims and siderite (S) cement sitting on the outer edge of ferroan dolomite. Calcite (Ca) seems to sit on the outer edge of the ferroan dolomite, possibly suggesting that dedolomitisation has occurred. (B) Very fine sandstone from the Tarporley Sitstone Formation, at the base of the Mercia Mudstone Group, that is dominated by quartz with minor K-feldspar, from the East Irish Sea Basin. Dolomite (D) occurs as dispersed crystals with ferroan-dolomite (Df) rims. Calcite (Ca) cement sits on top of ferroan dolomite suggesting that calcite was the last carbonate cement to devlop. Gypsum cement (GA) has developed after the ferroan dolomite and calcite and this sulphate cement has here occluded most of the pores.
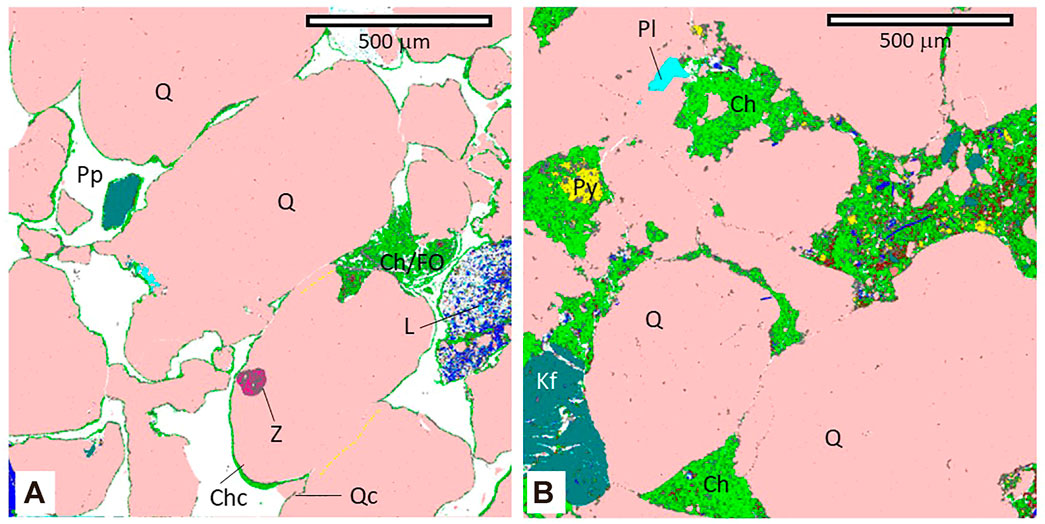
FIGURE 13. Types of chlorite in quartz-dominated Lower Jurassic deltaic sandstones from Halten Terrace, Norway, with minor feldspars (mineral colour index in Figure 3). (A) Well-developed chlorite coats (Chc) occur on most exposed sand-grain surfaces including quartz (Q) and lithics (L) but quartz cement (Qc) has managed to start growing at a small number of sites. An inclusion of zircon is present within one quartz grain. Quartz-quartz grain boundaries (yellow dashed lines) are chlorite-free suggesting that at least some of the chlorite grain coat developed after some degree of compaction. Abundant primary porosity (Pp) remains and there is secondary porosity associated with partly replaced lithic grains (B) Extensive pore-filling chlorite that has probably inhibited quartz cement growth, but it has also occluded the pores resulting in low porosity. Pyrite (Py) is present within some patches of chlorite suggesting that seawater sulphate, converted into sulphide, has competed for some of the available iron and limited chlorite (or Fe-precursor clay) growth.
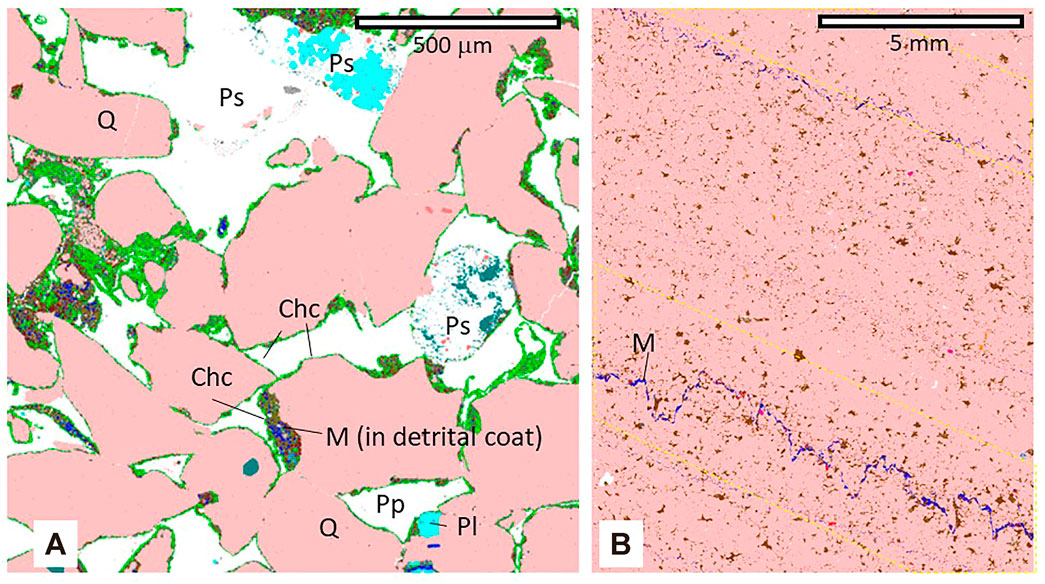
FIGURE 14. (A) Quartz (Q)-dominated Lower Jurassic deltaic sandstones from Halten Terrace, Norway, with minor K-feldspar (Kf) with extensive development of secondary porosity (Ps) due to the dissolution of feldspathic rock fragments. Much primary porosity (Pp) remains. Grains are coated with chlorite (Chc) although the detrital clay coat, preserved within grain embayments, contain muscovite (M) as well as chlorite. The dissolved grains have a patchy chlorite coat suggesting that dissolution occurred at least partly after the creation of chlorite grain coats (mineral colour index in Figure 3). (B) Permian low porosity aeolian sandstone from the Middle East with stylolites (within yellow dashed lines), locally enriched in muscovite (M) providing evidence of chemical compaction due to elevated effective stress. The stylolites are visible as they have concentrated clay minerals, and especially muscovite (M) at the sites of quartz dissolution. It is not possible to differentiate quartz cement and quartz overgrowths in quartz-rich sandstones but the lack of distinguishable porosity using SEM-EDS (note: excluding microporosity) suggests that the solution of quartz at stylolites has led to cementation throughout the rest of the sandstone sample.
Feldspar minerals
Feldspars are the second most important group of minerals in sandstones after quartz. K-feldspar and Na-dominated plagioclase (albite) are common in sandstones. Ca-bearing plagioclase becomes increasingly rare as the ratio of Ca to Na increases as calcic plagioclase undergoes rapid weathering; anorthite (Ca-rich plagioclase) is absent in sandstones. Every sandstone sample in Figures 3–14 contains at least some feldspar grains. K-feldspar and plagioclase can be intergrown, when it is known as perthite, at a range of scales and if the intergrowths are greater than a few micrometres in size, then SEM-EDS is an excellent way to image perthite (Figure 4B). Detrital feldspars variably undergo alteration during diagenesis, and this typically leads to growth of clay minerals and the development of secondary pores (e.g., Figures 3B, 4A, 7A). Feldspars can be present within rock fragments as well as occurring as single minerals. Detrital feldspars can be difficult or impossible to differentiate from K-feldspar or albite cement so that SEM-EDS is not the ideal technique to quantify feldspar cements. For example, the feldspar-rich sandstone in Figure 4B was shown, via optical microscopy, to contain several percent each of K-feldspar and albite cement (Lawan et al., 2021) but this cannot be observed in the SEM-EDS image.
Lithic grains (rock fragments)
Lithic grains (also known as rock fragments) are common in sandstones. Their presence typically leads to much-reduced porosity and permeability (Figures 1, 2) due to enhanced compaction and growth of pore and pore-throat filling clay minerals. Some consider polycrystalline quartz to be a lithic grain but in terms of geochemical and geomechanical behaviour it is not typical of lithic grains. Lithic grains include those of sedimentary, metamorphic, and igneous provenance. SEM-EDS can characterise lithics in terms of sub-crystal size and mineralogy. Quartzo-feldspathic lithics probably represent granitic sources (Figures 3B, 5, 9B, 14A). Clay-mineral and mica-rich lithics possibly represent basaltic, andesitic or pelitic rocks (and metamorphic versions of these) (Figures 6–8, 9B, 10A). Lithics that are rich in clay minerals tend to undergo deformation during burial and can be hard to differentiate from clay-rich matrix using SEM-EDS. Distinguishing quartz- and feldspar-rich lithic grains from fine-grained but compacted discrete grains of quartz and feldspar, can be challenging, possibly leading to reporting an over-abundance of quartz and feldspar grains.
Detrital mica minerals and chlorite
Micas and chlorite can be relatively resistant to weathering and can be directly deposited with quartz-rich sediment. Detrital micas include muscovite and biotite with the former more resistant to weathering than the later and thus more common in sandstones (Figures 3B, 4A, 6A,B, 8B). Micas can delaminate along (001) planes leading to localised microporosity (Figure 4A). Chlorite can occur as discrete flakes (Figure 6B) or be the dominant phyllosilicate in iron-ooids (Figures 5B, 13A). SEM-EDS shows that chlorite can occur as pore-filling matrix that may be detrital or the product of ductile compaction (Figure 13B).
Bioclasts
Detrital calcareous and siliceous bioclasts can occur in sandstones. SEM-EDS is good for studying bioclast-rich sandstones given the typical scales of observation. Routine dissolution of bioclasts lead to growth of pore-filling calcite during diagenesis (Figure 8B), but, in some cases, the original bioclast can be imaged using SEM-EDS (Figure 8A).
Heavy minerals
Heavy minerals typically have high density and, despite their fine grain size, they tend to be deposited early during waning flow. Heavy minerals generally have high density as they routinely contain high atomic number elements such as Zr, Fe, Ti, and Ca. This group of minerals typically represent less than 1% of a bulk sediment. SEM-EDS can be used to study heavy mineral populations, routinely used for provenance analysis and reservoir zone identification. Zircon, tourmaline and chromite are straightforward to image and quantify (Figures 5A, 13).
Sandstone textural controls on reservoir quality analysed by SDEM-EDS
SEM-EDS can be used to great effect for the study of sandstone textures. Grain size has a major effect on permeability in sandstones (Figure 2). Aspects of grain size can easily be determined using SEM-EDS to reveal maximum grain lengths, length-width ratios of grains and grain perimeters. For example, compare fine-grained sandstone in Figure 6A to medium-coarse grained sandstone in Figure 13A. One issue to contend with is that of stereology (Mathews et al., 1997), which is endemic to all studies of texture in thin section. This arises from the fact that grains visible in the image will not typically be sectioned at their greatest width; correction methods are available (Kumara et al., 2017). Differences of grain size in bedded sandstones can easily be determined by SEM-EDS (Figure 10A).
Sorting, a measure of the standard deviation of grain size, can also be easily measured in SEM-EDS images. Sorting has a major effect on porosity and permeability in sandstones (Figures 1, 2). Some sands and sandstones are very well sorted (Figures 4–6, 10A) while others are very poorly sorted (Figures 7A,B, 9A,B).
Angular grains undergo a different style of compaction than rounded grains; the degree of rounding reflects the textural maturity of the initial sand. SEM-EDS can be used to assess angularity. Well-rounded grains are evident in Figures 3A, 5A, 10B, 11A, 13A,B, 14A); angular grains are present in Figures 4A, 7A,B, 9A,B, 12A). However, given that SEM-EDS cannot differentiate quartz cement from quartz grains (and feldspar cement from feldspar grains) without combining the SEM-EDS image with CL images, it is possible that the lack of roundness on some grains may be due to small amounts of syntaxial cement as well as depositional angularity.
Matrix content, defined as the presence of clay mineral-rich masses of material, is an important component of sandstones as it is highly detrimental to permeability (Figure 2). Matrix may be depositional or it may be the result of ductile compaction of clay mineral-rich grains (Worden et al., 2000). Clay mineral-rich grains may be co-depositional with detrital quartz, etc. or they may result from the alteration of lithic (rock) fragments. Figures 3B, 5B, 6A,B, 9A,B, 10B, 13B represent sandstones with pores largely filled with clay minerals that seem to represent matrix. However, the clay minerals in these images are the result of diagenetic modification rather than co-deposition of sand and mud. Figures 3B, 5B, 6B, 13B contain abundant chlorite that was at least partly derived from deformed and highly ductile Fe-ooids. Figures 6A, 9A,B, 10B contain clay minerals that have resulted from breakdown of detrital feldspars (Cowan, 1996; Lawan et al., 2021).
Cements in sandstones analysed by SEM-EDS
Quartz cement
On its own, SEM-EDS, like BSEM imaging, is not ideal for studying the presence or quantity of quartz cement since it typically occurs as syntaxial overgrowths on detrital quartz and the two types of material are identical in terms of composition. There can also be problems uniquely differentiating quartz cement and quartz grains using an optical microscope. The best way to identify and quantify quartz cement in sandstones is to use SEM-CL (Hogg et al., 1992), so that a combination of SEM-EDS and CL imaging offers the optimum route for quantifying quartz cement.
The presence of quartz cement can be identified in SEM-EDS images by the occurrence of euhedral outlines to grains, but it is typically impossible to define the boundary between cement and grain. In some case, a partial rim or coat of clay minerals sits between grain and cement allowing the two to be discerned. Figures 3A,B show a partial chlorite coat sitting between grain and quartz cement. Figure 3B represents a highly quartz cemented sandstone where it is difficult to be sure what is grain and what is cement. Some of the angularity (roughness) of grains in Figure 4B may be due to small amounts of quartz cement but a matching SEM-CL image would be needed to prove this (Lawan et al., 2021).
Carbonate cement: Calcite dolomite and siderite
Carbonate cement can usually be easily imaged and quantified in sandstones using SEM-EDS, but it is typically not possible to automatically differentiate pore-filling and grain-replacing cements. Pore-filling carbonates contribute to intergranular volume (IGV: Sum of remaining primary porosity and pore-filling cement) which is a measure that can be used to help assess how much compactional porosity-loss has occurred (Houseknecht, 1984) so that SEM-EDS may not be useful for determining compactional porosity-loss if carbonate minerals have replaced detrital grains as well as filling pores.
Calcite cement locally fills all pores where it is present in early diagenetic nodules or cemented layers (Figures 1, 2, 8B). Such nodules or layers have high intergranular volumes (e.g., up to 40%) suggesting early (pre-compactional) growth of calcite but such cements can also contain evidence of higher temperature dissolution and reprecipitation (Lawan et al., 2021). SEM-EDS has revealed that the pervasive development of early, and later recrystallised, diagenetic calcite cement is commonly associated with fabrics that seem to suggest there has been preferential dissolution of quartz (Worden et al., 2019). Such fabrics lead to highly irregularly shaped quartz grains that are hard to explain apart from unusually enhanced solution of detrital quartz. The pervasive calcite cement in marine sandstones can be supplied by co-deposited bioclasts (Figure 8A) but clasts of calcite can also occur (Figure 7A). Less commonly, calcite cement can occur as dispersed pore throat-blocking crystals (Figure 12A).
SEM-EDS can be used to show that dolomite cement is routinely present as dispersed crystals that form during mesodiagenesis rather than eodiagenesis in sandstones (Figures 4B, 12A,B). However, dolomite can also be locally pore-filling in discrete patches (Figures 11A,B) although, distinct from calcite, it seldom leads to cm-sized (or bigger) wholly cemented nodules or layers in sandstones. Dolomite can contain substantial quantities of iron that replaces magnesium; SEM-EDS imaging can be used to reveal a typical sequence of dispersed crystals of dolomite superseded by later ferroan dolomite (Figures 12A,B).
Siderite can form during early and later diagenesis as its growth can be a function of fluctuating redox conditions as well supply of raw components. In some cases, the sequence of dolomite followed by ferroan dolomite is superseded by yet another phase of even more Fe-rich carbonate: siderite (Figure 12A). SEM-EDS can be used to show that, in some circumstances, siderite formed earlier than dolomite (Figure 11B). Siderite can form a grain rimming phase that may inhibit quartz cement (Figure 12B) and compaction (Figure 1), or it may occur as a dispersed phase (Figure 7B). SEM-EDS imaging can be used to show that siderite growth can be closely associated with Fe-rich minerals, such as biotite, and iron-rich rock fragments (Figures 4A, 7B).
Sulphate cement: Gypsum, anhydrite
Gypsum and anhydrite occur in sandstones that are usually associated with deposition in evaporitic conditions such as lakes in continental interiors and arid shorelines. It is not easy to differentiate these two minerals using SEM-EDS, but the presence of Ca-sulphate can easily be imaged. SEM-EDS can be used to show that anhydrite can be associated with pore-filling carbonate cement (Figure 11A) or, more rarely, it can occur in such large quantities that it becomes a pore-filling mineral (Figure 12B).
Clay mineral cements in sandstones: Kaolinite, illite, chlorite, berthierine, smectite, and glauconite
Clay minerals usually lead to low porosity as they either facilitate ductile compaction of sandstones or fill primary porosity (Figures 1, 2). Clay minerals also usually lead to low permeability in sandstones. Clay minerals can, in some cases, be at, or below, the resolution of imaging of SEM-EDS. However, where clusters of one type of clay minerals occur then analysis can be unequivocal.
Kaolinite is a simple clay mineral with alternating Si-rich tetrahedral and Al-rich octahedral layers (Moore and Reynolds Jr, 1997). Kaolinite can form high density (low porosity) pore-filling clusters (Figures 6A, 8B) or less compact pore-filling materials that leave abundant microporosity (Figures 9A,B).
Illite has complex structure with tetrahedral-octahedral-tetrahedral sandwiches bonded by potassium and other cations (Moore and Reynolds Jr, 1997). Illite commonly is present in altered lithic grains but can occur as grain-coating material (Gaupp and Okkerman, 2011) or matrix (Figure 10B). It is likely that the illite imaged in Figure 10B contains microporosity (<1 um) so that the absolute quantity of illite in sandstones determined by SEM-EDS is likely an over-estimate.
Chlorite, with a more complex structure still, having tetrahedral-octahedral-tetrahedral sandwiches bonded by extra octahedral layers (Moore and Reynolds Jr, 1997), represents a complex group of minerals in sandstones that can have quite different effects on reservoir quality. Excess pore-filling chlorite (Figure 13B) is as bad for porosity and permeability as any other pore-filling clay. However, where chlorite is present as a grain-coating mineral in deeply buried sandstones, the chlorite coat prevents pervasive pore-occluding quartz cement from forming (Figures 3A, 6B, 13A). If coats are thicker than a few micrometres then SEM-EDS is an ideal tool for appraising chlorite coat occurrence in sandstones. In deeply buried, chlorite-deficient sandstones, quartz cement will grow, possibly locally engulfing any incomplete chlorite coats that were present (Figure 3B). SEM-EDS can differentiate types of chlorite based on their Fe-Mg proportions (Worden et al., 2018c). For example, Figure 6B reveals that detrital chlorite present in lithic grains is significantly more Mg-rich than grain-coating chlorite in the same rock.
Berthierine is an Fe-rich clay mineral with a simple structure with alternating Si-rich tetrahedral and Fe- and Al-rich octahedral layers (Moore and Reynolds Jr, 1997), like kaolinite, but with chlorite-like composition. Berthierine transforms into chlorite during sandstone diagenesis and is best discriminated using XRD approaches rather than SEM-EDS although the Fe-rich composition and prevalence in relatively low temperature sandstones suggests that it should be identifiable (Worden et al., 2018c).
Smectite, with a structure like illite but with layers weakly bonded by water, tends to transform into illite with increasing temperature (Gier et al., 2018). Smectite is not commonly a reservoir quality problem in sandstones deeper than about 2,000 m (McKinley et al., 2003). Smectite can be difficult to discern using SEM-EDS as it has widely variable composition and is commonly intergrown with other minerals. Smectite in silty-mudstone top-seals to carbon capture and storage reservoirs has been quantified using SEM-EDS and related to bulk rock properties derived from core analysis and wireline log analysis (Worden et al., 2020a).
Glauconite has a structure like illite but with some Al replaced by ferric (Fe3+) iron. It is regarded as an indicator of marine deposition. SEM-EDS approaches can differentiate and quantify glauconite in sandstones (Harding et al., 2014; Akinlotan et al., 2021).
Sulphide minerals in sandstones: Pyrite
Pyrite is seldom a reservoir quality problem in sandstones as it rarely exceeds a few percent volume. However, pyrite is the most common sulphide mineral in sandstones, it can locally alter resistivity log responses (Hamada and Al-Awad, 2000), and it can be used to reveal important aspects of the geochemical evolution. SEM-EDS imaging shows that rocks with abundant lithic fragments can contain relatively abundant pyrite (Figures 7B, 9A,B). Pyrite can also be associated with other Fe minerals such as siderite and chlorite (Figure 13B), suggesting that availability of Fe is an important control on abundance of pyrite but presence of reduced sulphur compounds must also be paramount (Worden et al., 2003).
Porosity in sandstones analysed by SEM-EDS
There are various ways to classify porosity in terms of being primary or secondary, inter- or intra-granular, macro, meso or micro, or fracture-related (Worden and Burley, 2003). If it is secondary, porosity can be classified in terms of what mineral it has replaced. SEM-EDS can image porosity by the absence of elements diagnostic of minerals and by the grey scale of backscattered electron images taken of the same area. There are various alternative ways to measure sandstone porosity including core analysis, mercury intrusion porosimetry, use of downhole logging tools (such as a density log), micro-CT imaging and optical petrography linked to point counting.
Macroporosity
Primary pores, those that were present at the time of deposition, can be visualised using SEM-EDS, especially for images collected with a 2 μm or less spacing (Figures 3, 4, 5B, 6, 7, 9–11, 12A, 13A, 14A). However, given the presence of other types of pores, it is not necessarily straightforward to quantify primary porosity using SEM-EDS. Optical petrography, linked to point counting, can best be used to quantify the relative proportions of primary versus secondary porosity.
Secondary pores, those that have been added to a sandstone following dissolution of a detrital component of a sandstone, can be visualised using SEM-EDS. For example, Figures 3A, 4A, 9A, 11A, 14A all contain partially dissolved grains that contain new pores. Although visualisation is possible, it is not a simple process to quantify secondary pores. However, applying a post-analysis point-counting approach, as used in optical petrography, could help SEM-EDS images and data to be used to quantify primary and secondary porosity.
Microporosity
By definition, microporosity cannot be directly measured using SEM-EDS as its resolution is about 1 μm although quantification of porosity using back-scattered electron images in conjunction with SEM-EDS images promises to enable much smaller pores to be discerned and quantified. Application of SEM-EDS to mudstones, for example, typically yields <1% porosity whereas the sum total of micropores can be up to 15 or 16% (Worden et al., 2020a). Total porosity from core analysis measurements has here been compared to SEM-EDS porosity for a suite of sandstones to reveal the importance of microporosity, especially for the lower porosity samples (Figure 15A). The offset between total- and SEM-EDS-porosity is about 5% suggesting that low-porosity samples contain about 5% microporosity. Microporosity is mostly associated with clay minerals so that it may be possible to estimate microporosity after quantifying different clay mineral populations. The 1:1 line and best fit line converge at high porosity suggesting that the best quality sandstones have relatively few clay minerals and thus little microporosity.
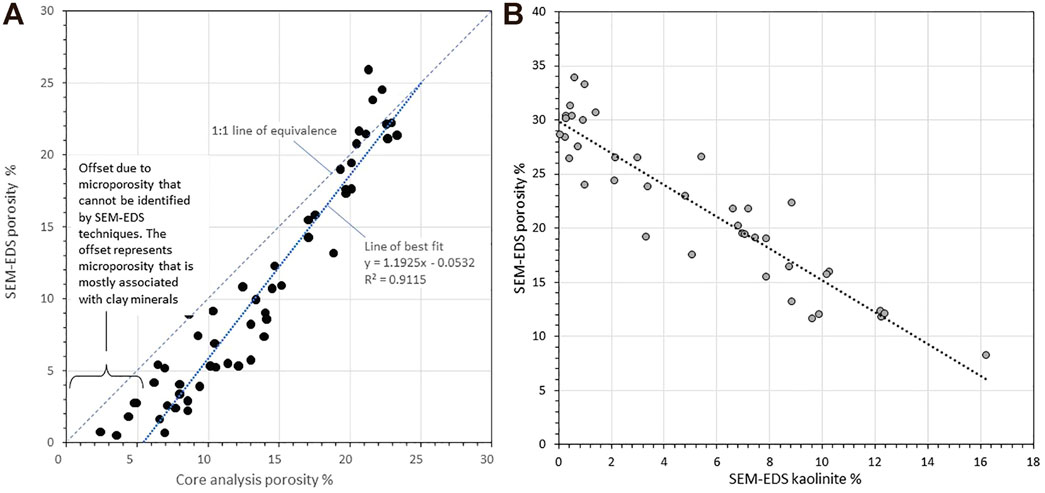
FIGURE 15. Examples of quantitative data that arise from SEM-EDS analysis and their relation to other techniques (A) Comparison of core analysis porosity and SEM-EDS porosity from some Lower Jurassic sandstones from Halten Terrace, Norway (Griffiths et al., 2021). The repeatability of core analysis measurements are typically 0.5%; the SEM-EDS porosity measurements probably have smaller degrees of uncertainty. There is very good agreement between the two measurements of porosity, but the core porosity values tend to be about 5% porosity units higher than the SEM-EDS data at low porosity. This can be explained by the presence of microporosity, especially in the lower porosity samples, that the core data includes but that the SEM-EDS approach cannot measure. The SEM-EDS data probably closely represent effective porosity that contributes to permeability in sandstones. (B) Example of a comparison of quantities of SEM-EDS kaolinite and SEM-EDS porosity from some Middle Jurassic sandstones from the Viking Graben, UKCS (Lawan et al., 2021). Kaolinite is the dominant diagenetic mineral in these rocks; it occurs as a pore-filling diagenetic phase that developed at the expense of K-feldspar and white mica. Kaolinite here developed as the typical form of microporous aggregates (Figure 6). There is good inverse correlation between the two values, suggesting that porosity is lost as pore-filling kaolinite has developed. However, porosity decreased from 34 % to 8% (difference of 26%) at the same time as kaolinite increased from 0 % to 16% (difference of 16%). These quantitative SEM-EDS do not reveal the whole story as 10% porosity-loss remain unaccounted for. To explain the difference in porosity, it is necessary to infer that the more clay-rich sandstones underwent more compactional-porosity-loss than the clay-poor sandstones (Ramm et al., 1997).
Compaction: Can it be studied using SEM-EDS?
Compaction is a dominant reservoir quality-affecting process in most sandstones (Figures 1, 2). Macroscopic chemical compaction can be visualised using SEM-EDS as it leads to stylolites in deeply buried sandstones (Figure 14B). The concentration of remnant clay and sulphide minerals plus organic matter at the site of quartz dissolution allows stylolites to be visualised. Long-grain contacts between quartz grains may result from micro-scale chemical compaction (Figures 3A, 4, 10B, 11A, 13A,B) but SEM-CL imaging and high-resolution backscattered electron imaging would be needed to confirm grain-grain quartz dissolution. Mechanical compaction can be observed using SEM-EDS by the presence of bent mica grains (Figures 6A,B, 7B). The calculation of compactional porosity-loss usually needs an accurate assessment of intergranular volume, requiring quantities of quartz, K-feldspar and albite (Na-plagioclase) cements and remaining primary porosity (Ehrenberg, 1995), so that SEM-EDS is not the ideal tool to quantify the degree or type of compaction.
A comparison of porosity and kaolinite, both derived from SEM-EDS analysis, from Middle Jurassic sandstones from the North Viking Graben in the UK’s Northern North Sea, revealed a good inverse correlation (Figure 15B). This suggests that pore-filling kaolinite is the main cause of porosity-loss, confirming the value of SEM-EDS analysis. However, 26% decrease in porosity is linked to a 16% increase in the amount of kaolinite; there are no other diagenetic minerals that can adequately account for the extra loss of porosity. Instead, it is necessary to understand the fundamental processes involved that control sandstone porosity. A greater quantity of clay mineral leads to enhanced mechanical (ductile) compaction (Ramm et al., 1997), as illustrated schematically in Figure 1. It is possible to infer that increasing quantities of kaolinite not only led to pores being filled but it also led to enhanced mechanical compactional porosity-loss. Simply undertaking SEM-EDS analysis cannot always automatically prove the style and extent of compaction. However, considering SEM-EDS data and having a good knowledge of fundamental controls and processes involved in sandstone diagenesis and reservoir quality, can help lead to the inference of the occurrence, type, and amount of compaction in sandstones.
Overview of use of SEM-EDS for sandstone reservoir quality and diagenesis studies
Advantages of SEM-EDS mineralogy and petrography
The advent of SEM-EDS has given us a tool that provides accurate and repeatable mineralogy determinations. SEM-EDS is less susceptible to the extent of user-experience and sample preparation than XRD techniques for mineral quantification (Moore and Reynolds Jr, 1997). SEM-EDS produces much more accurate mineral proportions than any infrared technique (Breen et al., 2008), including all forms of modern core scanning. SEM-EDS is superior to backscattered electron microscopy, which only has grey scales to differentiate phases for mineral identification and which is not therefore routinely used for mineral quantification. Note that common minerals, including quartz, dolomite and albite, tend to have similar mean atomic number and so have similar grey-scale appearance in backscattered electron images. Cathodoluminescence microscopy can differentiate different forms of quartz (grains and cement) and differentiate types of carbonate cement but, like BSEM, it is not used for quantitative mineral analysis. SEM-EDS competes with routine and well-established optical microscopy and point counting for the determination of mineralogy, grain types, matrix content and pore types. SEM-EDS has much lower errors than point counting (Van Der Plas and Tobi, 1965), it does not require vast experience to differentiate discrete entities observed in the optical microscope, and it is less demanding of operator time.
Besides mineral quantification, SEM-EDS reveals the spatial arrangement of grains, pores, matrix, and some mineral cements. SEM-EDS can reveal the relative timing of growth of different minerals (e.g., Figures 3A,B, 8B, 11A,B, 12A,B). It can reveal the relative preference for one mineral cement, rather than another mineral, sitting adjacent to different detrital mineral grains (e.g., in terms of alteration or grain coats) (Daneshvar and Worden, 2018). Via the use of narrowly-defined chlorite types, in terms of Fe-Mg proportions, SEM-EDS can establish subtly (compositionally) different types of the same mineral and relate them to their position in a sandstone, for example grain, cement, or pore fill (Figure 6B) (Worden et al., 2018c).
SEM-EDS also provides a stepping-stone between mineralogy and a sandstone’s petrophysical and geomechanical properties and core-based sedimentology (Armitage et al., 2010). Relatively low-resolution SEM-EDS mages, such as Figures 5B, 8B, 10A, 14B, provide a link between what a sedimentologist would describe in core and the mineralogical context for the feature. For example, the trace fossil (burrow) imaged in Figure 5B has a distinct zonation of clay minerals that is invisible at the core scale and would be unlikely to be identified by routine optical microscopy. Also, the distinct bedding picked out by grain size variations in Figure 10A is associated with preferential accumulation of dolomite cement in the finer-grained layers; a feature again invisible in core and unlikely to be established by routine point counting.
Micro-CT can provide high resolution images of the internal arrangement of grains, pores, and some mineral cements but it can be difficult to know the mineralogy of phases that have different CT-contrast. SEM-EDS is a useful way of ground-truthing micro-CT images of whole core samples, not least as micro-CT and SEM-EDS tend to have a similar spatial resolution.
Aspects of sandstone diagenesis that cannot be resolved by SEM-EDS alone
One of the biggest problems with the application of SEM-EDS to sandstone reservoir quality and diagenesis studies is that it cannot, on its own, differentiate quartz cement from quartz grains (and K-feldspar cement from K-feldspar grains and albite cement from plagioclase grains). Given that quartz cement is the most important cause of porosity-loss in deeply buried sandstone, this represents a significant shortfall in the capabilities of SEM-EDS. Co-registering of SEM-CL images and SEM-EDS images can help overcome this problem, but detrital quartz grains can have a wide range of luminescence appearances as a function of provenance (Gotte and Richter, 2006) so even this approach is not a straightforward solution.
SEM-EDS is not good at identifying different minerals of the same, or similar, composition. For example, berthierine (7 Å Fe clay) and Fe-rich chlorite (14 Å Fe clay) cannot easily be differentiated; X-ray diffraction is ideally required to make a unique identification of these minerals. Similarly, anhydrite and its hydrous equivalent, gypsum, cannot easily be differentiated; Figure 11A probably contains anhydrite as the rocks are relatively deep and hot whereas Figure 12B probably contains gypsum as the rocks are from about 65 m below the surface.
Primary and secondary porosity cannot easily be automatically differentiated using SEM-EDS (see Figures 3A, 4A, 9A, 11A, 14A) but post-analysis intervention using a point-counting approach could be employed to solve this problem. It is likely that such an intervention could be avoided if an intelligent machine learning/training approach was adopted.
Microporosity cannot be analysed by SEM-EDS on its own (Figure 15A), but it may be possible to make assumptions about different clusters of clay minerals (or clay morphologies) containing different proportions of porosity. Such an approach would need to be carefully backed-up by dedicated research to prove that it is effective (Hurst and Nadeau, 1995).
Mechanical compaction by grain rearrangement causes loss of porosity from depositional values as high as 48% to about 26% (Figure 1). Mechanical compaction is not easily quantified using SEM-EDS as there is no automatic way to determine primary (versus secondary) porosity and the amounts of syntaxial quartz, K-feldspar, and albite cement.
Conclusion
1. SEM-EDS is an excellent tool for reliably and repeatedly quantifying minerals in sandstones.
2. It is an excellent tool for imaging where minerals occur in sandstones relative to bed boundaries, trace fossils, pores, other mineral grains and other mineral cements.
3. SEM-EDS is good at revealing textural attributes of sandstones including grain size, sorting, grain shape, grain angularity and matrix content.
4. In sandstones, SEM-EDS is at its best when the cements are mineralogically distinct from detrital grains (e.g., calcite, dolomite, siderite or anhydrite cemented sandstones or chlorite cemented sandstones where any detrital chlorite in lithics is compositionally distinct from cement).
5. For sandstones in which the cements are mineralogically identical to detrital grains (e.g., quartz cemented quartz-rich sandstones), SEM-EDS needs to be combined with SEM-CL analysis to differentiate grains and cement.
6. SEM-EDS is good at measuring meso- and macro-porosity, with a high degree of correlation with standard core analysis techniques.
7. Routine SEM-EDS cannot automatically measure micro-porosity as it is below the spatial resolution of electron beam-sample interaction and secondary X-ray generation.
8. Mechanical compaction, a key process that causes porosity-loss in sandstones, is not easily quantified using SEM-EDS although the only approach useful for this remains optical petrography and point counting.
9. SEM-EDS is best employed with a range of other techniques such as core analysis, wireline log analysis, point counting, XRD (especially for clay minerals), routine SEM analysis, and SEM-CL analysis (especially to differentiate quartz grains and quartz cement).
10. SEM-EDS is a useful way of ground-truthing micro-CT images of whole core samples
Data availability statement
The raw data supporting the conclusion of this article will be made available by the authors, without undue reservation.
Author contributions
RW wrote the text and prepared figures 1, 2, and 15. JU produced all of the SEM-EDS images, derived the method for discerning 11 types of chlorite and commented in detail on the text.
Acknowledgments
The QEMSCAN SEM-EDS used in this study was kindly supplied by FEI. We especially thank Alan Butcher for his vision for the Liverpool Diagenesis Group promoting the application of SEM-EDS approaches to the characterisation of rocks exploited for resource extraction and carbon capture and storage.
Conflict of interest
The authors declare that the research was conducted in the absence of any commercial or financial relationships that could be construed as a potential conflict of interest.
Publisher’s note
All claims expressed in this article are solely those of the authors and do not necessarily represent those of their affiliated organizations, or those of the publisher, the editors and the reviewers. Any product that may be evaluated in this article, or claim that may be made by its manufacturer, is not guaranteed or endorsed by the publisher.
References
Aase, N. E., Bjørkum, P. A., and Nadeau, P. H. (1996). The effect of grain-coating microquartz on preservation of reservoir porosity. Am. Assoc. Petroleum Geol. Bull. 80 (10), 1654–1673. doi:10.1306/64EDA0F0-1724-11D7-8645000102C1865D
Ajdukiewicz, J. M., and Lander, R. H. (2010). Sandstone reservoir quality prediction: The state of the art. Am. Assoc. Petroleum Geol. Bull. 94 (8), 1083–1091. doi:10.1306/intro060110
Akinlotan, O. O., Adepehin, E. J., Rogers, G. H., and Drumm, E. C. (2021). Provenance, palaeoclimate and palaeoenvironments of a non-marine Lower Cretaceous facies: Petrographic evidence from the Wealden succession. Sediment. Geol. 415, 105848. doi:10.1016/j.sedgeo.2020.105848
Allen, M. J., Faulkner, D. R., Worden, R. H., Rice-Birchall, E., Katirtsidis, N., and Utley, J. E. P. (2020). Geomechanical and petrographic assessment of a CO2 storage site: Application to the Acorn CO2 Storage Site, offshore United Kingdom. Int. J. Greenh. Gas Control 94, 102923. doi:10.1016/j.ijggc.2019.102923
Armitage, P. J., Faulkner, D. R., Worden, R. H., Aplin, A. C., Butcher, A. R., and Iliffe, J. (2011). Experimental measurement of, and controls on, permeability and permeability anisotropy of caprocks from the CO2 storage project at the Krechba Field, Algeria. J. Geophys. Res. 116, B12208. doi:10.1029/2011jb008385
Armitage, P. J., Worden, R. H., Faulkner, D. R., Aplin, A. C., Butcher, A. R., and Espie, A. A. (2013). Mercia Mudstone Formation caprock to carbon capture and storage sites: Petrology and petrophysical characteristics. J. Geol. Soc. 170 (1), 119–132. doi:10.1144/jgs2012-049
Armitage, P. J., Worden, R. H., Faulkner, D. R., Aplin, A. C., Butcher, A. R., and Iliffe, J. (2010). Diagenetic and sedimentary controls on porosity in Lower Carboniferous fine-grained lithologies, Krechba field, Algeria: A petrological study of a caprock to a carbon capture site. Mar. Petroleum Geol. 27 (7), 1395–1410. doi:10.1016/j.marpetgeo.2010.03.018
Beard, D. C., and Weyl, P. K. (1973). Influence of texture on porosity and permeability of unconsolidated sand. Am. Assoc. Petroleum Geol. Bull. 57, 349–369. doi:10.1306/819A4272-16C5-11D7-8645000102C1865D
Bjørkum, P. A., and Gjelsvik, N. (1988). An isochemical model for formation of authigenic kaolinite, K-feldspar and illite in sandstones. J. Sediment. Petrology 58, 506–511. doi:10.1306/212F8DD2-2B24-11D7-8648000102C1865D
Bjørkum, P. A., Oelkers, E. H., Nadeau, P. H., Walderhaug, O., and Murphy, W. M. (1998). Porosity prediction in quartzose sandstones as a function of time, temperature, depth, stylolite frequency, and hydrocarbon saturation. Am. Assoc. Petroleum Geol. Bull. 82 (4), 637–648. doi:10.1306/1D9BC5CF-172D-11D7-8645000102C1865D
Blatt, H., Middleton, G., and Murray, R. (1980). Origin of sedimentary rocks. New Jersey: Prentice-Hall.
Boles, J. R. (1978). Active ankerite cementation in the subsurface Eocene of Southwest Texas. Contr. Mineral. Pet. 68 (1), 13–22. doi:10.1007/bf00375443
Bourbie, T., and Zinszner, B. (1985). Hydraulic and acoustic properties as a function of porosity in Fontainebleau Sandstone. J. Geophys. Res. 90 (13), 11524–11532. doi:10.1029/jb090ib13p11524
Breen, C., Clegg, F., Herron, M. M., Hild, G. P., Hillier, S., Hughes, T., et al. (2008). Bulk mineralogical characterisation of oilfield reservoir rocks and sandstones using diffuse reflectance infrared fourier transform spectroscopy and partial least squares analysis. J. Petroleum Sci. Eng. 60, 1–17. doi:10.1016/j.petrol.2007.05.001
Cade, C. A., Evans, I. J., and Bryant, S. L. (1994). Analysis of permeability controls: A new approach. Clay Min. 29 (4), 491–501. doi:10.1180/claymin.1994.029.4.08
Charlaftis, D., Jones, S. J., Dobson, K. J., Crouch, J., and Acikalin, S. (2021). Experimental study of chlorite authigenesis and influence on porosity maintenance in sandstones. J. Sediment. Res. 91 (2), 197–212. doi:10.2110/jsr.2020.122
Cowan, G., and Boycott-Brown, T. (2003). “The North morecambe field, block 110/2a, East Irish Sea,” in United Kingdom oil and gas fields, commemerative millenium. Editors J. Gluyas, and H. M. Hichens (London: The Geological Society), Memoir 20, 97–105. doi:10.1144/gsl.mem.2003.020.01.08
Cowan, G. (1996). The development of the North Morecambe gas field, East Irish Sea Basin, UK. Pet. Geosci. 2 (1), 43–52. doi:10.1144/petgeo.2.1.43
Daneshvar, E., and Worden, R. H. (2018). “Feldspar alteration and Fe minerals: Origin, distribution and implications for sandstone reservoir quality in estuarine sediments,” in Reservoir quality of clastic and carbonate rocks: Analysis, modelling and prediction. Editors P. J. Armitage, A. R. Butcher, J. M. Churchill, A. E. Csoma, C. Hollis, R. H. Landeret al. (Geological Society London Special Publications), Vol. 435, 123–139. doi:10.1144/sp435.17
Dowey, P. J., Worden, R. H., Utley, J., and Hodgson, D. M. (2017). Sedimentary controls on modern sand grain coat formation. Sediment. Geol. 353, 46–63. doi:10.1016/j.sedgeo.2017.03.001
Ehrenberg, S. N. (1995). Measuring sandstone compaction from modal analyses of thin sections; how to do it and what the results mean. J. Sediment. Res. 65 (2), 369–379. doi:10.1306/d42680c7-2b26-11d7-8648000102c1865d
Emery, D., and Robinson, A. G. (1993). Inorganic geochemistry: Application to petroleum geology. Oxford: Blackwell.
Fisher, Q. J., Casey, M., Clennell, M., and Knipe, R. J. (1999). Mechanical compaction of deeply buried sandstones of the North Sea. Mar. Petroleum Geol. 16 (7), 605–618. doi:10.1016/s0264-8172(99)00044-6
French, M. W., Worden, R. H., King, H. E., Horn, W. C., Lamberti, W. A., and Shosa, J. D. (2021). The origin of silica cements revealed by spatially resolved oxygen isotope microanalysis and electron-beam microscopy; Heidelberg Formation, Germany. Geochimica Cosmochimica Acta 309, 57–78. doi:10.1016/j.gca.2021.06.019
French, M. W., Worden, R. H., Mariani, E., Larese, R. E., Mueller, R. R., and Kliewer, C. E. (2012). Microcrystalline quartz generation and the preservation of porosity in sandstones: Evidence from the Upper Cretaceous of the subhercynian basin, Germany. J. Sediment. Res. 82 (5-6), 422–434. doi:10.2110/jsr.2012.39
French, M. W., and Worden, R. H. (2013). Orientation of microcrystalline quartz in the Fontainebleau Formation, Paris Basin and why it preserves porosity. Sediment. Geol. 284-285, 149–158. doi:10.1016/j.sedgeo.2012.12.004
Gaupp, R., and Okkerman, J. A. (2011). “Diagenesis and reservoir quality of Rotliegend sandstones in the northern Netherlands-A Review,” in Permian rotliegend of The Netherlands. Editors J. Grotsch, and R. Gaupp (Tulsa: SEPM Society for Sedimentary Geology), 193–226. doi:10.2110/pec.11.98.0193
Gier, S., Worden, R. H., and Krois, P. (2018). “Comparing clay mineral diagenesis in interbedded sandstones and mudstones, Vienna Basin, Austria,” in Reservoir quality of clastic and carbonate rocks: Analysis, modelling and prediction. Editors P. J. Armitage, A. Butcher, J. Churchill, A. Csoma, C. Hollis, R. H. Landeret al. (Geological Society London Special Publications), Vol. 435, 389–403. doi:10.1144/sp435.9
Gluyas, J., Jolley, L., and Primmer, T. (1997). Element mobility during diagenesis: Sulphate cementation of rotliegend sandstones, southern North Sea. Mar. Petroleum Geol. 14 (7-8), 1001–1011. doi:10.1016/s0264-8172(97)00038-x
Götte, T., and Richter, D. K. (2006). Cathodoluminescence characterization of quartz particles in mature arenites. Sedimentology 53 (6), 1347–1359. doi:10.1111/j.1365-3091.2006.00818.x
Gould, K., Pe-Piper, G., and Piper, D. J. W. (2010). Relationship of diagenetic chlorite rims to depositional facies in Lower Cretaceous reservoir sandstones of the Scotian Basin. Sedimentology 57 (2), 587–610. doi:10.1111/j.1365-3091.2009.01106.x
Graton, L. C., and Fraser, H. J. (1935). Systematic packing of spheres: With particular relation to porosity and permeability. J. Geol. 43 (8), 785–909. doi:10.1086/624386
Griffiths, J., Faulkner, D. R., Edwards, A. P., and Worden, R. H. (2018). “Deformation band development as a function of intrinsic host-rock properties in Triassic Sherwood Sandstone,” in Reservoir quality of clastic and carbonate rocks: Analysis, modelling and prediction. Editors P. J. Armitage, A. Butcher, J. Churchill, A. Csoma, C. Hollis, R. H. Lander, J. Ommaet al. (Geological Society London Special Publications), Vol. 435, 161–176. doi:10.1144/sp435.11
Griffiths, J., Worden, R. H., Utley, J. E. P., Brostrøm, C., Martinius, A. W., Lawan, A. Y., et al. (2021). Origin and distribution of grain-coating and pore-filling chlorite in deltaic sandstones for reservoir quality assessment. Mar. Petroleum Geol. 134, 105326. doi:10.1016/j.marpetgeo.2021.105326
Hamada, G., and Al-Awad, M. N. J. (2000). Petrophysical evaluation of low resistivity sandstone reservoirs. J. Can. Petroleum Technol. 39 (7), 7–14. doi:10.2118/00-07-tn
Harding, S. C., Nash, B. P., Petersen, E. U., Ekdale, A. A., Bradbury, C. D., and Dyar, M. D. (2014). Mineralogy and geochemistry of the main glauconite bed in the Middle Eocene of Texas: Paleoenvironmental implications for the verdine facies. Plos One 9 (2), e87656. doi:10.1371/journal.pone.0087656
Hill, I. G., Worden, R. H., and Meighan, I. G. (2000). Geochemical evolution of a palaeolaterite: The Interbasaltic Formation, Northern Ireland. Chem. Geol. 166 (1-2), 65–84. doi:10.1016/s0009-2541(99)00179-5
Hogg, A. J. C., Sellier, E., and Jourdan, A. (1992). “Cathodoluminescence of quartz cements in Brent Group sandstones, Alwyn South, UK North Sea,” in Geology of the brent group. . Editors A. C. Morton, R. S. Haszeldine, M. R. Giles, and S. Brown (Geological Society London Special Publications), Vol. 61, 421–440. doi:10.1144/gsl.sp.1992.061.01.21
Houseknecht, D. W. (1984). Influence of grain-size and temperature on intergranular pressure solution, quartz cementation and porosity in quartzose sandstones. J. Sediment. Petrology 54 (2), 348–361. doi:10.1306/212F8418-2B24-11D7-8648000102C1865D
Hurst, A., and Nadeau, P. H. (1995). Clay microporosity in reservoir sandstones - an application of quantitative electron-microscopy in petrophysical evaluation. Am. Assoc. Petroleum Geol. Bull. 79 (4), 563–573. doi:10.1306/8D2B1598-171E-11D7-8645000102C1865D
Karim, A., Pe-Piper, G., and Piper, D. J. W. (2010). Controls on diagenesis of Lower Cretaceous reservoir sandstones in the Western Sable Subbasin, offshore Nova Scotia. Sediment. Geol. 224 (1-4), 65–83. doi:10.1016/j.sedgeo.2009.12.010
Kristiansen, K., Valtiner, M., Greene, G. W., Boles, J. R., and Israelachvili, J. N. (2011). Pressure solution - the importance of the electrochemical surface potentials. Geochimica Cosmochimica Acta 75 (22), 6882–6892. doi:10.1016/j.gca.2011.09.019
Kumara, J. J., Hayano, K., and Kikuchi, Y. (2017). Evaluation of area- and volume-based gradations of sand-crushed stone mixture by 2D images. KSCE J. Civ. Eng. 21 (3), 774–781. doi:10.1007/s12205-016-1765-x
Lawan, A. Y., Worden, R. H., Utley, J. E. P., and Crowley, S. F. (2021). Sedimentological and diagenetic controls on the reservoir quality of marginal marine sandstones buried to moderate depths and temperatures: Brent Province, UK North Sea. Mar. Petroleum Geol. 128, 104993. doi:10.1016/j.marpetgeo.2021.104993
Makowitz, A., and Milliken, K. L. (2003). Quantification of brittle deformation in burial compaction, Frio and Mount Simon Formation sandstones. J. Sediment. Res. 73 (6), 1007–1021. doi:10.1306/051003731007
Mathews, T., Matthews, G. P., Ridgway, C. J., and Moss, A. K. (1997). Measurement of void size correlation in inhomogeneous porous media. Transp. Porous Media 28 (2), 135–158. doi:10.1023/a:1006570830804
McIlroy, D., Worden, R. H., and Needham, S. J. (2003). Faeces, clay minerals and reservoir potential. J. Geol. Soc. 160, 489–493. doi:10.1144/0016-764902-141
McKinley, J. M., Ruffell, A. H., and Worden, R. H. (2012). “An integrated stratigraphic, petrophysical, geochemical and geostatistical approach to the understanding of burial diagenesis: Triassic Sherwood Sandstone Group, South Yorkshire, UK,” in Linking diagenesis to sequence stratigraphy of sedimentary rocks, Special Publication of the International Association of Sedimentologists. Editors S. Morad, M. Ketzer, and F. De Ros (Chicester: Wiley), 231–256. doi:10.1002/9781118485347.ch10
McKinley, J. M., Worden, R. H., and Ruffell, A. H. (2003). “Smectite in sandstones: A review of the controls on occurrence and behaviour during diagenesis,”in Clay mineral cements in sandstones, special publication of the international association of sedimentologists. Editors R. H. Worden, and S. Morad (Oxford: Blackwells), Vol. 34, 109–128. doi:10.1002/9781444304336.ch5
Moore, D. M., and Reynolds, R. C. (1997). X-ray diffraction and the identification and analysis of clay minerals. Oxford: Oxford University Press.
Needham, S. J., Worden, R. H., and Cuadros, J. (2006). Sediment ingestion by worms and the production of bio-clays: A study of macrobiologically enhanced weathering and early diagenetic processes. Sedimentology 53 (3), 567–579. doi:10.1111/j.1365-3091.2006.00781.x
Needham, S. J., Worden, R. H., and McIlroy, D. (2005). Experimental production of clay rims by macrobiotic sediment ingestion and excretion processes. J. Sediment. Res. 75 (6), 1028–1037. doi:10.2110/jsr.2005.078
Nguyen, B. T. T., Jones, S. J., Goulty, N. R., Middleton, A. J., Grant, N., Ferguson, A., et al. (2013). The role of fluid pressure and diagenetic cements for porosity preservation in Triassic fluvial reservoirs of the Central Graben, North Sea. Am. Assoc. Petroleum Geol. Bull. 97 (8), 1273–1302. doi:10.1306/01151311163
Nguyen, D. T., Horton, R. A., and Kaess, A. B. (2018). “Diagenesis, plagioclase dissolution and preservation of porosity in Eocene and Oligocene sandstones at the Greeley oil field, southern San Joaquin basin, California, USA,” in Reservoir quality of clastic and carbonate rocks: Analysis, modelling and prediction. Editors P. J. Armitage, A. Butcher, J. Churchill, A. Csoma, C. Hollis, R. H. Landeret al. (Geological Society London Special Publications), Vol. 435, 265–282. doi:10.1144/sp435.14Sp
Osborne, M., Haszeldine, R. S., and Fallick, A. E. (1994). Variation in kaolinite morphology with growth temperature in isotopically mixed pore-fluids, Brent Group, UK North Sea. Clay Min. 29 (4), 591–608. doi:10.1180/claymin.1994.029.4.15
Osborne, M. J., and Swarbrick, R. E. (1999). Diagenesis in North Sea HPHT clastic reservoirs - consequences for porosity and overpressure prediction. Mar. Petroleum Geol. 16 (4), 337–353. doi:10.1016/s0264-8172(98)00043-9
Paxton, S. T., Szabo, J. O., Ajdukiewicz, J. M., and Klimentidis, R. E. (2002). Construction of an intergranular volume compaction curve for evaluating and predicting compaction and porosity loss in rigid-grain sandstone reservoirs. Am. Assoc. Petroleum Geol. Bull. 86 (12), 2047–2067. doi:10.1306/61EEDDFA-173E-11D7-8645000102C1865D
Pirrie, D., Butcher, A. R., Power, M. R., Gottlieb, P., and Miller, G. L. (2004). “Rapid quantitative mineral and phase analysis using automated scanning electron microscopy (QemSCAN); potential applications in forensic geoscience,” in Forensic geoscience: Principles, techniques and applications. Editors K. Pye, and D. J. Croft (London: Geological Society), 232, 123–136. doi:10.1144/gsl.sp.2004.232.01.12Sp
Pittman, E. D., Larese, R. E., and Heald, M. T. (1992). “Clay coats: Occurrence and relevance to preservation of porosity in sandstones,” in Origin, diagenesis and petrophysics of clay minerals in sandstones. Editors D. W. Houseknecht, and E. D. Pittman (Tulsa: SEPM Special Publication), Vol. 47, 241–255. doi:10.2110/pec.92.47.0241
Pittman, E. D., and Lumsden, D. N. (1968). Relationship between chlorite coatings on quartz grains and porosity, Spiro Sand, Oklahoma. J. Sediment. Res. 38 (2), 668–670. doi:10.1306/74d71a28-2b21-11d7-8648000102c1865d
Plas, L., and Tobi, A. C. (1965). A chart for judging the reliability of point counting results. Am. J. Sci. 263, 87–90. doi:10.2475/ajs.263.1.87
Primmer, T. J., Cade, C. A., Evans, J., Gluyas, J., Hopkins, M. S., Oxtoby, N., et al. (1997). “Global patterns in sandstone diagenesis: application to reservoir quality prediction for petroleum exploration,” in Reservoir quality prediction in sandstones and carbonates. Editors J. A. Kupecz, J. Gluyas, and S. Bloch (AAPG Memoir), Vol. 69, 61–78. doi:10.1306/M69613C5
Purvis, K., and Wright, V. P. (1991). Calcretes related to phreatophytic vegetation from the Middle Triassic Otter Sandstone of south west England. Sedimentology 38 (3), 539–551. doi:10.1111/j.1365-3091.1991.tb00366.x
Ramm, M., Forsberg, A. W., and Jahren, J. (1997). “Porosity-depth trends in deeply buried upper jurassic reservoirs in the Norwegian central graben: An example of porosity preservation beneath the normal economic basement by grain coating microquartz,” in Reservoir quality prediction in sandstones and carbonates. Editors J. A. Kupecz, J. Gluyas, and S. Bloch (AAPG Memoir), Vol. 69, 177–200. doi:10.1306/M69613C12
Schmid, S., Worden, R. H., and Fisher, Q. J. (2004). Diagenesis and reservoir quality of the sherwood sandstone (Triassic), Corrib field, Slyne Basin, west of Ireland. Mar. Petroleum Geol. 21 (3), 299–315. doi:10.1016/j.marpetgeo.2003.11.015
Schmid, S., Worden, R. H., and Fisher, Q. J. (2006). Sedimentary facies and the context of dolocrete in the Lower Triassic Sherwood Sandstone Group: Corrib field west of Ireland. Sediment. Geol. 187 (3-4), 205–227. doi:10.1016/j.sedgeo.2005.12.028
Scorgie, J. C., Worden, R. H., Utley, J. E. P., and Roche, I. P. (2021). Reservoir quality and diagenesis of Triassic sandstones and siltstones from arid fluvial and playa margin environments: A study of one of the UK's earliest producing oilfields. Mar. Petroleum Geol. 131, 105154. doi:10.1016/j.marpetgeo.2021.105154
Sheldon, H. A., Wheeler, J., Worden, R. H., and Cheadle, M. J. (2003). An analysis of the roles of stress, temperature, and pH in chemical compaction of sandstones. J. Sediment. Res. 73 (1), 64–71. doi:10.1306/070802730064
Sullivan, M. D., Haszeldine, R. S., Boyce, A. J., Rogers, G., and Fallick, A. E. (1994). Late anhydrite cements mark basin inversion: Isotopic and formation water evidence, Rotliegend Sandstone, North Sea. Mar. Petroleum Geol. 11 (1), 46–54. doi:10.1016/0264-8172(94)90008-6
Trewin, N. H., and Fallick, A. E. (2000). “Quartz cement origins and budget in the Tumblagooda Sandstone, Western Australia,” in Quartz cement in sandstone. Special publication of the international association of sedimentologists. Editors R. H. Worden, and S. Morad (Oxford: Blackwells), Vol. 29, 219–229. doi:10.1002/9781444304237.ch15
Umar, M., Friis, H., Khan, A. S., Kassi, A. M., and Kasi, A. K. (2011). The effects of diagenesis on the reservoir characters in sandstones of the late Cretaceous Pab Formation, Kirthar fold belt, southern Pakistan. J. Asian Earth Sci. 40 (2), 622–635. doi:10.1016/j.jseaes.2010.10.014
Vagle, G. B., Hurst, A., and Dypvik, H. (1994). Origin of quartz cements in some sandstones from the Jurassic of the inner Moray Firth (UK). Sedimentology 41 (2), 363–377. doi:10.1111/j.1365-3091.1994.tb01411.x
Walderhaug, O. (1990). A fluid inclusion study of quartz cemented sandstones from offshore mid-Norway - possible evidence for continued quartz cementation during oil emplacement. J. Sediment. Petrology 60 (2), 203–210. doi:10.1306/212F9151-2B24-11D7-8648000102C1865D
Weltje, G. J., and Alberts, L. J. H. (2011). Packing states of ideal reservoir sands: Insights from simulation of porosity reduction by grain rearrangement. Sediment. Geol. 242 (1-4), 52–64. doi:10.1016/j.sedgeo.2011.10.001
Wilkinson, M., Milliken, K. L., and Haszeldine, R. S. (2001). Systematic destruction of K-feldspar in deeply buried rift and passive margin sandstones. J. Geol. Soc. 158, 675–683. doi:10.1144/jgs.158.4.675
Woodward, K., and Curtis, C. D. (1987). “Predictive model for the distribution of production constraining illites - Morecambe Gas Field, Irish Sea, Offshore UK,” in Petoleum geology of North West Europe. Editors J. Brooks, and K. W. Glennie (London: Graham and Trotman), 205–215.
Wooldridge, L. J., Worden, R. H., Griffiths, J., Thompson, A., and Chung, P. (2017). Biofilm origin of clay-coated sand grains. Geology 45 (10), 875–878. doi:10.1130/g39161.1
Wooldridge, L. J., Worden, R. H., Griffiths, J., and Utley, J. E. P. (2019). Clay‐coat diversity in marginal marine sediments. Sedimentology 66, 12538–21138. doi:10.1111/sed.12538
Worden, R. H., Allen, M. J., Faulkner, D. R., Utley, J. E. P., Bond, C. E., Alcalde, J., et al. (2020a). Lower Cretaceous Rodby and Palaeocene Lista shales: Characterisation and comparison of top-seal mudstones at two planned CCS sites, offshore UK. Minerals 10, 691. doi:10.3390/min10080691
Worden, R. H., Armitage, P. J., Butcher, A., Churchill, J., Csoma, A., Hollis, C., et al. (2018a). “Petroleum reservoir quality prediction: Overview and contrasting approaches from sandstone and carbonate communities,” in Reservoir quality of clastic and carbonate rocks: Analysis, modelling and prediction. Special publication. Editors P. J. Armitage, A. Butcher, J. Churchill, A. Csoma, C. Hollis, R. H. Lander, J. Ommaet al. (Geological Society London Special Publications), Vol. 435, 1–31. doi:10.1144/sp435.21
Worden, R. H., Bukar, M., and Shell, P. (2018b). The effect of oil emplacement on quartz cementation in a deeply buried sandstone reservoir. Am. Assoc. Petroleum Geol. Bull. 102, 49–75. doi:10.1306/02071716001
Worden, R. H., and Burley, S. D. (2003). “Sandstone diagenesis: The evolution from sand to stone,” in International Association of Sedimentologists reprint series. Editors S. D. Burley, and R. H. Worden (Oxford: Blackwells), 3–44. doi:10.1002/9781444304459.ch
Worden, R. H. (2006). Dawsonite cement in the Triassic Lam Formation, Shabwa Basin, Yemen: A natural analogue for a potential mineral product of subsurface CO2 storage for greenhouse gas reduction. Mar. Petroleum Geol. 23 (1), 61–77. doi:10.1016/j.marpetgeo.2005.07.001
Worden, R. H., French, M. W., and Mariani, E. (2012). Amorphous silica nanofilms result in growth of misoriented microcrystalline quartz cement maintaining porosity in deeply buried sandstones. Geology 40 (2), 179–182. doi:10.1130/g32661.1
Worden, R. H., Griffiths, J., Wooldridge, L. J., Utley, J. E. P., Lawan, A. Y., Muhammed, D. D., et al. (2020b). Chlorite in sandstones. Earth-Science Rev. 204, 103105. doi:10.1016/j.earscirev.2020.103105
Worden, R. H., Mayall, M., and Evans, I. J. (2000). The effect of ductile-lithic sand grains and quartz cement on porosity and permeability in Oligocene and Lower Miocene clastics, South China Sea: Prediction of reservoir quality. Am. Assoc. Petroleum Geol. Bull. 84 (3), 345–359. doi:10.1306/C9EBCDE7-1735-11D7-8645000102C1865D
Worden, R. H., Mayall, M. J., and Evans, I. J. (1997). “Predicting reservoir quality during exploration: Lithic grains, porosity and permeability in Tertiary clastic rocks of the South China Sea Basin,” in Petroleum geology of S E Asia. Editors A. J. Matthews, and R. W. Murphy (Geological Society London Special Publications), 126, 107–115. doi:10.1144/gsl.sp.1997.126.01.08
Worden, R. H., and Morad, S. (2000). “Quartz cementation in sandstones: A review of the key controversies’, Quartz cementation in sandstones. Special Publication of the International Association of Sedimentologists. Editors R. H. Worden, and S. Morad (Oxford: Blackwells), Vol. 29, 1–20. doi:10.1002/9781444304237.ch1
Worden, R. H., and Morad, S. (2003). “Clay minerals in sandstones: Controls on formation, distribution and evolution”, in Clay mineral cements in sandstones. Special Publication of the International Association of Sedimentologists. Editors R. H. Worden, and S. Morad (Oxford: Blackwells), Vol. 29, 3–41. doi:10.1002/9781444304336.ch1
Worden, R. H., Morrall, G., Kelly, S., Mc Ardle, P., and Barshep, D. V. (2019). “A renewed look at calcite cement in marine-deltaic sandstones: The Brent Reservoir, Heather Field, Northern North Sea, UK” in Application of analytical techniques to petroleum systems. Editors P. J. Dowey, M. J. Osborne, and H. Volk (Geological Society London Special Publications), Vol. 484, 305–335. doi:10.1144/SP484-2018-43
Worden, R. H., Needham, S. J., and Cuadros, J. (2006). The worm gut; a natural clay mineral factory and a possible cause of diagenetic grain coats in sandstones. J. Geochem. Explor. 89 (1-3), 428–431. doi:10.1016/j.gexplo.2005.12.011
Worden, R. H., Oxtoby, N. H., and Smalley, P. C. (1998). Can oil emplacement prevent quartz cementation in sandstones? Pet. Geosci. 4 (2), 129–137. doi:10.1144/petgeo.4.2.129
Worden, R. H., and Rushton, J. C. (1992). Diagenetic K-feldspar textures: A TEM study and model for diagenetic feldspar growth. J. Sediment. Petrology 62 (5), 779–789. doi:10.1306/d42679d8-2b26-11d7-8648000102c1865d
Worden, R. H., Smalley, P. C., and Barclay, S. A. (2003). H2S and diagenetic pyrite in North Sea sandstones: Due toTSR or organic sulphur compound cracking? J. Geochem. Explor. 78-79, 487–491. doi:10.1016/s0375-6742(03)00072-4
Worden, R. H., and Smalley, P. C. (2001). “H2S in North Sea oil fields: Importance of thermochemical sulphate reduction in clastic reservoirs,” in Water-rock interaction 2001. Editor R. Cidu. Lisse: Balkema, 659–662.
Worden, R. H., Utley, J. E. P., Butcher, A. R., Griffiths, J., Wooldridge, L. J., and Lawan, A. Y. (2018c). “Improved imaging and analysis of chlorite in reservoirs and modern day analogues: New insights for reservoir quality and provenance,” in Application of analytical techniques to petroleum systems. Editors P. J. Dowey, M. Osborne, and H. Volk (Geological Society London Special Publications), Vol. 484, 189–204. doi:10.1144/sp484.10
Keywords: sandstone, diagenesis, reservoir quality, porosity, permeability, cement, detrital grains
Citation: Worden RH and Utley JEP (2022) Automated mineralogy (SEM-EDS) approach to sandstone reservoir quality and diagenesis. Front. Earth Sci. 10:794266. doi: 10.3389/feart.2022.794266
Received: 13 October 2021; Accepted: 27 July 2022;
Published: 01 September 2022.
Edited by:
Iris Buisman, University of Cambridge, United KingdomReviewed by:
Matthew Powerngdom, Vidence Inc., CanadaDuncan Pirrie, University of South Wales, United Kingdom
Copyright © 2022 Worden and Utley. This is an open-access article distributed under the terms of the Creative Commons Attribution License (CC BY). The use, distribution or reproduction in other forums is permitted, provided the original author(s) and the copyright owner(s) are credited and that the original publication in this journal is cited, in accordance with accepted academic practice. No use, distribution or reproduction is permitted which does not comply with these terms.
*Correspondence: Richard H. Worden, ci53b3JkZW5AbGl2ZXBvb2wuYWMudWs=