
95% of researchers rate our articles as excellent or good
Learn more about the work of our research integrity team to safeguard the quality of each article we publish.
Find out more
ORIGINAL RESEARCH article
Front. Earth Sci. , 26 May 2022
Sec. Cryospheric Sciences
Volume 10 - 2022 | https://doi.org/10.3389/feart.2022.793546
This article is part of the Research Topic Snow and Ice Disaster: Formation Mechanism and Control Engineering View all 9 articles
In mountain glaciers, the influence of bedrock geometry on glacier surface morphology is often assumed; quantitative evidence, however, is rare. In our research, we measured the ice thickness of the Planpincieux Glacier (North-west Italy) and detected the bedrock topography using ground-penetrating radar. Additionally, we investigated the glacier surface morphology using structure from motion and the glacier kinematics using digital image correlation of terrestrial images. A digital terrain analysis showed evidence of recurrent crevasses whose position corresponded to bedrock steps. On average, since 2014, their positions varied between 6 and 14 m and were 40
Mountain glaciers are rapidly shrinking worldwide due to global warming and, in the European Alps, 90% of the glaciated areas are forecast to disappear by 2100 (Huss and Hock, 2015; Zekollari et al., 2019). In particular, small glaciers are clear geo indicators of climate change, as they are more affected by short-term meteorological variations (Huss and Fischer, 2016). They represent relevant components of the local cryosphere and their melting contributes to sea-level rise (Meier et al., 2007; Zemp et al., 2015). Besides the environmental aspect, glaciers impact anthropogenic activities in terms of local economy (Beniston, 2012), water supply (Grunewald and Scheithauer, 2010; Beniston, 2012) and tourism (Fischer et al., 2011). In addition, in specific areas, glacial hazards represent a potential threat to the population (Huggel et al., 2004), and they must be carefully assessed.
Risk assessment is defined as the combination of occurrence probability and potential damage of a given event (Huggel et al., 2004). Concerning glacial hazards, and in particular ice avalanches, the occurrence probability can be either numerically modelled (Iken, 1977; Faillettaz et al., 2011b) or statistically estimated based on monitoring data (Faillettaz et al., 2011a, 2016; Margreth et al., 2017). In both cases, glacier surface kinematics is crucial information, which can be linked to the magnitude of the failure event (Iken, 1977; Giordan et al., 2020). On the other hand, the potential impact of an ice avalanche depends primarily on the involved volume of the collapsed ice (Margreth et al., 2011; Schweizer and Margreth, 2020). Therefore, precise estimates of unstable sector extension and thickness are of paramount importance for a correct evaluation of the level of risk.
Considering the usual remoteness of glaciers, surveying their surface kinematics can be challenging from a logistic point of view. In situ access is often impossible for the high risk of ice and rock falls (Dematteis et al., 2021). In alpine regions, applications based on in situ sensors (e.g., reflective prisms, GNSS receivers) exist (Huss et al., 2007; Sugiyama et al., 2007; Dematteis et al., 2021), but proximal remote sensing techniques are more commonly adopted, such as digital image correlation (DIC) (Evans, 2000; Ahn and Box, 2010; Messerli and Grinsted, 2015; Schwalbe and Maas, 2017).
On the other hand, estimating potentially unstable sector extension requires precise knowledge of the glacier morphology. The occurrence of surface discontinuities (e.g., transversal crevasses) or the presence of specific geometries (e.g., hanging glaciers) (Pralong and Funk, 2006) are potential destabilizing elements. However, the morphology of dangerous glaciers often evolves rapidly, as they feature high dynamics. In these cases, updated knowledge of the glacier morphology is essential. This datum can be achieved through the production of digital elevation models (DEMs) using structure from motion (SfM) conducted using drones (Ryan et al., 2015; Fugazza et al., 2018), helicopter (Girod et al., 2017), or ground-based manual acquisitions (Piermattei et al., 2015; Piermattei et al., 2016; Fugazza et al., 2018). Furthermore, SfM provides orthoimages too, which help data interpretation.
While there are various solutions for monitoring glacier surface morphodynamics, acquiring glacier thickness is more complicated. Accurate ice thickness information is crucial for managing glacial hazards, as avalanche run-out simulations rely on knowing the ice volume involved (Margreth et al., 2011). Ground-penetrating radar (GPR) and Radio Echo Sounding (RES) are common methods for measuring ice thickness (Plewes and Hubbard, 2001). On mountain glaciers, such surveys are challenging due to the scattering of the electromagnetic waves caused by debris, crevasses and reflections by mountain side walls (Dowdeswell et al., 1984; Forte et al., 2019) and increased signal attenuation caused by liquid water presence in temperate ice (Watts and England, 1976). Moreover, individual glacier sectors can be too dangerous for ground-based surveying. In these complex sectors, airborne techniques are the only possible solution (Urbini et al., 2017). Helicopter-borne GPR and RES surveys were successfully conducted in the last decades in the European Alps (Urbini et al., 2017) and in Patagonia (Blindow et al., 2012).
Besides the ice thickness, GPR and RES also provide bedrock topography description, which influences glacier hydrology (Grabiec et al., 2012). Furthermore, bedrock topography is a necessary constraint for developing numerical glacier-flow and rheological models (Faillettaz et al., 2012; Zorzut et al., 2020). It is well known that bedrock geometry determines glacier surface morphology (Paterson, 1994). Glacier surface and bedrock slope are related, even though their steepness can differ by several degrees (Grabiec et al., 2012); bedrock depressions usually yield bowl-shaped glaciers (Urbini et al., 2017); while crevasses often occur in correspondence with bedrock discontinuities, like drumlins (Lamsters et al., 2016) or bedrock steps (Jiskoot et al., 2017), because they induce strong strain rates (Vaughan, 1993). In polar regions, bedrock-glacier morphology relationship has been observed (Beitzel, 1970; Budd and Carter, 1971; Grabiec et al., 2012; Lamsters et al., 2016) and modelled (Budd, 1970; Jiskoot et al., 2017) due to easier GPR/RES surveying. On the contrary, quantitative evidence of bedrock-glacier morphology relationship in mountain glaciers is rarer (Urbini et al., 2017), even though it is often assumed to be known.
In this paper, we show evidence of the direct influence of bedrock geometry on glacier surface morphodynamics at the Planpincieux Glacier (North-west Italy). In particular, we focused on the Montitaz Lobe because its potential collapse would seriously threaten the Planpincieux village at the bottom of the Ferret Valley (Schweizer and Margreth, 2020). We conducted a GPR survey to assess bedrock topography and ice thickness along linear transects. Using SfM, we produced dense temporal series of DEMs and orthoimages since 2014, allowing us to evaluate the evolution of glacier morphology. Finally, we measured the glacier kinematics using DIC applied to daily oblique images. The contribution of our research is twofold: first, we illustrate how the bedrock topography exerts a strong forcing on glacier morphology, which in turn affects the glacier kinematics. Consequently, the bedrock geometry appears as a primary cause of glacier instabilities. Second, we show that frequent morphodynamics monitoring is crucial for assessing and managing glacial hazards.
The Planpincieux Glacier (6.97°E, 45.85°N; WGI # IT4L01517018) is a temperate alpine glacier with an area of about 1 km2 located on the Italian side of the Grandes Jorasses (Figure 1). The Planpincieux Glacier faces towards Ferret Valley, located in the Courmayeur municipality. It ranges between 2,680 and 3,680 m a.s.l, with an average southeast aspect. Two small cirques form the accumulation area. They merge in a bowl-shaped central plateau at 2,900 m a.s.l, the snow line position lies at this altitude. The ablation area is composed of two lobes of a similar extent (approximately 0.1 km2): the Margueraz Lobe is relatively gentle and presents large splaying crevasses. The Montitaz Lobe is a steep (>30°) icefall with transverse crevasses and seracs. Usually, the snow cover at the glacier snout remains up to late June/late July, depending on the year. The Montitaz terminus is 20–30 m-high and hangs over a bedrock step that causes frequent calving (Giordan et al., 2020). Thickness estimations performed with the GlabTop model (Linsbauer et al., 2012) provided an average thickness of the plateau and ablation area of 35.1 ± 18.2 m and 19.4 ± 13.8 m, respectively (Morra Di Cella, 2019).
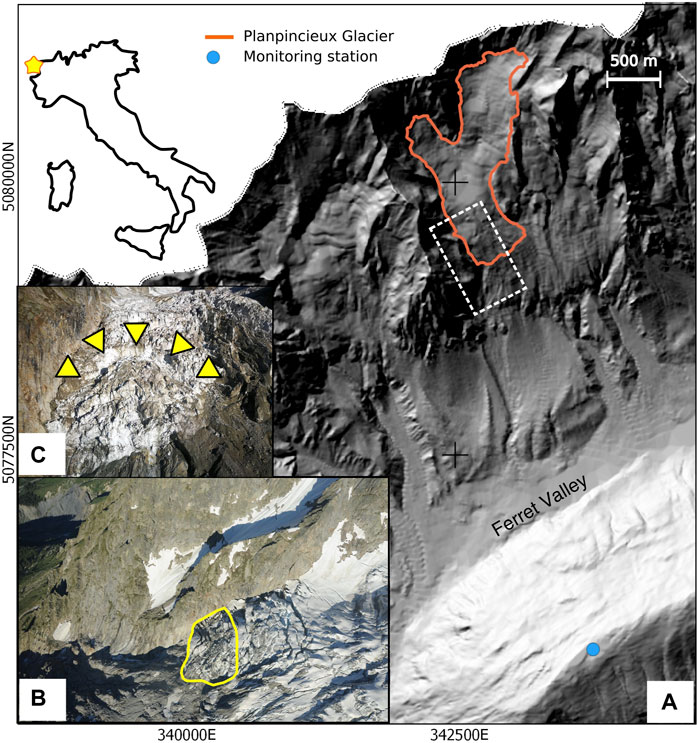
FIGURE 1. (A) Overview of the study area, located in North-west Italy. The Planpincieux Glacier outlines are of 2019. The dashed white rectangle denotes approximately the portion shown in panel b. (B) Aerial view of the Montitaz Lobe in July 2020. The unstable portion is delimited in yellow. (C) Frontal view of the Montitaz Lobe’s terminus in October 2019. Yellow triangles indicate the wide transversal crevasse above the unstable portion.
No mass balance measurements of the Planpincieux Glacier are available. However, mass balance data are available for the nearby Toula and Petit Grapillon glaciers, located 4 and 9 km away, respectively, which have similar aspects and elevations to the Planpincieux Glacier. The mass balance of both glaciers was positive in 2012/2013 and 2013/2014 (+0.2 to +0.5 m water equivalent) and negative in the subsequent years up to 2020 (Giordan et al., 2020).
In the past century, break-offs and floods from the Montitaz Lobe occurred and, on a few occasions, the bridge of the Montitaz Torrent was damaged (Giordan et al., 2020). In such cases, the involved ice volume was unknown. In late August 2017, a 60′000 m3 ice chunk detached from the Montitaz Lobe, and the ice avalanche stopped 800 m upstream of the bridge of the Montitaz Torrent. In the summers of 2019 and 2020, a wide transversal crevasse isolated two portions of the Montitaz Lobe from the main glacier body (Figures 1B,C), which began to accelerate rapidly (Sevestre, 2020). Estimated volumes were 250′000 and 500′000 m3, respectively, based on 2012-dated GPR measurements and experts’ image analysis. However, with the available information, the degree of uncertainty of the volume estimation was high (Giordan et al., 2020). Considering past events and their effects on the valley bottom, ice avalanche run-out simulations were conducted in 2013 and 2020 by the SLF of Davos with different hypothetical volumes involved. These simulations showed that volumes greater than 250′000 m3 would reach the underlying Planpincieux hamlet, potentially damaging buildings and the valley’s access road (Schweizer and Margreth, 2020).
In this study, we adopted various apparatuses and approaches to investigate glacier morphodynamics and its evolution in the period 2014-2020. We analyzed 7 years of surface kinematics, repeated orthoimages and DEMs and updated glacier thickness measurements. Digital terrain analysis allowed the identification of crevasses and terminus positions throughout the years. GPR data provided ice thickness and bedrock topography along linear transects.
Usually, helicopter-borne GPR presents technical problems due to the need to acquire the position of antennas and the lack of direct contact between antennas and glacier, causing power losses due to reflection at the ice surface. In theory, it is ideal to fly with the antennas as close as possible to the glacier surface to avoid spreading losses (Forte et al., 2019). In practice, however, the distance to the ground varies within short distances along the flight trajectory, typically by around ±20 m (Grab et al., 2021). For security reasons, thus, it is advisable to aim for a target height of around 30 m.
On 7 July 2020, we conducted a helicopter-borne GPR survey of the Planpincieux Glacier with the dual-polarization Airborne Ice Radar from ETH Zürich (AIR-ETH) (Langhammer et al., 2019). This platform is equipped with two orthogonal pairs of 25 MHz antennas in broadside configuration and the SPIDAR multi channel recording unit from Sensors and Software. The two antenna pairs alternatingly recorded eight traces per second each. The positioning of the platform was conducted with three differential GNSS antennas, in order to deduce not only the position but also the pitch, roll and yaw angles. With a laser altimeter, the distance to the ground was measured to provide this information for navigation purposes and as input for the data processing. Navigation, recording, and processing of GNSS and laser altimeter data were conducted by GEOSATSA, a Swiss-based surveying company. In total, we acquired 13 cross profiles and five longitudinal profiles with a total length of about 12 km. The parts of the profile layout for which bedrock reflections have been detected are displayed in Figure 2. Compared to a GPR survey conducted in 2012, this layout is denser and more regular, especially at the terminus of the Montitaz Lobe.
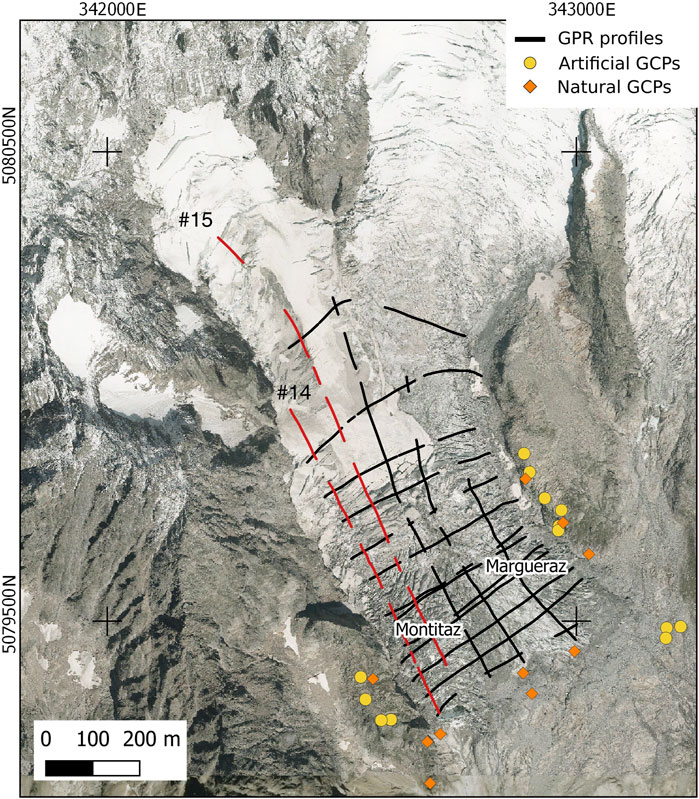
FIGURE 2. GPR profiles acquired on 7 July 2020 at the Planpincieux glacier (black lines). The two westernmost longitudinal profiles (in red in the colored version) are n. 14 and 15. The colored dots indicate the ground control points (GCPs).
In an initial step, the GPR traces were georeferenced. The GPR data were then processed with the software toolbox GPRglaz (Grab et al., 2018). The AIR-ETH system offers recording with two orthogonal (dual-polarization) pairs of 25 MHz dipole antennas. Therefore, GPR data from two channels, one parallel and one perpendicular to the flight direction, were available for data processing. The processing procedure included the following processing steps:
• signal dewowing using PulsEKKO software;
• time-zero correction based on the arrival time of the direct wave;
• amplitude interpolation and ringing removal as detailed in Grab et al. (2018);
• picking of surface reflection using laser altimeter or manually picking, depending on the data quality;
• band-pass filtering between 10 and 75 MHz;
• trace binning to obtain a regular sampling of 0.5 m;
• image focusing (migration) using a half-space model with air and ice velocities of 0.3 m ns−1 (Reynolds, 1997) and 0.168 m ns−1 (Glen and Paren, 1975), respectively;
• manual identification of bedrock reflections.
Glacier ice at the Planpincieux Glacier altitudes is typically temperate in the European Alps. In particular, in the Mont Blanc region, Suter and Hoelzle (2002) observed the presence of cold firn at elevations higher than 3,500 m a.s.l. A propagation velocity of 0.168 m ns−1 was measured in the temperate Rhone Glacier (European Alps) (Church et al., 2020), adopting the common midpoint (CMP) method. Accordingly, we used this value to process the GPR data.
The effects of selected processing steps are documented in Figure 3 using portions of profile n. 14 (location displayed in red in Figure 2). Since data quality is dependent on antenna orientation in combination with glacier bed topography, the identification of bedrock reflections (blue arrows in Figure 3C) was performed on the image from the antenna pair that provided better data quality.

FIGURE 3. Effects of some processing steps shown on a portion of profile n. 14. (A) Raw data; (B) after trace binning; (C) after Kirchhoff migration. The blue arrows in the bottom panel indicate reflections from the bedrock.
As the last step, the ice thicknesses, measured along the profiles, were interpolated using the Matlab built-in thin-plate smoothing spline (TPSS) (Duchon, 1977). From geomorphological analysis, it was evident that the ice thickness at the margins assumed non-zero values, because vertical bedrock outcrops bounded the glacier, but a precise value was unknown. Therefore, manually-imposed thickness boundary constraints on the lateral margins would have suffered subjective uncertainty. Furthermore, most parts of the terminus presented vertical 10–30 m-high ice walls. To solve this issue, we adopted the following method. First, we randomly selected 1,500 bedrock and glacier surface elevation points from the GPR data and 500 elevation points outside the glacier from a DEM. Secondly, we interpolated with TPSS bedrock and surface points along with DEM points. Thereby, we obtained two surfaces that were interpolated using nodes located at the same positions; one representing the bedrock topography, the other representing the glacier surface in continuity with the bedrock outside the glacier. Therefore, the values of both surfaces in the bedrock area were the same, while their difference in the glacier area corresponded to the ice thickness. Since potential errors at the boundaries due to complex geometries were almost the same, because they were produced by identical interpolation, they should approximately compensate.
The ice thickness uncertainty is composed of two independent contributions. First, the uncertainty of the GPR measurement and, second, the uncertainty pertaining to the spatial interpolation. The first contribution is easier to evaluate and can be derived theoretically. The uncertainty of the glacier bedrock topography and the corresponding ice thickness is due to a combination of uncertainties in GPR wave velocity and the detection of bedrock reflections in the profile images.
The GPR wave velocity in temperate ice has been estimated to be 0.168 m ns−1 (Glen and Paren, 1975) and we used uncertainty of σv = ±0.005 m ns−1. This is slightly smaller than the uncertainty of ±0.008 m ns−1 assumed by Lapazaran et al. (2016), as they applied it to polythermal ice. This uncertainty could be further reduced by measuring the propagation velocity on-site by conducting CMP measurements (Bradford and Harper, 2005) or by analyzing the shape of diffraction hyperbolas in the GPR data (Karušs et al., 2022). This was not possible in our case, because CMP measurements have to be conducted on the ground, whereas no clean diffraction hyperbolas were present in our data.
The uncertainty in detecting the bedrock reflection comprises a limited vertical resolution of half a wavelength (Lapazaran et al., 2016), σr, and an estimated uncertainty of 15% of the ice thickness (Lapazaran et al., 2016) because we neglected the third dimension during image focusing by 2D migration, σm. Furthermore, an uncertainty of σp = ±5 m was assumed for manually picking bedrock reflection. Combining these uncertainty contributions by the root-square-sum, presuming them to be independent (Lapazaran et al., 2016), leads to uncertainty
The second source of error is more difficult to quantify and can yield larger effects on the estimation of ice thickness. The internal glacier structure of the glacier, including crevasses, as well as the bedrock topography, can cause unpredictable errors. We estimated the interpolation uncertainty with cross-validation (Cressie, 1992): we compared the subset of GPR data not adopted to interpolate with the corresponding values obtained from interpolation. We assumed the standard deviation of the difference as the interpolation uncertainty,
Additionally, we analyzed whether
Since 2014, a dense series of DEMs and orthoimages of the Planpincieux Glacier has been acquired.
• On 9 June 2014, we conducted a helicopter-borne survey that provided a high-resolution DEM, which we resampled at 0.5 m px−1, using a LiDAR (RIEGL LSM-Q680i) and an orthoimage with a ground sampling distance (GSD) of 0.08 m px−1, acquired with a medium-size photogrammetric Hasselblad H3DIIi camera (Giordan et al., 2020).
• On 26 August 2015, the Valle d’Aosta Region provided a 0.2 m px−1 orthoimage acquired during a photogrammetric survey of the whole region. This datum has not yet been validated by the Valle d’Aosta Region.
• On 22 September 2017, 20 October 2018, 1 October 2019, 20 July and 8 September 2020, we conducted helicopter-borne digital photogrammetry measurements using a Nikon 700D camera with a fixed 24-mm lens focal length, which yielded high-resolution DEMs and orthoimages. In 2019 and 2020, we acquired 45°-oblique orthomosaics along seven parallel stripes at a flying height of 250–300 m. The shooting interval was 1 s, and the image overlapping was 40%–60% (between stripes) and 80%–90% (along stripes). The 2017 and 2018 flights were not planned for photogrammetric surveys.
All the above-mentioned data concern the Montitaz and Margueraz lobes, except for the 2015 orthoimage, which covers the entire glacier. Table 1 reports the list of DEMs and orthoimages adopted in the present study.
In July 2020, alpine guides installed a network of 13 artificial GCPs homogeneously distributed around the glacier (Figure 2), whose positions were measured using real-time kinematic (RTK) positioning. We used the updated GCP network to process 2020 and older datasets using SfM (Mertes et al., 2017; Lewińska et al., 2021) by Agisoft PhotoScan software. Using the 2020 orthoimage as a reference, we identified additional natural GCPs that could be recognized in previous orthoimages (Figure 2).
We analyzed the historical sequence of DEMs and orthoimages to assess 1) the morphological evolution of the Montitaz Lobe and 2) the position of fractures of the Montitaz Lobe. To the former aim, we calculated the area and volume of the frontal sector using all the available DEMs (Table 1).
To analyze the fractures’ location, we first identified the position of the major recurrent transversal crevasses of the Montitaz Lobe in the period 2014-2020. To this aim, we visually analyzed orthoimages, shaded reliefs and slope gradient maps produced with the available DEMs. We observed that these crevasses appeared every year in approximately the same position. To quantify the spatial variability of every crevasse across the years, we adopted the following approach: we examined the various positions of a specific crevasse every year, which formed a spatial cluster. Subsequently, we considered five well-distributed transects that intercept such a cluster; thereby, we obtained five groups (one group for every transect) of intercept points (one point for every considered year). Finally, we calculated the planimetric distance of every intercept point with respect to the group centroid and assumed the median deviation among all the planimetric distances as the spatial variability of the crevasse’s position.
We compared the crevasses’ positions with the bedrock topography to evaluate the relationship between bedrock and glacier morphology. To this end, we considered the GPR profiles n. 14 and 15, which lie longitudinally onto the Montitaz Lobe (Figure 2). We analyzed the bedrock profile obtained with the GPR and the corresponding glacier surface profiles across the years obtained with the available DEMs. Since the elevation profiles present a general parabolic shape, to maintain only the surface-undulation-related information, we subtracted the quadratic fit of every elevation profile; then, we interpolated the undulations with a sine function.
Since August 2013, two permanent monoscopic time-lapse cameras (TLCs) have continuously monitored the surface kinematics of the Planpincieux Glacier (Dematteis et al., 2021), acquiring hourly images. They are equipped with lenses of different focal lengths to observe the glacier with diverse detail. One TLC (297 mm lens focal length) targets the Montitaz Lobe, with a GSD of approximately 0.05 m px−1, while the second TLC (120 mm lens focal length) observes all the ablation area (GSD ∼0.15 m px−1) and part of the upper cirques (GSD ∼0.20 m px−1).
We analyzed the daily temporal sequence of terrestrial oblique images adopting the DIC technique, which has been used in various glaciological studies since 2000 (Evans, 2000; Ahn and Box, 2010; Messerli and Grinsted, 2015; Schwalbe and Maas, 2017). In principle, DIC is applied to a couple of registered images acquired at different times; a patch of the master image is searched for in the slave image, calculating a similarity index in every position within an interrogation area (Dematteis and Giordan, 2021). The position where the maximum similarity is found corresponds to the displacement of the patch. DIC’s outcomes are spatially distributed planar vectors lying on the image plane. We adopted the Local Adaptive Multiscale image Matching Algorithm (Dematteis et al., 2022) for the DIC processing.
Interpolated bedrock elevation and ice thickness distribution are displayed in Figures 4A,B. Thickness varies between 10 and 100 m over the entire glacier, and between 20 and 60 m in the Montitaz Lobe. The difference between interpolated thickness values with the GPR measurements not used in the interpolation process is shown in Figure 4C, it does not appear to be correlated with the thickness value and the distance to the nearest interpolating point neither (Figure 4D). On average, the interpolation mean difference compared with GPR measurements is < 0.1 m, while the standard deviation is
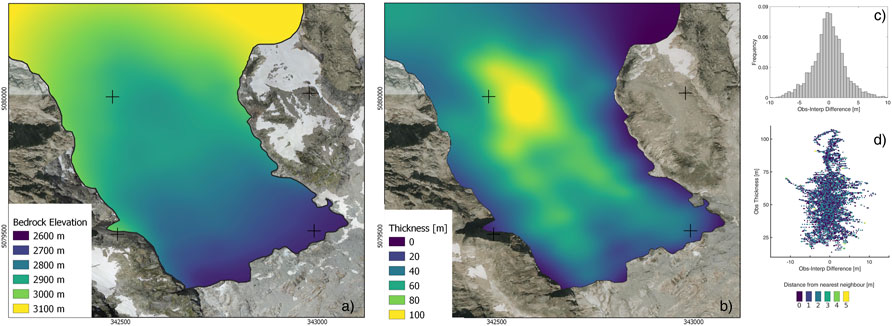
FIGURE 4. (A,B) Bedrock elevation and glacier thickness, respectively, obtained from the interpolation of the GPR profiles acquired on 7 July 2020. (C) Frequency distribution of the difference between GPR thickness measurement and interpolated values. (D) Measured and interpolated thickness difference vs. measured thickness, the color denotes the distance from the nearest interpolating point.
In the considered period, we identified three main crevasses in the Montitaz Lobe that open at approximately the same location every year, while they completely close during the winter by snow filling and the motion of the upper part of the glacier. The fractures delimit distinct morphological sectors (from the terminus A-D). The planimetric deviation of the different positions throughout the years was 13.7, 5.9, and 8.7 m, respectively, for the fractures between sectors AB, BC and CD (Figure 5).
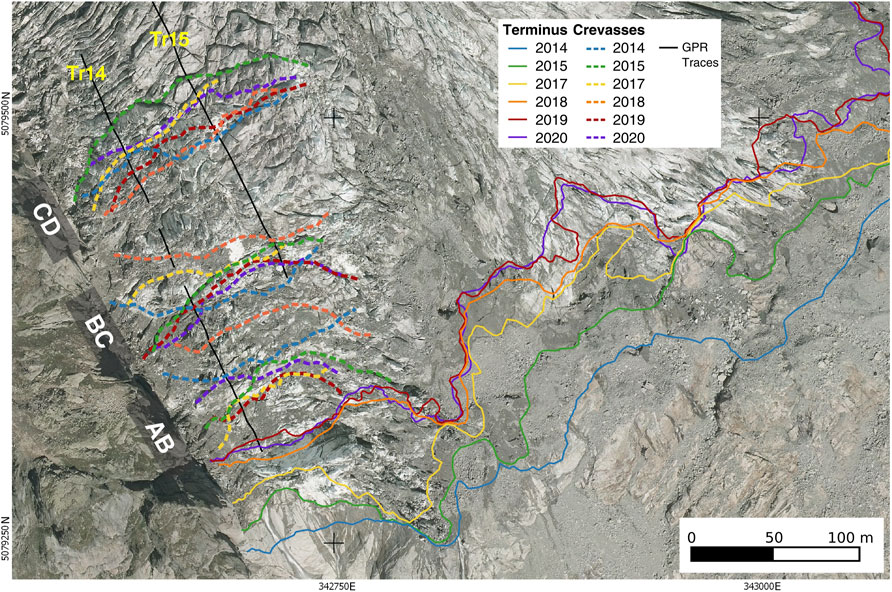
FIGURE 5. Positions of the major crevasses and termini since 2014 are indicated by dashed and solid colored lines, respectively. The solid black line refers to GPR profiles n. 14 and 15. The grey boxes showed the locations of the sectors’ limits.
During the warm season, the Montitaz Lobe terminus presents high strain rates and the development of transversal crevasses that could potentially lead to the detachment of a large ice chunk (Figures 1B,C). Such a crevasse corresponds to the BC limit. Usually, an intense calving activity causes the disaggregation of this sector into relatively small fragments (Giordan et al., 2020). In Table 2 and Figure 6, we present the size evolution of this unstable glacier sector. The areal extension was obtained by manual delineation on the orthoimages, while the volume was calculated using the available DEMs.
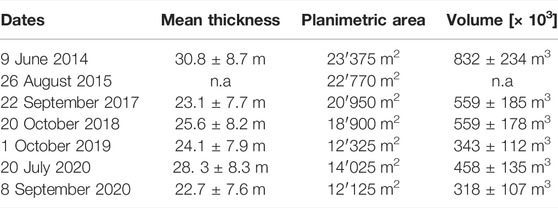
TABLE 2. Morphological evolution of the unstable sector of the Montitaz lobe (n.a. = not available).
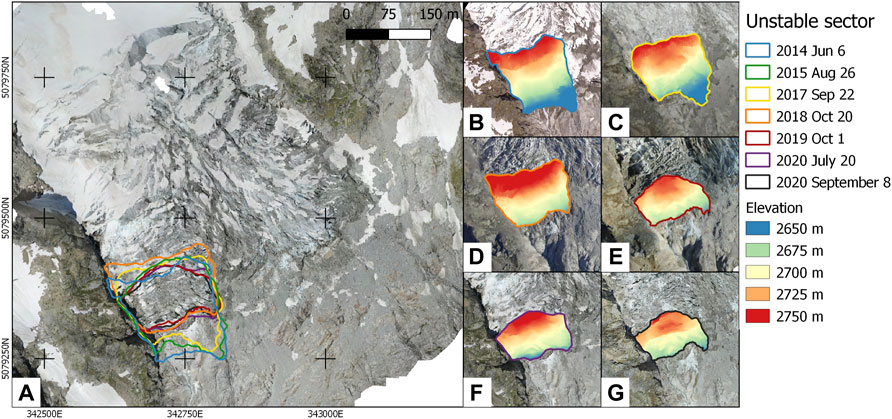
FIGURE 6. (A) Limits of the unstable portion of the Montitaz Lobe in the years 2014–2020. Background, orthophotos of 20 July 2020. (B–G) Surface elevation of the unstable sector obtained with every available DEM. The orthoimages of each panel have been acquired in the same date of the corresponding DEM.
We compared the glacier surface and bedrock topography along GPR profiles n. 14 and n. 15 (Figure 7). A series of knee-shaped bedrock discontinuities are evident. On average, the bedrock slope of profiles n. 14 and n. 15 is 25° and 20°, respectively, and it increases by approximately 20° in correspondence to the bedrock knees. Note that the position of the major fractures corresponds well with that of the bedrock knees. Such spatial correspondence is also highlighted by the analysis presented in Figure 8. There, we show the detrended profiles of bedrock and glacier surface. A series of approximately regular undulations is evident. The glacier surface undulations along profile n. 14 have an amplitude between 7 and 10 m on average (Figures 8A–F), while along profile n. 15, the amplitude is approximately 5 m (Figures 8G–L). Conversely, bedrock undulations are lower, with an amplitude of 4 and 2 m (profiles n. 14 and 15, respectively). The period of the undulations is approximately 95 m and is constant for all the profiles except for the bedrock undulations of profile n. 15, where the period is 60 m. Compared with the bedrock, the glacier profiles along profile n. 14 are out of phase by 145°
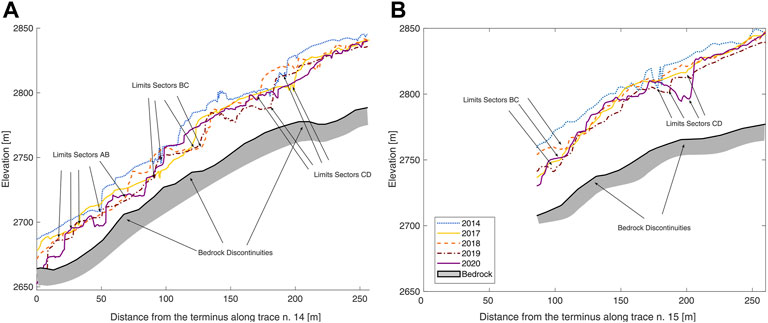
FIGURE 7. Correspondence between bedrock discontinuities and glacier surface recurrent fractures between 2014 and 2020. The longitudinal sections are taken in correspondence of GPR profiles n. 14 (A) and 15 (B).
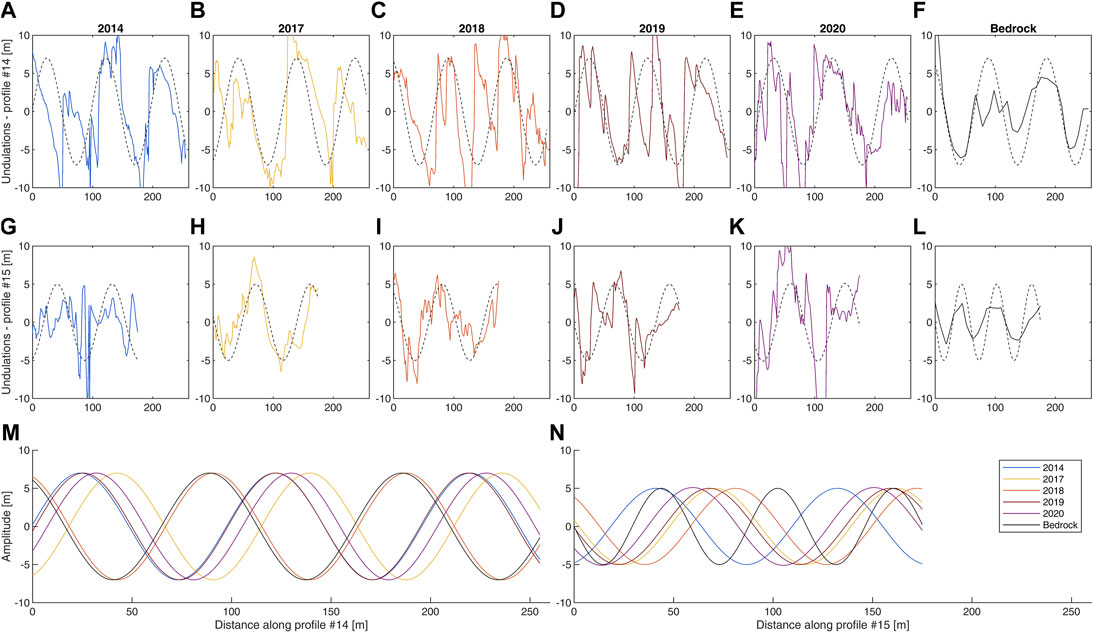
FIGURE 8. Bedrock and glacier surface undulations obtained by subtracting a quadratic fit from the elevation profiles. (A–E) and (G–K) Surface undulations along profiles n. 14 and 15, respectively, in 2014, 2017, 2018, 2019 and 2020; (F–L) bedrock undulations along profiles n. 14 and 15. The dashed black line is the interpolating sine function. (M,N) Interpolating sin function of every undulation curve for profiles n. 14 and 15, respectively.
DIC outcomes provided the ice flow vectors on the image plane. Since 2014, the results show that the Montitaz and Margueraz lobes are substantially inactive in the cold season, while they reactivate during the warm season reaching maximum daily displacement in August. The Montitaz Lobe moves faster, with maximum values in the frontal sector up to more than 2 m day−1, while the maximum Margueraz flow is approximately 0.5 m day−1. Such measurements have centimeter uncertainty (Dematteis et al., 2018). The kinematic surface pattern of the Montitaz Lobe presents four distinct kinematic domains–A, B, C and D–from the bottom to the top of the Lobe (Figure 9A), which correspond to the morphological sectors bounded by the crevasses shown in Figure 5. The motion rates increase toward the terminus, and, in the frontal domain (i.e., the A domain), the surface velocity is related to the occurrence of break-offs (Giordan et al., 2020). Between 2014 and 2018, the domains became distinguishable approximately from July. Contrarily, in 2019 and 2020, the A and B sectors accelerated with identical velocity until the beginning of September (Figure 9B) and there was a severe risk of an avalanche event (Magra, 2019; BBC, 2020).
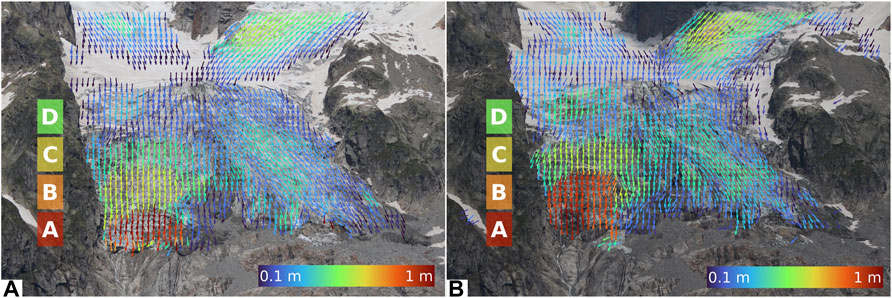
FIGURE 9. (A) Daily surface displacement between 7 and 14 August 2016. The map evidences the presence of four distinct kinematic domains in the Montitaz Lobe, with displacement rates increasing toward the terminus. (B) Daily surface displacement between 29 and 1 August 2020. The kinematic domains “A” and “B” are merged and move with similar velocity.
The measured ice thickness partially agrees with that inferred by visual investigation and monoscopic photogrammetry in the past years (Giordan et al., 2020). The GPR results also provided the representation of the bedrock topography, which can be used as a benchmark to estimate past ice thicknesses by calculating the difference with older DEMs.
We observed a general decreasing volume trend of the most unstable portion of the Montitaz Lobe, mostly due to the terminus retreat. The volumes in 2017 and 2018 were approximately 500′000 m3, which agreed with the values estimated by Giordan et al. (2020) and Schweizer and Margreth (2020), while the 2019 and 2020 volumes corresponded well with those estimated during the emergencies of these years (Sevestre, 2020). On the other hand, we did not observe evident ice thinning of this portion, observing thickness values between 22.7
This finding has a relevant impact on glacial hazard assessment and management, as it shows that the potentially unstable mass can significantly vary during the season; therefore, repeated DEM acquisitions during a single season are required to evaluate volume changes correctly. Ice thickness in 2014 (30.8 m) was acquired in June and was comparable with that measured on 20 July 2020 (28.3 m). Assuming a thinning of 6 m between July and September 2014 (i.e., which is the same thinning observed between 20 July and 8 September 2020), the volume of the unstable portion would be approximately 650′000 m3, which agrees with the volumes observed in 2017 and 2018 (Table 2).
We observed a limited spatial variability of the crevasses’ locations during the considered period. The recurrent positions indicate a strong influence of bedrock topography on glacier surface morphology, which is appreciable by comparing the longitudinal glacier and bedrock sections along GPR profiles.
Additionally, we observed that bedrock and glacier undulations follow approximately a sinusoidal behavior, with similar amplitude and period in both profiles n. 14 and 15. Even though this is valid in general, in a few cases, the shape of the undulations does not appear as a regular sinusoid (e.g., Figures 8C–G). Along profile n. 14, on average, glacier undulations are out of phase by 145° with respect to the bedrock, except in 2018. This means that the ice is thinner where the bedrock is steeper and the crevasses are downstream of the bedrock knees (Paterson, 1994). Similar behavior was modelled (Budd, 1970) and observed (Beitzel, 1970; Budd and Carter, 1971) in Antarctica. There, surface undulations were caused by bedrock undulations with periods three to five times the ice thickness; accordingly, in the Montitaz Lobe, ice thickness and undulation periods are approximately 35 and 95 m, respectively, along profile n. 14 (Figure 8M). On the other hand, we did not observe a similar behavior along profile n. 15. The amplitude of the bedrock fluctuations (∼2 m) is likely too small compared with the ice thickness (∼50 m). Interestingly, the surface undulations’ period is the same as that observed along profile n. 14. Contrary to the findings of Remy and Tabacco (2000), the amplitude of the surface undulations is larger than that of bedrock. This means that the effects of bedrock discontinuities are amplified on the glacier surface morphology, in particular on the development of crevasses.
The surface displacement pattern evidences the presence of various kinematic domains whose limits correspond with the morphological sectors delimited by the transversal fractures. This observation demonstrates the strong bedrock influence on glacier morphodynamics. This finding will help in the analysis of glacial risk assessment to evaluate potentially unstable sector extension, especially in contexts where bedrock topography is unknown, but surface displacement is available.
In this work, we adopted GPR measurements, aerial and terrestrial digital images, which provided bedrock topography and ice thickness, DEM (using SfM processing) and ice flow rates (using DIC processing), respectively, in the mountain Planpincieux Glacier (North-west Italy). We measured the maximum glacier thickness of 100 m in the central plateau and 60 m in the Montitaz Lobe. Our research directly shows the strong relationship between bedrock geometry and glacier surface morphodynamics. In particular, we illustrate that a series of bedrock steps causes the development of large crevasses, whose recurrent position is approximately 40 m downstream of the bedrock steps’ positions.
Additionally, we present the morphological evolution of a large unstable sector on the Montitaz Lobe, which has not significantly thinned across the considered period. However, due to terminus retreat, this sector approximately halved its volume. Conversely, we registered substantial thinning during the 2020 warm season, which caused a volume loss of ∼30% between 20 July and 8 September 2020.
Further GPR campaigns can be adopted to validate 2020 results and increase its spatial resolution; in particular, more detailed bedrock discontinuities and information about the potential presence of water at the bedrock-ice interface are two presently missing important factors, which will provide further support for glacial risk assessment. The bedrock topography provided by the GPR can be used as a benchmark to obtain future and past volumes of specific sectors.
The raw data supporting the conclusions of this article will be made available by the authors, without undue reservation.
Conceptualization, ND and DG; methodology, MG; formal analysis, ND, FT, and MG; investigation ND, FT, and DG; data curation, FT and PP; writing—original draft preparation, ND, FT and MG; writing—review and editing, DG and HM; supervision, DG and HM. All authors have read and agreed to the published version of the manuscript.
The authors declare that the research was conducted in the absence of any commercial or financial relationships that could be construed as a potential conflict of interest.
All claims expressed in this article are solely those of the authors and do not necessarily represent those of their affiliated organizations, or those of the publisher, the editors and the reviewers. Any product that may be evaluated in this article, or claim that may be made by its manufacturer, is not guaranteed or endorsed by the publisher.
Ahn, Y., and Box, J. E. (2010). Glacier Velocities from Time-Lapse Photos: Technique Development and First Results from the Extreme Ice Survey (EIS) in Greenland. J. Glaciol. 56, 723–734. doi:10.3189/002214310793146313
Bbc, T. (2020). Mont Blanc: Glacier Collapse Risk Forces Italy Alps Evacuation. BBC News. Available at: https://www.bbc.com/news/world-europe-53692476.
Beitzel, J. E. (1970). The Relationship of Ice Thicknesses and Surface Slopes in Dronning Maud Land. IAHS 86, 191–203.
Beniston, M. (2012). Impacts of Climatic Change on Water and Associated Economic Activities in the Swiss Alps. J. Hydrology 412-413, 291–296. doi:10.1016/j.jhydrol.2010.06.046
Blindow, N., Salat, C., and Casassa, G. (2012). “Airborne GPR Sounding of Deep Temperate Glaciers-Examples from the Northern Patagonian Icefield,” in 2012 14th International Conference on Ground Penetrating Radar, GPR, Shanghai, China, June 4–8, 2012, 664–669. doi:10.1109/icgpr.2012.6254945
Bradford, J. H., and Harper, J. T. (2005). Wave Field Migration as a Tool for Estimating Spatially Continuous Radar Velocity and Water Content in Glaciers. Geophys. Res. Lett. 32, 1–4. doi:10.1029/2004GL021770
Budd, W. F., and Carter, D. B. (1971). An Analysis of the Relation between the Surface and Bedrock Profiles of Ice Caps. J. Glaciol. 10, 197–209. doi:10.3189/s0022143000013174
Budd, W. F. (1970). Ice Flow over Bedrock Perturbations. J. Glaciol. 9, 29–48. doi:10.3189/s0022143000026770
Church, G., Grab, M., Schmelzbach, C., Bauder, A., and Maurer, H. (2020). Monitoring the Seasonal Changes of an Englacial Conduit Network Using Repeated Ground-Penetrating Radar Measurements. Cryosphere 14, 3269–3286. doi:10.5194/tc-14-3269-2020
Cormack, R. M., and Cressie, N. (1992). Statistics for Spatial Data. New York: Wiley, 1300. doi:10.2307/2532724
Dematteis, N., and Giordan, D. (2021). Comparison of Digital Image Correlation Methods and the Impact of Noise in Geoscience Applications. Remote Sens. 13, 327. doi:10.3390/rs13020327
Dematteis, N., Giordan, D., Crippa, B., and Monserrat, O. (2022). Fast Local Adaptive Multiscale Image Matching Algorithm for Remote Sensing Image Correlation. Comput. Geosciences 159, 104988. doi:10.1016/J.CAGEO.2021.104988
Dematteis, N., Giordan, D., Troilo, F., Wrzesniak, A., and Godone, D. (2021). Ten-Year Monitoring of the Grandes Jorasses Glaciers Kinematics. Limits, Potentialities, and Possible Applications of Different Monitoring Systems. Remote Sens. 13, 3005. doi:10.3390/rs13153005
Dematteis, N., Giordan, D., Zucca, F., Luzi, G., and Allasia, P. (2018). 4D Surface Kinematics Monitoring through Terrestrial Radar Interferometry and Image Cross-Correlation Coupling. ISPRS J. Photogrammetry Remote Sens. 142, 38–50. doi:10.1016/j.isprsjprs.2018.05.017
Dowdeswell, J. A., Drewry, D. J., Liestøl, O., and Orheim, O. (1984). Radio Echo-Sounding of Spitsbergen Glaciers: Problems in the Interpretation of Layer and Bottom Returns. J. Glaciol. 30, 16–21. doi:10.3189/s0022143000008431
Duchon, J. (1977). “Splines Minimizing Rotation-Invariant Semi-norms in Sobolev Spaces,” in Constructive Theory of Functions of Several Variables (Berlin: Springer), 85–100. doi:10.1007/bfb0086566
Evans, A. N. (2000). Glacier Surface Motion Computation from Digital Image Sequences. IEEE Trans. Geosci. Remote Sens. 38, 1064–1072. doi:10.1109/36.841985
Faillettaz, J., Funk, M., and Sornette, D. (2011a). Icequakes Coupled with Surface Displacements for Predicting Glacier Break-Off. J. Glaciol. 57, 453–460. doi:10.3189/002214311796905668
Faillettaz, J., Funk, M., and Sornette, D. (2012). Instabilities on Alpine Temperate Glaciers: New Insights Arising from the Numerical Modelling of Allalingletscher (Valais, Switzerland). Nat. Hazards Earth Syst. Sci. 12, 2977–2991. doi:10.5194/nhess-12-2977-2012
Faillettaz, J., Funk, M., and Vagliasindi, M. (2016). Time Forecast of a Break-Off Event from a Hanging Glacier. Cryosphere 10, 1191–1200. doi:10.5194/tc-10-1191-2016
Faillettaz, J., Sornette, D., and Funk, M. (2011b). Numerical Modeling of a Gravity-Driven Instability of a Cold Hanging Glacier: Reanalysis of the 1895 Break-Off of Altelsgletscher, Switzerland. J. Glaciol. 57, 817–831. doi:10.3189/002214311798043852
Farinotti, D., King, E. C., Albrecht, A., Huss, M., and Gudmundsson, G. H. (2014). The Bedrock Topography of Starbuck Glacier, Antarctic Peninsula, as Determined by Radio-Echo Soundings and Flow Modeling. Ann. Glaciol. 55, 22–28. doi:10.3189/2014AoG67A025
Fischer, A., Olefs, M., and Abermann, J. (2011). Glaciers, Snow and Ski Tourism in Austria's Changing Climate. Ann. Glaciol. 52, 89–96. doi:10.3189/172756411797252338
Forte, E., Bondini, M. B., Bortoletto, A., Dossi, M., and Colucci, R. R. (2019). Pros and Cons in Helicopter-Borne GPR Data Acquisition on Rugged Mountainous Areas: Critical Analysis and Practical Guidelines. Pure Appl. Geophys. 176, 4533–4554. doi:10.1007/s00024-019-02196-2
Fugazza, D., Scaioni, M., Corti, M., D'Agata, C., Azzoni, R. S., Cernuschi, M., et al. (2018). Combination of UAV and Terrestrial Photogrammetry to Assess Rapid Glacier Evolution and Map Glacier Hazards. Nat. Hazards Earth Syst. Sci. 18, 1055–1071. doi:10.5194/nhess-18-1055-2018
Giordan, D., Dematteis, N., Allasia, P., and Motta, E. (2020). Classification and Kinematics of the Planpincieux Glacier Break-Offs Using Photographic Time-Lapse Analysis. J. Glaciol. 66, 188–202. doi:10.1017/jog.2019.99
Girod, L., Nuth, C., Kääb, A., Etzelmüller, B., and Kohler, J. (2017). Terrain Changes from Images Acquired on Opportunistic Flights by SfM Photogrammetry. Cryosphere 11, 827–840. doi:10.5194/tc-11-827-2017
Glen, J. W., and Paren, J. G. (1975). The Electrical Properties of Snow and Ice. J. Glaciol. 15, 15–38. doi:10.3189/s0022143000034249
Grab, M., Bauder, A., Ammann, F., Langhammer, L., Hellmann, S., Church, G. J., et al. (2018). “Ice volume estimates of Swiss glaciers using helicopter-borne GPR - An example from the Glacier de la Plaine Morte,” in 2018 17th International Conference on Ground Penetrating Radar, GPR, Rapperswil, Switzerland, June 18–21, 2018. doi:10.1109/ICGPR.2018.8441613
Grab, M., Mattea, E., Bauder, A., Huss, M., Rabenstein, L., Hodel, E., et al. (2021). Ice Thickness Distribution of All Swiss Glaciers Based on Extended Ground-Penetrating Radar Data and Glaciological Modeling. J. Glaciol. 67, 1074–1092. doi:10.1017/jog.2021.55
Grabiec, M., Jania, J., Puczko, D., Kolondra, L., and Budzik, T. (2012). Surface and Bed Morphology of Hansbreen, a Tidewater Glacier in Spitsbergen. Pol. Polar Res. 33, 111–138. doi:10.2478/v10183-012-0010-7
Grunewald, K., and Scheithauer, J. (2010). Europe's Southernmost Glaciers: Response and Adaptation to Climate Change. J. Glaciol. 56, 129–142. doi:10.3189/002214310791190947
Huggel, C., Haeberli, W., Kääb, A., Bieri, D., and Richardson, S. (2004). An Assessment Procedure for Glacial Hazards in the Swiss Alps. Can. Geotech. J. 41, 1068–1083. doi:10.1139/T04-053
Huss, M., Bauder, A., Werder, M., Funk, M., and Hock, R. (2007). Glacier-dammed Lake Outburst Events of Gornersee, Switzerland. J. Glaciol. 53, 189–200. doi:10.3189/172756507782202784
Huss, M., and Fischer, M. (2016). Sensitivity of Very Small Glaciers in the Swiss Alps to Future Climate Change. Front. Earth Sci. 4, 34. doi:10.3389/feart.2016.00034
Huss, M., and Hock, R. (2015). A New Model for Global Glacier Change and Sea-Level Rise. Front. Earth Sci. 3, 54. doi:10.3389/feart.2015.00054
Iken, A. (1977). Movement of a Large Ice Mass before Breaking off. J. Glaciol. 19, 595–605. doi:10.3189/s0022143000215505
Jiskoot, H., Fox, T. A., and Van Wychen, W. (2017). Flow and Structure in a Dendritic Glacier with Bedrock Steps. J. Glaciol. 63, 912–928. doi:10.1017/jog.2017.58
Karušs, J., Lamsters, K., Ješkins, J., Sobota, I., and Džeriņš, P. (2022). UAV and GPR Data Integration in Glacier Geometry Reconstruction: A Case Study from Irenebreen, Svalbard. Remote Sens. 14, 456. doi:10.3390/rs14030456
Lamsters, K., Karušs, J., Rečs, A., and Bērziņš, D. (2016). Detailed Subglacial Topography and Drumlins at the Marginal Zone of Múlajökull Outlet Glacier, Central Iceland: Evidence from Low Frequency GPR Data. Polar Sci. 10, 470–475. doi:10.1016/j.polar.2016.05.003
Langhammer, L., Rabenstein, L., Schmid, L., Bauder, A., Grab, M., Schaer, P., et al. (2019). Glacier Bed Surveying with Helicopter-Borne Dual-Polarization Ground-Penetrating Radar. J. Glaciol. 65, 123–135. doi:10.1017/jog.2018.99
Lapazaran, J. J., Otero, J., Martín-español, A., and Navarro, F. J. (2016). On the Errors Involved in Ice-Thickness Estimates I: Ground-Penetrating Radar Measurement Errors. J. Glaciol. 62, 1008–1020. doi:10.1017/jog.2016.93
Lewińska, P., Głowacki, O., Moskalik, M., and Smith, W. A. P. (2021). Evaluation of Structure-From-Motion for Analysis of Small-Scale Glacier Dynamics. Measurement 168, 108327. doi:10.1016/j.measurement.2020.108327
Linsbauer, A., Paul, F., and Haeberli, W. (2012). Modeling Glacier Thickness Distribution and Bed Topography over Entire Mountain Ranges with Glabtop: Application of a Fast and Robust Approach. J. Geophys. Res. 117. doi:10.1029/2011JF002313
Magra, I. (2019). Giant Glacier on Mont Blanc Is in Danger of Collapse, Experts Warn. New York Times. Available at: https://www.nytimes.com/2019/09/25/world/europe/glacier-italy-climate-change.html.
Margreth, S., Faillettaz, J., Funk, M., Vagliasindi, M., Diotri, F., and Broccolato, M. (2011). Safety Concept for Hazards Caused by Ice Avalanches from the Whymper Hanging Glacier in the Mont Blanc Massif. Cold Regions Sci. Technol. 69, 194–201. doi:10.1016/j.coldregions.2011.03.006
Margreth, S., Funk, M., Tobler, D., Dalban, P., Meier, L., and Lauper, J. (2017). Analysis of the Hazard Caused by Ice Avalanches from the Hanging Glacier on the Eiger West Face. Cold Regions Sci. Technol. 144, 63–72. doi:10.1016/j.coldregions.2017.05.012
Meier, M. F., Dyurgerov, M. B., Rick, U. K., O'Neel, S., Pfeffer, W. T., Anderson, R. S., et al. (2007). Glaciers Dominate Eustatic Sea-Level Rise in the 21st Century. Science 317, 1064–1067. doi:10.1126/science.1143906
Mertes, J. R., Gulley, J. D., Benn, D. I., Thompson, S. S., and Nicholson, L. I. (2017). Using Structure-From-Motion to Create Glacier DEMs and Orthoimagery from Historical Terrestrial and Oblique Aerial Imagery. Earth Surf. Process. Landforms 42, 2350–2364. doi:10.1002/esp.4188
Messerli, A., and Grinsted, A. (2015). Image Georectification and Feature Tracking Toolbox: ImGRAFT. Geosci. Instrum. Method. Data Syst. 4, 23–34. doi:10.5194/gi-4-23-2015
Morra Di Cella, U. (2019). Nota tecnica su applicazione modello di spessore dei ghiacciai per la stima dei volumi glaciali sulla base dei dati topografici e di catasto. Aosta.
Piermattei, L., Carturan, L., De Blasi, F., Tarolli, P., Dalla Fontana, G., Vettore, A., et al. (2016). Suitability of Ground-Based SfM-MVS for Monitoring Glacial and Periglacial Processes. Earth Surf. Dynam. 4, 425–443. doi:10.5194/esurf-4-425-2016
Piermattei, L., Carturan, L., and Guarnieri, A. (2015). Use of Terrestrial Photogrammetry Based on Structure-From-Motion for Mass Balance Estimation of a Small Glacier in the Italian Alps. Earth Surf. Process. Landforms 40, 1791–1802. doi:10.1002/esp.3756
Plewes, L. A., and Hubbard, B. (2001). A Review of the Use of Radio-Echo Sounding in Glaciology. Prog. Phys. Geogr. Earth Environ. 25, 203–236. doi:10.1177/030913330102500203
Pralong, A., and Funk, M. (2006). On the Instability of Avalanching Glaciers. J. Glaciol. 52, 31–48. doi:10.3189/172756506781828980
Rémy, F., and Tabacco, I. E. (2000). Bedrock Features and Ice Flow Near the EPICA Ice Core Site (Dome C, Antarctica). Geophys. Res. Lett. 27, 405–408. doi:10.1029/1999GL006067
Reynolds, J. M. (1997). An Introduction to Applied and Environmental Geophysics. Chichester: JW & Sons Interiors. doi:10.1071/pvv2011n155other
Ryan, J. C., Hubbard, A. L., Box, J. E., Todd, J., Christoffersen, P., Carr, J. R., et al. (2015). UAV Photogrammetry and Structure from Motion to Assess Calving Dynamics at Store Glacier, a Large Outlet Draining the Greenland Ice Sheet. Cryosphere 9, 1–11. doi:10.5194/tc-9-1-2015
Schwalbe, E., and Maas, H.-G. (2017). The Determination of High-Resolution Spatio-Temporal Glacier Motion Fields from Time-Lapse Sequences. Earth Surf. Dynam. 5, 861–879. doi:10.5194/esurf-5-861-2017
Schweizer, J., and Margreth, S. (2020). Evaluation of Hazard Caused by Ice Avalanches from the Planpincieux Glacier, Val Ferret, Courmayeur, Italy Update 2020: Part 1 Summer Scenarios. Davos, Switzerland.
Sevestre, H. (2020). Extreme Summer Impacts Ice Shelves and Glaciers. World Meteorol. Organ. Available at: https://public.wmo.int/en/media/news/extreme-summer-impacts-ice-shelves-and-glaciers (Accessed October 1, 2020).
Sugiyama, S., Bauder, A., Weiss, P., and Funk, M. (2007). Reversal of Ice Motion during the Outburst of a Glacier-Dammed Lake on Gornergletscher, Switzerland. J. Glaciol. 53, 172–180. doi:10.3189/172756507782202847
Suter, S., and Hoelzle, M. (2002). Cold Firn in the Mont Blanc and Monte Rosa Areas, European Alps: Spatial Distribution and Statistical Models. Ann. Glaciol. 35, 9–18. doi:10.3189/172756402781817059
Urbini, S., Zirizzotti, A., Baskaradas, J., Tabacco, I., Cafarella, L., Senese, A., et al. (2017). Airborne Radio Echo Sounding (RES) Measures on Alpine Glaciers to Evaluate Ice Thickness and Bedrock Geometry: Preliminary Results from Pilot Tests Performed in the Ortles Cevedale Group (Italian Alps). Ann. Geophys. 60. doi:10.4401/ag-7122
Vaughan, D. G. (1993). Relating the Occurrence of Crevasses to Surface Strain Rates. J. Glaciol. 39, 255–266. doi:10.1017/S0022143000015926
Wang, P., Li, Z., Li, H., Wang, W., and Yao, H. (2014). Comparison of Glaciological and Geodetic Mass Balance at Urumqi Glacier No. 1, Tian Shan, Central Asia. Glob. Planet. Change 114, 14–22. doi:10.1016/j.gloplacha.2014.01.001
Watts, R. D., and England, A. W. (1976). Radio-echo Sounding of Temperate Glaciers: Ice Properties and Sounder Design Criteria. J. Glaciol. 17, 39–48. doi:10.3189/s0022143000030707
Zekollari, H., Huss, M., and Farinotti, D. (2019). Modelling the Future Evolution of Glaciers in the European Alps under the EURO-CORDEX RCM Ensemble. Cryosphere 13, 1125–1146. doi:10.5194/tc-13-1125-2019
Zemp, M., Frey, H., Gärtner-Roer, I., Nussbaumer, S. U., Hoelzle, M., Paul, F., et al. (2015). Historically Unprecedented Global Glacier Decline in the Early 21st Century. J. Glaciol. 61, 745–762. doi:10.3189/2015JoG15J017
Keywords: structure from motion, ground-penetrating radar, glacier morphology, glacial hazards, image correlation, Planpincieux Glacier, ice avalanches, digital terrain analysis
Citation: Dematteis N, Giordan D, Perret P, Grab M, Maurer H and Troilo F (2022) Evidences of Bedrock Forcing on Glacier Morphodynamics: A Case Study in Italian Alps. Front. Earth Sci. 10:793546. doi: 10.3389/feart.2022.793546
Received: 12 October 2021; Accepted: 11 May 2022;
Published: 26 May 2022.
Edited by:
Ning Huang, Lanzhou University, ChinaReviewed by:
Feiteng Wang, Cold and Arid Regions Environmental and Engineering Research Institute (CAS), ChinaCopyright © 2022 Dematteis, Giordan, Perret, Grab, Maurer and Troilo. This is an open-access article distributed under the terms of the Creative Commons Attribution License (CC BY). The use, distribution or reproduction in other forums is permitted, provided the original author(s) and the copyright owner(s) are credited and that the original publication in this journal is cited, in accordance with accepted academic practice. No use, distribution or reproduction is permitted which does not comply with these terms.
*Correspondence: Daniele Giordan, ZGFuaWVsZS5naW9yZGFuQGlycGkuY25yLml0
Disclaimer: All claims expressed in this article are solely those of the authors and do not necessarily represent those of their affiliated organizations, or those of the publisher, the editors and the reviewers. Any product that may be evaluated in this article or claim that may be made by its manufacturer is not guaranteed or endorsed by the publisher.
Research integrity at Frontiers

Learn more about the work of our research integrity team to safeguard the quality of each article we publish.