 Diane Johnson1,2*
 Gavyn. K. Rollinson2
 Ali Talib Arif3,4
 Teresa Moreno5
 Pedro Trechera Ruiz5Robert Lah6Zbigniew Lubosik7
 Thomas Pindel7Richard Gminsk3
 Ben J. Williamson2
- 1School of Aerospace, Transport and Manufacturing, Cranfield University, College Road, Cranfield Wharley End, Bedford, United Kingdom
- 2Camborne School of Mines, University of Exeter, Penryn, United Kingdom
- 3Institute for Infection Prevention and Hospital Epidemiology, University Medical Center Freiburg, University of Freiburg, Faculty of Medicine, University of Freiburg, Freiburg, Germany
- 4Kurdistan Institution for Strategic Studies and Scientific Research (KISSR), Sulaimani, Iraq
- 5Institute of Environmental Assessment and Water Research (IDAEA-CSIC), Barcelona, Spain
- 6Premogovnik Velenje d.d, Velenje, Slovenia
- 7Glowny Instytut Gornictwa, Katowice, Poland
Determining the physical and chemical properties of airborne dusts in occupational settings is essential for assessing their potential toxicity as well as the effectiveness of respiratory protective equipment and dust mitigation measures. Here, we report the first successful QEMSCAN® automated mineralogical analysis of potentially toxic PM4 and PM2.5 dust from deep coal mines in Poland and Slovenia. QEMSCAN® was setup to automatically delimit 100,000 ‘particles’ per sample, based on average atomic number contrast, subject these to X-ray elemental analysis at points in a grid pattern (0.5 µm spacing), assign a mineral name to each point and then output the results as particle size, shape, mineralogy and mineral associations data and as mineral maps. The dusts were prepared as dispersions on a polyethylene sheet so that coal particles, with a slightly higher BSE signal, could be recognized from their substrate. Samples were analyzed repeatedly and in different orientations to determine the effects of sample geometry and topography. QEMSCAN® mineral identifications were manually checked using standard SEM X-ray elemental analysis. From a pilot study of Polish and Slovenian coal dust samples, PM4 and PM2.5 contain varying proportions of coal, quartz and other silicates, sulphides, sulphates, carbonates, oxides and other minerals, and notable concentrations of fly-ash particles. That some of these components may be toxic when inhaled, particularly the quartz and fly-ash, highlights the need for larger scale and wider ranging studies. The further potential of the newly developed QEMSCAN® methodology is discussed.
Introduction
Over the last 20 years, there has been a resurgence in coal mine dust lung disease (CMDLD, NIOSH, 2019; Perret et al., 2017) which is tragic considering that this potentially life-changing or even fatal condition is entirely preventable. To understand the causes of this trend, and to design more effective measures for dust control and worker protection, will require the development of more sophisticated physicochemical assessment methods for coal dust particulate matter (PM). This is especially so for the respirable (PM4) and fine fractions (PM2.5), nominally particulate matter with an aerodynamic diameter less than four and 2.5 µm, respectively, which can penetrate into the alveolar regions of the lungs (World Health Organisation, 1999). Ambient PM2.5 has been linked to a variety of respiratory (Li et al., 2018) as well as cardiovascular diseases (Hayes et al., 2019). Whether this also applies to coal dust PM2.5 is not known but raises the possibility that it may be contributing to incidences of both respiratory and cardiovascular diseases in coal miners. The characteristics of PM2.5 which may be important in this include particle shape, solubility, contents of quartz and other potentially toxic minerals/substances, and surface chemistry and other properties.
Automated mineralogical analysis, using systems such as QEMSCAN® (Quantitative Evaluation of Mineralogy by SCANing electron microscopy (SEM)), is ideally suited to the physical and chemical characterisation of dusts as it has the potential to determine the size and shape characteristics, as well as to map the mineral and/or phase (henceforth referred to as ‘mineral’ for brevity) composition and mineral associations, of large, statistically significant, numbers of particles over short time periods, potentially 1,000 particles per hour for particles from 1 to 10 μm in diameter (Pirrie et al., 2004; Martin et al., 2008; Speirs et al., 2008; Williamson et al., 2013). QEMSCAN® has not previously been shown to be effective for the characterisation of coal dust (French and Ward, 2009) as automated recognition of carbon-dominated particles from their substrate or embedding media was a challenge, mainly due to their backscattered electron (BSE) signal being too similar or lower than that of surrounding material. Previous coal dust characterisation studies have mostly used non-automated SEM methods (Zygarlicke & Steadman, 1990; Cprek et al., 2007; Sapko et al., 2007) but, because of the laborious nature and potential bias in manual analysis, resulting datasets were relatively small and are unlikely to have been fully representative. Where a so-called “automated” SEM-energy dispersive X-ray (EDS)-based analysis routine for coal dust was developed, it required the user to manually select particles from secondary electron images which limited the number of particles that could be analysed to a few hundred, within a practicable time period (Sellaro et al., 2015).
The aim of the current study was to develop a QEMSCAN® methodology for the automated mineralogical analysis of coal dust, and more specifically coal dust PM4 and PM2.5. To the best of our knowledge, this is the first time this has been attempted and successfully achieved. It has become possible due to improvements in available analytical systems, such as finer electron beams and increased sensitivity of BSE and EDS detectors, more powerful computer capabilities and an improved sample preparation and analytical protocol, the latter developed herein. The effectiveness of the new methodology is demonstrated from a pilot study on coal dusts from Polish and Slovenian underground mines.
Materials and methods
Sample collection and preparation for analysis
Two samples were analysed in this study, the first from a deep hard coal mine in Poland and the second from a large lignite mine in Slovenia. For the Polish sample (PZ_001_1), around 500 g of coal dust was collected from deposition plates between 40 and 250 m from the roadway face (Chodnik 61,002 seam 207/1–2). The coal dust had been produced as a result of roadway construction works where combined ventilation and wet de-dusting systems were in operation. The Slovenian sample (PV_002_1) was collected from deposits accumulated over a significant time period on mining equipment within a longwall working (k.−95/A), 20 m from the exit roadway where cutting and caving were taking place, with air circulation via the main ventilation system. Both samples were size separated into PM4 and PM2.5 using a custom-built patented physical particle size separation system in the laboratory of the Institute of Environmental Assessment and Water Research (IDAEA-CSIC), Spain (Patent No. 201131895, Moreno et al., 2019).
The traditional methods for preparing dust for QEMSCAN® analysis are to either embed it in epoxy resin, such as Araldite, or, more unusually, in iodized or brominated epoxy resin, to produce a polished block with particle cross-sections exposed at the surface (considered in Rahfeld and Gutzmer, 2017). Alternatively, dust can be sprinkled or dispersed in a liquid medium (usually using water or alcohol which is left to dry), onto the surface of a blank epoxy resin block, carbon-based substrate or metal stub. These methods could not be used for coal dust, however, as QEMSCAN® analysis requires that particles for subsequent X-ray analysis have a higher BSE response (i.e., nominally a higher average atomic number) than their substrate. The average atomic number of coal is too similar to that of epoxy resin, and other similar carbon-based resins and substrates, to be distinguishable (Rahfeld and Gutzmer, 2017), and is lower than possible metal substrates. In other studies, materials have been embedded in carnauba wax to form a polished block, however the average atomic number of carnauba wax (5.36) is too close to that of coal (6 or possibly up to 7.28) to be distinguishable (Rahfeld and Gutzmer, 2017, and references therein). Using carnauba wax can also contaminate the inside of an SEM.
In our study, the material identified as having the best properties for use as a sample substrate was polyethylene (C2H4)n as this has a relatively low average atomic number (2.7), a smooth surface and is relatively stable under the electron beam. A 1 mm thick, 1.5 x 1.5 cm polyethylene sheet was therefore embedded into the top of a 30 mm-diameter Epofix epoxy resin block. Approximately 0.5 mg of coal dust PM4 or PM2.5 was mixed with 1 ml of industrial methylated spirit (IMS; 94% ethyl alcohol, 5% methyl alcohol, 1% water) and transferred onto the polyethylene sheet using a clean glass dropper. Evaporation of the IMS left a fine dispersion of dust particles on the surface of the polyethylene. Each block was then carbon coated to a thickness of approximately 20 nm using a high vacuum carbon ribbon evaporator (Quorum Q150K ES). This sample preparation methodology had two main advantages: 1) polishing of the sample surface was not required and therefore there was no possibility of dust samples being contaminated with polishing media; 2) as IMS is near water-free, there is little possibility of hydrating particulate in the sample, so avoiding changes in its physical properties (e.g., size and shape) or mineralogy (e.g., loss of halite and other soluble phases).
QEMSCAN® sample analysis method
Multiple sample blocks were loaded into the QEMSCAN® system in the Environment and Sustainability Institute of the University of Exeter, United Kingdom. The system operates on an FEI Quanta 650F FEG-SEM fitted with two Bruker SDD EDS detectors (XFlash® Series 6/30 with Bruker Esprit v. 1.9 software). Data acquisition was controlled by QEMSCAN® iMeasure v. 5.3 software (FEI). The system was operated at an accelerating voltage of 15 kV, a working distance of 13 mm and a beam current of 10 ± 0.05 µA. Data was recorded in Particle Mineral Analysis (PMA) mode where the iMeasure software was configured to demarcate particles which have a BSE signal higher than the polyethylene substrate. It was not possible to achieve this automatically, by calibrating the BSE signal using materials such as gold (relatively high signal) and quartz (relatively low signal), as the difference in the responses of these substances is too great to then demarcate coal from the polyethylene substrate within the narrow range of BSE greyscale values, with only 255 grey channels between quartz and gold. Instead, BSE brightness and contrast settings were adjusted for each sample so that every particle on the substrate could be distinguished from the background. This allowed every particle imaged to be analysed, including those partly or wholly consisting of coal, silicates, oxides etc. For each sample, iMeasure was set up to analyse 100,000 particles. These analyses were undertaken in 100 µm wide areas (BSE images) of the substrate surface, which were automatically laid out in a spiral pattern outwards from the centre of the sample block.
Once particles of a specified size range (up to 4 µm) were demarcated, each was automatically subject to X-ray elemental analysis in a grid pattern with a point spacing of 0.5 µm. A total of exactly 1000 X-ray counts were collected for each point of analysis to ensure that the determination of mineralogy was adequately accurate (tested by carrying out manual point analysis, see Discussion) but was also rapid enough for the characterisation of 100,000 particles over a reasonable time period (typically <12 h), given the high cost of instrument time. Altering the number of counts collected to a higher level, to increase the accuracy of mineral identification, would have required the creation of a bespoke SIP, involving a lengthy period of development. In the iDiscover v. 5.3 software, the data from each point of analysis was automatically compared with a Species Identification Protocol (SIP) database of mineral and non-crystalline phase spectra to identify the mineral present. The SIP used was modified from the Sedimentary Rocks Oil and Gas 15 kV SIP that was supplied with the QEMSCAN®, which includes a range of oxide, sulphate and silicate minerals, and was customised for coal dust PM4 and PM2.5, mainly to include coal and fly-ash.
Data processing
To remove any possible background signal aberrations from the polyethylene substrate, e.g., from microscopic scratches, which QEMSCAN® may confuse with candidate particles, a computational processing filter was applied. This was based on a combination of both chemistry and geometry of detected candidate particles. The filter was applied to exclude all particles with a chemical composition consistent with the background substrate (i.e., only C identifiable) and which also had an aspect ratio of >2.5, because scratches tend to be elongate.
Data from the iDiscover v. 5.3 software can be either exported by specific mineral name or on a broader compositional group basis, the latter based on a long or short mineral group list (known as a secondary list). The length of the group list depends on the required detail of mineral designation, e.g., quartz could be assigned to a “silicate” group or as quartz. These mineral group lists can be seen in Figure 1, Figure 2 and Table 6. iDiscover can also output mineral proportions, size and shape information, mineral maps and mineral associations per particle size fraction (PM4 and PM2.5). To determine mineral particle numbers, a “mineral particle” was defined as having an area consisting of greater than 50% of an individual mineral category. This cut off was necessary as coal dust particles are generally made up of complex mixtures of minerals, and because without it, particles could be defined as a certain mineral even if this mineral did not make up the majority of the particle. On the particle number plots (Figures 3–5), the “others” category on the x-axis is for particles containing less than 50% of a particular mineral, those in the “other” category are where the mineral could not be identified.
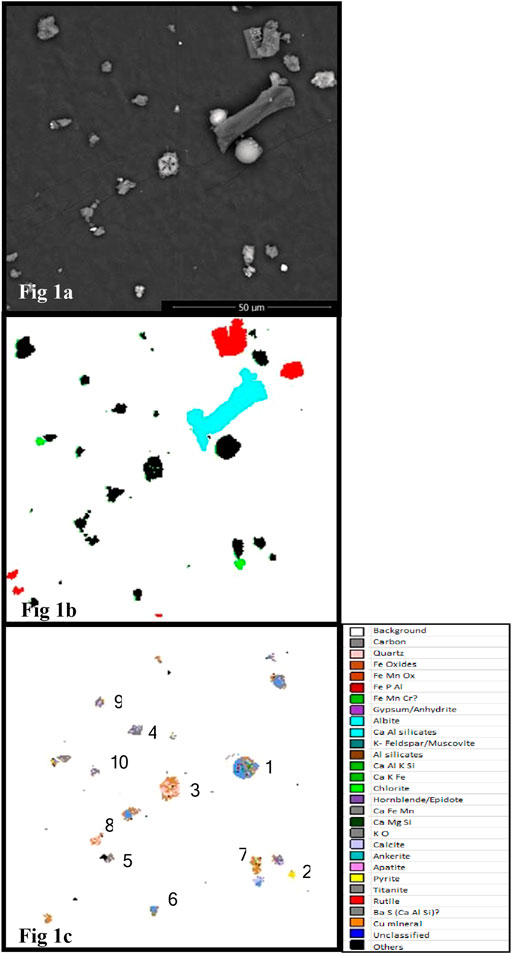
FIGURE 1. Test area one of PM25 sample from Slovenian lignite mine: (A) SEM-BSE image; (B) Area as scanned by QEMSCAN®. Particles colour coded red are on boundary of scanned area (particles outside this were automatically ignored in case they extend beyond the scanned field of view); particles colour coded blue are larger than pre-defined upper limit size (>10 μm); particles colour coded green are candidate particles, i.e., suitable for EDS point analysis; particles colour coded black are accepted and analysed. (C) Mineral map exported from database, processed using coal dust SIP. Numbers correlate to EDS data shown in Table 5.
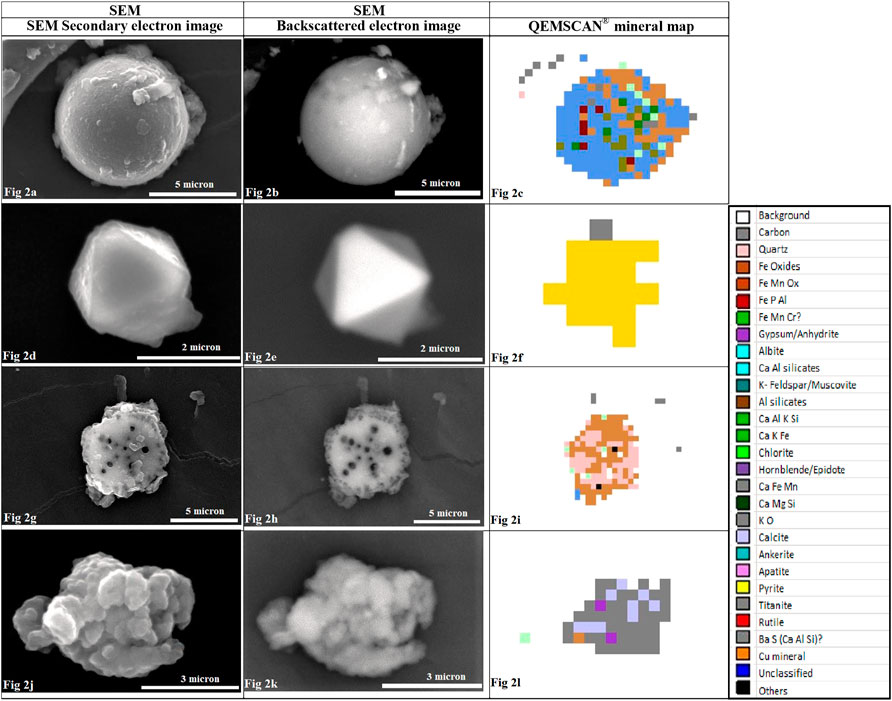
FIGURE 2. Example coal dust particles from a PM25 test sample: Fly-ash particle (7.5 µm diameter) (Figures A–C), Pyrite tetrahedron (2 µm diameter) (Figures D–F), Diatom fossil fragment (6 µm diameter) (Figures G–I), Coal particle (5.5 µm diameter) (Figures J–L). Left column shows secondary electron image, central column BSE image, and right column QEMSCAN® mineral map for corresponding particle.
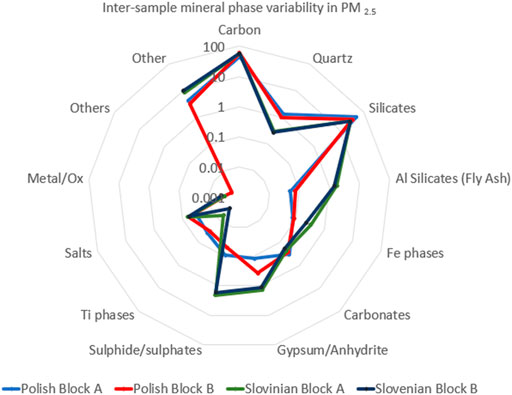
FIGURE 3. Plot of log10 percentage of minerals in PM2.5 where particles of a specific mineral were defined as having a mineral area >50% of each particle. This diagram compares data from the analysis of replicate block preparations of each sample (Block A and Block B) from Poland (PZ_001_1 Block A, and PZ_001_1_ Block B and from Slovenia (PV_002_1 Block A, and PV_002_1 Block B.
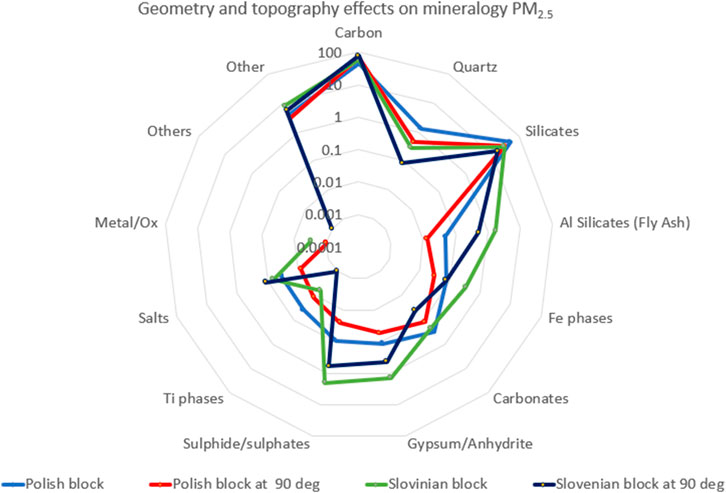
FIGURE 4. Plot of log10 percentage of minerals in PM2.5 where particles of a specific mineral were defined as having a mineral area >50% of each particle. This diagram compares data from the analysis of blocks in their original analytical orientation (Polish sample PZ_001_1 Block A, Slovenian sample PV_002_1 Block A) with those acquired when the blocks were rotated by 90o (Polish sample PZ_001_1_ Block A rotated 90o, Slovenian sample PV_002_1 Block A rotated 90o). The differences in the numbers of particles identified between different orientations is thought to be due to the effects of particle geometry, topography and, because the blocks could not be exactly rotated about their centre of symmetry, slight differences in the area scanned.
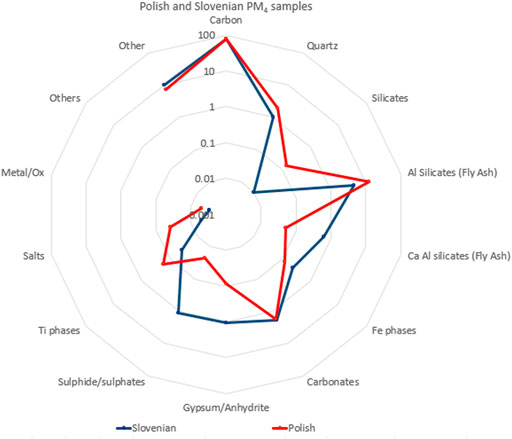
FIGURE 5. Plot of log10 percentage of minerals in PM4 in a Polish (sample PZ_001_1) and Slovenian (sample PV_002_1) coal dust sample. Particles of a specific mineral were defined as having a mineral area >50% of each particle.
From the output physicochemical and mineralogical data it was possible to calculate Particle Surface Mineralogy (PSM), which is important in health-related studies as it is generally the surfaces of particles which induce reactions in the lung, rather than their interior components (Williamson et al., 2013). PSM is calculated by determining the relative proportion of particle surfaces (outlines) made up of a specific mineral, with the mineralogy of particle surfaces being where each mineral (e.g., analytical point designated as quartz) is in direct contact with the background (i.e., analytical point identified as polyethylene substrate).
Results
Comparing the PM2.5 dust samples from Poland and Slovenia (Table 1), the Polish sample PZ_001_1 contained approximately 3.7x more particles of quartz than the Slovenian sample PV_002_1, with 991 vs. 267 (all per ∼100,000 particles), only 72 vs. 1,448 particles of fly-ash (Al Silicates), 369 vs. 1,119 particles of gypsum/anhydrite and 49 vs. 1712 particles of sulphides/sulphates. Both the Polish and Slovenian samples contained very few Ti phase particles, 30 and 3, respectively.
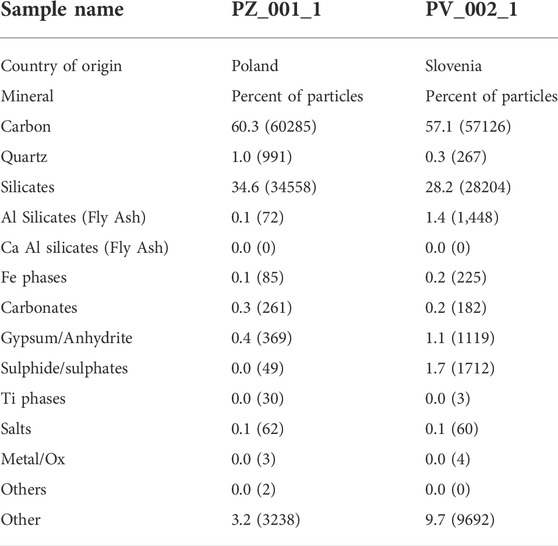
TABLE 1. Mineral percentage of PM2.5 particles, where particles of a specific mineral were defined by having a Mineral area >50% of each mineral category for Polish and Slovenian coal dust samples. In parenthesis, number of particles per ∼100,000 particles.
for PM4 (Table 2), the Polish sample PZ_001_1 contained nearly 2x the number of quartz particles as Slovenian sample PV_002_1 (1999 vs. 1,029 particles). The Polish, compared with the Slovenian sample, contained 170 vs. 38 Ti phase particles and 149 vs. 10 particles silicates. Assessing the fly-ash content of the PM4 was complex as fly-ash may report to two categories, Al silicates or Ca Al silicates, and because their compositions, particularly the Al silicates, may overlap with naturally occurring minerals. For the Ca Al silicates, where this is less of a problem, the Slovenian sample contained 620 particles of fly-ash (Ca Al silicates) compared with only 52 particles in the Polish sample. The relatively higher concentration of fly-ash in the Slovenian samples was confirmed from SEM studies where fly-ash is often present as near spherical particles (see Figure 2); very few of these could be identified in the Polish samples.
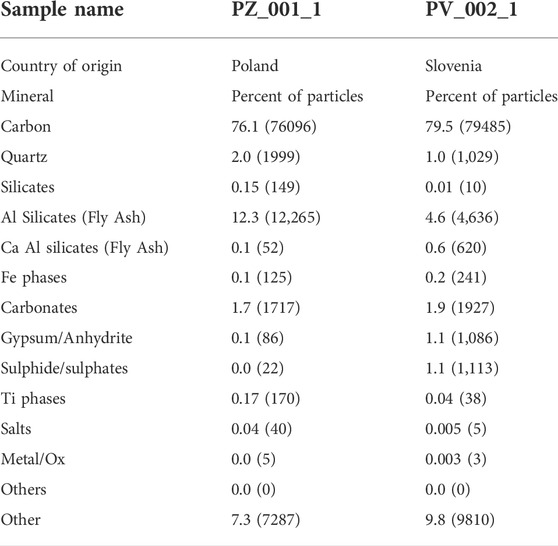
TABLE 2. Mineral percentage of PM4 particles, where particles of a specific mineral were defined by having a mineral area >50% of each mineral category for Polish and Slovenian coal dust samples. In parenthesis, number of particles per ∼100,000 particles.
Of additional note is that the PM2.5 samples from both Poland and Slovenia contained lower percentages of quartz and fly-ash particles (both types) than in their respective PM4 samples.
Results of Quality control checks
The precision of QEMSCAN® analysis is frequently reported as better than 1% relative to mineral standards (Rollinson et al., 2007). Accuracy is dependent on a range of variables, in particular the quality of the SIP used for mineral identification (Pirrie et al., 2009).Inter-sample variability was tested by analysing multiple sample preparations of coal dust PM2.5, mainly to determine whether particle size and density fractionation had occurred during dispersion of the particle suspension on the polyethylene substrate. From the results in Figure 3, it is clear that inter-sample variability for particle number mineralogy is minor for PM2.5 samples, and considerably less than the difference in mineralogy between the Polish and Slovenian coal mine samples. The largest variation in this was for “Ti phases” in Slovenian samples and “gypsum/anhydrite” in Polish samples, which is likely to be caused by sample inhomogeneity, possibly inherited from the physical size segregation process; it was very challenging to homogenise the PM4 and PM2.5 samples, or to check that they were homogeneous.It was thought likely that additional errors could be introduced as a result of topographic and geometric effects as samples were prepared as particles lying on a flat substrate, rather than as flat polished sections, and because the BSE and X-ray detectors in the SEM are set at an inclined angle to the incident electron beam and sample surface. The effects of this were assessed by analysing an individual block twice, the second time with the block rotated by 90o around the vertical (Z) axis. In general, the number of particles and relative proportions of minerals (shapes of the patterns in Figure 4) are far more similar between repeated analyses of the same sample (one rotated 90o) than between samples from different mines. This is reassuring, especially as at least some of the discrepancy could be due to a slight difference in the area scanned as it was not possible to rotate the sample exactly on the centre of rotation of the field of view.
Discussion
Physicochemical properties of coal mine PM4 and PM2.5 from Poland and Slovenia
Most notable about the PM2.5 from the Slovenian dust (PV_002_1) was that it contained 1,448 particles of fly-ash (Al Silicates) compared with only 72 in the Polish sample (PZ_001_1). The origin of the fly-ash particles is almost certainly from the disintegration of concrete used to backfill supports in the mine, because the aggregate in the concrete contains a component of fly-ash. Its presence is worrying as fly-ash often contains high levels of potentially toxic metals such as Pb and Hg (Jambhulkar et al., 2018).
For quartz, the PM2.5 sample from Poland (PZ_001_1) contained approximately 3.7x more particles than the Slovenian sample PV_002_1, with 991 vs. 267 (Table 1). For PM4, the Polish sample contained nearly twice the number of quartz particles (1999 vs. 1,029, respectively). The presence of quartz in coal mine dust is not uncommon (Greskevitch et al., 1992; IARC, 1997) and its concentrations vary. It is of concern as inhalable quartz is classified as a Group 1 carcinogen, although its carcinogenicity “may be dependent on inherent characteristics of the crystalline silica or on external factors affecting its reactivity with biological systems” (IARC, 1997). Relatively high numbers of quartz particles in the Polish PM2.5 and PM4 samples could be due to either the presence of greater volumes of quartz veins within the coal being mined, the presence of quartz in concrete used in underground infrastructure, or the liberal use of limestone rock dust (containing small amounts of quartz) within Polish mines. The latter is spread in certain parts of mines to act as a heat sink in the mitigation of dust explosions.
Quartz concentrations are typically measured in mg per m3 of mine air, either in terms of the Total Dust and/or the PM10 size fraction. Recommended maximum concentrations in Polish mines are given in Table 3 (Ministry of Labour and Social Policy, 2014; Więckol-Ryk et al., 2018). In Slovenian coal mines, the threshold value for pure quartz is 0.05 mg/m3 in coal dust PM10. In the current study, it was not possible to convert particle numbers of quartz in the PM4 and PM2.5 samples to mass per volume of air (for comparison with workplace thresholds) as this would require: 1) assumptions about the density of each and every mineral where this may vary (e.g., for different ranks of coal, and depending on water contents etc.), and/or the category could include a variety of possible minerals (e.g., “Sulphides/sulphates” could contain pyrite and other sulphides and also barite); 2) it was not possible to determine the mass of different minerals per given volume of air (as is usually measured in dust monitoring campaigns) as this preliminary study was on deposited coal dust rather than on filter collections. Extensive development work would be needed to overcome these issues, possibly requiring a combination of traditional quantitative measurements of quartz and other mineral concentrations in filter collections, from known volumes of air, together with QEMSCAN® analysis of a representative subsample. The latter would require development of QEMSCAN® analysis routines for particulate on different types of filter substrates.
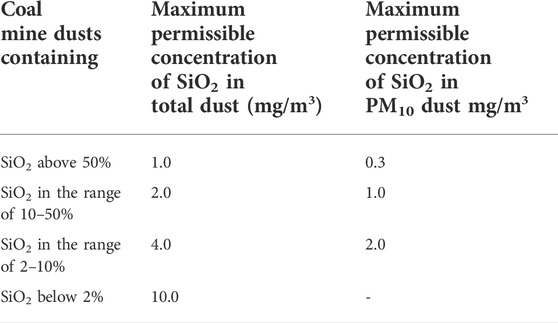
TABLE 3. Maximum permissible concentration of quartz in coal mine dusts in Poland (Ministry of Labour and Social Policy, 2014; Więckol-Ryk et al., 2018).
Importantly, the PM2.5 samples from both Poland and Slovenia contained lower percentages of quartz and fly-ash particles (both types) than in their respective PM4 samples. This is somewhat reassuring as relatively higher proportions of these minerals in the finer particle fraction, which can be inhaled deeper into the lungs, would have been of greater health concern.
A comparison was also made between the particle surface mineralogy (PSM, Williamson et al., 2013, see above) of the Polish and Slovenian dust samples, see mineral associations matrix in Table 4. The % PSM for quartz in the Polish and Slovenian PM2.5 samples was similarly high at 36 and 24%, respectively, which means that these percentages of quartz were on particle surfaces and therefore available for reactions in the lung. Although PSM is not used currently in mine dust legislation, it may help in future attempts to understand the interactions of certain components of coal mine dust with biological systems and how to best mitigate against any harmful effects. There may be similar issues with other components such as sulphides and fly-ash which showed relatively high values for PSM, but where their possible effects on human health cannot currently be estimated.
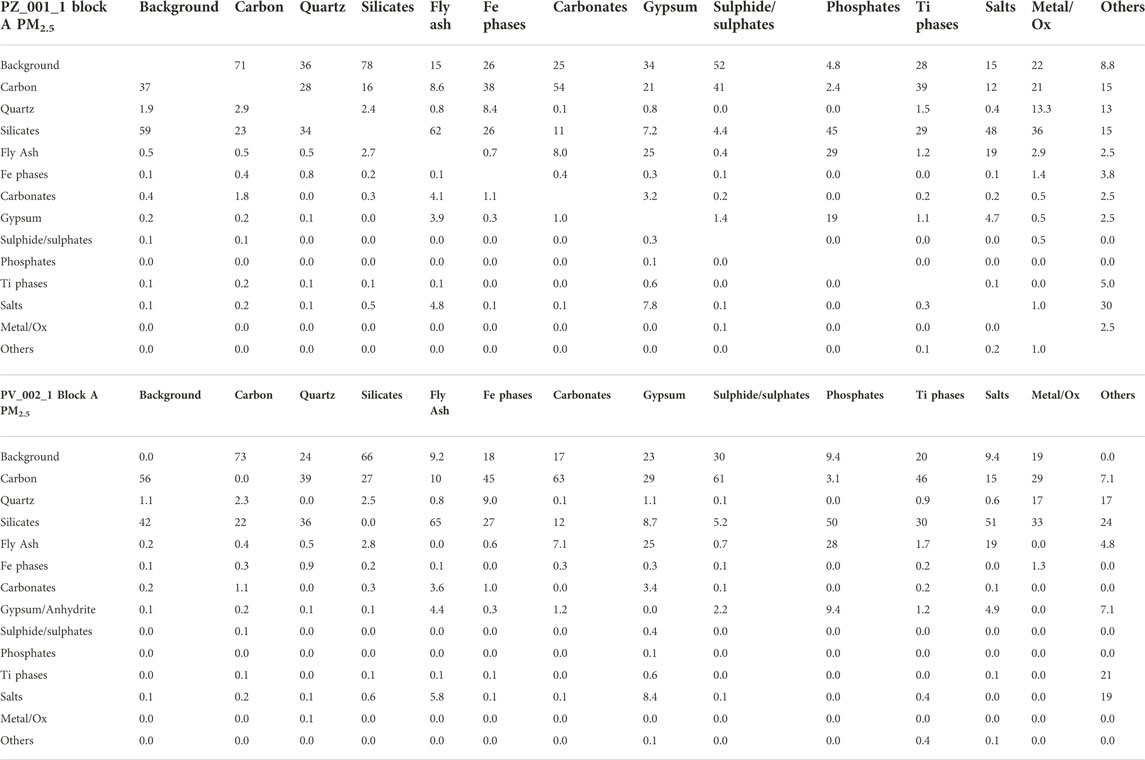
TABLE 4. Table showing mineral associations (using mineral short list) in percentage for PM2.5 coal dust samples from Poland (PZ_001_1 Block A) and Slovenia (PV_002_1 Block A). To determine the % of pixels of one mineral in contact with another, first select the column of interest (e.g., quartz) and then the row (e.g., background) to determine the % association between e.g. quartz and background (in this case 36% for sample PZ_001_1). PSM% for each mineral is the % association of that mineral with background.
Limitations of QEMSCAN® analysis in the current study
The main limitations of this study were:
1) The number of X-ray counts per spectra being 1,000 per point of analysis. This allows for rapid data acquisition (essential given the number of particle analyses and resolution required), but also gives a lower limit of detection for the elements within each spectrum of approximately 3–10 wt% (Andersen et al., 2009; Rollinson et al., 2011). The consequence of this is that it is impossible to distinguish different minerals on the basis of minor element compositions (also noted by French et al., 2008). This is not a major issue in the current study because the emphasis is on the identification of major constituent minerals rather than detailed mineral chemistry.
2) Difficulty determining minerals containing significant proportions of relatively light elements. The signal contributions from N, O, and F are weak and it is not possible to routinely detect elements with atomic numbers less than 6 (carbon). The main result of this is that −OH or H2O-bearing phases cannot be distinguished from anhydrous equivalents, e.g., gypsum from anhydrite; such minerals were therefore grouped into single categories.
3) The X-ray interaction volume of small particles on a substrate is complex, especially in particles that have fine mineral intergrowths, a rim composed of different minerals (including the carbon coat necessary for SEM analysis), or where the interaction volume exceeds the particle volume. The main potential consequence of this is mixed EDS spectra which may result in blurred mineral boundaries on maps and the incorrect classification of some points of analysis as “other” (non-identifiable) minerals. No such blurred boundaries were seen in maps obtained for PM4 and PM2.5 and the numbers of particles classified as “other” was always less than 0.1%. To assess the effects of carbon coating, test blocks of the same sample were coated with different thicknesses (10, 20, 30 nm) of carbon and analysed as per other samples. Coating thickness was found to make no difference to the results of the analyses, probably because such small thicknesses of carbon contribute so little to the volume of material excited that, under the conditions of analysis used, the carbon from the coat could not be detected.
4) Issues with touching particles. This is an inherent problem with most types of dust analysis based on imaging. It is often not possible to discriminate whether touching particles were always joined, i.e., from when the dust was created or airborne, or whether they aggregated during sample deposition, collection or preparation. It was therefore necessary to treat joined particles as single particle aggregates. To demonstrate the problem with this, 20 particles were analysed from a lignite coal dust sample manually sieved to <25 µm. The material was prepared and analysed in the same way as for the QEMSCAN® analyses of PM4 and PM2.5. The field of view for these particles is shown as a BSE image in Figure 1A, a QEMSCAN® particle designation map in Figures 1A,B, QEMSCAN® mineral map in Figure 1C. All particles shown in the BSE image in Figure 1A were correctly delimited as particles in the QEMSCAN® particle designation map (Figure 1B). The only exception to this was where particles were touching, whereupon QEMSCAN® designated these as a single particle. If their combined size was greater than 10 μm, these were rejected (i.e., not recorded as particles) by the particle size filter (>10 µm upper limit set within the iMeasure software). This can be seen to have occurred for the particle coloured blue in Figure 1B, which is actually made up of a fly-ash particle, the near circular area with relatively high BSE signal in Figure 1A, which is attached to an elongate particle of coal. This aggregate was automatically excluded from the QEMSCAN® mineral map in Figure 1C.
5) Accuracy of the SIP for mineral identification. The SIP used in the study, which is based on the Sedimentary Rocks Oil and Gas 15 kV SIP supplied with the instrument, but modified to include coal and fly-ash, was developed based on the analysis of flat polished materials. Whether it was able to accurately identify the mineral for each point of analysis on non-flat particle dispersions on flat substrates was checked by manually reassessing a large number of particles using Bruker Esprit v. 1.9 software for single point X-ray elemental analysis. Figures 1, 2 and Table 5 collectively demonstrate the accurate identification of small (<10 µm) mineral particles, including those with high carbon content (Figures 1A–C), and that the EDS point analysis data is consistent with the mineral maps produced by QEMSCAN® (see Figure 2 and Tables 5, 6).
6) Low spatial resolution of SEM-EDS analysis, evident from the pixilated nature of particles in mineral maps (Figure 2). This is due to the tear-shaped volume of excitation (X-ray production) produced by the electron beam for EDS analysis, which probably has an equivalent diameter on the sample surface of up to a few µm. The exact volume excited is difficult to quantify as it depends on the composition of the material being analysed and the size and 3D shape of the particle. That the resolution is better than this is likely from the images in Figures 2G–I, where individual particles (the large diatom and small particle above) can be resolved by QEMSCAN® at a spacing of less than 2 μm, and probably closer to the 0.5 µm grid spacing of the analyses carried out on each particle.
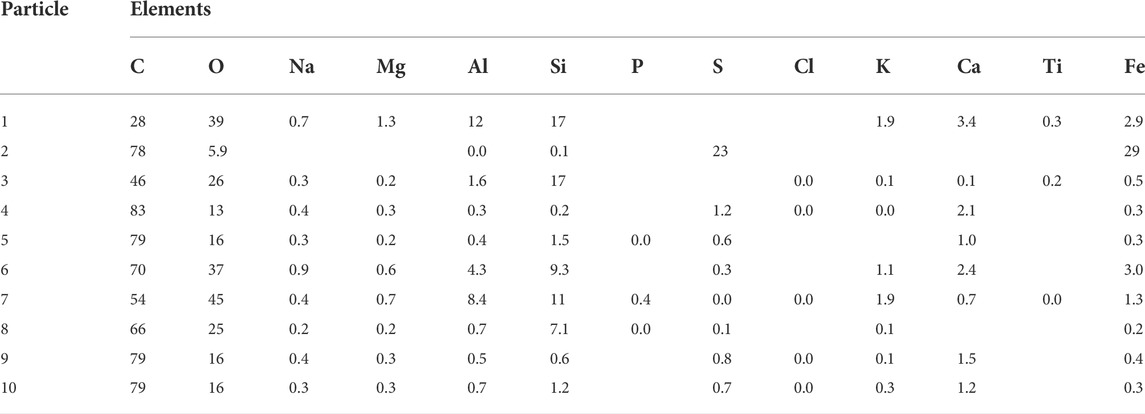
TABLE 5. SEM-EDS data showing qualitative atomic % composition from point analysis of particles labelled in Figure 1C.
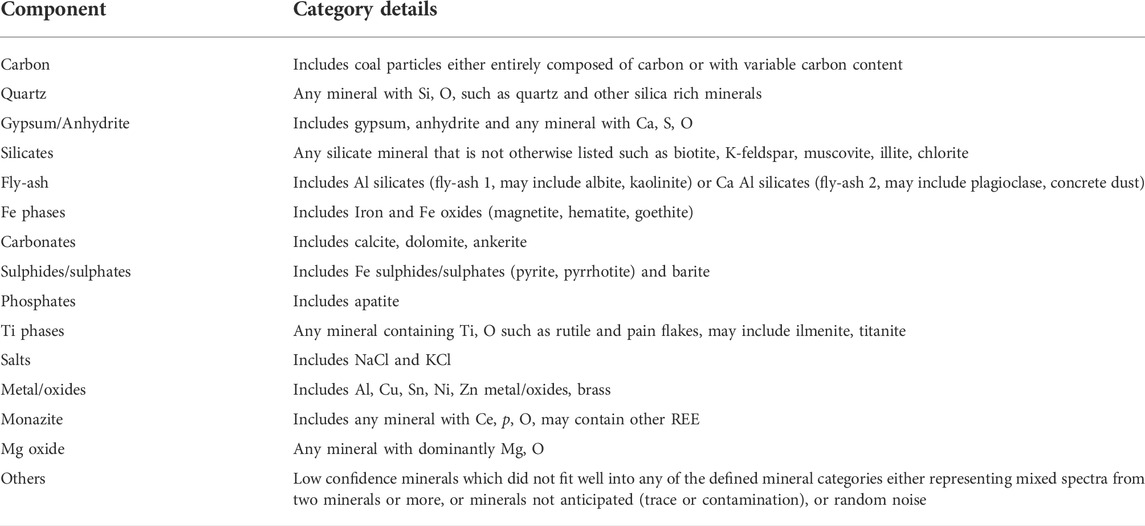
TABLE 6. QEMSCAN® mineral categories used in the data processing (short list).
Conclusion
It is clear that QEMSCAN® has significant potential to improve the characterization of coal dust PM4 and PM2.5, not only for assessments of air quality underground but also to gain a better understanding of the causes of coal mine dust toxicity and explosivity, via determining the % and sizes of potentially toxic and combustible components, respectively. Further, it could be used in tests to assess the effectiveness of control devices such as spraying systems and the performance of respiratory protective equipment. Methods could also be developed to assess dust collected on a broader range of media. It would be extremely beneficial, for example, to be able to undertake QEMSCAN® analysis of filters from respiratory protective masks and also air pump-filter collections from devices such as the CIP-10 personal air sampling system where the volume of air and mass of dust collected can be measured.
Data availability statement
The original contributions presented in the study are included in the article/Supplementary Material, further inquiries can be directed to the corresponding author.
Author contributions
DJ, GR, and BW conceived and designed the method, BW supervised the project. RL, ZL, and TP, were responsible for the gathering and supervising of dust sample collections, PR and TM, performed the size separation of dust samples. DJ and GR performed the QEMSCAN® dust analysis by data measurement and SIP development. DJ conducted the SEM and SEM-EDS analysis. All of the authors discussed the results, interpretation of data and contributed to the writing of the manuscript.
Funding
This project was funded by the European Commission, Research Fund for Coal and Steel, 754205. The open access publication fee was provided by the University of Exeter.
Conflict of interest
Author RL was employed by the company Premogovnik Velenje d.d. Authors ZL and TP were employed by the company Glowny Instytut Gornictwa
The remaining authors declare that the research was conducted in the absence of any commercial or financial relationships that could be construed as a potential conflict of interest.
The reviewer AB declared a past co-authorship with one of the authors GR.
Publisher’s note
All claims expressed in this article are solely those of the authors and do not necessarily represent those of their affiliated organizations, or those of the publisher, the editors and the reviewers. Any product that may be evaluated in this article, or claim that may be made by its manufacturer, is not guaranteed or endorsed by the publisher.
References
Andersen, J. C. O., Rollinson, G., Snook, B., Herrington, R., and Fairhurst, R. (2009). Use of QEMSCAN for the characterization of Ni-rich and Ni-poor goethite in laterite ores. Miner. Eng. 22, 1119–1129. doi:10.1016/j.mineng.2009.03.012
Cprek, N., Shah, N., Huggins, F. E., and Huffman, G. P. (2007). Distinguishing respirable quartz in coal fly ash using computer-controlled scanning electron microscopy. Environ. Sci. Technol. 41, 3475–3480. doi:10.1021/es062938j
French, D., Ward, C. R., and Butcher, A. (2008). QEMSCAN for characterisation of coal and coal utilisation products. Research Report 93. Cooperative research centre for coal in sustainable development (CCSD). Australian Black Coal Utilization Research Limited.
French, D., and Ward, C. R. (2009). “The Application of advanced mineralogical techniques to coal combustion product characterisation,” in World of Coal Ash (WOCA), Conference May 4-7, 2009 (Lexington, KY, USA: WOCA).
Greskevitch, M. F., Turk, A. R., Dieffenbach, A. L., Roman, J. M., Groce, D. W., and Hearl, F. L. (1992). Quartz analyses of the bulk dust samples collected by the national occupational health survey of mining. Appl. Occup. Environ. Hyg. 7, 527–531. doi:10.1080/1047322x.1992.10390204
Hayes, R. B., Lim, C., Zhang, Y., Cromar, K., Shao, Y., Reynolds, H. R., et al. (2019). PM2.5 air pollution and cause-specific cardiovascular disease mortality. Int. J. Epidemiol. 49, 25–35. doi:10.1093/ije/dyz114
IARC (1997). “Silica, some silicates, coal dust and para-aramid fibrils,” in IARC monographs on the evaluation of carcinogenic risks to humans (Lyon: International Agency for Research on Cancer), 68, 1–242.
Jambhulkar, H. P., Shaikh, M, S., and Kumar, M. S. (2018). Fly ash toxicity, emerging issues and possible implications for its exploitation in agriculture; Indian scenario: A review. Chemosphere 213, 333–344. doi:10.1016/j.chemosphere.2018.09.045
Li, T., Hu, R., Chen, Z., Li, Q., Huang, S., Zhu, Z., et al. (2018). Fine particulate matter (PM 2.5 ): the culprit for chronic lung diseases in China. Chronic Dis. Transl. Med. 4 (3), 176–186. doi:10.1016/j.cdtm.2018.07.002
Martin, R. S., Mather, T. A., Pyle, D. M., Power, M., Allen, A. G., Aiuppa, A., et al. (2008). Composition-resolved size distributions of volcanic aerosols in the Mt. Etna plumes. J. Geophys. Res. 113, D17211. doi:10.1029/2007jd009648
Ministry of Labour and Social Policy (2014). n.d. Regulation of ministry of Labour and and social policy of 6 june 2014 concerning the highest admissible concentrations of volume Agents harmful to health in the workplace environment. Dziennik Ustaw [Law Gazette].
Moreno, T., Trechera, P., Querol, X., Lah, R., Johnson, D., Wrana, A., et al. (2019). Trace element fractionation between PM10 and PM2.5 in coal mine dust: Implications for occupational respiratory health. Int. J. Coal Geol. 203, 52–59. doi:10.1016/j.coal.2019.01.006
NIOSH (2019). Mining Topic: Respiratory Diseases - what is the health and safety problem? AvaliableAt: https://www.cdc.gov/niosh/mining/topics/RespiratoryDiseases.html (Accessed February 17, 2020).
Perret, J., Plush, B., Lachapelle, P., Hinks, T. S. C., Walter, C., Clarke, P., et al. (2017). Coal mine dust lung disease in the modern era. Respirology 22, 662–670. doi:10.1111/resp.13034
Pirrie, D., Butcher, A. R., Power, M. R., Gottlieb, P., and Miller, G. L. (2004). Rapid quantitative mineral and phase analysis using automated scanning electron microscopy (QemSCAN); Potential applications in forensic geoscience. Sp 232, 123–136. doi:10.1144/gsl.sp.2004.232.01.12
Pirrie, D., Power, M. R., Rollinson, G. K., Wiltshire, P. E. J., Newberry, J., and Campbell, H. E. (2009). “Automated SEM-EDS (QEMSCAN) mineral analysis in forensic soil investigations; testing instrumental variability,” in Criminal and environmental soil forensics. Editors K. Ritz, L. Dawson, and D. Miller (New York, USA: Springer), 411–430.
Rahfeld, A., and Gutzmer, J. (2017). MLA-based detection of organic matter with iodized epoxy resin-an alternative to carnauba. Jmmce 05, 198–208. doi:10.4236/jmmce.2017.54017
Rollinson, G., Andersen, J. C. O., Stickland, R. J., Boni, M., and Fairhurst, R. (2011). Characterisation of non-sulphide zinc deposits using QEMSCAN. Miner. Eng. 24, 778–787. doi:10.1016/j.mineng.2011.02.004
Rollinson, G., Fusher, L., Pirrie, D., and Power, M. (2007). QEMSCAN® validation: Intra vs. Inter sample variability. The MEI (automated mineralogy). 1-2 sept 2007, and IUG (intellection user group meeting) 3-4 sept 2007. Brisbane, Australia: Stamford Plaza Hotel.
Sapko, M. J., Cashdollar, K. L., and Green, G. M. (2007). Coal dust particle size survey of US mines. J. Loss Prev. Process Ind. 20 (4), 616–620. doi:10.1016/j.jlp.2007.04.014
Sellaro, R., Sarver, E., and Baxter, D. (2015). A standard characterization methodology for respirable coal mine dust using SEM-EDX. Resources 4, 939–957. doi:10.3390/resources4040939
Speirs, J. C., McGowan, H. A., and Neil, D. T. (2008). Polar Eolian sand transport: Grain characteristics determined by an automated scanning electron microscope (QEMSCAN). Arct. Antarct. Alp. Res. 40, 731–743. doi:10.1657/1523-0430(07-029)[speirs]2.0.co;2
Więckol-Ryka, A., Krzemień, A., and Sánchez Lasheras, F. (2018). Assessing the breathing resistance of filtering-facepiece respirators in polish coal mines: A survey and laboratory study. Int. J. Ind. Ergon. 68, 101–109.
Williamson, B. J., Rollinson, G., and Pirrie, D. (2013). Automated mineralogical analysis of PM10: New parameters for assessing PM toxicity. Environ. Sci. Technol. 47, 5570–5577. doi:10.1021/es305025e
World Health Organization (1999). Hazard prevention and control in the work environment: Airborne dust. Geneva, Switzerland: WHO/SDE/OEH/99.14.
Keywords: coal mining, dust, PM4, PM2.5, QEMSCAN®, automated mineralogy
Citation: Johnson D, Rollinson GK, Arif AT, Moreno T, Ruiz PT, Lah R, Lubosik Z, Pindel T, Gminsk R and Williamson BJ (2022) QEMSCAN® automated mineralogical analysis of PM2.5 and PM4: A preliminary study of underground coal mine dust from Poland and Slovenia. Front. Earth Sci. 10:788928. doi: 10.3389/feart.2022.788928
Received: 03 October 2021; Accepted: 10 August 2022;
Published: 21 September 2022.
Edited by:
Iris Buisman, University of Cambridge, United KingdomReviewed by:
Aurélie Pelfrene, JUNIA ISA, FranceAlan R. Butcher, Geological Survey of Finland, Finland
Copyright © 2022 Johnson, Rollinson, Arif, Moreno, Ruiz, Lah, Lubosik, Pindel, Gminsk and Williamson. This is an open-access article distributed under the terms of the Creative Commons Attribution License (CC BY). The use, distribution or reproduction in other forums is permitted, provided the original author(s) and the copyright owner(s) are credited and that the original publication in this journal is cited, in accordance with accepted academic practice. No use, distribution or reproduction is permitted which does not comply with these terms.
*Correspondence: Diane Johnson, RGlhbmUuSm9obnNvbkBDcmFuZmllbGQuYWMudWs=