 Colin R. Rowell
  A. Mark Jellinek
  Sahand Hajimirza 2
 Thomas J. Aubry
 - 1Department of Earth, Ocean, and Atmospheric Sciences, University of British Columbia, Vancouver, BC, Canada
- 2Department of Earth, Environmental, and Planetary Sciences, Rice University, Houston, TX, United States
- 3Department of Geography, University of Cambridge, Cambridge, United Kingdom
- 4Sidney Sussex College, Cambridge, United Kingdom
Explosive volcanic eruptions can inject sulfur dioxide (SO2) into the stratosphere to form aerosol particles that modify Earth’s radiation balance and drive surface cooling. Eruptions involving interactions with shallow layers (≤500 m) of surface water and ice modify the eruption dynamics that govern the delivery of SO2 to the stratosphere. External surface water controls the evolution of explosive eruptions in two ways that are poorly understood: 1) by modulating the hydrostatic pressure within the conduit and at the vent, and 2) through the ingestion and mixing of external water, which governs fine ash production and eruption column buoyancy flux. To make progress, we couple one-dimensional models of conduit flow and atmospheric column rise through a novel “magma-water interaction” model that simulates the occurrence, extent and consequences of water entrainment depending on the depth of a surface water layer. We explore the effects of hydrostatic pressure on magma ascent in the conduit and gas decompression at the vent, and the conditions for which water entrainment drives fine ash production by quench fragmentation, eruption column collapse, or outright failure of the jet to breach the water surface. We show that the efficiency of water entrainment into the jet is the predominant control on jet behavior. For an increase in water depth of 50–100 m, the critical magma mass eruption rate required for eruption columns to reach the tropopause increases by an order of magnitude. Finally, we estimate that enhanced emission of fine ash leads to up to a 2-fold increase in the mass flux of particles
1 Introduction
Volcanic SO2 injected into the stratosphere forms sulfate aerosols that persist for 1–3 years, affect Earth’s radiation balance and produce one of the strongest natural surface climate cooling mechanisms (Timmreck, 2012; Sigl et al., 2015; Kremser et al., 2016). Although the direct radiative forcing from volcanic aerosols typically acts over annual to decadal timescales (Robock, 2000), the last decade of research has shown that the climate impacts of eruptions are not restricted to discrete and intermittent cooling events with durations of a few years. For example, volcanic emission from small to moderate eruptions and passive degassing provide background concentrations of sulfate aerosols, resulting in a near-continuous negative (cooling) forcing to the planetary surface (Solomon et al., 2011; Schmidt et al., 2012; Santer et al., 2014). Furthermore, a growing body of evidence suggests that volcanic forcing from aerosols can also drive non-linear climate responses on multidecadal to millennial timescales (Zhong et al., 2011; Schleussner and Feulner, 2013; Zanchettin et al., 2013; Santer et al., 2014; Baldini et al., 2015; Toohey et al., 2016; Soreghan et al., 2019; Mann et al., 2021). The strength of aerosol climate forcing depends strongly on the SO2 mass flux to the stratosphere (e.g., Marshall et al. (2019)), which is governed by the eruption magnitude and eruption column height (the altitude at which gas and ash are dispersed as a neutrally buoyant cloud) relative to the tropopause (Aubry et al., 2019; Krishnamohan et al., 2019; Marshall et al., 2019; Aubry et al., 2021b). In addition to the injection height of SO2, the chemistry and microphysics governing aerosol formation and stratospheric residence time are also critical controls on the climate effects of eruptions (Timmreck, 2012; Kremser et al., 2016; LeGrande et al., 2016; Zhu et al., 2020; Staunton-Sykes et al., 2021). SO2 is frequently transported together with fine ash and water from the eruption column (e.g., Rose et al., 2001; Joshi and Jones, 2009; Ansmann et al., 2011), where chemical scavenging of SO2 onto ash surfaces (Rose, 1977; Schmauss and Keppler, 2014) and physical incorporation into hydrometeors (Rose et al., 1995; Textor et al., 2003) can scrub SO2 from the eruption column. Water transported by the eruption cloud can enhance nucleation and growth rates of aerosol particles (LeGrande et al., 2016), and ash particles provide sites for aerosol nucleation or direct uptake of SO2 (Zhu et al., 2020). Consequently, the presence of water and fine ash influences resulting aerosol formation rates, particle sizes, optical properties, and residence times, which are key parameters governing climate forcing (Kremser et al., 2016). Constraining the climate impacts of volcanic eruptions therefore requires understanding of eruption transport processes governing injection height, as well as the quantities of fine ash and water in eruption columns and clouds.
Climate-forcing related to eruptions is sensitive to the environmental conditions of eruptions as well as global eruption frequency-magnitude distributions, both of which can evolve with global climate warming or cooling. For example, sustained anthropogenic climate change will drive an increase in the strength of tropospheric density stratification and tropopause height, and alter stratospheric circulation. These atmospheric changes are expected to reduce the stratospheric delivery of SO2 in moderate-magnitude eruptions (Aubry et al., 2016, 2019), while exacerbating the radiative effects of relatively rare, large-magnitude eruptions (e.g., Pinatubo 1991) (Aubry et al., 2021b). Other potential mechanisms for climatic influence on volcanism include eruption triggering by extreme rainfall events (e.g., Elsworth et al., 2004; Capra, 2006; Farquharson and Amelung, 2020) or changes to ocean stratification (Fasullo et al., 2017). Glacial-interglacial cycles also influence rates and locations of global volcanism: The advance and retreat of ice sheets and thickening and thinning of mountain glaciers can inhibit or enhance, respectively, melt generation, dike formation, eruption rates and eruption frequency (Jull and McKenzie, 1996; Jellinek et al., 2004; Huybers and Langmuir, 2009; Watt et al., 2013; Baldini et al., 2015; Cooper et al., 2018). For example, Huybers and Langmuir (2009) correlated observed spikes in atmospheric CO2 with inferred increases in the rate of volcanism following the Last Glacial Maximum, and proposed a glaciovolcanic-CO2 feedback, where enhanced rates of volcanism and CO2 outgassing contribute to additional warming and ice sheet loss. Increases in both sea level and in the occurrence and extents of freshwater lakes and ponds with deglaciation are also likely to increase the frequency of direct interactions of erupting magma with surface water. Crucially, the implications of potentially enhanced magma-water interaction (MWI) for volcano-climate forcing remain largely unexplored.
Explosive volcanic eruptions involving interactions of magma with external surface water or ice (termed hereafter hydrovolcanic eruptions) evolve as a result of thermophysical and chemical processes that are wholly distinct from those of “dry” magmatic eruptions (those in which the main component of water present is that exsolved from the melt) (Self and Sparks, 1978; Houghton et al., 2015). Figure 1 shows a summary of hydrovolcanic eruption processes affecting the transport and stratospheric delivery of SO2 as compared with purely magmatic eruptions. The presence of external surface water influences eruption dynamics and evolution through two primary controls: 1) a modulation of hydrostatic pressure at the vent and within the erupting conduit, and 2) through effects of the entrainment and thermal and mechanical mixing of water into an erupting gas-pyroclast mixture on the mass, momentum, particle and enthalpy fluxes that ultimately drive column rise (Woods, 2010; Wohletz et al., 2013; Smellie and Edwards, 2016; Cas and Simmons, 2018). Increased hydrostatic pressure can, for example, reduce eruption explosivity by suppressing bubble nucleation and growth in the conduit, reducing magma decompression and ascent rates, and potentially preventing magmatic fragmentation (Smellie and Edwards, 2016; Cas and Simmons, 2018; Manga et al., 2018). In contrast, secondary fragmentation and ash production can be relatively enhanced as a result of the actions of large thermal stresses arising through the rapid transfer of heat from hot pyroclasts to entrained surface water (Gonnermann, 2015; van Otterloo et al., 2015; Zimanowski et al., 2015). Heat consumption by the vaporization of entrained external water results in a loss (or redistribution) of the thermal buoyancy delivered by the eruption at the vent, which may be recovered via condensation higher in the plume where temperatures are colder (Koyaguchi and Woods, 1996).
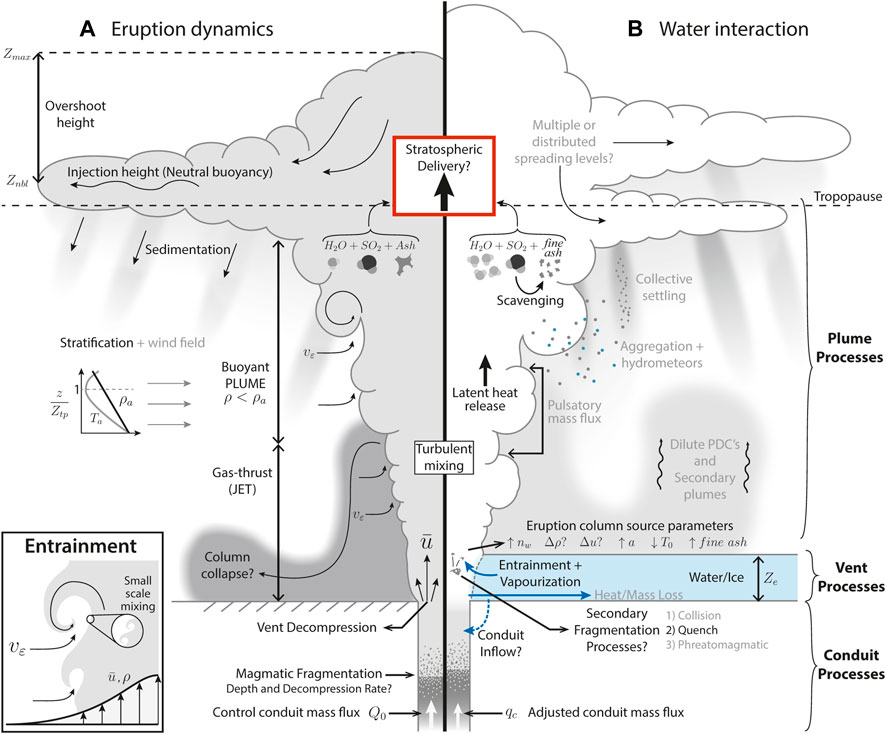
FIGURE 1. Summary of eruption processes from conduit to atmospheric dispersal. See text for a description of processes and their relevance for SO2 transport. See Table 1 for a complete description of symbols. (A) Dynamical processes during a sustained, “dry” Plinian eruption. Inset: illustration of the entrainment process. (B) Summary of processes influenced by surface water interaction during a hydrovolcanic eruption. Processes in lighter gray text are those not considered in this study, but which are relevant to hydrovolcanic eruptions processes and may play a role in stratospheric delivery of SO2.
The extent to which water is mixed into the erupting jet and the efficiency of heat transfer between hot pyroclasts and this ingested water control the eruption column source parameters (e.g. bulk temperature, density, velocity, and column radius) (Koyaguchi and Woods, 1996; Mastin, 2007b), as well as the intensity of secondary fragmentation and ash production that governs the ultimate particle size distribution (PSD - we refer to total particle size distributions throughout unless otherwise stated) (Mastin, 2007a; van Otterloo et al., 2015). The character of the PSD governs the rates of particle aggregation and sedimentation, as well as the available particle surface area (Bonadonna et al., 1998; Brown et al., 2012; Girault et al., 2014). In particular, increased water content, ash surface area, and relatively colder temperatures in the rising eruption column provide conditions that enhance chemical scavenging of SO2 during transport and dispersal relative to dry eruptions (Schmauss and Keppler, 2014). For example, Textor et al. (2003) simulate dynamical, chemical, and microphysical processes occurring in a dry Plinian eruption and estimate that the percent of SO2 erupted at the vent that is ultimately injected into the stratosphere was ≳ 80%. However, in marked contrast, for the glaciovolcanic eruption of Grimsvoẗn in 2011, Sigmarsson et al. (2013) estimate that approximately 50% of the exsolved sulfur gas was dispersed to the atmosphere, with much of the remainder lost to scavenging by ash particles or external surface water. As another provocative example, the recent powerful and water-rich eruption of Hunga Tonga-Hunga Ha’apai injected an eruption cloud to at least 30–35 km above sea level. Despite a cloud height comparable to the 1991 eruption of Mt. Pinatubo (Bluth et al., 1997), preliminary analyses have suggested stratospheric loading of SO2 for the recent eruption is likely comparatively negligible. The exact cause for this discrepancy between apparent eruption magnitude and SO2 output for Hunga Tonga-Hunga Ha’apai relative to Mt. Pinatubo is currently undetermined, but the water-rich nature of the eruption is one possible cause.
Magma-water interactions (MWI) and their effects throughout an eruptive phase are maximized in persistent deep layers of water where significant entrainment can occur over the time of column rise. In subglacial or subaqueous environments where water availability is limited by, say, ice melting and melt-water drainage (e.g., Gudmundsson et al., 2012; Magnússon et al., 2012), build-up of insulating volcanic tephra (e.g., Fee et al., 2020), or by simply the finite volume of a reservoir (e.g., Gudmundsson et al., 2014), water access to the volcanic vent can decline during an eruption, causing the extent of MWI to evolve, in turn. With declining water layer depths, eruptions styles may progress from an initial suppression of explosive behavior, to collapsing jets, to buoyant plumes of increasing height (Koyaguchi and Woods, 1996; Mastin, 2007b; Van Eaton et al., 2012; Wohletz et al., 2013; Manga et al., 2018). This evolution is important to recognize: the degree to which an erupting magma interacts with surface water can exert critical control over the ultimate delivery of ash, water, and SO2 into the troposphere and stratosphere (Rose et al., 1995). Although observational, experimental, and numerical studies have individually investigated processes relevant to hydrovolcanic eruptions, it is critical to assess their behavior as a system to reveal controls on the ultimate fate of erupted ash and gas.
To make critical progress in understanding the extent to which surface water governs the character and magnitude of volcano-climate forcing, it is necessary to examine syn-eruptive processes that determine the transport and ultimate fate of volcanic SO2. In particular:
1) How do hydrostatic pressure, water entrainment, and MWI affect the coupled dynamics of gas exsolution and magma fragmentation in the subterranean conduit, heat transfer from pyroclasts to external water, secondary production of fine ash, and transport of ash, water, and SO2 in the eruption column?
2) To what extent can MWI processes and their control on eruption source conditions be quantitatively linked to the observable thickness or abundance of a surface water layer?
3) What are the critical relationships among water mass fraction at the eruption column source and mass fluxes of SO2, fine ash, and water to the stratosphere?
In this study, we address these questions using coupled conduit-plume 1D numerical simulations of sustained, sub-Plinian to Plinian hydrovolcanic eruptions with rhyolitic magma compositions. We estimate the sensitivity of the efficiency of stratospheric SO2 injection to the presence of water layers up to 500 m deep. The model approach consists of three coupled components (see Figures 1, 2): 1) a 1D conduit model simulating magma ascent and fragmentation (Hajimirza et al., 2019), which we modify with an arbitrary hydrostatic pressure boundary condition applied at the vent; 2) a novel near-field “vent” model simulating decompression of the initial gas-pyroclast mixture, water entrainment, and quench fragmentation as a function of surface water depth Ze; and 3) a modified version of the 1D eruption column model from Degruyter and Bonadonna (2012), incorporating a particle size distribution with sedimentation following Girault et al. (2014). We focus our analysis on the main factors affecting overall column rise (e.g., magma ascent and fragmentation, MWI and eruption column source parameters, and resulting column gravitational stability, height, and sedimentation) and environmental conditions for vertical SO2 transport (e.g., temperature, water mass fluxes, and mass and surface area of ash particles). In considering only column height, entrainment of water mass, and particle loss, we neglect a number of issues that will enter into more complete future treatments of an SO2 delivery efficiency: 1) a thermodynamic control in the conduit on the SO2 solubility behaviour below the fragmentation depth; 2) the coupled microphysics and kinetics of SO2 scavenging by ash particles sedimenting from the column and overlying umbrella cloud through various mechanisms (Rose, 1977; Bursik et al., 1992; Durant et al., 2009; Niemeier et al., 2009; Carazzo and Jellinek, 2012; Manzella et al., 2015); and 3) the kinetics of sulfur aerosol nucleation and growth (Kremser et al., 2016) with or without ash (Zhu et al., 2020). As a consequence of ignoring the above effects, our study does not address: 1) effects on the amount of sulfur gas exsolved from the melt (e.g. possibly reduced SO2 exsolution due to hydrostatic pressure); 2) scavenging and sedimentation of sulfur species during eruption and column ascent (i.e., we assume 100% of exsolved sulfur is transported along with the column and is delivered to the final buoyancy level or is carried downwards with column collapse); 3) the formation, dispersal, atmospheric lifetime, and radiative effects of sulfate aerosols following co-injection of SO2, ash, and water into the spreading eruption cloud. However, we discuss the implications of co-injection of SO2 with enhanced quantities of fine ash and water in Section 4.
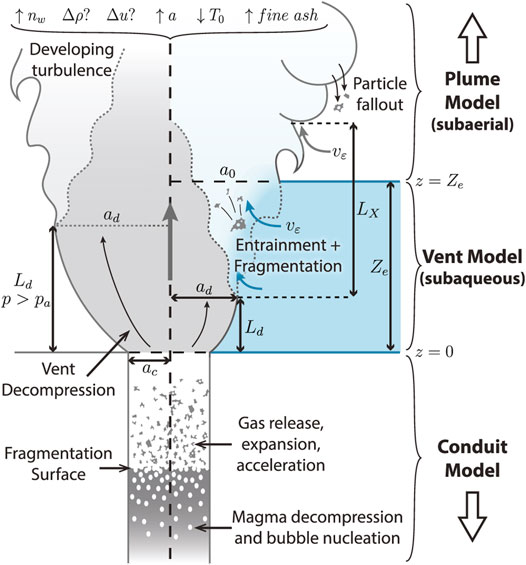
FIGURE 2. Schematic summary of coupled model, highlighting geometry of the vent and MWI region. The left and right sides are divided between a control scenario with no external water and a scenario with a shallow water layer, respectively. In the hydrovolcanic case, decompression of the erupting jet of gas and pyroclasts is suppressed relative to the dry control scenario (indicated by decompression length Ld and radius ad), and initiation of turbulent mixing with external water results in water entrainment and quench fragmentation. In the water layer scenario shown here, water depth Ze is greater than the decompression length Ld but less than the height at which large entraining eddies are fully developed, Ld + LX. See Table 1 and Sections 2.2, 2.3, and 2.4 for a complete description of symbols and processes.
2 Methods
2.1 A Model of Sustained, Explosive Hydrovolcanism
Our focus is on sustained eruptions with sufficient momentum and buoyancy fluxes at the column source, which we will define carefully below, to inject SO2 into the stratosphere. Consequently we restrict our analysis and modelling efforts to a class of powerful eruptions driven by magmatic vesiculation and fragmentation in the conduit, where the gas-pyroclast mixture is modified by the entrainment and mixing of external water that is primarily confined to the surface environment. This approach is motivated by observations of pyroclast textures and particle size distributions from several hydrovolcanic eruptions, including the 25 ka Oruanui and 1.8 ka Taupo eruptions, New Zealand (Self and Sparks, 1978; Wilson and Walker, 1985), the 2500 BP Hverfjall Fires eruption (Liu et al., 2017), the 10th century eruption of Eldgjá Volcano, Iceland (Moreland, 2017; Moreland et al., 2019), the 1875 eruption of Askja Volcano, Iceland (Self and Sparks, 1978; Carey et al., 2009), and the 2011 eruption of Grímsvötn (Liu et al., 2015). Whereas airfall deposits from dry phases of each of these eruptions have total PSDs and porosities typical of Plinian events (Cas and Wright, 1987; Fisher and Schmincke, 2012), PSDs from wet eruption phases are relatively fines-enriched. Observations of PSDs, pyroclast textures and vesicularities from these events lead to the interpretation that melts fragmenting inside the conduit produce approximately similar PSDs that are modified, in turn, through a “secondary” episode of fragmentation related to the quenching of the gas-pyroclast mixture within overlying surface water layers (Liu, 2016; Aravena et al., 2018; Houghton and Carey, 2019; Moreland et al., 2019). In principle, PSDs can also be modified through effects of groundwater infiltration through the conduit walls, which can be enhanced with an overlying water layer as has been suggested on the basis of field observations (Barberi et al., 1989; Houghton and Carey, 2019). However, numerical simulations of Aravena et al. (2018) demonstrate that the extent of groundwater infiltration from 100 to 300 m-thick aquifers perched at or above the fragmentation depth depends on the magma mass eruption rate (MER). Crucially, for MER ≳ 5 × 10⁶ kg/s, which is typical of the sustained explosive eruptions and rhyolitic magma composition on which we focus, Aravena et al. (2018, Supplementary Material) find that water infiltration into the conduit flow is largely restricted to less than about 5–6 wt% for rhyolitic magmas. In addition, their calculations suggest that conduit failure or collapse is likely favored where ingested water mass fractions in the conduit exceed about 5 wt%. Aravena et al. (2018) further suggest this condition may by an explanation for why phreatomagmatic activity associated with direct interaction of un-fragmented melt with external water is more commonly dominant in eruptions with relatively low MER, a result consistent with field observations (Walker, 1981; Houghton and Wilson, 1989; Cole et al., 1995; Houghton and Carey, 2019; Moreland et al., 2019); for completeness we include eruptions with MER as low as 5.5 × 10⁵ kg/s, however we note that the above assumptions are likely less valid for these low values.
Taking these observations and inferences into consideration in our modelling approach, we assume that secondary fragmentation from MWI is driven predominantly by quench fragmentation (also known as thermal granulation) (van Otterloo et al., 2015), as opposed to phreatomagmatic fragmentation by molten-fuel-coolant interaction (Büttner et al., 2002). Following Jones et al. (2019), Hajimirza et al. (2022) the MWI model is based on the physics of water entrainment for a subaqueous jet as well as the energetics of quench fragmentation. We do not consider classes of hydrovolcanic events driven primarily by episodic molten-fuel coolant interactions (Wohletz et al., 2013; Houghton et al., 2015; Zimanowski et al., 2015). We focus on eruptive phases in a sub-Plinian to Plinian to Phreatoplinian continuum under established classification schemes (Walker, 1973; Self and Sparks, 1978). Furthermore, we model only the sustained, steady-state phases of these events. Figure 2 shows a conceptual overview of the problem definition and model setup in the near-vent region where an erupting jet emerges from the volcanic vent and encounters a shallow (
2.2 1D Conduit Model
We use the one dimensional conduit model of Hajimirza et al. (2021) and integrate flow properties over the cross-sectional area of the conduit. We assume a vertical cylindrical conduit with radius ac and depth z (for a complete description of mathematical symbols and nomenclature, see Table 1). The conduit radius is fixed except near the surface, where flaring near the vent is possible to enforce mass conservation for a choked flow at the vent (Gonnermann and Manga, 2013). We assume the flow is steady - i.e., the duration of magma ascent is much shorter than the duration of Plinian eruptions (Mastin and Ghiorso, 2000). The magma is a mixture of rhyolitic melt (76% SiO2) and H2O bubbles that exsolve continuously during ascent because H2O solubility is proportional to the square root of pressure. We also assume crystals are only present as a dilute suspension of uniformly distributed sub-micron scale microphenocrysts that enable a 1D approximation of heterogeneous bubble nucleation (Shea, 2017). This simplified picture also leads to assumptions that the presence of microphenocrysts has negligible effects on magma density and rheology. Thus, below the level of fragmentation we define magma as a mixture of silicate melt and H2O bubbles, and we assume the melt phase is incompressible (Massol and Koyaguchi, 2005). The flow transitions discontinuously above the level of fragmentation to a dilute mixture of continuous H2O vapor with suspended fragments of vesicular pyroclasts. For model purposes, we treat water as the only magmatic volatile: SO2 (and other gases) do not contribute to the thermodynamic state of the magma and are carried within the mixture passively. We use the term “gas” interchangeably with water vapor throughout unless otherwise stated.
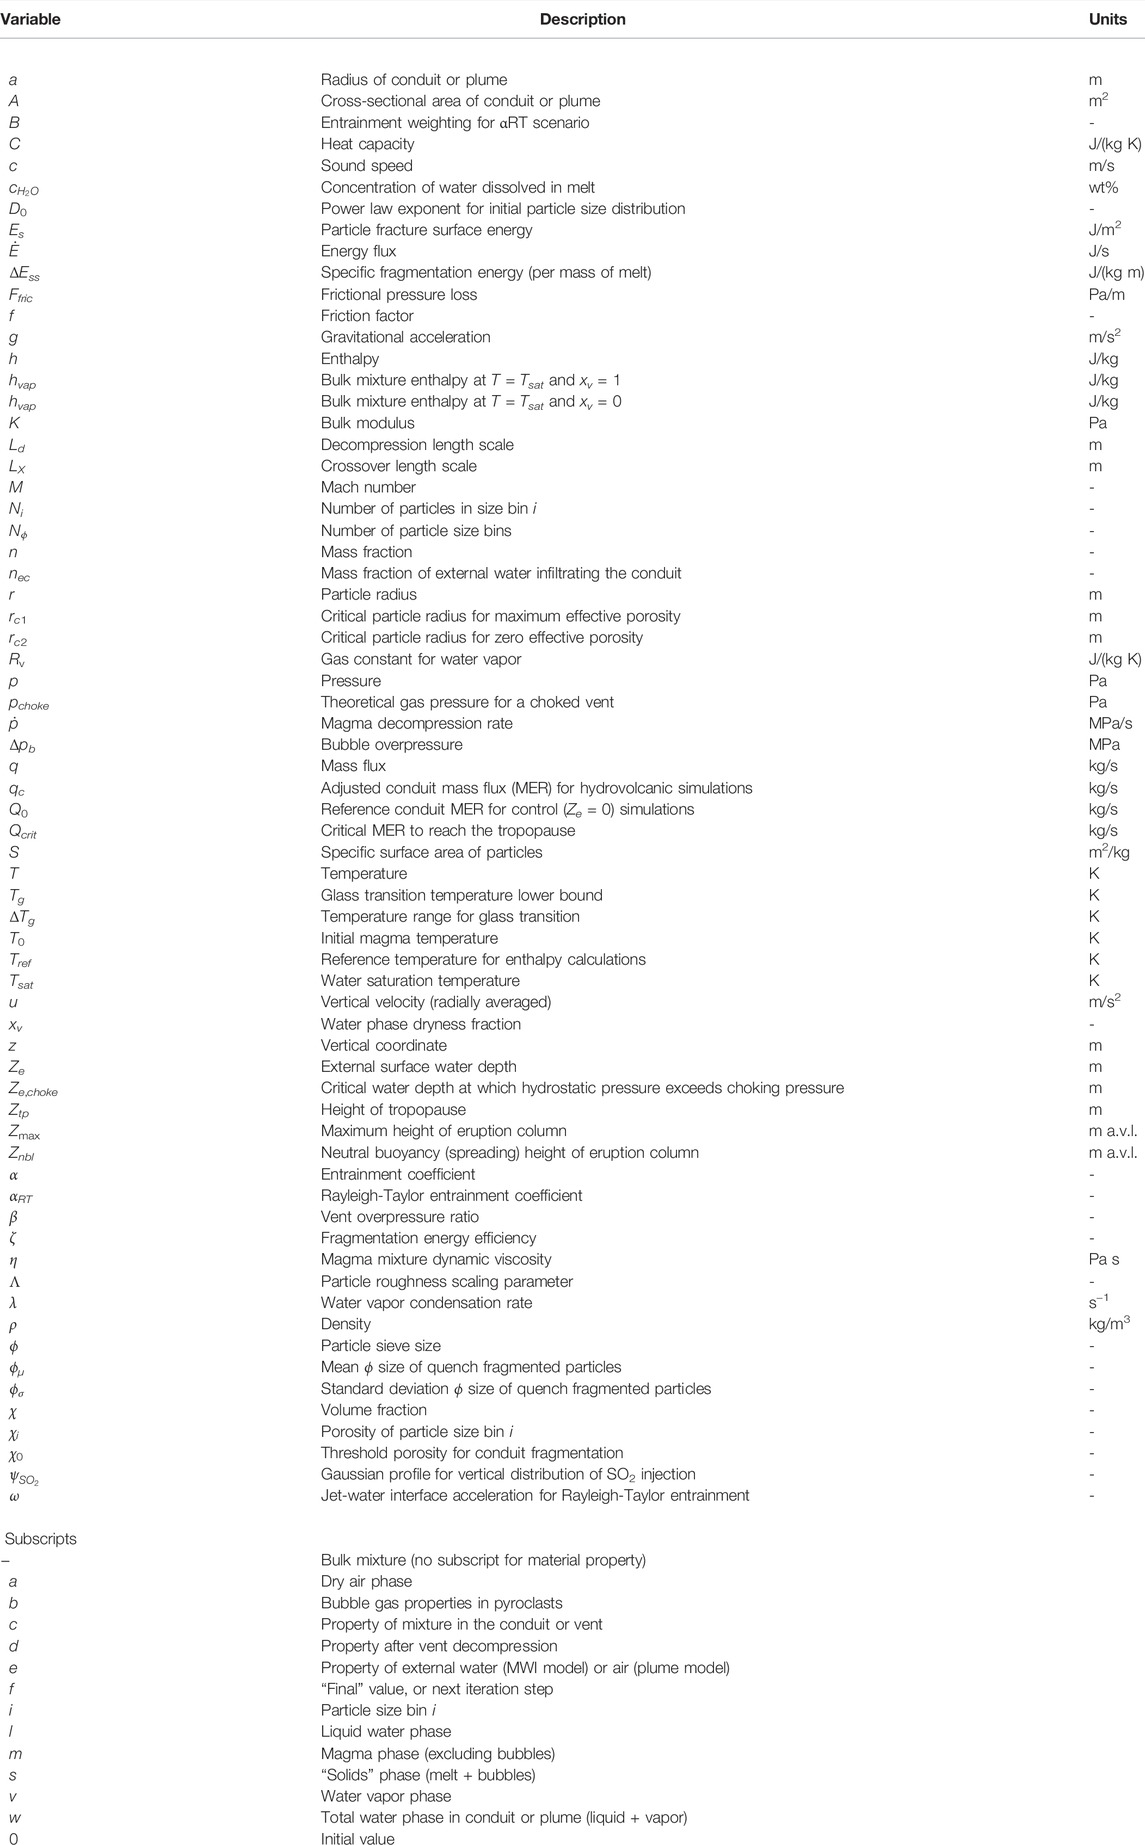
TABLE 1. List of variables and subscript nomenclature.
We assume the relative velocity between the melt/pyroclast and bubble/gas phases to be negligible below and above the fragmentation level. Below fragmentation, bubbles are entrained in the very viscous melt and the magma rises as a foam (e.g., Mastin and Ghiorso, 2000; Gonnermann and Manga, 2007). Above fragmentation, a real volcanic flow will experience complex phenomena including solid/gas phase separation and sound wave dispersion, as well as buoyancy effects including the excitation of compaction and porosity waves (e.g., Bercovici and Michaut, 2010; Michaut et al., 2013). Such dynamics are important for degassing and can modify fragmentation processes in one-dimensional conduit models. However, their inclusion is practically challenging and the effect of resulting fluctuations in MER on the height and gravitational stability of steady-state plumes is ultimately small in comparison to controls arising through parameterizations for water and air entrainment. For simplicity and to retain a focus on the effect of entrainment and MWI on plume height and SO2 delivery to the stratosphere, we neglect these dynamics and apply the common pseudo-gas approximation for fully-coupled gas and particle flow (Wilson et al., 1980; Mastin and Ghiorso, 2000). The properties of the magma mixture (melt and bubbles or gas and pyroclasts) are, consequently, the volumetric average of the two phases. We also assume the conduit flow to be isothermal (Colucci et al., 2014) because heat loss to conduit walls is negligible over the time scale of rise through the depth z (Mastin and Ghiorso, 2000). The latent heat flux consumed through the exsolution of H2O with magma ascent helps to enforce this condition, although the effect is very small.
With these assumptions and simplifications, conservation of mass and momentum for the ascending magma are (Wilson et al., 1980; Mastin and Ghiorso, 2000)
and
respectively. Here u is magma ascent rate and
where χv is the volume fraction of bubbles, and ρv and ρm = 2,400 kg/m3 are gas and melt densities respectively. The frictional pressure loss Ffric = ρu2f/ac where f is a friction factor. Below the fragmentation depth f = 16/Re + f0 and above the fragmentation depth f = f0. Here, the Reynolds number Re = 2ρua/η, where η is the viscosity of the mixture. The reference friction factor f0 = 0.0025 depends on the conduit wall roughness (Mastin and Ghiorso, 2000). By substituting Eqs. 1 and 2 and defining the isothermal mixture sound speed
we obtain (Gonnermann and Manga, 2013; Hajimirza et al., 2021)
where the Mach number M = u/c. Below the fragmentation depth the sound speed of the mixture c = (K/ρ)1/2, where K is the bulk modulus of the mixture given by:
Above the fragmentation depth, the bulk modulus of the gas phase Kv is calculated for the mixture temperature from the equation of state for water (Holloway, 1977).
The conduit model includes treatments for water vapor exsolution from the melt and subsequent bubble growth from Hajimirza et al. (2021). At a given depth below fragmentation, heterogeneous bubble nucleation on crystal nanolites occurs with a specified critical supersaturation, and growth is by the diffusion of water from the melt. Above the fragmentation depth the bubble volume and number density are fixed, although vapor can continue to exsolve and escape from pyroclasts into the surrounding free vapor by permeable flow. We employ a fixed porosity threshold of 75% as a fragmentation condition, which is consistent with measurements and analyses of pumice permeabilities and vesicle size distributions that show that PSDs follow power laws comparable to those of pore-scale microstructures in erupted pumice (Kaminski and Jaupart, 1998; Rust and Cashman, 2011). We consequently do not fix a PSD in the conduit and assume only that fragmentation proceeds to small enough length scales such that gas escape from connected pores in the entrained pyroclasts is sufficient to ensure that pore-scale pressures are equivalent to the free gas in the conduit at the vent (Rust and Cashman, 2011).
Assuming negligible gas escape or water infiltration through conduit walls, the primary effect of overlying surface water or ice is to modify the pressure boundary condition at the volcanic vent. Above magmatic fragmentation, the gas-pyroclast mixture fluidizes, accelerates, and decompresses towards the conduit exit. If the flow speed remains below the mixture sound speed c, then the vent exit pressure pc must balance the ambient pressure above the vent pe, which is determined by water depth:
Here ρe is the density of external water and patmo is the atmospheric pressure at the water surface. However, if M → 1, the flow becomes choked, which causes the flow at vent to be overpressured relative to ambient (Gonnermann and Manga, 2013). As a metric for vent overpressure, we introduce the vent overpressure ratio β = pc/pe. To enforce mass conservation for choked flow, either choking must occur at the vent exit of a fixed radius conduit or the conduit radius must flare accordingly (Gonnermann and Manga, 2013). The conduit modelling approach is therefore to seek solutions where the pressure in the conduit flow matches the surface pressure boundary condition (i.e., β ≈ 1), or for which the conduit is choked at (no flaring) or near (with flaring) the vent (i.e., β ≳ 1, M ≈ 1).
To gain insight into how an ascending magma responds to changes in hydrostatic pressure related to loading by overlying layers of water or ice, it is instructive to compare solutions for eruptions with and without external water, with other independent parameters fixed. To this end we choose a fixed conduit depth z = 6 km, an initial magmatic temperature T0 = 1,123.15 K and a maximal (unexsolved) magmatic water content corresponding to saturation as determined with the method of Liu et al. (2005). We then use an iterative search to find conduit parameters that satisfy either the pressure-balanced or choked conditions. We first allow conduit radius to vary to obtain solutions for a “dry” or subaerial vent where no external water is present and the ambient pressure above the vent is equal to atmospheric (Ze = 0). Subaerial vent simulations were run and suitable conduit radii obtained for a range of “control” MER 105.5 ≤ Q0 ≤ 109 kg/s, and we refer to these subaerial vent scenarios as “control” simulations hereafter. For control scenarios, we seek specifically solutions where choking occurs at the vent exit and thus no conduit flaring is required. This calculation provides a reference conduit radius to use in scenarios with a water layer present above the vent, with water depths 0 < Ze ≤ 500 m. For these hydrovolcanic cases, we then fix the conduit radius to that of the control scenario and find an adjusted conduit MER qc such that the surface pressure and/or choking boundary conditions are again satisfied. All values of MER referred to herein (i.e., Q0, qc) indicate magmatic mass fluxes in the conduit (i.e., excluding external water). See Supplementary Figure S2 for a visualization of the search process for conduit radius and MER in control and hydrovolcanic cases, respectively. Although we choose MER as our adjusted parameter, other parameter choices are possible, such as the excess pressure of the magma reservoir at the base of the conduit or modification of the vent geometry. To make clear our approach and the consequences of our approximations and simplifications, see Section 3.1 for example conduit model results.
2.3 Vent and Magma-Water Interaction Model
2.3.1 Initial Particle Size Distribution
The model PSD is specified explicitly at the vent (z = 0) using output from the conduit model. We define an initial power-law PSD following Kaminski and Jaupart (1998) and Girault et al. (2014), over the particle size range −10 ≤ ϕi ≤ 8. The number of particles Ni at size ϕi is given by
where D0 is the power-law exponent, N0 is an arbitrary normalization constant, and subscript i indicates a particle size bin. We choose a default value of D0 = 2.9. Each size class is assigned an effective porosity value χi on the basis of an effective particle radius according to
Here, χ0 = 0.75 is the porosity threshold for fragmentation, ri is the particle radius for bin i, rc1 = 10–2 m and rc2 = 10–4 m. Particles of sufficiently small size have, thus, no effective porosity and densities equal to that of the pure melt phase (ρs,i = ρm). By contrast, the density of larger particles is a strong function of porosity and bubble gas density (Kaminski and Jaupart, 1998). This approach leads to expressions for particle mass fraction in each size bin, ns,i, and the bubble gas mass fraction of each size bin, nb,i:
where subscript s denotes the bulk “solids” phase (melt plus bubbles) and Nϕ is the number of particle size bins. Figure 3D shows the initial PSD for D = 2.9, accounting for particle density as a function of porosity (light gray line and square symbols).
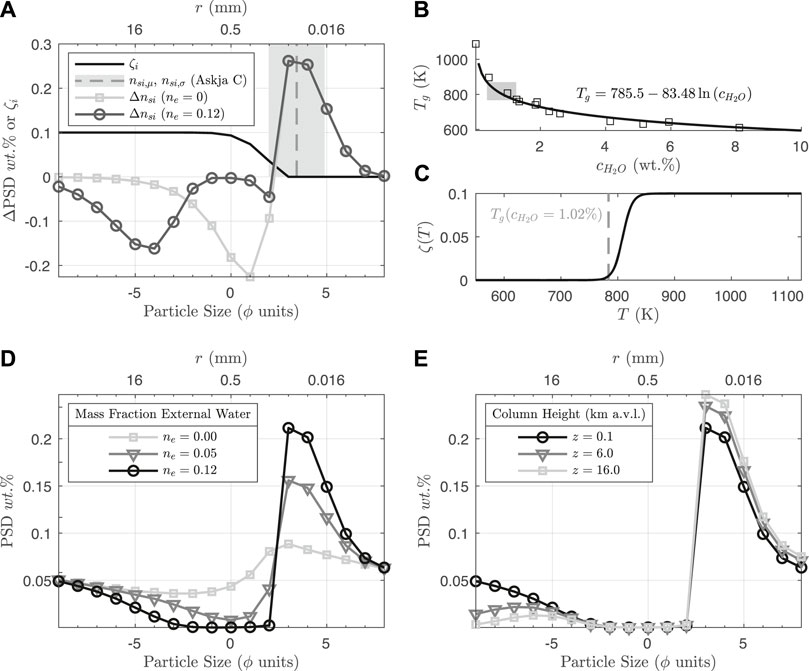
FIGURE 3. PSD and quench fragmentation model for rhyolitic melt, using a single example simulation with q = 1.03 × 10⁸ kg/s, Ze = 120 m, and ζ = 0.1. (A) Change in PSD (Δns,i = −nsi,0 + nsi,f) from Eq. 52 at two different mass fractions of entrained external water ne. The “output” particle sizes of quench fragmentation nsi,f are defined from the mean and standard deviation (in ϕ units, shown as the vertical grey dashed line and shaded region, respectively) of the Askja phase C deposit, as reported in Costa et al. (2016). The“input” particle sizes − nsi,0 (i.e., from which mass is removed to generate the products of quench fragmentation), are a function of available surface area in the PSD coarse fraction (Equation 49), and evolve as the total PSD coarse fraction is progressively depleted with increasing ne (see also panel (D)). The solid black line shows ζi (Equation 47), which defines the size bins for the “coarse” fraction. (B) Glass transition temperature Tg data from Dingwell (1998) (squares) and curve fit (black line) as a function of concentration of dissolved water in the melt. The grey shaded rectangle shows the range of values in the Reference set of simulations after exit from the vent. (C) Fragmentation energy efficiency as a function of temperature (Equations 45, 46) for Tg = 784 K. (D) Evolution of the total PSD ns,i during quench fragmentation. The initial power law PSD, with no external water, and therefore no quench fragmentation (ne = 0), is shown in light grey, with a reduced mass fraction in the range ϕ ≲ 2 arising from the large porosity and consequently low density of these particles (Eqs. 11–13). The remaining dark grey and black lines show ns,i after quench fragmentation for ne = 0.05 and ne = 0.12, respectively. After sufficient external water is entrained (ne ≈ 0.12) to cross Tg, ns,i does not evolve further from quench fragmentation. Note that owing to their larger surface area, particles are preferentially depleted in the mid-size-range ( − 3 ≲ ϕ ≲ 2). (E) Further evolution of ns,i due to particle fallout, after water breach and during subaerial column rise, with preferential fallout of the coarsest fraction (ϕ ≲ − 3) and additional enriching of fines.
2.3.2 Vent Decompression
Figure 2 highlights the geometry and relevant length scales for the MWI model. For an overpressured jet in the near-vent region with M ≥ 1 (e.g., Ogden et al., 2008), we assume that mixing of the gas-pyroclast mixture with external water is negligible over a “decompression length scale” Ld where expanding gas prevents pyroclasts inside the jet from interacting with external water (e.g., Kokelaar, 1986). Our decompression model therefore assumes that turbulent entrainment and mixing of external water begins at heights above Ld. For Ld, we use a modified form of the free decompression condition of Woods and Bower (1995) to find the height at which the jet gas pressure plus dynamic pressure is equivalent to external water hydrostatic pressure:
where p is pressure, ud is the speed after decompression, and ρ is density. Subscripts d and e denote properties of the jet mixture after “decompression” and of “external” water, respectively. Assuming the decompression speed is approximately the mixture sound speed (i.e., M = 1 at the expanding shock front) (Ogden et al., 2008) and using the dusty-gas approximation (Woods and Bower, 1995),
where subscript v denotes the “vapor” phase, the free gas volume fraction χv ≈ 1, and γ is the ratio of specific heats for the vapor phase. Substituting Eq. 18 into Eq. 15 gives
Assuming that the mixture volume is approximately conserved, the decompression length Ld is proportional to the change in jet radius with decompression:
where
and
Here nv is the jet gas mass fraction, and the subscript c indicates properties in the “conduit” prior to decompression. Momentum and energy are not perfectly conserved after decompression in this formulation as they are in Woods and Bower (1995), because the radially averaged decompression velocity is taken to be the mixture sound speed. However, this approach is consistent with the results of numerical simulations (e.g., Ogden et al., 2008), where excess energy is dissipated via shock formation and related effects of supersonic flow, and radially average velocities after decompression are close to sonic. These equations give a decompression length approximately similar to the Mach disk height relation of Ogden et al. (2008), (see Supplementary Figure S3 for a comparison), but with the difference that Ld → 0 for β ≲ 1. This is an important distinction since the formal definition of Ld in our model is the height at which the jet overpressure is sufficiently small that turbulent mixing and entrainment can begin. For a pressure-balanced jet (β = 1), this critical height should be immediately above the vent. We note, however, that due to the rapid pressure change with height in the water column, the mixture will continue to expand and decompress, such that the static estimate of Ld used here is likely a lower bound.
2.3.3 Water Entrainment and Magma-Water Interaction Model
The mixing of water, steam, pyroclasts, and lithic debris in the vent region in explosive hydrovolcanic eruptions is complex and may involve effects of shocks, supersonic flow, film boiling, and multiple fragmentation mechanisms (Wohletz et al., 2013; Houghton and Carey, 2015; van Otterloo et al., 2015) that introduce inherently time-dependent and three-dimensional mechanisms for entrainment and mechanical stirring that are not captured in a one-dimensional steady-state integral model. However, following extensive studies of entrainment and mixing into turbulent plumes (Morton et al., 1956; Linden, 1979; Turner, 1986), a recent complementary analysis of water entrainment into supersonic, submerged gas jets (Zhang et al., 2020) and studies of the bulk energetics of interactions between hot pyroclasts and water (Mastin, 2007a; Dufek et al., 2007; Schmid et al., 2010; Sonder et al., 2011; Dürig et al., 2012; Woodcock et al., 2012; Moitra et al., 2020) we can parameterize these processes to explore effects on total budgets for mass, energy, and buoyancy. Following Morton et al. (1956); Kaminski et al. (2005); Carazzo et al. (2008); Zhang et al. (2020), Hajimirza et al. (2022), we will relate the radial entrainment speed of water or atmosphere to the local rise speed of a jet and prescribe resulting velocity, pressure and temperature fields. We assume the rate of mixing and heat transfer between solid pyroclasts and entrained water to be sufficiently fast that all phases are well-mixed and at equal temperature inside the jet over the timescale of rise through the water column. We discuss consequences of this assumption further in Section 4.
We initialize the water entrainment model at height Ld above the vent. Initial conditions for jet velocity, radius, and density are determined after decompression by balancing jet gas pressure with hydrostatic pressure at Ld. Other parameters such as gas mass fraction and temperature are obtained from values at the top of the conduit model, while the PSD and pyroclast porosity and density are determined according to Section 2.3.1 above. An iterative MATLAB solver integrates solutions to the differential equations for water and particle mass, bulk momentum and energy, and PSD mass fractions from the decompression height to the water surface. The physical properties of entrained water are calculated using the International Association for the Properties of Water and Steam 1995 formulation (Junglas, 2009). To capture the evolution with height of the mixture energy (enthalpy plus average vertical kinetic and gravitational potential energy), we follow a similar approach to Mastin (2007b). The initial enthalpy of the solid phase at the vent surface hs0 is determined from a weighted combination of the enthalpy of exsolved gas bubbles and the specific heat of the melt phase:
Here hb (pb, T0) is bubble gas enthalpy as a function of pressure and temperature, Cm = 1250 J/(kg K) is the melt heat capacity (assumed constant), and Tref = 274.15 K is a reference temperature. The total mixture enthalpy, h is then
where nw and hw are the mass fraction and enthalpy of water (gas and liquid) within the jet mixture. At the decompression length, the total power supplied by the jet is
where qc is the conduit MER and g′ = g (ρ − ρe)/ρe is the reduced gravity, and the dot notation over E indicates the time derivative of the system’s energy at decompression length Ld.
From an initial value T0, the bulk temperature of the jet mixture T is calculated at each solver step following Mastin (2007b). Specifically, the enthalpy at each step is compared with two values: the enthalpy hvap that the mixture would have at the water saturation temperature assuming 100% steam (dryness fraction xv = 1), and hliq, where the water phase is 100% liquid (xv = 0). For h > hvap, the mixture temperature is found using an iterative approach to match the known enthalpy value h. For hliq < h < hvap, T = Tsat and xv = (h − hliq)/(hvap − hliq). We employ a stop condition as dryness fraction reaches xv,crit = 0.02. This condition is justified physically because as the jet water fraction becomes mostly liquid with xv → 0, the resulting high-density jets always collapse almost immediately after breaching the water surface and are therefore ineffectual at injecting SO2 into the stratosphere. Conceptually, this condition is equivalent to the case where at most only minor quantities of steam breach the water surface, potentially generating steam plumes but carrying negligible quantities of volcanic ash or other volatiles (e.g., Cahalan and Dufek, 2021). We refer to the above ultra-high water fraction scenarios as the “steam plume” regime hereafter. For greater water depths still, the gas jet would entirely condense and fail to breach the water surface (Cahalan and Dufek, 2021). Furthermore, as the vapor fraction approaches zero, steep gradients in density significantly increase problem stiffness and computation time, and we thus discard these results and do not integrate further.
Entrainment of ambient fluid into a jet or plume is driven by both radial pressure variations arising from the relatively fast rise of the jet and local shear across the jet-water interface (see Figure 1). Entrainment parameterizations in integral plume models typically assume that the rate of radial inflow of ambient fluid vɛ at any height is proportional to the upflow speed (Morton et al., 1956):
where α is an entrainment coefficient of order 0.1. Here we employ a variable entrainment coefficient following Kaminski et al. (2005); Carazzo et al. (2008):
where
is the local Richardson number that expresses the balance between the momentum and stabilizing buoyancy fluxes at a given height. The shape function A = A(z) depends on the diameter of the jet and Ri at z = 0. This well-established hypothesis for ambient fluid entrainment is, however, strictly valid only where turbulence is fully developed. This picture assumes that there is a direct momentum exchange between large entraining eddies that form plume edges and a full spectrum of turbulent overturning motions that mix momentum, heat and mass across the plume radius down to spatial scales limited by either molecular diffusion or dissipation by very fine ash (Lherm and Jellinek, 2019). In general, this condition is established over heights of roughly 5 to 10 vent diameters (i.e. the vent near-field, see also Figure 2) and corresponds to a transition from flow as a jet governed by the momentum flux delivered at Ld to flow as a buoyant plume driven by a balance between buoyancy and inertial forces (Carazzo et al., 2006; Saffaraval and Solovitz, 2012). A key issue for the character and magnitude of effects related to MWI is whether and where in the water layer this transition occurs such that water entrainment is fully established.
To constrain this transition height relative to LD we follow an approach developed in Kotsovinos (2000) to identify the dynamical “crossover height” LX at which fully turbulent plume rise starts and above which Eq. 26 holds. Below LX, the flow evolves predominantly in response to the momentum flux supplied. In this regime, drag related to turbulent instabilities, accelerations, overturning motions and mixing is not established and on dimensional grounds the evolving height of the jet
Above LX, plume height predominantly governed by a balance between buoyancy and inertial forces is, by contrast,
The transition height LX occurs where hjet = hBI, which corresponds to where the characteristic time scale tjet = tBI. After algebra we obtain
Starting from height z = Ld, we assume the thickness amix of a turbulent mixing layer at the jet boundary develops monotonically over distance LX:
above which the radial turbulent mixing is complete and the velocity profile is top-hat or Gaussian, consistent with the assumption of self-similar flow (Morton et al., 1956; Turner, 1986). We then obtain an effective entrainment coefficient, αeff, by scaling the entrainment coefficient based on the volumetric growth of the mixing layer:
Using a similar entrainment parameterization to Mastin (2007b) which accounts for the relative density difference of the ambient and entraining fluid, the rate of water entrainment into the jet is
In a recent study of supersonic air jets intruding 1–400 m deep layers of water from below (Zhang et al., 2020) shows that entrainment and mixing is significantly augmented by buoyancy effects related to the rise of air through layers of relatively dense water. Their results suggest that this mechanism will dominate the mechanics of entrainment for water layer depths exceeding a few hundred meters. This condition is presumably set by the height in the water column at which the overturn time of large entraining eddies related to the rise of buoyant air becomes less than the time scale for water ingestion through shear-induced turbulence (Eq. 27). The extent to which this mechanism governs the evolution of rapidly expanding hot volcanic jets erupting through comparably thick layers of water is, however, unclear and particularly so where Ld is of the same order of magnitude as the water depth. For completeness, we compare results obtained from Eqs. 27–33 with complementary calculations assuming entrainment is partially governed through the buoyancy-driven “Rayleigh-Taylor” entrainment mode of Zhang et al. (2020). Specifically, we define an alternative αeff as a weighted average of the shear-driven and Rayleigh-Taylor entrainment modes:
where
Here, αRT is the Rayleight-Taylor coefficient for buoyancy driven entrainment, B is a specified weighting determining the relative contributions of buoyancy effects and shear to the total water entrainment, σ is the surface tension at the water-steam interface, and ω ≈ (0.3u)2/(2πa) is the average radial acceleration of the interface (Zhang et al., 2020). The geometric constant of 0.3 is an approximate scaling for the magnitude of turbulent velocity fluctuations (Cerminara et al., 2016) and ensures that the radial momentum flux carried by the inflow is an order of magnitude smaller than the vertical momentum flux carried by the jet itself. This condition is required for the jet to remain intact and approximately conical, consistent with the results of (Zhang et al., 2020), and for the equations underlying the 1D plume model to hold (Morton et al., 1956). We compare the consequences of different entrainment modes for eruption behavior in Sections 3.2 and 4.1.
2.3.4 Quench Fragmentation Model
The process of quench fragmentation of pyroclastic particles of various size during MWI is complex. Driving thermal stresses and stress concentrations arising through interactions with cold water depend on the curvatures of the outer surfaces of pyroclasts, their porosity and surface area-to-volume ratio, and on the spatial distributions and rates of both surface cooling and film boiling. How to capture thoroughly these particle-scale effects and their consequences for the mean particle size distribution in an evolving volcanic jet mixture is unclear and remains a subject of vigorous research (e.g., Wohletz, 1983; Büttner et al., 2002, 2006; Mastin, 2007a; Woodcock et al., 2012; Patel et al., 2013; Liu et al., 2015; van Otterloo et al., 2015; Dürig et al., 2020b; Fitch and Fagents, 2020; Moitra et al., 2020; Hajimirza et al., 2022). However, with a specified magmatic heat flow at the vent, considerations of the surface energy consumed to generate fine ash fragments (Sonder et al., 2011), guided by published experiments along with observational constraints on the hydromagmatic evolution of particle sizes (Costa et al., 2016), provide a way forward that is appropriate for a 1D integral model. Figure 3 highlights the salient features of the fragmentation model, using the example of a single simulation with qc = 1.03 × 10⁸ kg/s and Ze = 120 m. Sonder et al. (2011) performed lab experiments submerging molten basalt into a fresh water tank to constrain the partitioning of thermal energy lost from the melt between that which is transferred from melt to heat external water and that which is consumed irreversibly through fracturing of the melt to generate new surface area and fine ash. At any height above the vent, the total power delivered to entrained external water from the melt is
and ΔĖm is the rate of heat loss from the melt phase. The remaining heat loss from the melt i.e.
Below, we use Eq. 37 to define power transfer during each height step of the MWI model. In more detail, entrained water must thermally equilibrate with both pyroclasts and internal water already in the volcanic jet. With both sinks for thermal energy included, we recast Eq. 37 to be the total power transferred to entrained water at each height step:
where
Neglecting a comparatively very small contribution from the specific heat of water trapped within the pores of pyroclasts, Eq. 38 can be recast as an enthalpy change with water entrainment over a height step:
where Δqw,e is the mass flux of entrained water, hw,f is the final enthalpy of the water phase after thermal equilibration (i.e., where the jet gas and particles are well-mixed and at the same temperature), he is the external water enthalpy, qw and hw are the mass fluxes and enthalpy, respectively, of water already equilibrated thermally within the jet. In Eq. 39, Tf and T are the unknown final mixture temperature and known initial mixture temperature for the current height step, respectively. To estimate heat transfer to the entrained water phase, we assume that the change in temperature after equilibration Tf − T is sufficiently small at each step that the jet water heat capacity can be approximated as constant for the current step, such that
where Cw is the water heat capacity at temperature T. Substituting 41 into 40 leads to
Tf can then be used to estimate heat transfer to entrained water Δhw = hw,f − he, which is used along with ζ and the PSD to later calculate the specific fragmentation energy, ΔEss.
Since we assume that the energy consumption during quench fragmentation results from the generation of new surface area (Sonder et al., 2011; Dürig et al., 2012; Fitch and Fagents, 2020; Hajimirza et al., 2022), we calculate the specific surface area at each particle bin size assuming spherical particle geometry:
where Λ is a scaling parameter accounting for particle roughness, as true particle surface area can potentially exceed that of ideal spherical particles by up to two orders of magnitude (Fitch and Fagents, 2020). We take a default value Λ = 10, and discuss the effects of different choices for Λ in Sections 3.2 and 4. The total surface specific surface area for a given PSD is
To simulate the evolution of the PSD by quench fragmentation, we prescribe a representative range of particle sizes produced by thermal granulation based on the fine mode of particle sizes for the phreatomagmatic phase C of the 1875 Askja eruption, as reported in Costa et al. (2016). The resulting “output” PSD, nsi,f, is a normal probability density function, in ϕ size units, with mean ϕμ = 3.43 (∼ 100 μm) and standard deviation ϕσ = 1.46, and is shown in Figure 3A (gray shaded region).
The “input” particle sizes (i.e., particles that fragment to produce the fine fraction) are defined according to the available surface area in the coarse fraction (ϕ < ϕμ). We use the output mean, ϕμ as a fragmentation cutoff - particles of this size and smaller are assumed to not participate in quench fragmentation, but can participate in heat transfer to water. This allows the definition of an effective fragmentation energy efficiency as a function of particle size (see Figure 3A, black line),
where
where
where ΔTg is the glass transition temperature range, with typical values of ∼ 50 K (Giordano et al., 2005). Using hssm to scale ζ with temperature (Figure 3C), Eq. 44 becomes:
and the effective fragmentation energy efficiency for determining total fragmentation energy from the PSD is
Note that fracturing and fragmentation can in reality still occur once the bulk temperature cools below Tg, contrary to our assumption here. However, due primarily to a decrease in thermal expansion coefficient below Tg (Bouhifd et al., 2015), we assume that thermal stresses below Tg are insufficient to cause substantial further alteration to the PSD and magmatic energy budget (the PSD is considerably enriched in fine ash already at external water mass fractions sufficient to cool below Tg, see Figure 3). See Supplementary Material Section S2 and Supplementary Figure S4 for a discussion of the rationale for Eqs. 46–48 based on thermal stress estimates. The PSD of the coarse particle fraction (i.e., particle sizes that experience mass loss due to quench fragmentation), nsi,0, is calculated as proportional to available particle surface area in each size bin, modified by the fragmentation efficiency (Figure 3A, gray lines):
Finally, we define the specific fragmentation energy (per mass of pyroclasts in the jet)
and the change in mass of the pyroclast fraction due to gas release from vesicles on fragmentation
where we choose Es = 100 J/m2 for the particle surface energy for fragmentation (Dürig et al., 2012; Hajimirza et al., 2022). The final system of differential equations for evolution of the PSD, and conservation of water mass, pyroclast mass, momentum, and energy, are respectively
2.4 1D Plume Model
For jets that breach the water surface, conditions at z = Ze are taken as the source parameters for the integral plume model. We use the integral plume model of Degruyter and Bonadonna (2012), modified with the particle fallout parameterization of Girault et al. (2014) to simulate differences in sedimentation in the eruption column as a function of fine ash production. Figure 3E shows the total PSD evolution due to particle fallout in the eruption column for a PSD that has been fines-enriched during MWI. The conservation equations for mass of dry air, water vapor, liquid water, and particles are, respectively
where vɛ is the entrainment velocity, subscript a denotes properties for dry air, λ = 10–2 s−1 is a constant condensation rate (Glaze et al., 1997), uϕ,i are particle settling velocities following Bonadonna et al. (1998), and ξ = 0.27 is the particle fallout probability. The equations for vertical momentum and energy are, respectively:
where Cs and Ce are the heat capacities of particles and air, respectively, Te is the ambient air temperature, and L is the latent heat of condensation of water vapor. Note that the plume model retains the capability for simulating cross-winds as in Degruyter and Bonadonna (2012), but we show here only the vertical component of the momentum equation as we do not consider wind effects (wind fields are set to zero in atmospheric profiles). For further details on the plume model, we refer the reader to Degruyter and Bonadonna (2012, 2013), and to Girault et al. (2014) for the particle fallout details.
2.5 Simulation Scenarios
The conduit, MWI, and plume models are solved in series, with the conduit model providing source conditions for the MWI model, and the MWI model, in turn, providing source conditions for the plume model. As described above, our model approach is to simulate eruptions across a parameter space with 105.5 ≤ Q0 ≤ 109 kg/s and 0 ≤ Ze ≤ 500 m. In Table 2 we define the Reference scenario which employs default values as described above for the various model parameters. Specifically, the Reference scenario uses a water entrainment scheme that includes both decompression and cross-over length scalings, and default fragmentation parameters Λ = 10, ζ = 0.1, D = 2.9. The atmospheric profile used in the Reference scenario is obtained from ERA reanalysis data for the 2011 eruption of Grímsvötn Volcano (Hersbach et al., 2020; Aubry et al., 2021a), and we use a vent altitude of 1700 m above sea level. Note that we are not attempting to reproduce precise conditions for that eruption, but rather use this as a representative environmental condition for a high-latitude subglacial or sublacustrine eruption. To explore the effects of various model assumptions and parameter choices, we carried out nine additional simulation scenarios in addition to the Reference scenario, with each varying a single model parameter and performed over the same parameter space for MER and water depth. The second scenario we define, Low-Lat, uses an ERA reanalysis atmospheric profile for the 2014 eruption of Tungarahua Volcano with vent altitude 0 m a.s.l. as a representative atmosphere for a low-latitude submarine setting, keeping other parameters the same as the Reference scenario (see Supplementary Figure S5 for a comparison of atmospheric profiles used in the Reference and Low-Lat scenarios). Additional scenarios are broadly categorized into those with differing water entrainment assumptions and those with different fragmentation parameters relative to the Reference scenario. Entrainment scenarios include those without one or both of the decompression and crossover length scalings (No-Ld, No-LX, and No-Ld-No-LX), and a scenario with the Rayleigh-Taylor entrainment scheme of Eq. 35 (αRT). Additional fragmentation scenarios include one with a higher particle roughness (High-Λ), higher and lower fragmentation energy efficiencies (High-ζ and Low-ζ), and a higher initial PSD power-law exponent (High-D). We highlight the effects of different entrainment scenarios in Section 3.2, and discuss the consequences of different parameter choices for these scenarios in Section 4.
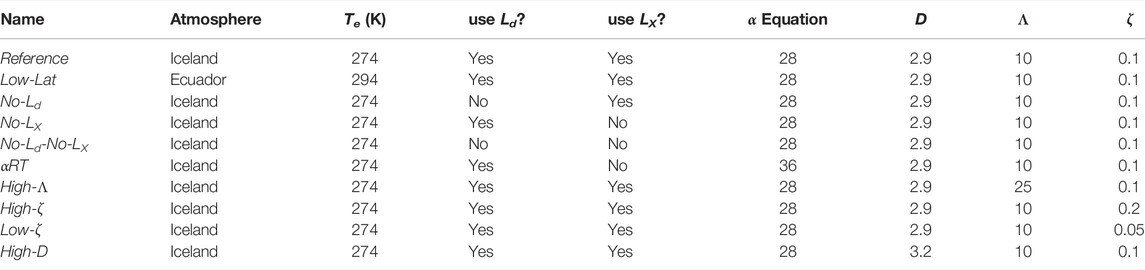
TABLE 2. List of simulations sets highlighting varied model parameters: Atmospheric profile, external water temperature Te, decompression length switch, crossover length switch, entrainment equation, PSD power-law exponent D, particle roughness scale Λ, and fragmentation energy efficiency ζ.
3 Results
3.1 Conduit Flow: Effects of an External Water Layer
An external water layer modifies the hydrostatic pressure in the conduit, which affects water saturation and exsolution, and in turn, magma decompression rate and fragmentation conditions (Cas and Simmons, 2018). In Figure 4, we compare conduit model output for control (Ze = 0 m, red lines) and hydrovolcanic (Ze = 400 m, blue lines) simulations for Q0 ∼ 1.6 × 10⁸ kg/s. In the dry scenario, gas exsolution begins with an initial bubble nucleation event at a depth of 5.5 km below the vent (panel (e)). Above the first nucleation event, gas exsolution continues, driving increasing magma buoyancy, ascent and decompression rates. A sharp increase in exsolution and bubble growth near z = 1.3 km drives the gas volume fraction above the fragmentation threshold of 75% (panel (d)). At this depth, fragmentation occurs and the flow becomes a fluidized mixture of gas and suspended pyroclasts. Above this fragmentation depth, the flow accelerates to the mixture sound speed near the vent and becomes choked (panel (b)). At the vent the choked flow has a significant overpressure with β ≈ 11 (panel (a) inset), and erupts to form an explosively decompressing subaerial jet.
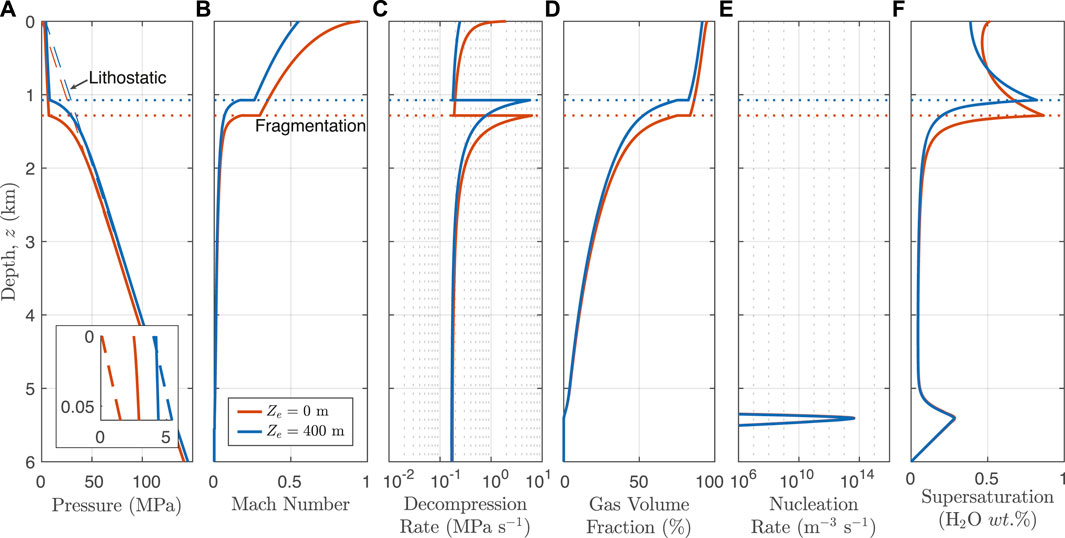
FIGURE 4. Example conduit model output from the Reference set (see Table 2) versus depth below the vent for a pair of simulations: red lines show a “dry” control run with ac = 53.8 m, Ze = 0, and Q0 = 1.6 × 10⁸ kg/s. Blue lines show a hydrovolcanic scenario with ac = 53.8 m, Ze = 400 m, and qc = 1.53 × 10⁸ kg/s (blue lines). (A) Magma pressure. Inset: pressure in the top 60 m of the conduit (same units as panel (A) axes), highlighting the vent overpressure of the control run versus the pressure-balanced vent of the hydrovolcanic run. (B) Mach number. (C) Decompression rate. (D) Gas Volume Fraction. (E) Bubble Nucleation Rate. (F) Supersaturation of dissolved water (i.e., difference between dissolved water
Consistent with previous studies of subaqueous eruptions, the higher hydrostatic pressure at the vent in the hydrovolcanic case results in less gas exsolution and bubble growth, and consequently a slower decompression rate in the ascending magma (Cas and Simmons, 2018). Slower exsolution also results in lower total gas exsolution from the magma, and lower gas volume fraction above fragmentation (panel (d)). Above the fragmentation depth in the wet scenario, both the reduced mixture buoyancy related to a lower fraction of free gas and the higher hydrostatic pressure contribute to a reduced acceleration of the mixture, and the flow is subsonic (M ≈ 0.5, panel (b)) and pressure-balanced (β ≈ 1, panel (a) inset) at the vent. For this water depth and MER, we consequently find no viable conduit solution where the vent is choked (see also Supplementary Figure S2 for conduit solution search details). Across all model scenarios (see Table 2), water depths sufficient to cause this pressure-balanced condition usually lead to a weak jet that does not breach the water surface and/or to a steam plume condition (see Section 3.3 and Figure 9 below).
Figure 5 shows select parameters of the conduit model output as a function of MER and water depth, including vent overpressure ratio (panel (a), color field and contours), Mach number at the vent (b), MER adjustment relative to control runs (c), magma decompression rate at fragmentation depth (d), fragmentation depth (e), and the weight percent of residual water content dissolved in the pyroclasts at vent level (f). For the control runs (Ze = 0), the vent is always overpressured and choked, with β → 45 for the largest values of MER. Overpressure declines rapidly with increasing water depth until choking at the vent is impossible and the gas-pyroclast mixture enters the water layer as a pressure balanced, subsonic jet (solid blue line in panels (a),(c),(d)). We find that the largest water depth for which choking is possible is typically equal to about five vent radii. For example, for Q0 = 107 kg/s, conduit radius ac = 20 m, and the choking threshold depth occurs at ∼100 m, whereas this threshold increases to ∼220 m for Q0 = 108 kg/s and ac = 45.5 m. For depths greater than the choking limit, the Mach number falls off rapidly to values of 0.5 and 0.1 for depths equal to about 10 and 30 vent radii, respectively. For sufficiently large water depths and small MER, we find no conduit solutions in which fragmentation occurs (blue region, panel (a) top-left). As introduced in Section 2.2, for hydrovolcanic runs we adjust the MER relative to control runs to match the vent boundary condition. Figure 5C shows the ratio of adjusted MER to control MER, qc/Q0, which for control simulations is always equal to 1 by definition. The adjustment is minor (no more than about 10%) and positive in most cases where vent choking is maintained. For water depths greater than the choking threshold, qc begins to decrease, reaching values as low as 20–30% of Q0 for low MER and large water depths. This trend is, however, not universal: for low MER, a strong second nucleation event occurs near the fragmentation depth and leads to relatively larger values of released gas and consequently greater MER until water depths of about 150–200 m (panels (c) and (f), lower-left corner).
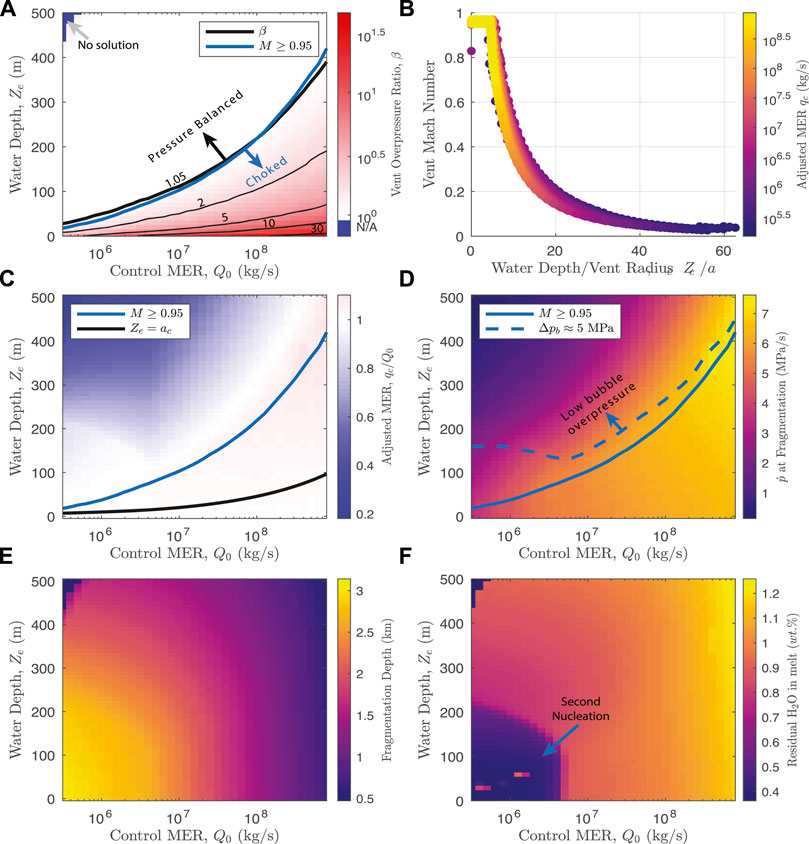
FIGURE 5. Conduit model output as a function of control MER, Q0, and external water depth, Ze. (A) Vent overpressure β. The blue line in panels (A,C,D) denotes the tolerance threshold for Mach number (M = 0.95), and the red line is the (approximately coincident) vent overpressure threshold, β = 1.05. The vent is choked and overpressured for water depths less than this. The blue region in the top left (high Ze and low Q0 are failed simulations - no viable conduit solutions were found in this region. (B) Vent Mach number. (C) Mass eruption rate adjustment for fixed conduit radius, relative to the control case for Ze = 0. (D) Maximum decompression rate recorded at fragmentation (χ0 = 0.75). The dashed blue line highlights the maximum water depth for which peak bubble overpressure is at least 5 MPa, which is an approximate low bound for bubble wall rupture (Cas and Simmons, 2018). (E) Fragmentation depth. (F) Residual dissolved water in pyroclasts at the vent, highlighting a strong second nucleation event for low MER and water depths less than about 200 m.
Figure 5D shows the peak magma decompression rate
3.2 Magma-Water Interaction Model and the Effects of Water Entrainment
Figure 6 shows MWI model results for four simulation scenarios with different water entrainment parameterizations: the Reference scenario (blue) with scalings for both decompression length (Ld, Eqs. 14–20) and crossover length (LX, Eqs. 29–33), no crossover length scaling (No-LX, red), no decompression length (No-Ld, purple), and with the weighted Rayleigh-Taylor entrainment coefficient in Eqs. 35 and 36 (αRT, light blue). In the simulation shown (qc = 1.03 × 10⁸ kg/s, and Ze = 120 m), the jet in the Reference scenario begins entraining water after decompression at a height of about 55 m above the vent. In contrast to a sub-aerial jet, the gas jet is buoyant in sub-aqueous settings and accelerates towards the water surface (panel (a)). Bulk temperature (panel (b)) decreases with water entrainment, and bulk density (panel (c)) decreases from both an increase in the vapor mass fraction (panel (d), solid lines) and decompression as the jet moves upwards in the water column. New ash surface area is produced through quench fragmentation (panel (e)), proportional to the mass of water ingested. This process proceeds until the mixture cools below the glass transition at a height of about 105 m above the vent (marked with circle symbols in panels (b) and (e)), after which no additional ash surface area is generated. The effective entrainment coefficient (panel (f)), scaled by LX (Eq. 31), grows approximately linearly from an initial value of zero according to Eq. 33, resulting in a continuous increase in the rate of water ingestion. In the No-LX scenario, the entrainment coefficient is equal to that given by Eq. 27. Here, the entrained mass of water rises much more sharply with height and causes the mixture to reach the glass transition by around 10 m of above the decompression length LD. Furthermore, in these calculations water vapor saturation is reached after only 25 m of rise. Above water saturation, the liquid water fraction in the jet increases rapidly with height (panel (d), dashed lines). The concomitant increase in density reduces jet acceleration relative to the Reference, until breach of the water surface occurs. In the No-Ld scenario, the entrainment coefficient initiates at a value of zero as in the Reference, but entrainment begins from z = 0 rather than z = Ld. The crossover length LT = 230 m is greater than water depth for this event, and consequently the entrainment rate increases over the full height of the water layer (see Eqs. 32 and 33), reaching a larger maximum value at the water surface (α = 0.076 versus α = 0.04 in the Reference). The bulk mixture temperature for the No-Ld scenario reaches the saturation temperature at a height of 80 m, and ultimately a similar total mass of entrained water to the No-LX scenario on reaching the water surface (about 45 wt%). The αRT scenario uses a weighted combination of entrainment coefficients driven by buoyancy and turbulent shear. Buoyancy-driven entrainment in Eq. 36 is approximately proportional to the surface area to volume ratio of the plume, i.e., αRT ∝ a2/qc. For the relatively large MER shown here, qc dominates in the above ratio resulting in a low value of αRT, and the weighted αeff is consequently a middle value between the Reference and No-LX scenarios. We further discuss the consequences of these water entrainment scenarios in Sections 3.3 and 4.1.

FIGURE 6. Example MWI model parameters versus position in the water layer above the vent for a single simulation at qc = 1.03 × 10⁸ kg/s, and Ze = 120 m. Four different water entrainment scenarios are shown: the Reference scenario using an entrainment condition modified by both decompression and crossover length scales (blue), a scenario with no scaling for turbulent mixing length (no-LX, red), a scenario with no decompression length scale, where entrainment initiates immediately at the vent (no-Ld, purple), and a scenario using the weight Rayleigh-Taylor entrainment mode of Eq. 35 (αRT scenario, light blue). (A) Vertical velocity. (B) Jet mixture temperature. (C) Jet bulk density. (D) Jet water liquid and vapor mass fractions. (E) Specific surface area of pyroclasts. (F) Local entrainment coefficient. Colored circles in (B,E) highlight the crossing of the glass transition temperature.
For a specified fragmentation efficiency ζ, the production of ash surface area from quench fragmentation increases with the extent of water entrainment, which increases with water depth (see Eq. 38). Quench fragmentation proceeds rapidly compared with the timescale for the jet to cross the water layer (Figures 3D, 6E). In the model, the primary limit for fine ash production is, thus, the height at which water entrainment causes the mixture temperature to become less than the glass transition temperature. For Cm = 1250 J/(kg K) and T0 = 1123 K, this condition is met where ne ≳ 0.12. However, even with this imposed temperature limit for quench fragmentation, Figure 3D shows that the PSD is substantially enriched in fine ash for this mass fraction of entrained water. For an initial PSD exponent of D = 2.9 (Figure 3D, light grey line), the mass fraction of ash particles less than 120 μm (ϕ ≤ 3) is about 45%, while it is 80% after the glass transition is passed (Figure 3D, black line). Therefore in the absence of the glass transition limit, coarse particles could be fully depleted. In Section 4 we further discuss the consequences of our choice of fragmentation model and the associated key parameters: initial PSD, particle roughness, fragmentation energy efficiency, and glass transition temperature.
3.3 Effects of the Water Layer on Column Rise
Figure 7 shows eruption column model results for two example simulations with Q0 = 107 kg/s: a control simulation (Ze = 0 m), and a hydrovolcanic case with Ze = 70 m. Dashed grey lines show parameters of the ambient atmosphere. The control scenario (in red) inherits conditions directly from sub-aerial vent decompression: bulk density (panel (a)) is determined by the mass fractions of pyroclasts and magmatic vapor (shown in panels (e) and (f), respectively), velocity (panel (b)) is equal to the mixture sound speed, and the bulk temperature is equal to the initial value in the conduit (panel (d)). The jet cools rapidly with entrainment of ambient air and condensation of water vapor begins shortly above the vent, though the liquid mass fraction remains below 1% (panel (f), dashed lines). The jet becomes buoyant (density less than ambient atmosphere) within a few hundred meters of the vent, becomes negatively buoyant above the neutral buoyancy height of about 9 km above the vent (Znbl), and rises to a maximum overshoot height Zmax of over 12 km. In contrast, the hydrovolcanic simulation emerges at the water vapor saturation temperature, Tsat = 367 K, with a total water mass fraction of 46% (near the threshold for gravitational collapse). Acceleration through the water layer results in a higher initial velocity relative to the control simulation (see Figure 6A), and the high mass fraction of water vapor gives the initial jet a relatively low density. However, due to the low temperature and increasing density from condensation, the hydrovolcanic jet generates buoyancy much more slowly than in the control case, becoming buoyant relative to ambient 3 km above the vent. The reduction in total buoyancy flux results in maximum height and neutral buoyancy level approximately 1.5 km and 700 m less than the control case, respectively.
FIGURE 7. Example plume model output from the Reference set (see Table 2) versus height above the vent for a pair of simulations: red lines show a “dry” control run with ac = 20.0 m, Ze = 0, and Q0 = 1.00 × 10⁷ kg/s. Blue lines show a hydrovolcanic scenario with ac = 20.0 m, Ze = 70 m, and qc = 1.01 × 10⁷ kg/s (blue lines). (A) Bulk density. (B) Vertical velocity. (C) Column Radius. (D) Bulk temperature. (E) Particle mass fraction. (F) Water liquid and vapor mass fractions. Horizontal dotted lines show the level of neutral buoyancy for each case, and the horizontal dashed gray line shows the height of the tropopause (note y-axis is kilometers above vent level).
To demonstrate behavior of the coupled system, Figure 8 shows values of controlling parameters in the conduit, vent, and column model components for Reference simulations with Q0 = 108 kg/s and varying water depths 0 ≤ Ze ≤ 300 m. Figure 8A compares the eruption column maximum height and level of neutral buoyancy (in km above sea level) against tropopause and vent altitudes. Panels (b) through (e) highlight parameters of the conduit including adjusted MER qc, fragmentation depth Zfrag, vent overpressure β, and vent Mach number M. Panels (f) through (i) show output of the MWI model. Panel (f) shows the scalings for decompression Ld and crossover length LX, and panel (g) shows the maximum value of the effective entrainment coefficient over the height of the water layer (as determined by Eqs. 27 and 33, see Figure 6F). Panels (h) and (i) show jet radius and velocity, respectively, at two different heights: after decompression z = Ld and at the water surface level z = Ze (water surface level also corresponds to the eruption column source height as shown in Figure 2). Finally, panels (j) and (k) show the water mass fractions (vapor and liquid) and temperature for the eruption column source (i.e. z = Ze). In all panels in Figure 8, vertical dashed lines show the threshold water depths for four important behavior regimes: 1) the height at which water depth and decompression length are equivalent Ld = Ze, 2) the water depth above which the subaerial eruption column collapses before reaching a level of neutral buoyancy, 3) transition at the vent between a pressure balanced jet at high Ze and one that is overpressured and choked (β ≳ 1.05, M ≳ 0.95) at lower Ze, and 4) the depth above which the water dryness fraction xv ≲ 0.05, where at most minor quantities of steam breach the water surface (the “steam plume” condition as introduced in Section 2.3.3). The decompression length Ld defines the lower limit for water entrainment to start, and decreases with increasing hydrostatic pressure. For water depths in excess of LD (panel (f)), water begins to entrain and mix into the jet, whereas our decompression length scaling prevents water ingestion for shallower depths (panel (g)). As the water mass fraction increases above about 30%, the water saturation temperature is reached and the column source includes liquid water (panel (j)), increasing its density. Consequently, jet velocity (panel (i)) decreases for greater water depths, and combined with reduced heat content in the particle fraction to generate buoyancy (panel (k)), it becomes impossible for the jet to undergo a buoyancy reversal, and gravitational collapse occurs (panel (a)). Since the vent maintains the choked and overpressured condition until depths greater than the collapse threshold, the collapse condition for the subaerial column is not significantly influenced by changes in conduit conditions with increasing water depth, and is primarily determined by the mass fraction of entrained external water. At the upper limit for water entrainment, once the water mass fraction reaches ∼ 0.7, the heat budget of the pyroclasts is largely exhausted and most of the plume water (≳ 95% by mass) is in liquid form, resulting in steam plume conditions where the a dense pyroclast jet collapses within at most ∼1 km above the water surface.
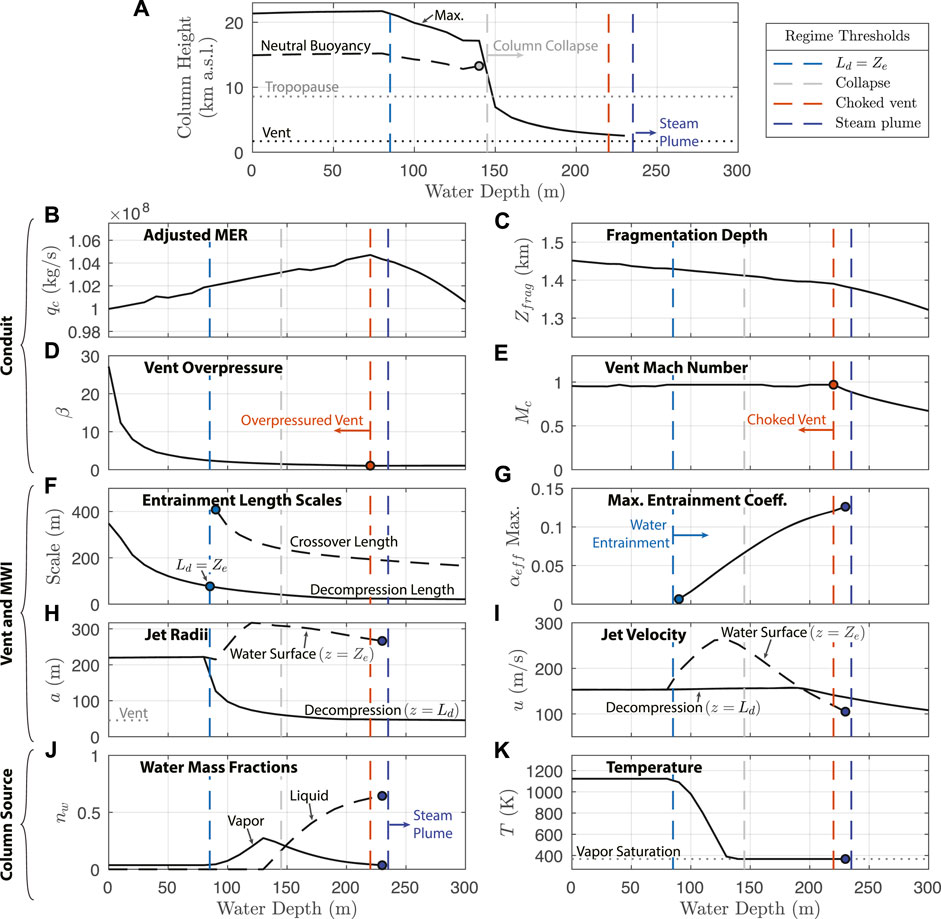
FIGURE 8. Output of the coupled model (conduit, vent, and column) Reference scenario for Q0 = 108 kg/s and a range of water depths. Behavior thresholds for decompression length, column collapse, vent choking, and steam plumes corresponding to regimes in Figure 9A are marked with vertical dashed lines. (A) Eruption column maximum height and neutral buoyancy height above sea level, shown with vent and tropopause altitude. Conduit results: (B) adjusted conduit MER qc; (C) depth of fragmentation surface; vent (D) overpressure β and (E) Mach number M. MWI model results: (F) decompression Ld and crossover LX length scales; (G) maximum value of the entrainment coefficient in the water layer; (H) radius of the vent and jet after initial decompression (at z = Ld) and at the water surface (z = Ze) (J) velocity of the jet after initial decompression (at z = Ld) and at the water surface (z = Ze). Column source conditions: (J) vapor and liquid water mass fractions (K) bulk mixture temperature.
Figure 9A shows total plume water mass fraction at the base of the subaerial eruption column as a function of MER and water depth for the Reference scenario. For comparison, the vent radius is marked in purple. The hatched light gray region highlights conditions for which stable buoyant plumes form, whereas collapse occurs for all simulations outside this region. At slightly lower water depths than the collapse threshold and for MER ≳ 106 kg/s, buoyant plumes breach the tropopause (tropopause height Ztp ≈ 8.6 km a.s.l. for the high latitude atmosphere used in the Reference scenario). The critical conduit MER for stratospheric injection, Qcrit, is highly sensitive to water depth. For example, the MER required for a buoyant column to reach the tropopause for a water depth of 150 m is over 10 times that for a water depth of 50 m, and nearly 100 times that for a subaerial vent. This is driven primarily by the shift of the column collapse condition with increasing water depth (see also Figure 10). A notable feature is that for MER ≳ 108.3, the column collapses for the control case with no external water, but becomes a buoyant column for entrained water mass fractions up to ∼ 30%. In addition, low MER eruptions are able to support higher mass fractions of external water without collapse (e.g. nw ≈ 45% for qc = 107 kg/s versus nw ≈ 35% for qc = 108 kg/s). The relative buoyancy of low MER columns is caused by more efficient entrainment of air at smaller jet radii, as well as entrainment of atmospheric humidity and condensation and latent heat release in the plume. We note that condensation of atmospheric moisture has a more significant impact on buoyancy for smaller MER in the condensation parameterization used here (Glaze et al., 1997; Aubry and Jellinek, 2018). The solid blue line in Figure 9A marks the threshold where weak steam plumes may form, or fail to breach the water surface entirely for greater depths still. In the Reference scenario, the steam plume threshold is approximately coincident with the water depth limit for choked and overpressured vents. This limiting condition is a consequence of greater entrainment efficiency near the choking limit; Since Ld → 0 as β → 1, and entrainment rate grows over the height of the water column until z = Ld + LX, maximum water entrainment rates are favored for pressure-balanced jets. However, the choking and steam plume limits need not be coincident, as shown in Figure 9B.
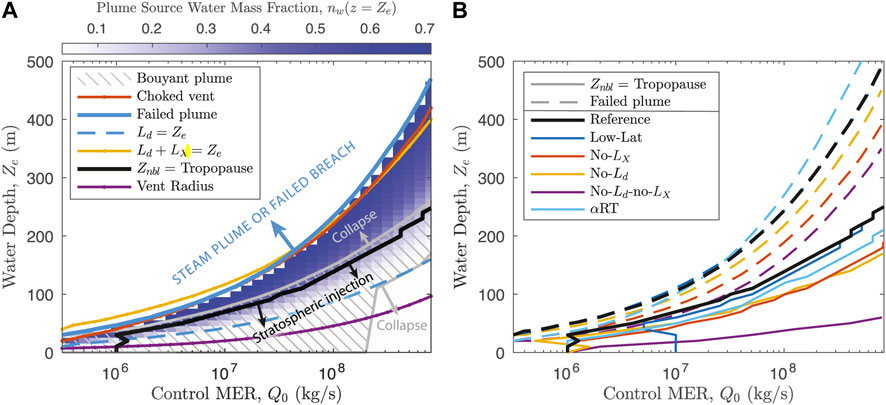
FIGURE 9. (A) Plume source water mass fraction as a function of MER and water depth, with overlaid thresholds for behavior of the coupled conduit-plume system. The red line marks the threshold for which the vent is choked and overpressured, with pressure-balanced, subsonic jets occurring at deeper depths. The decompression length is equal to water depth at the blue dashed line, which is the depth above which water entrainment begins. Buoyant columns occur within the grey hatched region, with column collapse elsewhere. The steam plume threshold is marked by the solid blue line - failed plumes with only negligibly small amounts of steam reach the water surface for depths greater than this (indicated by the blue arrow). Finally, the solid black line marks the water depth above which bouyant columns breach the tropopause. (B) Variation in the critical MER to reach the tropopause (solid lines) and maximum water depth before plume failure (i.e. the steam plume condition, dashed lines) for different simulation scenarios (see Table 2). Black lines are for the Reference scenario (high latitude atmosphere), while blue lines are for the low latitude atmosphere. The remaining colors are for the four scenarios with different water entrainment parameterizations: no mixing length (No-LX, red), no decompression length (No-Ld, yellow), neither mixing length nor decompression length (No-LX-no-LX, purple), and the weighted Rayleigh-Taylor entrainment mode (αRT, light blue).
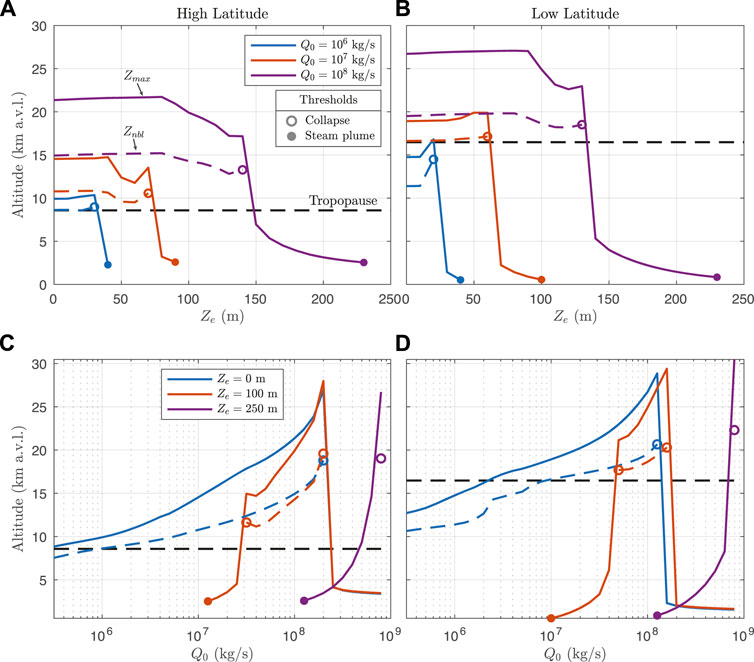
FIGURE 10. Eruption column height (above vent level) versus (A,B) surface water depth for three control values of MER and (C,D) MER for three fixed values of water depth. Left column plots (A,C) are for high latitude and right column (B,D) for low latitude atmospheres. For all plots, solid lines denote maximum column height, Zmax, dashed lines are height of neutral buoyancy, Znbl, open circles indicate threshold values for column collapse, and closed circles indicate threshold values for steam plumes at the water surface.
Figure 9B shows the threshold water depths for failed plumes (dashed lines) and stratospheric injections (solid lines), for a subset of the simulation scenarios (see Table 2). The black lines in panel (b) are for the Reference scenario with high latitude (Iceland) atmosphere (corresponding to the solid blue line for steam plumes and solid black line for stratospheric injection in panel (a)). Blue lines show the scenario for low latitude (Equador) atmosphere (Low-Lat). Neglecting the effects of wind, atmospheric humidity, stratification, and tropopause height are the primary drivers of differences between these two scenarios, particularly affecting the low values of Qcrit for water depths less than about 60 m. The remaining lines in Figure 9B show the results of the different entrainment scenarios in the MWI model as shown in Figure 6 and Table 2. With the exception of the αRT scenario, these alternative scenarios for water entrainment lead to more rapid mixing of the jet with external water, thereby reducing the maximum depth of water through which the jet can penetrate and increasing the critical MER required to reach the tropopause. For the αRT scenario, the dependence of the entrainment coefficient on jet surface area to volume ratio (see Eq. 36) causes the collapse and steam plume conditions to occur at shallow water depths compared to Reference scenario for Q0 ≲ 107. In contrast as Q0 → 108, collapse conditions still occur for shallower water depths than the Reference, but the steam plume condition occurs at greater depths. For large MER, jet radius expands rapidly as the jet rises in the water column due to both decompression and an increase in steam volume fraction. As a consequence, αRT decreases with height in the water column, reducing water entrainment rate and delaying the point at which the steam plume condition is reached. Critically, for all entrainment scenarios considered here, and regardless of the choice of atmospheric profile, we find that only the largest eruptions with Q0 ∼ 109 kg/s breach the tropopause for water depths greater than about 200 m.
Figure 10 shows example results of eruption column height at both high latitude (Reference scenario, left column) and low latitude (Low-Lat, right column). Panels (a), (b) show column heights at varying water depth for three control values of MER, and (c), (d) show heights for varying MER at three fixed values of water depth. Solid lines show maximum column height, dashed lines show neutral buoyancy height, open circles show thresholds for column collapse, and closed circles show the threshold for steam plumes. The dominant effect of added external water on column height is to drive column collapse, which is consistent with the results of previous integral models of hydrovolcanic columns (e.g., Koyaguchi and Woods, 1996; Mastin, 2007b). Panels (a) and (b) show that for buoyant plumes, column height is essentially unchanged for water depth below decompression length, while for greater depths there is a 10–25% decrease in column height. For relatively low water depths and low MER, the release of latent heat drives increased column height, particularly from entrained atmospheric moisture in a humid atmosphere (e.g., panel (b) for Ze = 20 m and Q0 = 106 kg/s). However, for the high latitude atmosphere this is largely offset by the decreases in total height resulting from changes to column source parameters (e.g., panel (a) for Ze = 70 m and Q0 = 107 kg/s, see Figure 8). Therefore in most cases, we find that both maximum height and neutral buoyancy levels of plumes decrease relative to the control simulations for increasing water depth. For buoyant plume scenarios with non-zero mass fraction of external water (Ze > Ld), neutral buoyancy levels are typically reduced by 10–25%. Panels (c) and (d) show that increasing water depth narrows the range of MER for which buoyant columns may form. For example, at only 100 m of water depth, buoyant columns are restricted to MER between about 3 × 10⁷ and 2 × 10⁸ kg/s for the reference scenario, and an even narrower range for the low latitude atmosphere. Water depths greater than about 200–250 m result in either column collapse or failed plume conditions in our Reference simulations, except for very large MER
3.4 Evolution of Particle Surface Area With Fragmentation and Sedimentation
Figure 11A shows particle specific surface area S (surface area per unit mass of particles - a metric for fine ash production) at the water surface after MWI, as a function of the concentration of residual water dissolved in the melt,
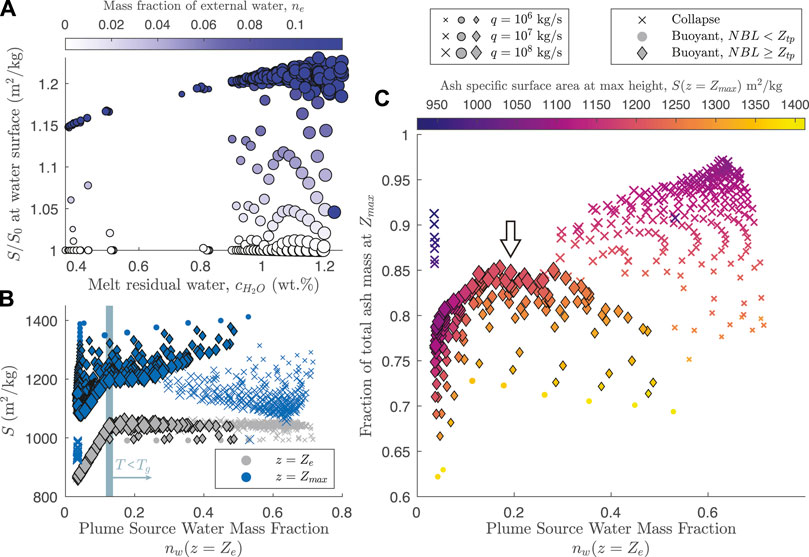
FIGURE 11. Effects of MWI and sedimentation on particle specific surface area S. (A) Specific surface area, S, immediately after the jet breaches the water surface (Z = Ze), as a function of
Figure 11B shows S at both column source (i.e., water surface z = Ze, grey symbols) and at maximum column height (z = Zmax, blue symbols) as a function of the water mass fraction at the plume source. In both panels (b) and (c), circles show buoyant plumes that do not breach the tropopause, ‘x’ symbols show collapsing columns, and diamonds show plumes that are both buoyant and of sufficient magnitude to breach the tropopause at the height of neutral buoyancy Znbl. Considering first values of S at the eruption column source (grey symbols, panel (b)), the sharp plateau in S above nw ≈ 0.15 in panel (b) is a result of cooling below the glass transition temperature, marked with a vertical blue bar (see also Figure 6E). For entrained water mass fractions greater than this, quench fragmentation halts and S remains approximately constant at a value determined primarily by the glass transition and the size of particles produced by quench fragmentation (see Section 2.3.4 and Figure 3).
Blue symbols in panel (b) highlight the effects of sedimentation on ash surface area over the rise of the subaerial eruption column. The PSD is further enriched in fine ash following fallout of coarse particles, and S consequently increases with height of the eruption column. Furthermore, because the local rate of particle loss from the edges of entraining eddies is proportional to the ratio of particle fall speeds to the mixture rise speed according to Eq. 60, buoyant plumes with low MER, rise velocities, and radii have the largest increase in S during column rise. For collapsing columns (‘x’ symbols), S increases proportional to maximum height prior to collapse. Owing to a combination of fines enrichment from quench fragmentation and enhanced sedimentation due to reduced column rise speeds, all buoyant hydrovolcanic plumes (circle and diamond symbols) increase in particle specific surface area at their maximum height with increasing mass fraction of water.
The combined effects of quench fragmentation followed by sedimentation in the rising column influence both total retained mass of ash in the eruption cloud and the surface area per unit mass of particles. Figure 11C shows the fraction of total erupted particle mass remaining in the column at its maximum rise height, again as a function of water mass at the column source; symbols are as in panel (b), with colors showing S at maximum column height. Small eruptions that do not reach the tropopause (circle symbols) lose the greatest portion of their particle mass to sedimentation, while collapsing columns retain mass up to their (relatively much lower) maximum height before collapsing entirely. Of note, however, are the subset of eruptions that are both buoyant and of sufficiently high magnitude to breach the tropopause (highlighted with an arrow in panel (c)). With increasing water mass fractions, such events not only retain a greater portion of their initial pyroclast mass relative to control runs, but also have a more fines-enriched PSD in the spreading cloud as measured by the S parameter. Provided they generate buoyant eruption columns, the above results highlight the greater total flux of ash surface area to the spreading cloud for hydrovolcanic scenarios, with important implications for chemical and microphysical interactions with SO2.
4 Discussion
Here for the first time, we link the dynamics of magma flow in a volcanic conduit to the turbulent rise of an overlying subaerial eruption column for a submerged volcanic vent, using a model which governs water mixing into a gas-pyroclast jet and the coupled energetics of quench fragmentation. In marked contrast to previous studies which parameterize the mass fraction of external water ingested into the subaerial eruption column source (e.g., Koyaguchi and Woods, 1996; Mastin, 2007b; Van Eaton et al., 2012), we interrogate eruption dynamics that evolve with magma-water interactions that depend explicitly on the depth of an external water layer. Integral conduit and eruption column models of “dry” eruptions are well established in previous studies (Gonnermann and Manga, 2007; Michieli Vitturi and Aravena, 2021; Woods, 2010). Consequently, here we focus on effects of a water layer on the mechanical couplings among the conduit, vent and eruption column model components and their consequences for column rise and gravitational stability. We identify critical water depth conditions where column heights exceed the tropopause, explore sensitivities of these results to parameterizations for water entrainment and quench fragmentation, and compare results to observations of hydrovolcanic eruptions. We address, in particular, how key parameters in the fragmentation model influence the fragmentation energy budget and govern the production of particle surface area (ash). In addition to modulating the rise of a hydrovolcanic eruption column, the extent of ash production potentially affects also the SO2 absorption and the heterogeneous nucleation and growth of sulfur aerosols. Thus, we conclude by discussing the co-injection across the tropopause of ash, SO2, and water in hydrovolcanic eruption clouds and implications for chemistry, microphysics, and associated climate impacts.
4.1 Water Entrainment and Mixing Efficiency Governs Eruption Column Buoyancy
For a given MER, the model parameter that exerts the greatest control on atmospheric injection height and mass loading of fine ash and water is the effective water entrainment coefficient αeff. For a given water depth, the height above the vent at which water entrainment effectively begins and the rate at which water ingestion occurs govern the total mass of external water introduced into the column. The resulting water budget controls, in turn, the total thermal energy transfer from the melt to heat external water and supply the irreversible work to fragment pyroclasts to produce ash. The extent and rate of water entrainment therefore governs the conditions for column collapse or buoyant rise, the extent of fine ash production by quench fragmentation, and the depth at which water vapor is largely exhausted and the pyroclastic jet transitions to a weak steam plume. To make clear the insight gained through our considering the controls on the entrainment mechanics that govern column evolution, we will discuss in detail the behavior of our different entrainment scenarios. For comparison, we introduce natural examples of eruptive phases that involve interaction with water layers at various depths.
Except in the special case where the column does not decompress on exiting the vent, the decompression length LD acts to reduce the fraction of the water column height where entrainment can occur. Below the crossover length LX, where turbulent buoyant plume rise starts, the evolving local rate of entrainment is less than the steady-state value above LX. These expectations are broadly consistent with Saffaraval et al. (2012) who demonstrate that for overpressured jets, entrainment was 30–60% less efficient at axial distances less than about five vent diameters and vent overpressures up to about 3 atm. In more detail, over the decompression length LD water entrainment is impossible by definition and none occurs where LD > Ze. In contrast, for LD ≤ Ze water ingestion is possible and enhanced for (shallow) water depths greater than around 2 vent radii because increases in hydrostatic pressure suppress decompression (Figure 8F). Consequently, with no decompression scaling (No-Ld scenario), whereas the threshold depth for steam plumes is, for example, not significantly affected because the decompression length is very small at these depths (see Figure 8F), the threshold water depth for column collapse and stratospheric injection decreases by ∼20–30% (see Figure 9B).
The mechanism of decompression length inhibiting water entrainment in our model can be related to observations of real eruptions in shallow water layers. For example, the 2016–2017 eruption of Bogoslof volcano featured both transient explosions and sustained plumes emerging from vents typically in water depths of 5–100 m (Lyons et al., 2019). Lyons et al. (2019) interpreted acoustic signals of transient events at Bogoslof to result from explosive expansion of large bubbles of magmatic gas, which limited the direct interaction of external water with the erupting fragmented mixture. Deposits from these events in the near-vent region suggested that little or no condensed water was present during emplacement of pyroclastic surges, and Waythomas et al. (2020) interpreted this to mean that any water present was entirely in vapor form, further suggesting that these explosive events were drier than is typical of “Surtseyan”-type activity. The requirement for low liquid water content in pyroclastic surges at Bogoslof, combined with the observations of Lyons et al. (2019), suggests either a highly efficient mixing process and complete vaporization (possibly driven by molten-fuel-coolant explosions (Wohletz et al., 2013)), or limited ingestion of external water by explosive expansion of magmatic gas in a shallow water setting. Whereas events in our model with water depths less than Ld result in no incorporation of external water, we suggest this regime is analogous to real events similar to those of Bogoslof where water depths are comparable to or less than length scales for gas decompression, resulting in limited (though likely non-zero) amounts of external water incorporated into the eruption column. An overpressured vent is required for this event to occur, which is possible for either a steady eruption with choked vent flow, or for transient explosions originating in the shallow conduit. In our simulations, pyroclasts cool to the water saturation temperature around water mass fractions of 30–35% assuming that mixing and heat transfer are complete, at which point the liquid water content rises dramatically. This is therefore a likely upper bound for the mass fraction of external water in these relatively dry events at Bogoslof.
The crossover length scale LX governs where in the water layer column rise transitions from that of a pure jet to a turbulent buoyant plume. At and above this transition, entrainment by turbulent motions is fully developed (see Eq. 27). The crossover length is most sensitive to jet radius and velocity after decompression (see Eq. 31). The column rise speed changes little over LD so long as the conduit remains choked. However, the jet radius after decompression decreases rapidly with increasing hydrostatic pressure and decreasing vent overpressure, and for deep water LX approaches a value less than half of that for a subaerial jet (see Figure 8 panels (d), (f), and (h)). As LX decreases with increasing water depth, αeff increases more rapidly with height above the vent (see Eqs. 32 and 33) and the jet entrains external water at slightly greater rates for deeper water layers. However, more important remains the total height over which water entrainment occurs. Without considering the crossover length scale (No-LX scenario), entrainment sufficient to cause column collapse or steam plumes occurs within only a few tens of meters of where entrainment starts, even for very large MER (see Figure 9B). Because of the progressive increase of αeff with height in scenarios that include the LX scaling, removing it in the No-LX scenario has a greater impact on the threshold for steam plumes than for the column collapse condition, relative to the No-Ld scenario.
By definition, the No-Ld-No-LX scenario has entrainment at rates corresponding to those for fully developed turbulence in subaerial jets (e.g., Morton et al., 1956; Carazzo et al., 2008), and even for the largest MER leads to ingestion of water masses sufficient to overwhelm jets that would otherwise lead to stratospheric injections. For example at Q0 ≈ 109 kg/s stratospheric injection is prevented at water depths greater than about 60 m, compared to a limit of 250 m in the Reference scenario (see Figure 9B). The entrainment rates and collapse conditions in the No-Ld-No-LX scenario are therefore likely inconsistent with real hydrovolcanic eruptions. For example the ∼24,000 BP Oruanui hydrovolcanic eruption in New Zealand had estimated magma mass fluxes of 108–109 kg/s and is recognized for its remarkably wide dispersal of airfall deposits (Wilson, 2001). This eruption emerged through Lake Taupo, which in modern times has water depths averaging about 150 m, and is believed to have had depths of at least 100 m at the time of the eruption (Nelson and Lister, 1995). These inferences are consistent with little water entrainment and mixing in the near-field and reinforce the importance of considering Ld and LX in the evolution of buoyant subaerial columns from submerged volcanic jets.
The isothermal, single-phase experiments of Zhang et al. (2020) show that fully developed turbulence with steady-state entrainment in subaqueous, supersonic jets occurs at a distance from the vent greater than about ten vent diameters, with comparatively inefficient and transient entrainment modes dominating closer to the jet source. For such subaqeuous jets, both turbulent shear and buoyancy effects contribute to the development of large turbulent eddies that injest surrounding water. For comparison with the typical shear-driven entrainment condition used in our Reference scenario and to highlight potential variability in the entrainment mechanisms of real sub-aqueous volcanic jets, we parameterize buoyancy-driven entrainment in the αRT scenario using a slightly modified form of the “Rayleigh-Taylor” entrainment coefficient of Zhang et al. (2020) in Eqs. 35 and 36. Differences between the αRT and Reference scenarios (see light blue and black lines in Figure 9B, respectively) are governed by the α ∝ a2/qc dependence of Eq. 36. For Q0 ≲ 107, the ratio of jet cross-sectional area to mass flux a2/qc is relatively large, resulting in large entrainment rates comparable to those for fully developed plumes (i.e. No-Ld-noLX scenario) and consequently shallow water depths for the column collapse and steam-plume conditions. For Q0 ≫ 107 kg/s, as entrained water is vaporized jet density initially decreases, resulting in enhanced Rayleigh-Taylor entrainment and column collapse for slightly shallower depths than the Reference scenario. However, for larger water depths where the jet cools to the water saturation temperature, entrained water remains liquid, jet density increases and radius decreases (see Figure 8, panels (h) and (j)). As a result, qc dominates in Eq. 36 for water depths much greater than the threshold for collapse, and entrainment rates are suppressed. The reduced entrainment rates for large MER and deep water layers, in turn, prevent total exhaustion of the particle heat budget such that, in contrast to other scenarios, the steam plume condition occurs for pressure-balanced jets much deeper than the limit for vent choking (see Figure 9B). As a final remark here, we reiterate that the mechanics of water entrainment exert the greatest control over column rise. Our results underscore, however, that this process is poorly understood and is a key avenue for future work on hydrovolcanism. As implemented, the shear-driven and buoyancy-driven modes govern water ingestion for very different MER-water depth conditions. Whereas it is straightforward to embrace both contributions parametrically through the effective entrainment coefficient given by Eq. 35, there are no observational or experimental constraints on how best to characterize the relative contributions of each mode. Furthermore, how the underlying dynamics and their couplings are modified by local MFCI as well as particle inertial and buoyancy effects, as well as the character and thermal mixing properties of MWI, are unknown.
Conditions leading to gravitational collapse in our model (water mass fractions ≳30–40 wt%) are consistent with those in previous integral plume models of wet eruption columns (Koyaguchi and Woods, 1996; Mastin, 2007b). Our results are further consistent with observations that buoyant, ash-laden subaerial eruption columns are rarely observed for water depths greater than about 100 m (Mastin and Witter, 2000). However, a challenge with interpretation of integral plume models is that they predict sharp boundaries between behavioral regimes (i.e., collapse or no collapse), whereas real eruptions have gradual transitions between behaviors. Columns that are either fully buoyant or completely collapsing are now understood to be end member behaviors, with eruption columns undergoing partial collapse and simultaneous rise of buoyant central columns and secondary plumes from pyroclastic density currents being commonplace (Neri et al., 2002; Gilchrist and Jellinek, 2021). Indeed, hydrovolcanic eruptions are noted for highly dispersive eruption columns with multiple spreading levels (Carazzo and Jellinek, 2013; Houghton and Carey, 2015), owing to complex cloud microphysical processes including latent heat exchange and hydrometeor formation (Van Eaton et al., 2012, 2015), wet particle aggregation (Brown et al., 2012; Telling et al., 2013; Van Eaton et al., 2015), or collective settling and diffusive convection (Carazzo and Jellinek, 2012, 2013). The thresholds shown in Figure 9, including for column collapse, stratospheric injection, vent choking, and plume failure are best interpreted as gradual transitions between likely behavioral regimes. Similarly, the condition for steam plumes represents a transitional regime where jets of liquid water, ash and steam can still breach the water surface and may produce water-rich plumes driven by moist convection, but the vast majority of water and particle mass collapses immediately at the surface or does not breach it at all (see Figure 8A). As an example of this regime, the eruption of South Sarigan Volcano in 2010 occurred in water depths of 180–350 m, and produced a column up to 12 km in height during its peak phase. However, satellite observations showed that the plume was very short-lived and consisted primarily of water, with only minimal ash fallout or aerosols detected (McGimsey et al., 2010; Global Volcanism Program, 2013; Green et al., 2013).
A final consideration for the development of buoyancy in the subaerial eruption column is the effect of thermal disequilibrium. To validate the assumption of thermal equilibrium in an integral model, Koyaguchi and Woods (1996) assumed timescales for heat transfer between particles and entrained water of order 1 s or less, which is reasonable for particle diameters less than about 1 mm, and also requires the column to be well-mixed. For the range of water depths considered here, typical timescales for the jet to penetrate the water surface are about 0.1–5 s (assuming choked flow at the vent). Our MWI model therefore assumes entrainment and heat transfer occur on timescales
4.2 Trade-Offs Among Thermal Energy Budget, Particle Loss, Particle Surface Roughness, and Fragmentation Efficiency
Our fragmentation model aims to capture the essential energy and mass budget characteristics of quench fragmentation derived from observational and experimental constraints on the glass transition temperature Tg (Dingwell, 1998), the fragmentation energy efficiency ζ (Sonder et al., 2011), particle roughness Λ (Zimanowski and Büttner, 2003; Fitch and Fagents, 2020), the initial PSD power-law exponent D (e.g., Girault et al., 2014), and measured hydrovolcanic particle sizes (Costa et al., 2016). Here we focus on the consequences of varying Λ, ζ, and D for production of fine ash. For reference, we refer to Section 3.4 and Figure 11B, which plots Reference scenario particle specific surface area at two heights - column source and maximum column height - as a function of column water mass fraction at the water surface. These same data for the Reference scenario (i.e., gray and blue diamond symbols in Figure 11B) are again plotted in Figure 12 in blue (now circles and diamonds for values at the column source and maximum height, respectively), together with results of scenarios with alternative fragmentation model parameters (see Table 2). As in Figure 11B, MER is represented by symbol size. As described in Section 3.4, cooling below the glass transition temperature limits the generation of additional ash surface area for total mass fractions of water nw ≳ 0.15. First examining the Reference scenario (ζ = 0.1, Λ = 10, D = 2.9, and mean output particle size, ϕμ = 3.4; blue symbols in Figure 12), this mechanical limit results in approximately a 20% increase in ash specific surface area S at the base of the eruption column, and a 10–15% increase in S at the spreading height, relative to control scenarios. As discussed in Section 3.4, coarse particle fallout is relatively enhanced for low-MER events which have small radii and lower column rise speeds when compared with larger MER. As a consequence, sedimentation in low-MER (≪ 107 kg/s) columns exerts a stronger control on particle surface area than does quench fragmentation in our simulations, whereas the two mechanisms are comparable in magnitude for larger eruptions.
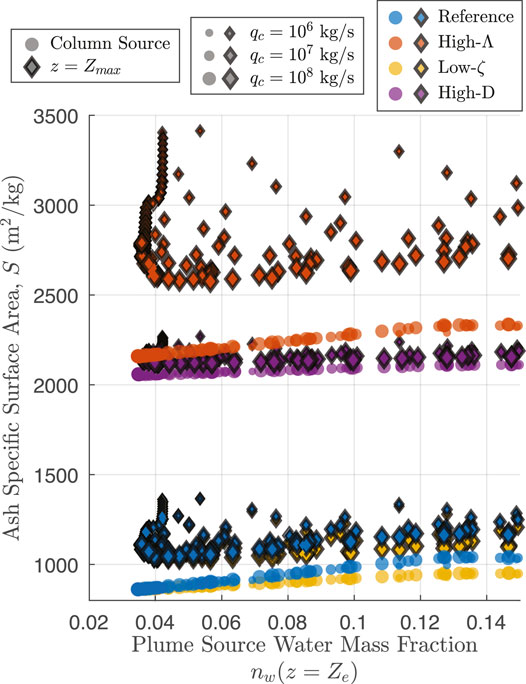
FIGURE 12. Pyroclast specific surface area as a function of water mass fraction at the water surface (circles) and height of neutral buoyancy (diamonds) for scenarios with different fragmentation properties. The Reference scenario is shown in blue. Reducing the fragmentation energy efficiency to ζ = 0.05 (Low-ζ scenario, yellow symbols) reduces the amount of energy consumed to generate surface area per unit mass of entrained water, resulting in a smaller increase in S during MWI relative to the Reference scenario. Conversely, a high initial value of the PSD power-law exponent, D = 3.2 (High-D scenario, purple symbols), concentrates initial particle mass in the fine fraction. Because of the fixed particle sizes for output from quench fragmentation used here (see Figure 3), there is relatively little particle mass available to fragment for the creation of new surface area and the relative change in S with water entrainment is small. Finally, increasing the particle roughness scale, Λ = 25 (High-Λ scenario, red symbols), results in initially high particle surface area, but also a greater energy requirement to generate new particles of a given size. This scenario results in the highest absolute changes in particle surface area after quench fragmentation and sedimentation, but a smaller relative change than for the Reference scenario.
Red symbols in Figure 12 show the High-Λ scenario, where the particle roughness scale Λ is increased from 10 to 25 and other input parameters are held constant. Similar to Fitch and Fagents (2020), Λ has the largest influence on total ash surface area. Increasing Λ to 25 results in a proportional increase in initial surface area; the minimum value of S for the Reference scenario with no entrained external water is 860 m2/kg, and is 2,160 m2/kg for the High-Λ scenario. However, the energy requirement to generate particles of a given size also increases proportionally. Since the fragmentation energy budget per unit mass of pyroclasts is approximately the same as in the Reference scenario (determined by magma heat capacity, fragmentation energy efficiency, and the glass transition temperature), the amount of total surface area generated during MWI is similar to the Reference scenario, but the proportional increase in S resulting from MWI is less than 10% relative to the control simulations. Comparing change in surface area resulting from water entrainment and quench fragmentation (red circles) with that resulting from sedimentation (difference between circles and diamonds), the effects of sedimentation in this case exert a much stronger control on ash surface area in the eruption cloud than does MWI. High particle roughness scenarios thus have the greatest total ash surface area in the eruption cloud, but a relatively modest change compared to control simulations with no external water.
The fragmentation energy efficiency ζ governs the relative partitioning of irreversible thermal energy loss from the melt between that used to heat and vaporize water and that consumed by fragmentation and production of particle surface area. Choosing a low value for the fragmentation energy efficiency, ζ = 0.05 (Low-ζ scenario, yellow symbols in Figure 12), reduces the energy consumed by fragmentation per unit mass of entrained water, resulting in overall less ash production before the glass transition limit is reached. This scenario has both the lowest total particle surface area after quench fragmentation and a modest change relative to control scenarios of 5–10%. The high fragmentation energy efficiency scenario with ζ = 0.15 (High-ζ scenario, data not shown) has an effect of similar magnitude but opposite sign on specific surface area S compared with the Low-ζ scenario. S after sedimentation in the eruption column, however, is very similar to that for the Reference scenario, and we consequently do not show those results in Figure 12.
The initial PSD, governed by D, determines the relative weight of particles towards fine or coarse fractions prior to MWI. Since we fix the particle sizes produced by quench fragmentation to values based on the phreatomagmatic phase C of the Askja 1875 eruption (see Section 2.3.4 and Figure 3), an initial PSD already enriched in these particle sizes will not change significantly in our MWI model, and consequently little fragmentation energy will be consumed. The High-D scenario with D = 3.2 (purple symbols in Figure 12), results in very high initial particle surface area (
The results of the various fragmentation scenarios above reveal an important trade-off among particle size distribution, particle roughness, and the consumption of fracture surface energy during quench fragmentation. The primary effect of the glass transition limit and fragmentation energy efficiency is to determine the energy budget for fragmentation, whereas particle roughness and surface energy limit the mass of fine particles that can be produced within a given energy budget. The initial PSD, in turn, determines the mass of “coarse” particles available with which to generate new fine ash. The mass in this coarse fraction is dependent on the choice of particle sizes that fragment during quenching, and the preferred sizes of particles produced. Our simple mechanical energy balance model relies on a prescribed initial PSD and on a perfect conversion of fragmentation energy to the plastic work of brittle fragmentation. For a given ζ, the approach provides a crude and probably lower bound that should be applied cautiously. Whereas we fix the particle sizes generated by quench fragmentation to those of a known deposit, modal particle sizes from quench fragmentation vary as a function of melt properties and cooling rates (van Otterloo et al., 2015), as well as bubble size distributions (Liu et al., 2015). Our model further assumes that quench fragmentation is a brittle failure process limited in extent by rapid cooling below the glass transition temperature (e.g., Mastin, 2007a; van Otterloo et al., 2015). This limit constrains failure to occur only in conditions in which the melt phase can accumulate elastic thermal stresses in excess of a yield stress. This approach neglects, for example, potentially important time-dependent effects related to the growth of thermal stress gradients and stress concentrations, which can arise with additional cooling (Woodcock et al., 2012; van Otterloo et al., 2015), and evolve depending on the character of the water boiling regime at the melt-water interface (Moitra et al., 2020). The cessation of quench fragmentation with decreasing particle temperature is probably more gradual in real eruptions than in our model (see Supplementary Material Section S2 and Supplementary Figure S4 for additional discussion of thermal stresses during quench fragmentation). Despite these complexities, together with consideration of the entrained masses of water in hydrovolcanic eruption columns, these constraints allow estimation of the total mass and surface area of fine ash delivered to the spreading levels of buoyant hydrovolcanic eruption clouds.
4.3 Water Layer Depth, Volatile Saturation and Fragmentation in the Conduit, and Vent Choking
The additional hydrostatic pressure with a water layer overlying the vent influences the results of our coupled model in two primary ways: 1) it modulates the extent to which a vent is choked and overpressured, and 2) it controls the total amount of gas exsolved from the melt (Smellie and Edwards, 2016; Cas and Simmons, 2018; Manga et al., 2018), which, in turn, influences both the magma ascent rate and the quench fragmentation process. For water depths near the collapse threshold, magma flow at the vent is choked and overpressured (see Figure 8 panels (a), (d), and (e), and Figure 9A). Consequently, the column collapse condition is not heavily influenced by changes in conduit conditions with increasing water depth, and is primarily determined by the mass fraction of entrained external water. However, for water depths sufficient to suppress vent overpressure, Ld → 0 and LX approaches its minimum value. Entrainment consequently starts near the vent and ingestion rates are typically faster overall for pressure-balanced jets, which is broadly consistent with experimental comparisons of overpressured and pressure-balanced jets (Saffaraval and Solovitz, 2012). This condition leads to the tendency for the steam plume regime to coincide with the water depth limit for choking (Figure 9A). However, as discussed in Section 4.1, the choking and steam plume conditions need not coincide if entrainment rates are either very high (e.g., No-Ld-noLX scenario), or very low (e.g., αRT scenario for Q0 ≳ 108 kg/s). Therefore buoyant columns are most likely for subaqueous eruptions that are choked and overpressured at the vent as opposed to pressure-balanced, but this is not a strict requirement and depends on the dynamics of decompression and water entrainment near the vent, as well as the conditions for choking (for example the mixture sound speed).
Comparing total exsolution for small and large water depths (Figure 5F), differences in vapor exsolution in the conduit model control the glass transition temperature (Figure 3B), which, in turn, governs the heat budget available for ash production during the quench fragmentation (Figure 11A). This effect is most apparent when considering events with a second nucleation event occurring in the conduit model for low MER (Figure 5F). Specifically, diffusion rate of vapor leaving the melt is sensitive to bubble number density, so a second nucleation event near fragmentation enhances exsolution rate above fragmentation, leading to the sharp change in total exsolution shown in Figure 5F. Simulations with a strong second nucleation in the conduit result in distinctly different production of ash surface area during quench fragmentation (Figure 11A for
For primary brittle fragmentation and explosive volcanism to occur during magma ascent in the conduit (i.e. without the influence of external water), either gas overpressure in bubbles must exceed the tensile strength of the melt, or the rate of magma ascent must be sufficiently high to exceed the critical strain rate for brittle failure of the melt (Papale, 1999; Gonnermann, 2015). As described in Section 3.1, both maximum decompression rate and maximum bubble overpressure (as recorded at the fragmentation depth) decrease with increasing hydrostatic pressure in our conduit model. In Figure 5D, we show that for water depths of about 200 m or greater, the maximum bubble overpressure Δpb in our model falls below values likely to cause rupture of bubble walls. Were bubble overpressure used as the fragmentation criteria in our conduit model, fragmentation could in principle still occur, albeit at shallower depths in the conduit, but becomes increasingly less likely with increasing water depth (Campagnola et al., 2016; Cas and Simmons, 2018). For example, Manga et al. (2018) used a strain-rate fragmentation criterion to estimate that for the 2012 submarine eruption of Havre volcano, magmatically-driven brittle fragmentation in the conduit could only have occurred if the vent were shallower than about 290 m. It is worth noting that brittle fragmentation mechanisms in general, particularly those driven by water interaction, are not precluded at such depths, though explosive expansion of steam is suppressed (Murch et al., 2019; Dürig et al., 2020a). Critically, increasing thicknesses of water or ice will increasingly suppress the conditions for which sustained brittle or explosive fragmentation may drive gas jets or plumes, particularly those capable of reaching tens of kilometers into the atmosphere.
4.4 Sensitivity: Water Infiltration Into the Shallow Conduit
As highlighted in Section 2.1, our coupled conduit-vent-plume model scenarios do not include the effect of water infiltration into the shallow conduit. However, some ingress of groundwater into the conduit is likely in many circumstances. Accordingly, we show sample calculations and simulations to explore potential effects on eruption column behavior in our MWI and plume models. Existing models of magma-water interaction (MWI) in the shallow conduit (i.e., above the level of fragmentation) (Starostin et al., 2005; Aravena et al., 2018) have highlighted that the increased gas content resulting from vaporization of external water leads to an increase in vent velocity, vent overpressure, and mass eruption rate (MER), and reduced eruption temperatures. Of greatest importance for the purposes of this study are the extent to which water infiltration into the shallow conduit may influence the behavior regimes highlighted in Section 3.3 and Figure 9, thereby influencing the conditions for stratospheric injection. In particular, added water in the conduit will increase the gas pressure at the vent, and therefore deepen the critical water depth at which vent choking and overpressure are suppressed. Here we perform a sensitivity analysis for changes to the choking condition arising from the infiltration of external water into the conduit, and resulting effects on water entrainment, plume rise, and stratospheric injection in our model. We do not consider cases where the conduit geometry is modified by failure or erosion during MWI, and we also do not include the effects of fragmentation resulting from water infiltration into the conduit prior to eruption (i.e. additional energy consumed through mechanical modifications to the grain size distribution).
For a choked conduit flow (M = 1) the theoretical pressure at the vent can be approximated as (Koyaguchi, 2005)
where
where
where
To demonstrate the effect of water infiltration into the conduit on the MWI and eruption column models, Figure 13 shows a series of model simulations in which we calculate the vent condition from the above relations (i.e., without running the conduit model, but using a sound speed corresponding to Eq. 6 and running the MWI and plume models from the calculated vent condition). We use a fixed magmatic mass flux of q0 = 2 × 10⁷ kg/s, 0 ≤ nec ≤ 0.15 (see also Supplementary Figure S7), and vary water depths from 0 to 300 m (Ze/ac ≈ 12). Panel (a) shows the critical water depth at which hydrostatic pressure exceeds the vent choking pressure, resulting in a transition to a pressure-balanced jet. Values of nec corresponding to the simulations shown in panels (b)-(e) are highlighted with blue and gray circles. For nec = 0.15, the water depth limit for choking is more than doubled (from 130 to 267 m) relative to the case with no external water in the conduit. Panels (b), (c), and (d) show subaerial eruption column source parameters after breach of the water surface for varying water depth Ze and conduit water fractions nec, and panel (e) shows the eruption column height. Panel (b) shows the total mass fractions of vapor and liquid water (external and magmatic). Importantly, the water depth at which liquid water dominates the jet (the steam plume condition) differs only by about 20 m between scenarios. Panel (c) shows column source temperature, highlighting the change in decompression length and onset of mixing with surface water that results from increased gas pressure at the vent. Panel (d) shows the increase in jet velocity, driven by changes in the mixture sounds speed and jet density as it travels through the water column. Panel (e) shows the maximum plume height and level of neutral buoyancy, which decrease by up to about 3 and 1.7 km respectively with nec = 0.15. The water depth threshold for column collapse is increased by up to about 40 m relative to scenarios with no external water in the conduit. The critical result of the above analysis is that despite a doubling of the depth threshold for vent choking highlighted in panel (a), infiltration of external water into the conduit changes the behavior thresholds of the eruption column passing through a surface water later by a comparatively small amount of tens of meters. An important caveat to this discussion is that these simulations do not include the potential for highly energetic and impulsive releases of energy driven by fuel-coolant interaction, or related changes in the magmatic mass flux and vent geometry that may arise from an influx of external water.
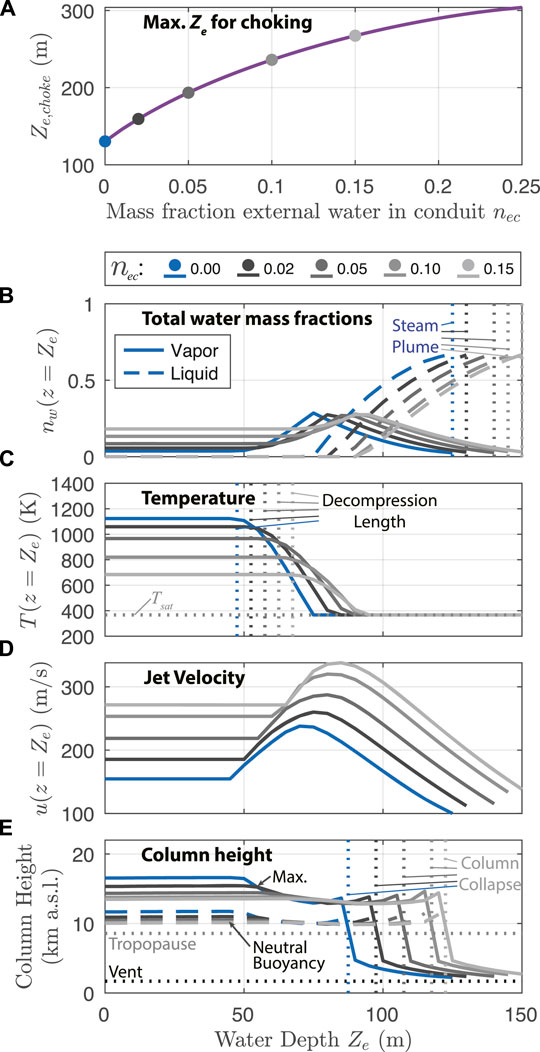
FIGURE 13. Sensitivity analysis for infiltration of a prescribed mass fraction of external water infiltrating into the conduit nec. Simulations use a magmatic mass flux of 2 × 10⁷ kg/s, and all other parameters including atmospheric profiles are held fixed relative to the Reference scenario. Vent conditions are calculated according to Eqs. 63 and 65. (A) Critical surface water depth at which hydrostatic pressure exceeds vent choking pressure (Eq. 63) as a function of water infiltration into the conduit. Circles highlight the values of nec used in the simulations shown for panels (B–E). Panels (B–D) show parameters at the subaerial eruption column source after breach of the water surface (z = Ze). (B) Total mass fractions of liquid and vapor water phases. Vertical dotted lines show the water depth threshold for steam plumes for each of the conduit water scenarios. (C) Jet mixture temperature. Vertical dotted lines show the threshold at which decompression length scale Ld is equal to water depth Ze. (D) Jet vertical velocity. (E) Maximum eruption column height (solid lines) and level of neutral buoyancy (dashed lines). Vertical dotted lines show the water depth threshold for column collapse.
4.5 Stratospheric Injection in Hydrovolcanic Eruptions and Implications for Sulfate Aerosol Lifecycle
Radiative forcing by sulphate aerosols is governed by the total mass of injected sulfur dioxide, the height, season, and latitude of injection, and the chemical and microphysical processes that determine the resulting aerosol particle size distribution (Timmreck, 2012; Lacis, 2015; Kremser et al., 2016; Marshall et al., 2019; Toohey et al., 2019). The injection height relative to tropopause height is critical for determining the mass of stratospheric sulfur burden. However, the total mass and size distribution characteristics of fine ash as well as high water content in hydrovolcanic eruptions are also likely to play a role in the life cycle of sulfur aerosols. For example, LeGrande et al. (2016) showed that the coincident injection of SO2 with high concentrations of water can shorten the characteristic timescale for conversion of SO2 to aerosol from weeks to days, enhancing aerosol radiative forcing in the earliest weeks after an eruption. Chemical scavenging of SO2 onto ash surfaces is a potentially important source of SO2 removal both during eruption column rise and in the days and weeks following an eruption (Rose, 1977; Schmauss and Keppler, 2014; Zhu et al., 2020). Experimental results from Schmauss and Keppler (2014) demonstrated that SO2 absorption onto ash particle surfaces is most efficient where volcanic plumes are cool, SO2 is dilute, and ash surface areas are high - all conditions that are likely to be enhanced in hydrovolcanic eruption columns relative to purely magmatic cases. Zhu et al. (2020) reported that persistent fine ash particles dispersed along with SO2 from the 2014 eruption of Kelut Volcano contributed to enhanced nucleation of aerosol particles onto ash surfaces and aerosol particles sizes up to 10 times that of typical background stratospheric aerosol. Critically, chemical uptake of SO2 onto ash surfaces increased the rate of sulfur removal by sedimentation by 43% in the first 2 months following the eruption. Finally, enhanced stratospheric loading of water can directly produce a positive radiative forcing in the troposphere, potentially counteracting the cooling effects of sulfur aerosols (Joshi and Jones, 2009).
Figure 14 shows estimates for the flux of SO2, fine ash, and water to the tropopause for simulations with two different atmospheric profiles (Reference, top row of panels and Low-Lat, bottom row). Panels (a) and (b) show the estimated fraction of SO2 delivered to or above the tropopause, where we approximate the vertical distribution of the SO2 cloud
The estimated fraction of SO2 delivered to the stratosphere is the fraction of the integrated area of Eq. 66 that lies above the tropopause. Events with injection heights close to the tropopause (Q0 ≈ 3 × 10⁶ kg/s and Q0 ≈ 3 × 10⁷ kg/s in the high and low latitude atmospheres, respectively) show reduced efficiency of stratospheric delivery of SO2 for water depths that surpass the decompression length (and therefore non-zero quantities of external water are entrained). The exceptions are columns in the low-latitude atmosphere with minor quantities of entrained water (nw ≈ 0.15), which have increased column heights relative to control scenarios (see Figure 10B). Panels (b) and (c) show the ratio of fine ash mass flux (particle diameter
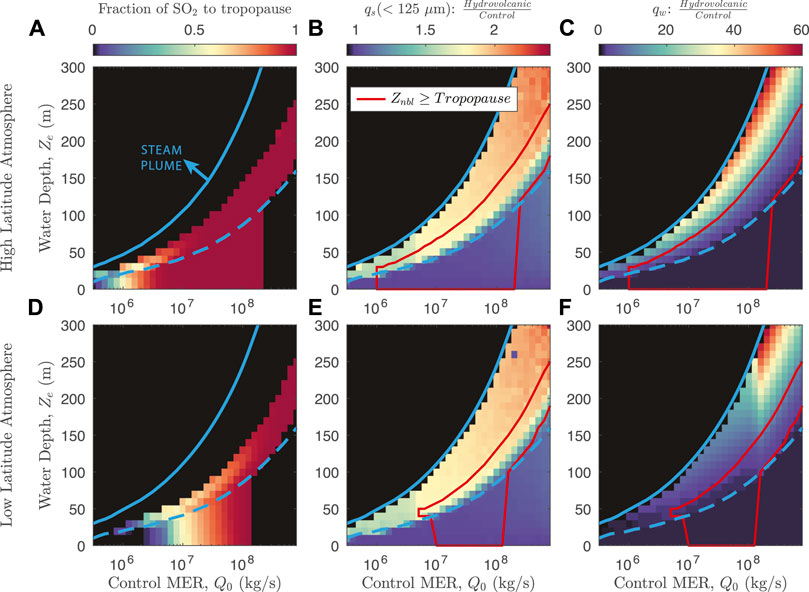
FIGURE 14. Estimated fraction of SO2, fine ash mass flux, and water mass flux to the stratosphere. (A) Estimated fraction of outgassed SO2 injected above the tropopause assuming a Gaussian injection profile centered about the height of neutral buoyancy (Equ. 66), as a function of control MER Q0 and water depth Ze. In all panels, the dashed blue line is threshold water depth for water entrainment (decompression length equal to water depth, Ld = Ze), and the solid blue line is the threshold depth for steam plumes (see Figure 9). Black regions indicate column collapse. (B) Fine ash mass flux to the eruption column maximum height as a ratio of hydrovolcanic (Ze > 0) to control (Ze = 0) simulations, for particle diameters less than 125 μm. Red line outlines simulations with buoyant plumes at spreading heights at or above the tropopause. (C) Water mass flux to the eruption column maximum height as a ratio of hydrovolcanic (Ze > 0) to control (Ze = 0) simulations. Black regions indicate the steam plume regime in panels (B,C,E,F). Panels (A–C) are for with a high latitude (Iceland) atmospheric profile (Reference scenario). Panels (D–F) are the same as (A–C), respectively, but for the low latitude (Equador) atmosphere (Low-lat scenario).
In summary, we find that incorporation of high mass fractions of external water in eruption columns acts to reduce eruption column height or induce gravitational collapse, while also enhancing conditions for chemical scavenging of SO2 into ash and hydrometeors, including initially colder temperatures, high available ash surface area, and abundant water. For SO2 that does reach the stratosphere, results of LeGrande et al. (2016) and Zhu et al. (2020) suggest that the presence of water and fine ash enhance aerosol reaction rates and sedimentation. Our results imply that in the absence of an explicit functional dependence on the change in PSD related to MWI, the SO2 delivery efficiency given by Eq. 66 is at best an upper bound where eruptions interact with water layers deeper than about 50 m. On the basis of results presented here, we suggest that hydrovolcanic eruption processes will on average act to reduce the climate impacts of volcanic aerosols. However, the evaluation of stratospheric sulfur loading in volcanic eruptions requires further analysis, particularly of microphysical processes not included in our model. For example, moist convection in water saturated air may enhance lofting of secondary plumes even for collapsing columns, potentially delivering SO2 to the stratosphere following dynamics similar to thunderstorms (Joshi and Jones, 2009; Van Eaton et al., 2012; Houghton and Carey, 2015). Alternatively, formation of hydrometeors (graupel, hail, or liquid water droplets) and aggregation of ash particles can lead to sedimentation of fine ash and water at much higher rates than predicted by particle settling time alone (Brown et al., 2012; Van Eaton et al., 2015), and column buoyancy and sedimentation processes can be further modified by interaction with atmospheric cross-winds (Girault et al., 2016). If sedimentation occurs faster than the timescales for chemical scavenging of SO2 onto ash surfaces, this can lead to early separation of ash and gas phases, as was observed for the 2011 eruption of Grímsvötn Volcano (Prata et al., 2017). However, if the timescale for SO2 scavenging is fast relative to particle fallout time as a result of say, high particle surface area and cold column temperature (Schmauss and Keppler, 2014), then aggregation-enhanced particle settling could act to efficiently remove scavenged SO2 from the eruption column. For example, despite the observed separation of ash and gas clouds in the Grímsvötn eruption, Sigmarsson et al. (2013) estimated that approximately 30% of outgassed SO2 was scavenged by ash particles and subsequently removed from the eruption cloud, with an additional 10% lost directly to the subglacial lake (16 and 5% of the total magmatic sulfur budget, respectively).
4.6 Implications of Hydrovolcanism for Volcano-Climate Feedback
We have discussed coupled processes in hydrovolcanic eruptions which suggest that the stratospheric sulfate aerosol climate impacts of hydrovolcanic eruptions are likely to be reduced relative to dry eruptions. This hypothesis, in turn, suggests the potential for a largely unrecognized mechanism for volcano-climate feedback, where changes to the relative extent or frequency of hydrovolcanism resulting from evolving climatic conditions (glacial-interglacial cycles, for example) in turn modulate volcanic aerosol forcing. This feedback mechanism potentially acts concurrently to the effect of changing stress fields on the crust as a result of ice sheet advance and retreat, referred to as the ‘unloading effect’ in Cooper et al. (2018). Regional to global-scale changes in the occurrence of hydrovolcanism could for example arise from enhanced eruption rates in glaciated regions during glacial unloading (e.g., Jellinek et al., 2004; Albino et al., 2010; Sigmundsson et al., 2010). Huybers and Langmuir (2009) suggest that globally enhanced rates of volcanism would lead to an amplifying feedback where outgassing of volcanic carbon contributed to additional warming. This hypothesis was based on the assumption that time-averaged radiative forcing of volcanic CO2 is stronger (over century to millennial timescales) than that of short-lived aerosol cooling events. However, the potential for climate impacts on multi-decadal to millennial timescales (Zhong et al., 2011; Baldini et al., 2015; Soreghan et al., 2019; Mann et al., 2021) challenges this view, and there is open debate on whether (or under what climate conditions and/or timescales) the effects of global volcanism drive net climate cooling or warming (Baldini et al., 2015; Lee and Dee, 2019; Soreghan et al., 2019). For example, Baldini et al. (2015) suggest that large volcanic sulphate injections during the Last Glacial Maximum drove hemispherically asymmetric temperature shifts and millennial-scale cooling feedbacks. A change in the relative global frequency of hydrovolcanism is one potential mechanism for steering the volcanic climate control in one direction or another over these timescales. In particular, the outgassing of volcanic CO2 is likely less affected by surface MWI than is SO2, since CO2 exsolves at initially greater crustal depths (Wallace et al., 2015) than SO2 and its climate impacts are insensitive to injection height or co-emission with ash and water. On timescales of centuries to millennia, this process could in principle modulate the global importance for climate forcing of volcanic sulfate aerosols relative to volcanic carbon and therefore alter the character (e.g. amplifying or stabilizing) of volcano-climate feedbacks resulting from glacial unloading. The extent to which hydrovolcanism modulates global volcano-climate forcing remains an open question, and likely depends critically on both eruption rates and the surface distribution and thickness of ice sheets overlying volcanic regions, and the resulting frequency and intensity of hydrovolcanic processes.
4.7 Emerging Constraints and Knowledge Gaps for Silicic Hydrovolcanic Eruptions
The primary research goal of this study is to highlight external water controls on the climate impacts of hydrovolcanic eruptions. In attempting to address this central question, we have highlighted connections among magmatic heat budget, mixing efficiency with external water, and the extent of quench fragmentation which are relevant to general aspects of hydrovolcanic eruptions. First, we show that the combined effects of gas decompression and the monotonic development of turbulence in the overlying eruption column reduce the height over which water entrainment and mixing can occur and the overall rate of entrainment relative to subaerial jets and plumes. Indeed, a key finding is that without this mechanical modulation and regardless of the predominant mechanism for water entrainment, water mass fractions sufficient to exhaust the pyroclast heat budget are ingested in relatively shallow water depths of tens of meters for even very large eruptions (see the No-Ld-No-LX scenario in Figure 9B). Second, we include fragmentation in the energy conservation scheme to quantify a relationship between the amount of entrained external water and the extent of quench fragmentation. Assuming the fragmentation energy efficiency of Sonder et al. (2011) is broadly applicable, extensive fines-enrichment of the total PSD can occur for relatively modest mass fractions of entrained external water (ne ≈ 0.12, see Figure 3). Taken together, these two insights highlight two classes of question for further research into coupled hydrovolcanic processes: 1) What are the quantitative connections among hydrostatic-pressure influenced volatile exsolution, pyroclast vesicularity and permeability, glass transition temperature, and particle size distributions following magmatic fragmentation? How do the above connections modulate the mechanisms and products of fragmentation resulting from water entrainment and thermal mixing? 2) What are the predominant mechanisms governing the entrainment and mechanical and thermal mixing of external water into hot eruption columns? In particular, under what conditions is the erupting mixture particularly affected by the additional intrusion of water into the conduit through permeable wall rock (e.g. Barberi et al., 1989; Aravena et al., 2018)? Where and at what spatial scales, eruption stages, or flow regimes do processes such as molten-fuel coolant interactions (e.g., Zimanowski and Büttner, 2003) dominate? Under what conditions can energetic fuel-coolant interactions or lofting from secondary plumes following column collapse enhance stratospheric delivery of sulfur dioxide relative to mechanisms presented here?
4.8 Summary
We present a novel coupled integral model of conduit and eruption column dynamics for hydrovolcanic eruptions. We have simulated steady phases of explosive eruptions through a shallow water layer (Ze ≲ 500 m) overlying the volcanic vent, including the effects of gas exsolution and magma ascent in the conduit, water entrainment and quench fragmentation, and eruption column rise and particle fallout. Based on our model results and arguments in Sections 4.1–4.5, in addition to findings of previous studies, we summarize key effects of changes in hydrostatic pressure and direct MWI on steady explosive eruption processes:
1) Increasing hydrostatic pressure with water depth reduces vent overpressure and the likelihood for choking in the conduit. These effects limit the magnitude of explosive decompression and reduce vent velocities. Choked vents do not occur in our simulations for water depths greater than about five vent diameters.
2) Increasing hydrostatic pressure with water depth reduces gas exsolution and decompression rates in the conduit, decreasing the total fraction of gas that is exsolved on eruption at the vent, and potentially limiting the conditions for magmatically-driven fragmentation (e.g., bubble overpressure).
3) The total mass of entrained water increases with water depth, driving a decrease in eruption column heights. Column collapse occurs for water mass fractions greater than about 30%.
4) There is a range of water mass fractions (10–15%) in the starting subaerial jet in which plumes heights are increased relative to dry control scenarios as a result of high vapor mass fractions and the release of latent height with condensation. However, we find that plume heights are increased only in moist, low-latitude atmospheres and for a very narrow range of water depths.
5) The critical mass eruption rate required for eruption columns to reach the tropopause is sensitive to increasing water depth and is governed primarily by the column collapse condition. For water depths greater than about 200 m, only the largest eruptions (MER ∼ 109 kg/s) reach the tropopause, independent of the eruption latitude.
6) As water depth exceeds the limit for which overpressured vents occur (Ze ≳ 5 vent diameters in our Reference scenario), the magmatic heat budget becomes exhausted, gas phases condense, and water in the jet approaches 100% liquid. Such events may still generate subaerial jets and steam plumes, but are unlikely to inject significant quantities of SO2 or ash into the stratosphere. We find that hydrostatic pressures sufficient to suppress choking in the vent are similar to those for which minimal steam (≲ 5 wt% of the jet water phase) breaches the surface of the external water layer.
7) Fine ash production by quench fragmentation leads to an approximately 2-fold increase in the mass flux of fine ash (
8) The total ash surface area available for chemical absorption of SO2 systematically increases in hydrovolcanic scenarios relative to control cases. However, the total surface area generated is sensitive to processes governing particle fallout and to the physics of quench fragmentation (e.g., particle roughness and surface fracture energy, and the fraction of thermal energy consumed for fragmenting particles). We suggest that the high water and fine ash content and colder temperature of hydrovolcanic columns provide conditions that enhance scavenging of SO2 by ash and hydrometeors relative to subaerial eruptions (Schmauss and Keppler, 2014).
The above results are consistent with expectations for conduit ascent in submarine and subglacial eruptions (Wallace et al., 2015; Smellie and Edwards, 2016), and for the rise of hydrovolcanic eruption columns in the atmosphere (Koyaguchi and Woods, 1996; Mastin, 2007b). Furthermore, increasing water depths or ice thicknesses beyond threshold conditions for choked flows at the vent will lead to governing physical processes not included in our model that further act to reduce or prevent stratospheric injections of ash and volatiles (e.g. Gudmundsson et al., 2004; Manga et al., 2018). On the basis of these arguments, we hypothesize that hydrovolcanic eruptions will, on average, tend towards reduced stratospheric loading and residence times of sulfate aerosols relative to purely magmatic eruptions. To the extent that volcanic aerosol radiative forcing is governed by the stratospheric load and injection altitude of SO2, H2O, and ash, hydrovolcanism will reduce the overall climate impact. Thus, depending on the distributions of water and ice sheets on the Earth’s surface, hydrovolcanism could, in principle, modulate putative volcano-climate feedbacks associated with large scale glacial unloading and associated changes in crustal stress regimes (e.g. Jellinek et al., 2004; Huybers and Langmuir, 2009; Sigmundsson et al., 2010; Cooper et al., 2018). In particular, crustal loading or unloading of water and ice may influence volcano-climate forcing both by locally altering eruption frequency as well as the extent to which eruptions are dominated by MWI processes. Evaluating the climate impacts of hydrovolcanic eruptions relative to purely magmatic eruptions requires further detailed analysis of the interplay between the coupled processes of conduit ascent and gas exsolution, fragmentation mechanisms, and the fluid dynamics, microphysics, and chemistry of transport and dispersal of SO2, ash, and water in eruption columns.
Data Availability Statement
Complete model output for each of the simulation scenarios presented here (see Table 2) are available at https://doi.org/10.6084/m9.figshare.19243230.v1.
Author Contributions
CR was the primary study author, and performed the bulk of code development for the coupled model, including novel components. CR performed data analysis and the bulk of manuscript writing. AJ was the primary investigator and holder of funding sources, and provided physical insight for the development of model equations and extensive discussion and review of the study results, interpretations, and manuscript writing. SH is the author of the conduit model and provided relevant code with modifications necessary for this study, and provided code examples and physical insight for the development of the water-entrainment model, and authored the conduit model components of the manuscript methods section. TA provided code for the eruption column model and analysis for estimates of stratospheric injection of sulfur dioxide, and provided advice and oversight of data analysis related to eruption column components of the study.
Funding
CR and AJ were funded through an NSERC Discovery Grant to AJ. SH was supported by NSF Grant EAR-1348072 to Helge Gonnermann. TA acknowledges support from the European Union’s Horizon 2020 research and innovation program under the Marie Sklodowska-Curie grant agreement No. 835939, and from the Sidney Sussex college through a Junior Research Fellowship.
Conflict of Interest
The authors declare that the research was conducted in the absence of any commercial or financial relationships that could be construed as a potential conflict of interest.
Publisher’s Note
All claims expressed in this article are solely those of the authors and do not necessarily represent those of their affiliated organizations, or those of the publisher, the editors and the reviewers. Any product that may be evaluated in this article, or claim that may be made by its manufacturer, is not guaranteed or endorsed by the publisher.
Acknowledgments
This research benefited from conversations and insight provided by Josef Dufek, Erin Fitch, Helge Gonnermann, Gary Glatzmaier and Thomas Jones. We would like to thank Ingo Sonder, Magnús T. Guðmundsson, and Steve Self for their thoughtful reviews and comments, which greatly improved the manuscript.
Supplementary Material
The Supplementary Material for this article can be found online at: https://www.frontiersin.org/articles/10.3389/feart.2022.788294/full#supplementary-material
References
Albino, F., Pinel, V., and Sigmundsson, F. (2010). Influence of Surface Load Variations on Eruption Likelihood: Application to Two Icelandic Subglacial Volcanoes, Grímsvötn and Katla. Geophys. J. Int. 181, 1510–1524. doi:10.1111/j.1365-246X.2010.04603.x
Ansmann, A., Tesche, M., Seifert, P., Groß, S., Freudenthaler, V., Apituley, A., et al. (2011). Ash and fine-mode Particle Mass Profiles from EARLINET-AERONET Observations over central Europe after the Eruptions of the Eyjafjallajökull Volcano in 2010. J. Geophys. Res. Atmospheres 116, D00U02. doi:10.1029/2010JD015567
Aravena, A., Vitturi, M. d. M., Cioni, R., and Neri, A. (2018). Physical Constraints for Effective Magma-Water Interaction along Volcanic Conduits during Silicic Explosive Eruptions. Geology 46, 867–870. doi:10.1130/G45065.1
Aubry, T. J., Cerminara, M., and Jellinek, A. M. (2019). Impacts of Climate Change on Volcanic Stratospheric Injections: Comparison of 1-D and 3-D Plume Model Projections. Geophys. Res. Lett. 46. doi:10.1029/2019GL083975
Aubry, T. J., Engwell, S., Bonadonna, C., Carazzo, G., Scollo, S., Van Eaton, A. R., et al. (2021a). The Independent Volcanic Eruption Source Parameter Archive (IVESPA, Version 1.0): A New Observational Database to Support Explosive Eruptive Column Model Validation and Development. J. Volcanology Geothermal Res. 417, 107295. doi:10.1016/j.jvolgeores.2021.107295
Aubry, T. J., Jellinek, A. M., Degruyter, W., Bonadonna, C., Radić, V., Clyne, M., et al. (2016). Impact of Global Warming on the Rise of Volcanic Plumes and Implications for Future Volcanic Aerosol Forcing. J. Geophys. Res. Atmospheres 121, 2016JD025405. doi:10.1002/2016JD025405
Aubry, T. J., and Jellinek, A. M. (2018). New Insights on Entrainment and Condensation in Volcanic Plumes: Constraints from Independent Observations of Explosive Eruptions and Implications for Assessing Their Impacts. Earth Planet. Sci. Lett. 490, 132–142. doi:10.1016/j.epsl.2018.03.028
Aubry, T. J., Staunton-Sykes, J., Marshall, L. R., Haywood, J., Abraham, N. L., and Schmidt, A. (2021b). Climate Change Modulates the Stratospheric Volcanic Sulfate Aerosol Lifecycle and Radiative Forcing from Tropical Eruptions. Nat. Commun. 12, 4708. doi:10.1038/s41467-021-24943-7
Baldini, J. U. L., Brown, R. J., and McElwaine, J. N. (2015). Was Millennial Scale Climate Change during the Last Glacial Triggered by Explosive Volcanism? Scientific Rep. 5, 17442. doi:10.1038/srep17442
Barberi, F., Cioni, R., Rosi, M., Santacroce, R., Sbrana, A., and Vecci, R. (1989). Magmatic and Phreatomagmatic Phases in Explosive Eruptions of Vesuvius as Deduced by Grain-Size and Component Analysis of the Pyroclastic Deposits. J. Volcanology Geothermal Res. 38, 287–307. doi:10.1016/0377-0273(89)90044-9
Bercovici, D., and Michaut, C. (2010). Two-phase Dynamics of Volcanic Eruptions: Compaction, Compression and the Conditions for Choking. Geophys. J. Int. 182, 843–864. doi:10.1111/j.1365-246X.2010.04674.x
Bluth, G. J. S., Rose, W. I., Sprod, I. E., and Krueger, A. J. (1997). Stratospheric Loading of Sulfur from Explosive Volcanic Eruptions. J. Geology. 105, 671–684. doi:10.1086/515972
Bonadonna, C., Ernst, G. G. J., and Sparks, R. S. J. (1998). Thickness Variations and Volume Estimates of Tephra Fall Deposits: The Importance of Particle Reynolds Number. J. Volcanology Geothermal Res. 81, 173–187. doi:10.1016/S0377-0273(98)00007-9
Bouhifd, M. A., Whittington, A. G., and Richet, P. (2015). Densities and Volumes of Hydrous Silicate Melts: New Measurements and Predictions. Chem. Geology. 418, 40–50. doi:10.1016/j.chemgeo.2015.01.012
Brown, R. J., Bonadonna, C., and Durant, A. J. (2012). A Review of Volcanic Ash Aggregation. Phys. Chem. Earth, Parts A/B/C 45-46, 65–78. doi:10.1016/j.pce.2011.11.001
Bursik, M. I., Sparks, R. S. J., Gilbert, J. S., and Carey, S. N. (1992). Sedimentation of Tephra by Volcanic Plumes: I. Theory and its Comparison with a Study of the Fogo A Plinian deposit, Sao Miguel (Azores). Bull. Volcanology 54, 329–344. doi:10.1007/BF00301486
Büttner, R., Dellino, P., Raue, H., Sonder, I., and Zimanowski, B. (2006). Stress-induced Brittle Fragmentation of Magmatic Melts: Theory and Experiments. J. Geophys. Res. Solid Earth 111. doi:10.1029/2005JB003958
Büttner, R., Dellino, P., Volpe, L. L., Lorenz, V., and Zimanowski, B. (2002). Thermohydraulic Explosions in Phreatomagmatic Eruptions as Evidenced by the Comparison between Pyroclasts and Products from Molten Fuel Coolant Interaction Experiments. J. Geophys. Res. Solid Earth 107, ECV 5–1–ECV 5–14. doi:10.1029/2001JB000511
Cahalan, R. C., and Dufek, J. (2021). Explosive Submarine Eruptions: The Role of Condensable Gas Jets in Underwater Eruptions. J. Geophys. Res. Solid Earth 126, e2020JB020969. doi:10.1029/2020JB020969
Campagnola, S., Romano, C., Mastin, L. G., and Vona, A. (2016). Confort 15 Model of Conduit Dynamics: Applications to Pantelleria Green Tuff and Etna 122 BC Eruptions. Contrib. Mineralogy Petrology 171, 60. doi:10.1007/s00410-016-1265-5
Capra, L. (2006). Abrupt Climatic Changes as Triggering Mechanisms of Massive Volcanic Collapses. J. Volcanology Geothermal Res. 155, 329–333. doi:10.1016/j.jvolgeores.2006.04.009
Carazzo, G., and Jellinek, A. M. (2012). A New View of the Dynamics, Stability and Longevity of Volcanic Clouds. Earth Planet. Sci. Lett. 325 (326), 39–51. doi:10.1016/j.epsl.2012.01.025
Carazzo, G., and Jellinek, A. M. (2013). Particle Sedimentation and Diffusive Convection in Volcanic Ash-Clouds. J. Geophys. Res. Solid Earth 118, 1420–1437. doi:10.1002/jgrb.50155
Carazzo, G., Kaminski, E., and Tait, S. (2008). On the Rise of Turbulent Plumes: Quantitative Effects of Variable Entrainment for Submarine Hydrothermal Vents, Terrestrial and Extra Terrestrial Explosive Volcanism. J GEOPHYSICAL RESEARCH 113, B09201. doi:10.1029/2007jb005458
Carazzo, G., Kaminski, E., and Tait, S. (2006). The Route to Self-Similarity in Turbulent Jets and Plumes. J. Fluid Mech. 547, 137–148. doi:10.1017/S002211200500683X
Carey, R. J., Houghton, B. F., and Thordarson, T. (2009). Abrupt Shifts between Wet and Dry Phases of the 1875 Eruption of Askja Volcano: Microscopic Evidence for Macroscopic Dynamics. J. Volcanology Geothermal Res. 184, 256–270. doi:10.1016/j.jvolgeores.2009.04.003
Cas, R. A. F., and Simmons, J. M. (2018). Why Deep-Water Eruptions Are So Different from Subaerial Eruptions. Front. Earth Sci. 6. doi:10.3389/feart.2018.00198
Cas, R., and Wright, J. (1987). Volcanic Successions Modern and Ancient: A Geological Approach to Processes, Products and Successions. Springer Science & Business Media.
Cerminara, M., Esposti Ongaro, T., and Berselli, L. C. (2016). ASHEE-1.0: A Compressible, Equilibrium–Eulerian Model for Volcanic Ash Plumes. Geoscientific Model. Development 9, 697–730. doi:10.5194/gmd-9-697-2016
Cole, P. D., Queiroz, G., Wallenstein, N., Gaspar, J. L., Duncan, A. M., and Guest, J. E. (1995). An Historic Subplinian/phreatomagmatic Eruption: The 1630 AD Eruption of Furnas Volcano, Sa˜ O Miguel, Azores. J. Volcanology Geothermal Res. 69, 117–135. doi:10.1016/0377-0273(95)00033-X
Colucci, S., de’ Michieli Vitturi, M., Neri, A., and Palladino, D. M. (2014). An Integrated Model of Magma Chamber, Conduit and Column for the Analysis of Sustained Explosive Eruptions. Earth Planet. Sci. Lett. 404, 98–110. doi:10.1016/j.epsl.2014.07.034
Cooper, C. L., Swindles, G. T., Savov, I. P., Schmidt, A., and Bacon, K. L. (2018). Evaluating the Relationship between Climate Change and Volcanism. Earth-Science Rev. 177, 238–247. doi:10.1016/j.earscirev.2017.11.009
Costa, A., Pioli, L., and Bonadonna, C. (2016). Assessing Tephra Total Grain-Size Distribution: Insights from Field Data Analysis. Earth Planet. Sci. Lett. 443, 90–107. doi:10.1016/j.epsl.2016.02.040
de’ Michieli Vitturi, M., and Aravena, Á. (2021). “Chapter 6 - Numerical Modeling of Magma Ascent Dynamics,” in Forecasting and Planning for Volcanic Hazards, Risks, and Disasters. Editor P. Papale (Elsevier), 239–284. doi:10.1016/B978-0-12-818082-2.00006-8
Degruyter, W., and Bonadonna, C. (2013). Impact of Wind on the Condition for Column Collapse of Volcanic Plumes. Earth Planet. Sci. Lett. 377–378, 218–226. doi:10.1016/j.epsl.2013.06.041
Degruyter, W., and Bonadonna, C. (2012). Improving on Mass Flow Rate Estimates of Volcanic Eruptions. Geophys. Res. Lett. 39. doi:10.1029/2012GL052566
Dingwell, D. B. (1998). The Glass Transition in Hydrous Granitic Melts. Phys. Earth Planet. Interiors 107, 1–8. doi:10.1016/S0031-9201(97)00119-2
Dufek, J., Manga, M., and Staedter, M. (2007). Littoral Blasts: Pumice-Water Heat Transfer and the Conditions for Steam Explosions when Pyroclastic Flows Enter the Ocean. J. Geophys. Res. Solid Earth 112, B11201. doi:10.1029/2006JB004910
Durant, A. J., Rose, W. I., Sarna-Wojcicki, A. M., Carey, S., and Volentik, A. C. M. (2009). Hydrometeor-enhanced Tephra Sedimentation: Constraints from the 18 May 1980 Eruption of Mount St. Helens. J. Geophys. Res. Solid Earth 114. doi:10.1029/2008JB005756
Dürig, T., Sonder, I., Zimanowski, B., Beyrichen, H., and Büttner, R. (2012). Generation of Volcanic Ash by Basaltic Volcanism. J. Geophys. Res. Solid Earth 117. doi:10.1029/2011JB008628
Dürig, T., White, J. D. L., Murch, A. P., Zimanowski, B., Büttner, R., Mele, D., et al. (2020a). Deep-sea Eruptions Boosted by Induced Fuel–Coolant Explosions. Nat. Geosci. 13, 498–503. doi:10.1038/s41561-020-0603-4
Dürig, T., White, J. D. L., Zimanowski, B., Büttner, R., Murch, A., and Carey, R. J. (2020b). Deep-sea Fragmentation Style of Havre Revealed by Dendrogrammatic Analyses of Particle Morphometry. Bull. Volcanology 82, 67. doi:10.1007/s00445-020-01408-1
Elsworth, D., Voight, B., Thompson, G., and Young, S. (2004). Thermal-hydrologic Mechanism for Rainfall-Triggered Collapse of Lava Domes. Geology 32, 969–972. doi:10.1130/G20730.1
Farquharson, J. I., and Amelung, F. (2020). Extreme Rainfall Triggered the 2018 Rift Eruption at Kīlauea Volcano. Nature 580, 491–495. doi:10.1038/s41586-020-2172-5
Fasullo, J. T., Tomas, R., Stevenson, S., Otto-Bliesner, B., Brady, E., and Wahl, E. (2017). The Amplifying Influence of Increased Ocean Stratification on a Future Year without a Summer. Nat. Commun. 8, 1236. doi:10.1038/s41467-017-01302-z
Fee, D., Lyons, J., Haney, M., Wech, A., Waythomas, C., Diefenbach, A. K., et al. (2020). Seismo-acoustic Evidence for Vent Drying during Shallow Submarine Eruptions at Bogoslof Volcano, Alaska. Bull. Volcanology 82, 2. doi:10.1007/s00445-019-1326-5
Fitch, E. P., and Fagents, S. A. (2020). Using the Characteristics of Rootless Cone Deposits to Estimate the Energetics of Explosive Lava–Water Interactions. Bull. Volcanology 82, 83. doi:10.1007/s00445-020-01422-3
Gilchrist, J. T., and Jellinek, A. M. (2021). Sediment Waves and the Gravitational Stability of Volcanic Jets. Bull. Volcanology 83, 64. doi:10.1007/s00445-021-01472-1
Giordano, D., Nichols, A. R. L., and Dingwell, D. B. (2005). Glass Transition Temperatures of Natural Hydrous Melts: A Relationship with Shear Viscosity and Implications for the Welding Process. J. Volcanology Geothermal Res. 142, 105–118. doi:10.1016/j.jvolgeores.2004.10.015
Girault, F., Carazzo, G., Tait, S., Ferrucci, F., and Kaminski, É. (2014). The Effect of Total Grain-Size Distribution on the Dynamics of Turbulent Volcanic Plumes. Earth Planet. Sci. Lett. 394, 124–134. doi:10.1016/j.epsl.2014.03.021
Girault, F., Carazzo, G., Tait, S., and Kaminski, E. (2016). Combined Effects of Total Grain-Size Distribution and Crosswind on the Rise of Eruptive Volcanic Columns. J. Volcanology Geothermal Res. 326, 103–113. doi:10.1016/j.jvolgeores.2015.11.007
Glaze, L. S., Baloga, S. M., and Wilson, L. (1997). Transport of Atmospheric Water Vapor by Volcanic Eruption Columns. J. Geophys. Res. Atmospheres 102, 6099–6108. doi:10.1029/96JD03125
Gonnermann, H. M. (2015). Magma Fragmentation. Annu. Rev. Earth Planet. Sci. 43, 431–458. doi:10.1146/annurev-earth-060614-105206
Gonnermann, H. M., and Manga, M. (2013). “Dynamics of Magma Ascent in the Volcanic Conduit,” in Modeling Volcanic Processes: The Physics and Mathematics of Volcanism. Editors R. M. C. Lopes, S. A. Fagents, and T. K. P. Gregg (Cambridge: Cambridge University Press), 55–84. doi:10.1017/CBO9781139021562.004
Gonnermann, H. M., and Manga, M. (2007). The Fluid Mechanics inside a Volcano. Annu. Rev. Fluid Mech. 39, 321–356. doi:10.1146/annurev.fluid.39.050905.110207
Green, D. N., Evers, L. G., Fee, D., Matoza, R. S., Snellen, M., Smets, P., et al. (2013). Hydroacoustic, Infrasonic and Seismic Monitoring of the Submarine Eruptive Activity and Sub-aerial Plume Generation at South Sarigan, May 2010. J. Volcanology Geothermal Res. 257, 31–43. doi:10.1016/j.jvolgeores.2013.03.006
Gudmundsson, M. T., Pálsson, F., Thordarson, T., Hoskuldsson, A., Larsen, G., Hognadottir, T., et al. (2014). Water/magma Mass Fractions in Phreatomagmatic Eruption Plumes - Constraints from the Grímsvötn 2011 Eruption. AGU Fall Meet. Abstr. 11, V11B–V4718.
Gudmundsson, M. T., Sigmundsson, F., Björnsson, H., and Högnadóttir, T. (2004). The 1996 Eruption at Gjálp, Vatnajökull Ice Cap, Iceland: Efficiency of Heat Transfer, Ice Deformation and Subglacial Water Pressure. Bull. Volcanology 66, 46–65. doi:10.1007/s00445-003-0295-9
Gudmundsson, M. T., Thordarson, T., Höskuldsson, Á., Larsen, G., Björnsson, H., Prata, F. J., et al. (2012). Ash Generation and Distribution from the April-May 2010 Eruption of Eyjafjallajökull, Iceland. Scientific Rep. 2, 572. doi:10.1038/srep00572
Hajimirza, S., Gonnermann, H. M., Gardner, J. E., and Giachetti, T. (2019). Predicting Homogeneous Bubble Nucleation in Rhyolite. J. Geophys. Res. Solid Earth 124, 2395–2416. doi:10.1029/2018JB015891
Hajimirza, S., Gonnermann, H. M., and Gardner, J. E. (2021). Reconciling Bubble Nucleation in Explosive Eruptions with Geospeedometers. Nat. Commun. 12, 283. doi:10.1038/s41467-020-20541-1
Hajimirza, S., Jones, T. J., Moreland, W. M., Gonnermann, H. M., and Thordarson, T. R. (2022). Impacts of Climate Change on Volcanic Stratospheric Injections: Comparison of 1-D and 3-D Plume Model Projections. Geochem. Geophys. Geosystems 23, e2021GC010160. doi:10.1029/2021GC010160
Hersbach, H., Bell, B., Berrisford, P., Hirahara, S., Horányi, A., Muñoz-Sabater, J., et al. (2020). The ERA5 Global Reanalysis. Q. J. R. Meteorol. Soc. 146, 1999–2049. doi:10.1002/qj.3803
Holloway, J. R. (1977). “Fugacity and Activity of Molecular Species in Supercritical Fluids,” in Thermodynamics in Geology. Editor D. G. Fraser (Dordrecht: Springer Netherlands), NATO Advanced Study Institutes Series), 161–181. doi:10.1007/978-94-010-1252-2_9
Houghton, B., and Carey, R. J. (2015). “Chapter 34 - Pyroclastic Fall Deposits,” in The Encyclopedia of Volcanoes. Editor H. Sigurdsson. Second Edition (Amsterdam: Academic Press), 599–616. doi:10.1016/B978-0-12-385938-9.00034-1
Houghton, B. F., and Carey, R. J. (2019). Physical Constraints for Effective Magma-Water Interaction along Volcanic Conduits Silicic Explosive Eruptions: COMMENT. Geology 47, e461. doi:10.1130/G46200Y.110.1130/g46033c.1
Houghton, B. F., and Wilson, C. J. N. (1989). A Vesicularity index for Pyroclastic Deposits. Bull. Volcanology 51, 451–462. doi:10.1007/BF01078811
Houghton, B., White, J. D. L., and Van Eaton, A. R. (2015). “Chapter 30 - Phreatomagmatic and Related Eruption Styles,” in The Encyclopedia of Volcanoes. Editor H. Sigurdsson. Second Edition (Amsterdam: Academic Press), 537–552. doi:10.1016/B978-0-12-385938-9.00030-4
Huybers, P., and Langmuir, C. (2009). Feedback between Deglaciation, Volcanism, and Atmospheric CO2. Earth Planet. Sci. Lett. 286, 479–491. doi:10.1016/j.epsl.2009.07.014
Jellinek, A. M., Manga, M., and Saar, M. O. (2004). Did Melting Glaciers Cause Volcanic Eruptions in Eastern California? Probing the Mechanics of dike Formation. J. Geophys. Res. Solid Earth 109. doi:10.1029/2004JB002978
Jones, T., Gonnermann, H., Moreland, W., and Thordarson, T. (2019). Quantifying Water Entrainment in Volcanic Jets. Geophys. Res. Abstr. 21, 1.
Joshi, M. M., and Jones, G. S. (2009). The Climatic Effects of the Direct Injection of Water Vapour into the Stratosphere by Large Volcanic Eruptions. Atmos. Chem. Phys. 9 (16), 6109–6118. doi:10.5194/acp-9-6109-2009
Jull, M., and McKenzie, D. (1996). The Effect of Deglaciation on Mantle Melting beneath Iceland. J. Geophys. Res. Solid Earth 101, 21815–21828. doi:10.1029/96JB01308
Junglas, P. (2009). Implementation of the IAPWS-95 Standard for Use in Thermodynamics Lectures. Int. J. Eng. Education 25, 3–10.
Kaminski, E., and Jaupart, C. (1998). The Size Distribution of Pyroclasts and the Fragmentation Sequence in Explosive Volcanic Eruptions. J. Geophys. Res. Solid Earth 103, 29759–29779. doi:10.1029/98JB02795
Kaminski, E., Tait, S., and Carazzo, G. (2005). Turbulent Entrainment in Jets with Arbitrary Buoyancy. J. Fluid Mech. 526, 361–376. doi:10.1017/S0022112004003209
Kokelaar, P. (1986). Magma-water Interactions in Subaqueous and Emergent Basaltic. Bull. Volcanology 48, 275–289. doi:10.1007/BF01081756
Kotsovinos, N. E. (2000). Axisymmetric Submerged Intrusion in Stratified Fluid. J. Hydraulic Eng. 126, 466–456. doi:10.1061/(ASCE)0733-942910.1061/(asce)0733-9429(2000)126:6(446)
Koyaguchi, T. (2005). An Analytical Study for 1-dimensional Steady Flow in Volcanic Conduits. J. Volcanology Geothermal Res. 143, 29–52. doi:10.1016/j.jvolgeores.2004.09.009
Koyaguchi, T., and Woods, A. W. (1996). On the Formation of Eruption Columns Following Explosive Mixing of Magma and Surface-Water. J. Geophys. Res. Solid Earth 101, 5561–5574. doi:10.1029/95JB01687
Kremser, S., Thomason, L. W., von Hobe, M., Hermann, M., Deshler, T., Timmreck, C., et al. (2016). Stratospheric Aerosol-Observations, Processes, and Impact on Climate: Stratospheric Aerosol. Rev. Geophys. 54, 278–335. doi:10.1002/2015RG000511
Krishnamohan, K.-P. S.-P., Bala, G., Cao, L., Duan, L., and Caldeira, K. (2019). Climate System Response to Stratospheric Sulfate Aerosols: Sensitivity to Altitude of Aerosol Layer. Earth Syst. Dyn. 10, 885–900. doi:10.5194/esd-10-885-2019
Lacis, A. (2015). Volcanic Aerosol Radiative Properties. Past Glob. Change Mag. 23, 50–51. doi:10.22498/pages.23.2.50
Lee, C.-T., and Dee, S. (2019). Does Volcanism Cause Warming or Cooling? Geology 47, 687–688. doi:10.1130/focus072019.1
LeGrande, A. N., Tsigaridis, K., and Bauer, S. E. (2016). Role of Atmospheric Chemistry in the Climate Impacts of Stratospheric Volcanic Injections. Nat. Geosci. 9, 652–655. doi:10.1038/ngeo2771
Lherm, V., and Jellinek, A. M. (2019). Experimental Constraints on the Distinct Effects of Ash, Lapilli, and Larger Pyroclasts on Entrainment and Mixing in Volcanic Plumes. Bull. Volcanology 81, 73. doi:10.1007/s00445-019-1329-2
Linden, P. F. (1979). Mixing in Stratified Fluids. Geophys. Astrophysical Fluid Dyn. 13, 3–23. doi:10.1080/03091927908243758
Liu, E. J., Cashman, K. V., Rust, A. C., and Gislason, S. R. (2015). The Role of Bubbles in Generating fine Ash during Hydromagmatic Eruptions. Geology 43, 239–242. doi:10.1130/G36336.1
Liu, E. J., Cashman, K. V., Rust, A. C., and Höskuldsson, A. (2017). Contrasting Mechanisms of Magma Fragmentation during Coeval Magmatic and Hydromagmatic Activity: The Hverfjall Fires Fissure Eruption, Iceland. Bull. Volcanology 79, 68. doi:10.1007/s00445-017-1150-8
Liu, E. J. (2016). The Generation of Volcanic Ash during Basaltic Hydromagmatic Eruptions : From Fragmentation to Resuspension. Ph.D. thesis. Bristol, England: University of Bristol.
Liu, Y., Zhang, Y., and Behrens, H. (2005). Solubility of H2O in Rhyolitic Melts at Low Pressures and a New Empirical Model for Mixed H2O–CO2 Solubility in Rhyolitic Melts. J. Volcanology Geothermal Res. 143, 219–235. doi:10.1016/j.jvolgeores.2004.09.019
Lyons, J. J., Haney, M. M., Fee, D., Wech, A. G., and Waythomas, C. F. (2019). Infrasound from Giant Bubbles during Explosive Submarine Eruptions. Nat. Geosci. 12, 952–958. doi:10.1038/s41561-019-0461-0
Magnússon, E., Gudmundsson, M. T., Roberts, M. J., Sigurðsson, G., Höskuldsson, F., and Oddsson, B. (2012). Ice-volcano Interactions during the 2010 Eyjafjallajökull Eruption, as Revealed by Airborne Imaging Radar. J. Geophys. Res. Solid Earth 117. doi:10.1029/2012JB009250
Manga, M., Fauria, K. E., Lin, C., Mitchell, S. J., Jones, M., Conway, C. E., et al. (2018). The Pumice Raft-Forming 2012 Havre Submarine Eruption Was Effusive. Earth Planet. Sci. Lett. 489, 49–58. doi:10.1016/j.epsl.2018.02.025
Mann, M. E., Steinman, B. A., Brouillette, D. J., and Miller, S. K. (2021). Multidecadal Climate Oscillations during the Past Millennium Driven by Volcanic Forcing. Science 371, 1014–1019. doi:10.1126/science.abc5810
Manzella, I., Bonadonna, C., Phillips, J. C., and Monnard, H. (2015). The Role of Gravitational Instabilities in Deposition of Volcanic Ash. Geology 43, 211–214. doi:10.1130/G36252.1
Marshall, L., Johnson, J. S., Mann, G. W., Lee, L., Dhomse, S. S., Regayre, L., et al. (2019). Exploring How Eruption Source Parameters Affect Volcanic Radiative Forcing Using Statistical Emulation. J. Geophys. Res. Atmospheres 124, 964–985. doi:10.1029/2018JD028675
Massol, H., and Koyaguchi, T. (2005). The Effect of Magma Flow on Nucleation of Gas Bubbles in a Volcanic Conduit. J. Volcanology Geothermal Res. 143, 69–88. doi:10.1016/j.jvolgeores.2004.09.011
Mastin, L. G. (2007b). A User-Friendly One-Dimensional Model for Wet Volcanic Plumes. Geochem. Geophys. Geosystems 8. doi:10.1029/2006GC001455
Mastin, L. G. (2007a). Generation of fine Hydromagmatic Ash by Growth and Disintegration of Glassy Rinds. J. Geophys. Res. Solid Earth 112. doi:10.1029/2005JB003883
Mastin, L. G., and Ghiorso, M. S. (2000). A Numerical Program for Steady-State Flow of Magma-Gas Mixtures through Vertical Eruptive Conduits. Tech. rep. Washington, DC: Department of the Interior.
Mastin, L. G., and Witter, J. B. (2000). The Hazards of Eruptions through Lakes and Seawater. J. Volcanology Geothermal Res. 97, 195–214. doi:10.1016/S0377-0273(99)00174-2
McGimsey, R. G., Neal, C. A., Searcy, C. K., Camacho, J. T., Aydlett, W. B., Embley, R. W., et al. (2010). The May 2010 Submarine Eruption from South Sarigan Seamount, Northern Mariana Islands 2010, T11E–07 07M.
Michaut, C., Ricard, Y., Bercovici, D., and Sparks, R. S. J. (2013). Eruption Cyclicity at Silicic Volcanoes Potentially Caused by Magmatic Gas Waves. Nat. Geosci. 6, 856–860. doi:10.1038/ngeo1928
Moitra, P., Sonder, I., and Valentine, G. A. (2020). The Role of External Water on Rapid Cooling and Fragmentation of Magma. Earth Planet. Sci. Lett. 537, 116194. doi:10.1016/j.epsl.2020.116194
Moreland, W. (2017). Explosive Activity in Flood Lava Eruptions: A Case Study of the 10th Century Eldgjá Eruption, Iceland. Ph.D. thesis. Reykjavík, Iceland: University of Iceland, School of Engineering and Natural Sciences, Faculty of Earth Sciences.
Moreland, W. M., Thordarson, T., Houghton, B. F., and Larsen, G. (2019). Driving Mechanisms of Subaerial and Subglacial Explosive Episodes during the 10th century Eldgjá Fissure Eruption, Southern Iceland. Volcanica 2, 129–150. doi:10.30909/vol.02.02.129150
Morton, B. R., Taylor, G. I., and Turner, J. S. (1956). Turbulent Gravitational Convection from Maintained and Instantaneous Sources. Proc. R. Soc. Lond. Ser. A. Math. Phys. Sci. 234, 1–23. doi:10.1098/rspa.1956.0011
Murch, A. P., White, J. D. L., and Carey, R. J. (2019). Characteristics and Deposit Stratigraphy of Submarine-Erupted Silicic Ash, Havre Volcano, Kermadec Arc, New Zealand. Front. Earth Sci. 7, 1. doi:10.3389/feart.2019.00001
Nelson, C. S., and Lister, G. S. (1995). Surficial Bottom Sediments of Lake Taupo, New Zealand: Texture, Composition, Provenance, and Sedimentation Rates. New Zealand J. Geology. Geophys. 38, 61–79. doi:10.1080/00288306.1995.9514639
Neri, A., Di Muro, A., and Rosi, M. (2002). Mass Partition during Collapsing and Transitional Columns by Using Numerical Simulations. J. Volcanology Geothermal Res. 115, 1–18. doi:10.1016/S0377-0273(01)00304-3
Niemeier, U., Timmreck, C., Graf, H.-F., Kinne, S., Rast, S., and Self, S. (2009). Initial Fate of fine Ash and Sulfur from Large Volcanic Eruptions. Atmos. Chem. Phys. 9, 9043–9057. doi:10.5194/acp-9-9043-2009
Ogden, D. E., Wohletz, K. H., Glatzmaier, G. A., and Brodsky, E. E. (2008). Numerical Simulations of Volcanic Jets: Importance of Vent Overpressure. J. Geophys. Res. Solid Earth 113, B02204. doi:10.1029/2007JB005133
Papale, P. (1999). Strain-induced Magma Fragmentation in Explosive Eruptions. Nature 397, 425–428. doi:10.1038/17109
Patel, A., Manga, M., Carey, R. J., and Degruyter, W. (2013). Effects of thermal Quenching on Mechanical Properties of Pyroclasts. J. Volcanology Geothermal Res. 258, 24–30. doi:10.1016/j.jvolgeores.2013.04.001
Prata, F., Woodhouse, M., Huppert, H. E., Prata, A., Thordarson, T., and Carn, S. (2017). Atmospheric Processes Affecting the Separation of Volcanic Ash and SO2 in Volcanic Eruptions: Inferences from the May 2011 Grímsvötn Eruption. Atmos. Chem. Phys. 17, 10709–10732. doi:10.5194/acp-17-10709-2017
Robock, A. (2000). Volcanic Eruptions and Climate. Rev. Geophys. 38, 191–219. doi:10.1029/1998RG000054
Rose, W. I., Bluth, G. J. S., Schneider, D. J., Ernst, G. G. J., Riley, C. M., Henderson, L. J., et al. (2001). Observations of Volcanic Clouds in Their First Few Days of Atmospheric Residence: The 1992 Eruptions of Crater Peak, Mount Spurr Volcano, Alaska. J. Geology. 109, 677–694. doi:10.1086/323189
Rose, W. I., Delene, D. J., Schneider, D. J., Bluth, G. J. S., Krueger, A. J., Sprod, I., et al. (1995). Ice in the 1994 Rabaul Eruption Cloud: Implications for Volcano hazard and Atmospheric Effects. Nature 375, 477–479. doi:10.1038/375477a0
Rose, W. I. (1977). Scavenging of Volcanic Aerosol by Ash: Atmospheric and Volcanologic Implications. Geology 5, 621–624. doi:10.1130/0091-7613(1977)5<621:SOVABA>2.0.CO;2
Rust, A. C., and Cashman, K. V. (2011). Permeability Controls on Expansion and Size Distributions of Pyroclasts. J. Geophys. Res. Solid Earth 116. doi:10.1029/2011JB008494
Saffaraval, F., and Solovitz, S. A. (2012). Near-exit Flow Physics of a Moderately Overpressured Jet. Phys. Fluids 24, 086101. doi:10.1063/1.4745005
Saffaraval, F., Solovitz, S. A., Ogden, D. E., and Mastin, L. G. (2012). Impact of Reduced Near-Field Entrainment of Overpressured Volcanic Jets on Plume Development. J. Geophys. Res. Solid Earth 117. doi:10.1029/2011JB008862
Santer, B. D., Bonfils, C., Painter, J. F., Zelinka, M. D., Mears, C., Solomon, S., et al. (2014). Volcanic Contribution to Decadal Changes in Tropospheric Temperature. Nat. Geosci. 7, 185–189. doi:10.1038/ngeo2098
Schleussner, C. F., and Feulner, G. (2013). A Volcanically Triggered Regime Shift in the Subpolar North Atlantic Ocean as a Possible Origin of the Little Ice Age. Clim. Past 9, 1321–1330. doi:10.5194/cp-9-1321-2013
Schmauss, D., and Keppler, H. (2014). Adsorption of Sulfur Dioxide on Volcanic Ashes. Am. Mineral. 99, 1085–1094. doi:10.2138/am.2014.4656
Schmid, A., Sonder, I., Seegelken, R., Zimanowski, B., Büttner, R., Gudmundsson, M. T., et al. (2010). Experiments on the Heat Discharge at the Dynamic Magma-Water-Interface. Geophys. Res. Lett. 37. doi:10.1029/2010GL044963
Schmidt, A., Carslaw, K. S., Mann, G. W., Rap, A., Pringle, K. J., Spracklen, D. V., et al. (2012). Importance of Tropospheric Volcanic Aerosol for Indirect Radiative Forcing of Climate. Atmos. Chem. Phys. 12, 7321–7339. doi:10.5194/acp-12-7321-2012
Self, S., and Sparks, R. S. J. (1978). Characteristics of Widespread Pyroclastic Deposits Formed by the Interaction of Silicic Magma and Water. Bull. Volcanologique 41, 196. doi:10.1007/BF02597223
Shea, T. (2017). Bubble Nucleation in Magmas: A Dominantly Heterogeneous Process? J. Volcanology Geothermal Res. 343, 155–170. doi:10.1016/j.jvolgeores.2017.06.025
Sigl, M., Winstrup, M., McConnell, J. R., Welten, K. C., Plunkett, G., Ludlow, F., et al. (2015). Timing and Climate Forcing of Volcanic Eruptions for the Past 2,500 Years. Nature 523, 543–549. doi:10.1038/nature14565
Sigmarsson, O., Haddadi, B., Carn, S., Moune, S., Gudnason, J., Yang, K., et al. (2013). The Sulfur Budget of the 2011 Grímsvötn Eruption, Iceland. Geophys. Res. Lett. 40, 6095–6100. doi:10.1002/2013GL057760
Sigmundsson, F., Pinel, V., Lund, B., Albino, F., Pagli, C., Geirsson, H., et al. (2010). Climate Effects on Volcanism: Influence on Magmatic Systems of Loading and Unloading from Ice Mass Variations, with Examples from Iceland. Philosophical Trans. R. Soc. A: Math. Phys. Eng. Sci. 368, 2519–2534. doi:10.1098/rsta.2010.0042
Smellie, J. L., and Edwards, B. R. (2016). Glaciovolcanism on Earth and Mars. Cambridge University Press.
Solomon, S., Daniel, J. S., Neely, R. R., Vernier, J.-P., Dutton, E. G., and Thomason, L. W. (2011). The Persistently Variable “Background” Stratospheric Aerosol Layer and Global Climate Change. Science 333, 866–870. doi:10.1126/science.1206027
Sonder, I., Schmid, A., Seegelken, R., Zimanowski, B., and Büttner, R. (2011). Heat Source or Heat Sink: What Dominates Behavior of Non-explosive Magma-Water Interaction? J. Geophys. Res. Solid Earth 116. doi:10.1029/2011JB008280
Soreghan, G. S., Soreghan, M. J., and Heavens, N. G. (2019). Explosive Volcanism as a Key Driver of the Late Paleozoic Ice Age. Geology 47, 600–604. doi:10.1130/G46349.1
Starostin, A. B., Barmin, A. A., and Melnik, O. E. (2005). A Transient Model for Explosive and Phreatomagmatic Eruptions. J. Volcanology Geothermal Res. 143, 133–151. doi:10.1016/j.jvolgeores.2004.09.014
Staunton-Sykes, J., Aubry, T. J., Shin, Y. M., Weber, J., Marshall, L. R., Luke Abraham, N., et al. (2021). Co-emission of Volcanic Sulfur and Halogens Amplifies Volcanic Effective Radiative Forcing. Atmos. Chem. Phys. 21, 9009–9029. doi:10.5194/acp-21-9009-2021
Telling, J., Dufek, J., and Shaikh, A. (2013). Ash Aggregation in Explosive Volcanic Eruptions. Geophys. Res. Lett. 40, 2355–2360. doi:10.1002/grl.50376
Textor, C., Graf, H.-F., Herzog, M., and Oberhuber, J. M. (2003). Injection of Gases into the Stratosphere by Explosive Volcanic Eruptions. J. Geophys. Res. Atmospheres 108, 4606. doi:10.1029/2002JD002987
Timmreck, C. (2012). Modeling the Climatic Effects of Large Explosive Volcanic Eruptions. Wiley Interdiscip. Rev. Clim. Change 3, 545–564. doi:10.1002/wcc.192
Toohey, M., Krüger, K., Schmidt, H., Timmreck, C., Sigl, M., Stoffel, M., et al. (2019). Disproportionately strong Climate Forcing from Extratropical Explosive Volcanic Eruptions. Nat. Geosci. 12, 100. doi:10.1038/s41561-018-0286-2
Toohey, M., Krüger, K., Sigl, M., Stordal, F., and Svensen, H. (2016). Climatic and Societal Impacts of a Volcanic Double Event at the Dawn of the Middle Ages. Climatic Change 136, 401–412. doi:10.1007/s10584-016-1648-7
Turner, J. S. (1986). Turbulent Entrainment: The Development of the Entrainment assumption, and its Application to Geophysical Flows. J. Fluid Mech. 173, 431–471. doi:10.1017/S0022112086001222
Van Eaton, A. R., Herzog, M., Wilson, C. J. N., and McGregor, J. (2012). Ascent Dynamics of Large Phreatomagmatic Eruption Clouds: The Role of Microphysics. J. Geophys. Res. Solid Earth 117, B03203. doi:10.1029/2011JB008892
Van Eaton, A. R., Mastin, L. G., Herzog, M., Schwaiger, H. F., Schneider, D. J., Wallace, K. L., et al. (2015). Hail Formation Triggers Rapid Ash Aggregation in Volcanic Plumes. Nat. Commun. 6, 7860. doi:10.1038/ncomms8860
van Otterloo, J., Cas, R. A. F., and Scutter, C. R. (2015). The Fracture Behaviour of Volcanic Glass and Relevance to Quench Fragmentation during Formation of Hyaloclastite and Phreatomagmatism. Earth-Science Rev. 151, 79–116. doi:10.1016/j.earscirev.2015.10.003
Walker, G. P. L. (1981). Characteristics of Two Phreatoplinian Ashes, and Their Water-Flushed Origin. J. Volcanology Geothermal Res. 9, 395–407. doi:10.1016/0377-0273(81)90046-9
Walker, G. P. L. (1973). Explosive Volcanic Eruptions — a New Classification Scheme. Geologische Rundschau 62, 431–446. doi:10.1007/BF01840108
Wallace, P. J., Plank, T., Edmonds, M., and Hauri, E. H. (2015). “Chapter 7 - Volatiles in Magmas,” in The Encyclopedia of Volcanoes. Editor H. Sigurdsson. Second Edition (Amsterdam: Academic Press), 163–183. doi:10.1016/B978-0-12-385938-9.00007-9
Watt, S. F. L., Pyle, D. M., and Mather, T. A. (2013). The Volcanic Response to Deglaciation: Evidence from Glaciated Arcs and a Reassessment of Global Eruption Records. Earth-Science Rev. 122, 77–102. doi:10.1016/j.earscirev.2013.03.007
Waythomas, C. F., Angeli, K., and Wessels, R. L. (2020). Evolution of the Submarine–Subaerial Edifice of Bogoslof Volcano, Alaska, during its 2016–2017 Eruption Based on Analysis of Satellite Imagery. Bull. Volcanology 82, 21. doi:10.1007/s00445-020-1363-0
Wilson, C. J. N. (2001). The 26.5ka Oruanui Eruption, New Zealand: An Introduction and Overview. J. Volcanology Geothermal Res. 112, 133–174. doi:10.1016/S0377-0273(01)00239-6
Wilson, C. J. N., and Walker, G. P. L. (1985). The Taupo Eruption, New Zealand I. General Aspects. Philosophical Trans. R. Soc. Lond. Ser. A, Math. Phys. Sci. 314, 199–228. doi:10.1098/rsta.1985.0019
Wilson, L., Sparks, R. S. J., and Walker, G. P. L. (1980). Explosive Volcanic Eruptions — IV. The Control of Magma Properties and Conduit Geometry on Eruption Column Behaviour. Geophys. J. Int. 63, 117–148. doi:10.1111/j.1365-246X.1980.tb02613.x
Wohletz, K. (1983). Mechanisms of Hydrovolcanic Pyroclast Formation: Grain-Size, Scanning Electron Microscopy, and Experimental Studies. J. Volcanology Geothermal Res. 17, 31–63. doi:10.1016/0377-0273(83)90061-6
Wohletz, K., Zimanowski, B., and Büttner, R. (2013). “Magma–water Interactions,” in Modeling Volcanic Processes: The Physics and Mathematics of Volcanism (Cambridge: Cambridge University Press). doi:10.1017/CBO9781139021562.011
Woodcock, D. C., Gilbert, J. S., and Lane, S. J. (2012). Particle-water Heat Transfer during Explosive Volcanic Eruptions. J. Geophys. ResearchSolid Earth 117. doi:10.1029/2012JB009240
Woods, A. W., and Bower, S. M. (1995). The Decompression of Volcanic Jets in a Crater during Explosive Volcanic Eruptions. Earth Planet. Sci. Lett. 131, 189–205. doi:10.1016/0012-821X(95)00012-2
Woods, A. W. (2010). Turbulent Plumes in Nature. Annu. Rev. Fluid Mech. 42, 391–412. doi:10.1146/annurev-fluid-121108-145430
Zanchettin, D., Timmreck, C., Bothe, O., Lorenz, S. J., Hegerl, G., Graf, H.-F., et al. (2013). Delayed winter Warming: A Robust Decadal Response to strong Tropical Volcanic Eruptions? Geophys. Res. Lett. 40, 204–209. doi:10.1029/2012GL054403
Zhang, X., Li, S., Yu, D., Yang, B., and Wang, N. (2020). The Evolution of Interfaces for Underwater Supersonic Gas Jets. Water 12, 488. doi:10.3390/w12020488
Zhong, Y., Miller, G. H., Otto-Bliesner, B. L., Holland, M. M., Bailey, D. A., Schneider, D. P., et al. (2011). Centennial-scale Climate Change from Decadally-Paced Explosive Volcanism: A Coupled Sea Ice-Ocean Mechanism. Clim. Dyn. 37, 2373–2387. doi:10.1007/s00382-010-0967-z
Zhu, Y., Toon, O. B., Jensen, E. J., Bardeen, C. G., Mills, M. J., Tolbert, M. A., et al. (2020). Persisting Volcanic Ash Particles Impact Stratospheric SO 2 Lifetime and Aerosol Optical Properties. Nat. Commun. 11, 4526. doi:10.1038/s41467-020-18352-5
Zimanowski, B., Büttner, R., Dellino, P., White, J. D. L., and Wohletz, K. H. (2015). “Chapter 26 - Magma–Water Interaction and Phreatomagmatic Fragmentation,” in The Encyclopedia of Volcanoes. Editor H. Sigurdsson. Second Edition (Amsterdam: Academic Press), 473–484. doi:10.1016/B978-0-12-385938-9.00026-2
Keywords: external forcing, magma-water interactions, explosive eruption, 1-D plume model, stratospheric sulfur input, climate feedback, 1-d conduit flow model, hydrovolcanism
Citation: Rowell CR, Jellinek AM, Hajimirza S and Aubry TJ (2022) External Surface Water Influence on Explosive Eruption Dynamics, With Implications for Stratospheric Sulfur Delivery and Volcano-Climate Feedback. Front. Earth Sci. 10:788294. doi: 10.3389/feart.2022.788294
Received: 02 October 2021; Accepted: 21 February 2022;
Published: 12 April 2022.
Edited by:
Stéphanie Dumont, University of Beira Interior, PortugalReviewed by:
Magnus Tumi Gudmundsson, University of Iceland, IcelandStephen Self, University of California, Berkeley, United States
Ingo Sonder, University at Buffalo, United States
Copyright © 2022 Rowell , Jellinek , Hajimirza and Aubry . This is an open-access article distributed under the terms of the Creative Commons Attribution License (CC BY). The use, distribution or reproduction in other forums is permitted, provided the original author(s) and the copyright owner(s) are credited and that the original publication in this journal is cited, in accordance with accepted academic practice. No use, distribution or reproduction is permitted which does not comply with these terms.
*Correspondence: Colin R. Rowell , Y3Jvd2VsbEBlb2FzLnViYy5jYQ==