- Sinopec Petroleum Exploration and Production Research Institute, Beijing, China
Thermal conductivity is an important macroscopic thermo-physical parameter due to its significant effects on the temperature field distribution and heat flow magnitude in the material at heat conduction equilibrium. However, because of the extremely complex pore structure and disordered pore distribution, a well-accepted relationship between effective thermal conductivity (ETC) and geometric structural parameters is still lack. In this study, a novel fractal model with variation pore diameter is established systematically based on the assumption that the rough elements of wall surface, pore size distribution and capillary tortuosity follow the fractal scaling law. Thermal-electrical analogy is introduced to predict the ETC of unsaturated geothermal media. The proposed model explicitly relates the ETC to the microstructural parameters (relative roughness, porosity, fractal dimensions and radius fluctuation amplitude) and fluid properties. The proposed model is validated by comparing with existing experimental data. A parametric analysis is performed for presenting the effects of the structural parameters and fluid properties on the ETC. The results show that pore structure has significant effect on ETC of unsaturated porous media. ETC gradually decreases with the increment of porosity, relative roughness, and fractal dimensions. The present study improves the accuracy in predicting ETC and sheds light on the heat transfer mechanisms of geothermal media.
1 Introduction
Geothermal energy is a non-carbon source of renewable energy based on heat flux from the sub-surface of the earth, a reliable and abundant energy source with great potential (Manzella et al., 2018; Noorollahi et al., 2019; Soltani et al., 2021). The heat produced in the earth’s mantle is transferred via convection and conduction, of which conduction is the most important process, with an average global output of 1.4 × 10²¹ J/a (100 times the volcanic eruption, earthquake and hydrothermal activity) (Clauser and Huenges, 1995; Mostafa et al., 2004). The heat conduction process in rock depends on its fabric and can be estimated by the physical mechanisms of the basic transport procedures within the distinct phases of rock media and thermal exchange in an interface (Miao T. et al., 2016; Jia et al., 2019). The defining equation for effective thermal conductivity (ETC) is q = -k∇T, where q is the heat flux, k is the effective thermal conductivity, and ∇T is the temperature gradient. This is known as Fourier’s Law for heat conduction (e.g., Cahill, 1990). As ETC is a dominant parameter among all the thermal properties of rock, its accurate and efficient prediction is essential. Therefore, it is very meaningful to conduct some in-depth studies to reveal its essential features.
Previous research demonstrated that ETC of heterogeneous rock medium is not only affected by the intrinsic thermal properties of each fluid phase, but also the complicated relationship between the topology and geometry of pore spaces and solid matrix (Ghanbarian and Daigle, 2016). Extensive research has been conducted on ETC of porous media to characterized heat transport through rock and many predictive methods for ETC have been proposed. The ETC models can be categorized into three groups according to the principles and methods employed: 1) theoretical models, 2) empirical models by experimental measurement, and 3) mathematical models via numerical simulation. The theoretical models have been developed via reasonable simplifications for geometrical structures and transfer mechanisms. Various analytical models have been proposed based on classical mixing laws (Tong et al., 2009; Xia et al., 2019a; Lin et al., 2021). Yang et al. (2016) developed a statistical second-order two-scale method to predict heat transfer properties of inhomogeneous random structures. Whereafter, they established a novel three-scale homogenization algorithm to predict heat transfer performance of porous media with periodic configurations (Yang et al., 2018). However, the existing theoretical models have the problem of low accuracy because the complex pore and solid structures have been ignored. In-situ testing is the most common method to characterized ETC for shallow rocks and many empirical equations for predicting ETC are obtained by regression analysis of experimental data. Gao and Yu (2007) simplified the G-function of the ground source heat pump and calculated the ETC of surrounding ground. Kwon et al. (2011) investigated the influence of mineral composition, porosity, and saturation on the ETC using the transient flat surface source method. Although a large amount of experimental data may be available, the reported results from different experimental approached often differ significantly and cannot reflect the transmission mechanism (Xia et al., 2019b). With the development of computer technology, many numerical methods have been proposed, such as finite element method (Li et al., 2020), Monte Carlo method (Belova and Murch, 2004), and lattice Boltzmann method (Gupta et al., 2006) to evaluate ETC of porous media. However, these empirical ETC models composed of experimental data and mathematical models usually contain one or more empirical constants, sometimes lacking a clear physical meaning.
It has been experimentally shown that porous media have fractal scale characteristics such as random, scale invariance, and self-affine. First proposed by Mandelbrot (1982), fractal geometry exhibits evident advantages for addressing the complexity structure of porous media, compared with Euclidean geometry (Yu, 2008). Therefore, fractal theory has been successfully used to study the ETC of porous media to account for the effect of microstructure. Yu and Cheng (2002a) proposed a fractal particle chain model for ETC of double dispersion porous media by fractal and thermal-electrical analogy theory. However, scale length of the porous media should be estimated, which can cause inaccuracy. Jin et al. (2016) utilized the self-similar Sierpinski carpet to model the pore structure of autoclaved aerated concrete and built a two-phase fractal model to predict ETC. Miao T. J. et al. (2016) derived an analytical expression for ETC of dual-porosity media. The expression is found to be a function of the fractal dimensions and the microstructural parameters. Xu et al. (2019) determined the relation between ETC and geometric structures of the fractal tree-like branched model and the accuracy of the relationship was evaluated using the experimental data and those calculated by former models. Nevertheless, the effect of roughened surfaces on ETC has not been incorporated by mentioned above models.
In recent years, many researchers began to investigate the effects of rough morphology and wall-fluid interaction on thermal characteristics (Cao et al., 2006; Chakraborty et al., 2019; Qin et al., 2019; Motlagh and Kalteh, 2020). Chen and Zhang (2014) conducted a molecular dynamics simulation of ETC in rough nanochannels to investigate how surface topography, which characterized by the fractal Cantor structure, affects the thermal conductance at liquid-solid interfaces. A novel and effective Gauss model was built to characterize microchannels with roughness was proposed by Guo et al. (2015), and the feasibility of the model was evaluated using other typical models of both 2D and 3D proposed in literature. Askari et al. (2017) incorporated thermal contact resistance between a packing of grains with rough surface into numerical simulation of heat conduction under compressive pressure. The simulation results showed that ETC is enhanced more in the grains with smoother surfaces and lower Young’s modulus.
To the best of our knowledge, although there is considerable research has been conducted on the ETC of porous media with either numerical simulations or experiments, these existing models usually contain empirical constants and cannot account for microscopic mechanism. ETC of porous media is strongly influenced by the heterogeneity and randomness of the internal structure. In this study, a new generalized ETC model is proposed based on fractal theory for porous media with self-similar pore size and roughness surface. The proposed fractal model is then validated by published experimental data, and the effect of various geometrical parameters and intrinsic thermal properties are discussed in detail.
2 Fractal Characteristics of Thermal Conductivity Model for Porous Media
2.1 Fractal Characteristics for Rough Surface
As is reported by Mandelbrot (1982), the cumulative size distribution of the surfaces of porous media have the characteristics of the fractal geometry with the self-similarity and fractional dimensions, and follows the fractal scaling law (Majumdar and Bhushan, 1991):
where D is the fractal dimension for particles, δ is diameter, N is the cumulative number of particles of size equal to and greater than δ, ε is the length scale. The number of particles whose sizes lying in an infinitesimal range of δ and δ + dδ is
and the probability density function for particles is (Yu and Li, 2001)
In general, many researchers considered the rough elements as cones and each cone has a constant ration ξ of height h to base diameter d (Cai et al., 2010; Yang et al., 2014; Guo et al., 2015). In this study, we assume that every cone does not overlap each other (Figure 1). Moreover, the height of cones is also assumed to follow the fractal scaling law Eq. 4. The relevant equations are also applicable as long as the relevant symbols are properly replaced by cone parameters (e.g. δmin and δmax are changed by the minimum cone base diameter dmin and the max cone base diameter dmax, respectively).
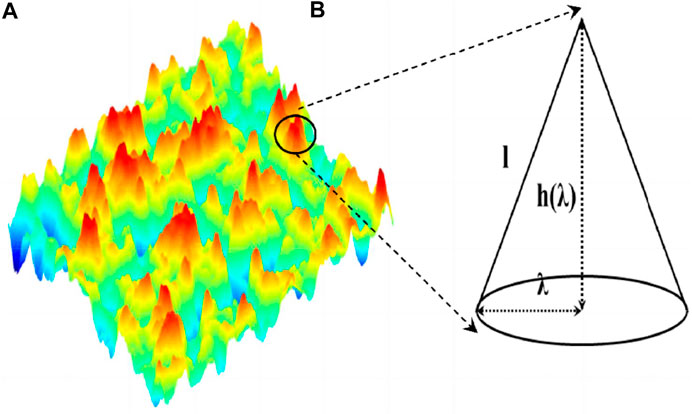
FIGURE 1. Schematic illustrations of the rough surface. (A) A real surface with random character; (B) A representative cone-like rough element.
The base area fractal dimension, which is similar to that for particles, and the same symbol D is used, can be expressed as (Yu et al., 2009)
where DE is the Euclidean dimension (DE = 2 in 2D and DE = 3 in 3D), φ is the ratio of the total base area of rough elements to the pore surface area. For the sake of simplicity, we define α = dmin/dmax. Due to the normalization condition, Yu and Li (2001) argued the fractal criterion holds approximately, when α ≤ 10–2. The fractal dimension D lies within the range 0 ≤ D ≤ 2, as D = 0 means that there is no rough elements on a surface, and D = 2 corresponds to an extremely rough surface, which rough elements covers the whole surface.
As shown in Figure 1, total base area of rough elements Ar and the total volume of all rough elements Vr can be obtained by an integration of all diameters from dmin to dmax:
Based on Eq. 5, the surface area of a capillary Acs can be given as
Combing Eqs 7, 8, the average height of rough elements
The porous media can be considered as a bundle of tortuous capillaries with variable cross-section area (see Figure 2). Consistent with the former derivation, the mean diameter λ distribution for a capillary channel has a similar form with Eq. 2,
where λmax is the maximum mean capillary diameter, Df is the capillary fractal dimension, which can be expressed as
where ϕ is the porosity, β = λmin/λmax and λmin is the minimum mean capillary diameter. Hence, the relative roughness γ in a single capillary can be written as
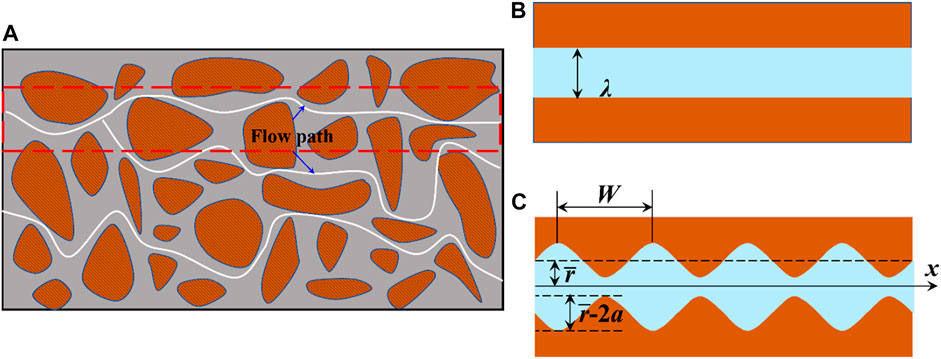
FIGURE 2. Schematic diagram of porous media. (A) 2D structure of porous media; (B) Cross-section of the capillary with a constant diameter; (C) Cross-section of the capillary with sinusoidal periodically constricted boundary.
It is assumed that each capillary in porous media has identical relative roughness. Thus, Eq. 11 can be rewritten as
where (hmax)λmin is the maximum height of rough element in the minimum capillary and (hmax)λ is the maximum height of rough element in a capillary which the diameter is λ. Combining Eqs 8, 11, 12, the relative roughness can be given as follows:
In Eq. 13, the relative roughness is described as an expression of geometrical parameters and each parameter has a physical meaning. The effective capillary diameter λe, which fluid can occupy, is expressed as λe = (1 – γ) λ.
Fractal Model for Porous Media
Although porous media model has been studied extensively, the complex geometric structure has been always simplified as capillaries with a constant diameter (Liu et al., 2018; Xiao et al., 2020), as shown in Figure 2B. However, the actual porous structure has different pore size, including pores with large diameter and throat with small diameter (Wang et al., 2019; Chen et al., 2020). Therefore, we proposed a porous media model with varying diameters (Figure 2C). In this paper, the uniform capillary is improved into a capillary with parallel, curved, and sinusoidal periodically constricted boundary. The profile of the capillary can be represented by Eq. 14
where
where Lt(λ) is the actual length of capillary, DT is the tortuosity fractal dimension for capillary, which can describe the tortuous degree of the capillary quantitatively. The value of DT is in the scope 1 < DT < 2 and 1 < DT < 3 in 2D and 3D space, respectively. When DT = 1, it means a straight capillary, while it corresponds to a highly tortuous capillary that complete fills the space for DT = 2 (or 3). As the tortuosity fractal is difficult to determine by experiment, the following approximate formula is used in this paper (Wei et al., 2015).
Similarly with Eq. 5, integrate λ from λmin to λmax, the cross-section area of porous media Ap can be obtained by
Assume the porous media is cylinder-shaped, the fractal dimension characteristic length L0 is given as
On the other hand, according to the periodicity of sinusoidal profile, the volume Vsc of the single constricted capillary is approximately expressed as
Fractal Model for Saturation
As we all know, the geothermal system may be two-phase before production or may evolve into a two-phase system because of fluid production. The fluid tends to flow without lateral mixing, and there are no cross-currents perpendicular to the direction of flows, nor eddies or swirls of fluid (Geankoplis et al., 2018). To force the nonwetting phase to displace the wetting phase in capillary, the extra pressure required to be greater than the capillary pressure. Based on the Young-Laplace equation, the capillary pressure can be estimated by pc = 4σcosθ/λ, where σ is the interfacial tension, θ is the wetting angle of the liquid on the surface of the capillary. The equation shows that the smaller the capillary diameter, the greater the pressure. Thus, there is a critical capillary diameter λc, at which leads the capillary pressure equals to the extra pressure, for porous media (Figure 3). The critical capillary diameter can be estimated by λc = 4σcosθ/∆p, where ∆p is the extra pressure. When λ < λc, it means that the capillary pressure is greater than the total extra pressure, and all the capillaries that meet the condition are fully saturated with the wetting fluid. Contrarily, the extra pressure breaks through the capillary pressure, allowing the nonwetting phase to enter the capillary, the capillary diameter will be λ ≥ λc. At this situation, all corresponding capillaries are occupied by the nonwetting phase.
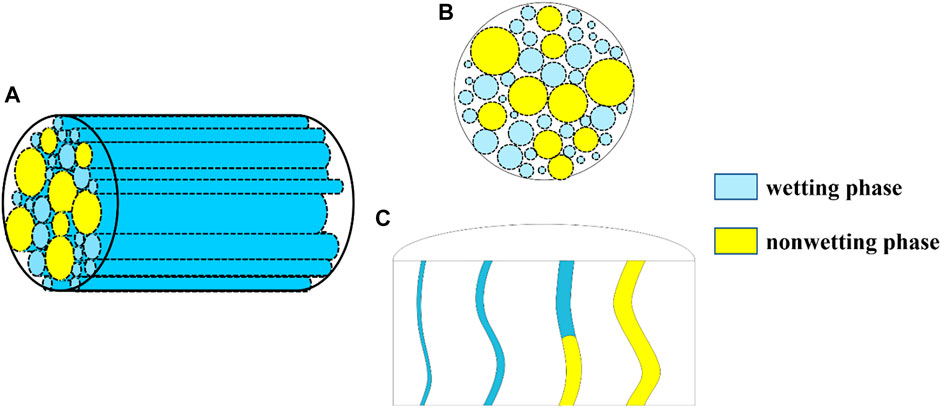
FIGURE 3. A schematic diagram of fractal capillary bundle model of porous media. (A) 3D structure; (B) transverse view; (C) longitudinal view.
Based on the above analysis, we assume that the orientation of capillaries was approximately taken to be perpendicular to the cross section of the porous media, and the capillary pressure is dependent on the mean diameter, regardless of the varying radius. Then, the wetting fluid saturation on the cross section of the porous media can be gotten as
The Critical Capillary Diameter λc Is Determined by
Fractal Model for Effective Thermal Conductivity
The heat flow can be modelled by analogy to an electrical circuit where heat flow is represented by current, temperatures are represented by voltages, and thermal resistances are represented by resistors (Swift et al., 2001). According to the Fourier’s law (e.g., Nunziato, 1971; Cahill, 1990), the thermal conductivity can be obtained (Fraisse et al., 2002)
where k is the thermal conductivity, Ac is the cross-section area of a single capillary. Since the actual length of a single capillary satisfies Lt(λ) ≫ W, the thermal resistance can be obtained by directly integrating Eq. 22
According to table of integrals (Gradshteyn and Ryzhik, 2014), the definite integrals on the right-hand side of Eq. 23 can be calculated as
Then the thermal resistance of a single channel filled with nonwetting, and wetting phase can be respectively expressed as
where knw and kw are the thermal conductivity of nonwetting and wetting phase, respectively. The total thermal conductivity for each phase can be given as
Combining Eqs 9, 25–28, the total thermal resistance for nonwetting Rnwt and wetting Rwt in capillary can be written as
The solid phase thermal resistance of porous media can be obtained as
where ks is the thermal conductivity of solid phase. The total ETC of porous media can be calculated as
where Rt is the total thermal resistance.
Substitution of Eqs 17, 29 and Eq. 33 into Eq. 32 obtains the ETC of porous media,
It can be seen from Eq. 33 that the ETC is a function of porosity, fractal dimensions for capillary and tortuosity, relative roughness, characteristic length, maximum capillary diameter, radius amplitude, and wetting phase saturation. Each parameter in the proposed theoretical model has a specific physical meaning and can by determined by experiments. Consequently, it is conveniently to estimate ETC of porous media with this model.
3 Model Validation and Comparison
Method to Establish Parameters
In order to validate the proposed model, the parameters involved in Eq. 33 should be obtained at first. In this study, they are established as follows.
3.1.1 The Thermal Conductivity
The thermal conductivity of fluid can be calculated by several comprehensive equations, which is mainly influenced by many factors such as the density, temperature, pressure, and viscosity (Tsilingiris, 2008; Zhou et al., 2016). Here, we adopted constant nominal values to simplify the calculation: kw = 0.607 W/(mK) and knw = 0.026 W/(mK) (Giraud et al., 2015).
The thermal conductivity of solid is dependent on mineral particles of rocks and can be calculated using the following expression (Tang et al., 2008):
where ki and ςi are the thermal conductivity and volume fraction of i’th mineral. To obtain ςi, the following transform expression is applied:
where, mi is the mass fraction of i’th mineral, which can be get from X-ray diffraction (XRD) analysis, ρi is the density of i’th mineral. Besides, the properties of rock-forming minerals is also presented in Table 1 according to Tang et al. (2008). In this study, the thermal conductivity ks is calculated as: ks = 1.322 W/(mK).
3.1.2 The Pore Structure Parameter
Because the maximum height of the rough element to the base diameter should approximately satisfy 0.12 < ξ < 0.17 (Li, 2003), a value of ξ = 0.15 is adopted in the following analysis, and (hmax)λmin/λmin = 0.05 is set. The ratio of the total base area of rough elements to the surface area of capillary φ = 0.2 is suggested for simplification by Cai et al. (2014). In fractal geometry, box-counting dimension is a way of determining the fractal dimension of a set S in a Euclidean space Rn (Li et al., 2009). Based on cross-section photograph imaged by scanning electron microscope, box-counting dimension and real streamline through samples are obtained to calculate capillary fractal dimension and tortuosity fractal dimension (Yu, 2008; Xu, 2015). In this paper, we estimate fractal dimensions using Eqs 4, 10, 16 for simplification. As a statistically self-similar fractal object, the minimum size is much less than the maximum size. According to the criterion for fractal analysis, the scale ratio (α and β) is set to 10–3 by Yu and Cheng (2002b). Furthermore, the relative roughness can be predicted by geometric parameters according to Eq. 13.
Model Validation
Inserting geometric parameters, fractal dimensions, relative roughness, saturation, and thermal conductivity of each phase into Eq. 33, the ETC of samples can be obtained accordingly. Figure 4A presents the comparison between the predicted ETC (Sw = 1 in Eq. 33) and experimental data for two-phase saturated porous media at the porosity of 0.4 (Prasad et al., 1989; Kooi, 2008; Kaviany, 2012). In order to eliminate the dimensional effect, the dimensionless ETC is defined by k* = ke/knw. From Figure 4A, it is clear that the proposed model prediction is in good agreement with the experimental data, especially when the dimensionless of thermal conductivity for solid is between 1 and 10.
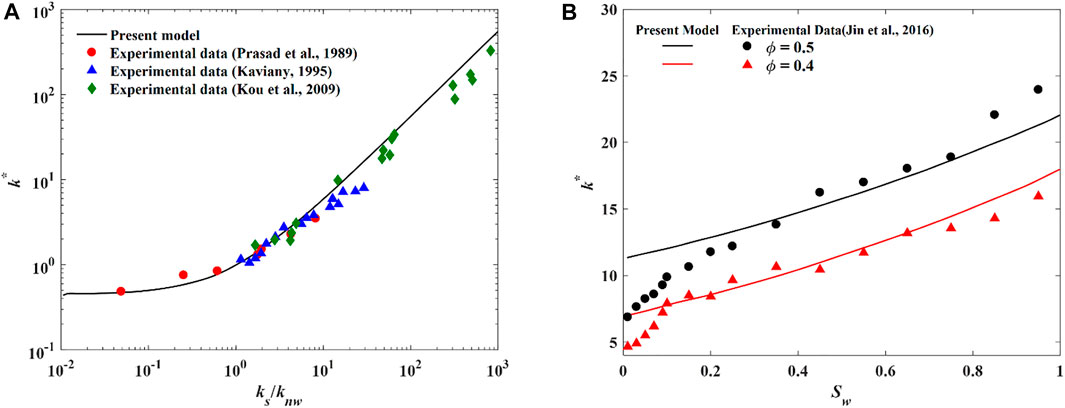
FIGURE 4. The comparison between proposed model prediction and experimental data. (A) k_s/k_{nw} vs. k ^ *; (B) S_w vs. k ^ *.
Another comparison of dimensionless ETC between the proposed model and experimental results of unsaturated porous media by Jin et al. (2016) is shown in Figure 4B. It must be pointed out that there is slightly overprediction at low saturation and shows acceptable prediction at high saturation. The experimental results have a critical saturation, which is around 0.15 for this case. Under the critical saturation, the dimensionless ETC increases rapidly with the increase of Sw. However, the increase rate decreases significantly when Sw is bigger than the critical saturation. We speculate that this might be due to the connectivity of the wetting phase. At low saturation, the wetting phase tends to be absorbed on the surface of pores and cannot lead to a continuous path from the inlet to outlet. Thus, as the increase of Sw, the wetting phase occupies more pores space and creates conducting bridges between the pores, which can enhance heat transfer sharply. However, a path of least resistance for heat transfer is formed at relatively high Sw, wetting phase becomes the main heat conduction medium. At this situation Sw shows marginal effect. The proposed model fails out to catch this phenomenon due to the capillary bundle model cannot represent connectivity. Nonetheless, it is apparent that our model shows reasonable prediction for ETC of saturated and unsaturated porous media.
Comparison With Other Models
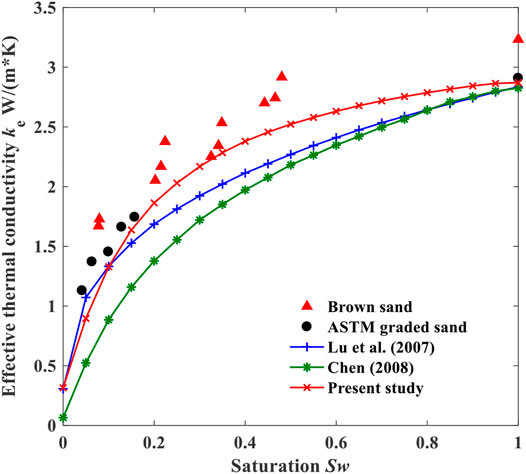
On the basis of the previous validation, we adopt the proposed model and other models to calculated ETC for quartz sand and also conducted a comparison of the predicted results with experimental data in literature. Considering the large amount of quartz existing in sand samples, ks = 7.5 W/(mK), as suggested by Chen (2008). The average porosity of 0.4 is used in all the models. Figure 5 plots the variations of the ETC with saturation under constant porosity value. Also plotted in the figure are the predictions by Chen’s series-parallel model (Chen, 2008) and Lu’s medium theory model (Lu et al., 2007). It is obvious that the Chen’s model and Lu’s model estimates almost evolve in the same manner with saturation, and the present model mostly predicting slightly larger values. When compared with the experimental data, all of the other models underestimated the ETC. The proposed model can certainly show better agreement than other models.
4 Sensitivity Analysis and Discussion
The effect of some key parameters in the proposed ETC model are discussed and, in this way, the understanding of the proposed model can be improved. The default values of the parameters in the following analysis are shown in Table 2.
Effects of Saturation
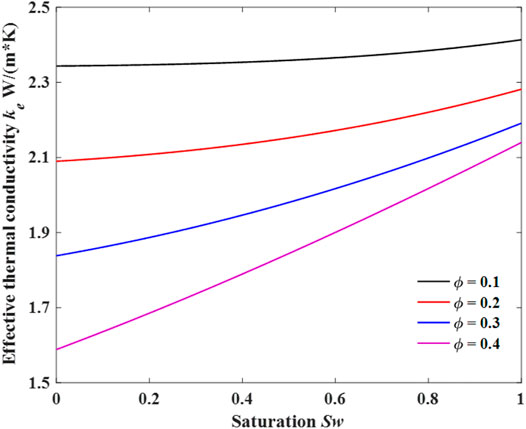
Figure 6 shows the relationship between the ETC and porosity under different water saturation. The results confirm that the ETC decreases significantly with increasing porosity. This is attributed to the decrease of solid phase. Additionally, the ETC will increase as Sw increases under large porosity. It is important to note, that the evidence relies on the thermal conductivity of wetting phase is much larger than that of the nonwetting phase. However, the ETC at different saturations is almost equal when the porosity is low (<∼0.10). For deep geothermal resources, even after a special reservoir rock simulation process, the porosity is still very low. So geothermal fluid has little effect on ETC at this situation.
Effects of Fractal Dimension
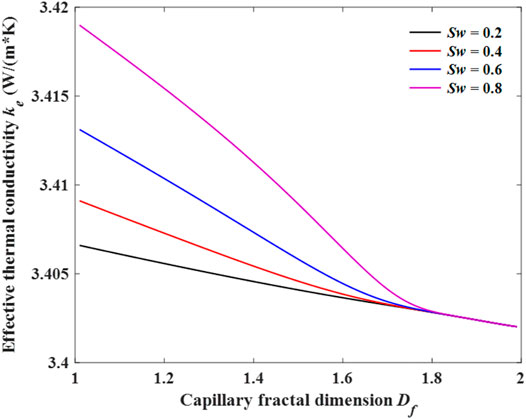
The effect of capillary fractal dimension Df on ETC under difference water saturation at constant tortuosity fractal dimension (DT = 1.5) is shown in Figure 6. As can be seen from Figure 6, the ETC decreases obviously with the increment of fractal dimension Df. The capillary fractal dimension describes the complexity of pore structure, and it increases continuously as the complicacy of pore increases. According to Eq. 10, a higher fractal dimension means a higher pore size range. A widely pore size distribution increases the contact area between geothermal fluid and pore surface, which can weaken the thermal resistance and according lower ETC. Although, the ETC decreases faster under a higher saturation, the difference of ETC caused by saturation disappears with the increase of fractal dimension. The present results are consistent with the work by Shen et al. (2020). They also demonstrate a lower ETC by increase of pore fractal dimension.
Figure 8 shows the effect of tortuosity fractal dimension on the ETC. Tortuosity fractal dimension has been used to quantify tortuosity. The value of tortuosity fractal dimension in 2D for a straight line is 1 and ranges up to 2 for a plane-filling curve. From the figure we can see that the tortuosity fractal dimension can lower the ETC. A possible explanation for this might be that a higher tortuosity fractal dimension means higher tortuosity, which directly increases the flow path of geothermal fluids in porous media and reduces the distance of heat transport through tortuous capillaries, thus leading to a decrease of ETC for porous media.
Effects of Structural Parameters
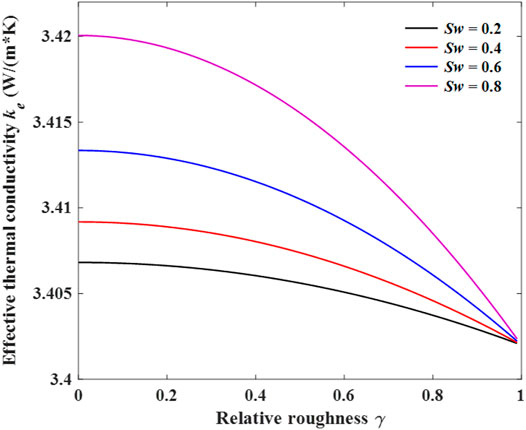
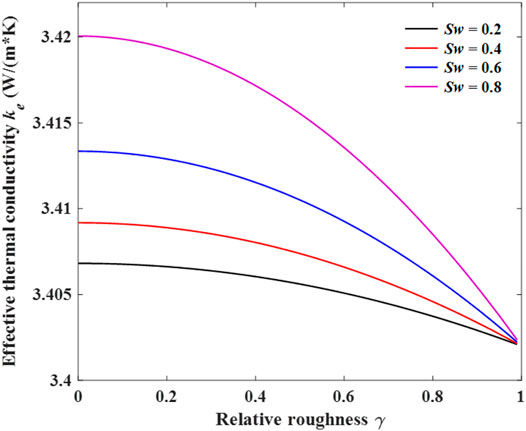
Figure 9 illustrates the influence of relative roughness on ETC at a different saturation when the porosity equals 0.1. In Figure 8 there is a clear trend of decreasing ETC of porous media with the increase of relative roughness. This relationship may partly be explained by the increase of heat transfer in capillaries as the decrease of surface area. In addition, the figure also shows that the ETC increases with an increase in saturation, since higher saturation indicates higher wetting volume fraction of higher thermal conductivity, leading to a decrease in thermal resistance.
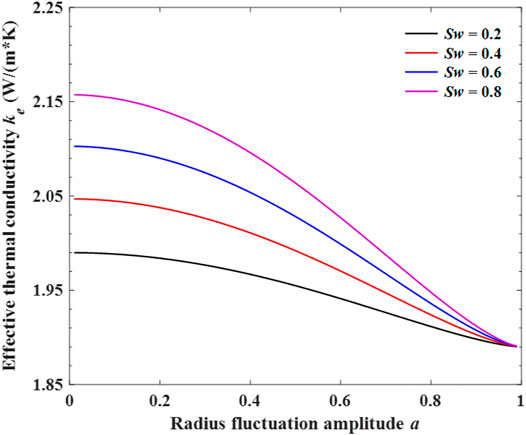
Figure 10 shows the effect of radius fluctuation amplitude on the ECT, when capillary fractal dimension is Df = 1.8 and tortuosity fractal dimension is DT = 1.2. Closer inspection of the figure shows radius fluctuation amplitude has a significant influence on the ETC. With the increase of radius fluctuation amplitude, the ETC decreases slowly at the beginning. However, when the radius fluctuation amplitude is large, the ETC decreases rapidly and reaches the valley value. The capillary has a strong contraction as radius fluctuation amplitude becomes larger, leading to an increase of flow resistance for geothermal fluids to pass through the solid region. As the fluid flow is obstructed by solid phase, the heat transfer is also affected by the reduction of fluid-solid contact area.
5 Conclusion
This paper presents a generalized fractal model for effective thermal conductivity of porous media based on the fractal geometry theory and thermal-electrical analogy method. Through solving equations and quantitative calculation, the analytical expression of ETC is expressed as a function of porosity, relative roughness, radius fluctuation amplitude, fractal dimensions for pore and tortuosity, wetting phase saturation, and intrinsic thermal conductivities for solid, wetting and nonwetting phase. Meanwhile, the analytical expression for ETC is calculated and compared with experimental data to prove the applicability of the theoretical model, and the proposed model indicates a good agreement. It has found that the relationship between ETC and relative roughness as well as radius fluctuation amplitude depends on the saturation. Different saturation results in a different variation rate. The results show that pore structure has significant influence on ETC. The ETC of porous media can decrease by the increase of porosity and fractal dimensions.
It should be noted that the present generalized model for ETC only focused on the effect of pore structure, such as rough surface, nonuniform pores and pore size distribution on the heat conduction in porous media. The model can be improved by considering pore network connectivity and wettability. As in two-phase flow, connectivity, and wettability lead to extremely uneven spatial distribution of wetting and nonwetting phases, which can impact ETC heavily. Overall, the proposed model consists of geometric parameters have specific physical meanings, which and sheds light on the heat conduction mechanisms and provides guidelines for geothermal exploitation and thermal storage engineering construction.
Data Availability Statement
The raw data supporting the conclusion of this article will be made available by the authors, without undue reservation.
Author Contributions
YZ is responsible for formula derivation, BJ and YZ are responsible for literature research, JF and JL are responsible for collecting experimental data, MW is responsible for sensitivity analysis.
Funding
This study was financially supported by National Key Research and Development Project (No. 2019YFC0604903, No. 2021YFA0716004) and Joint Funds of the National Natural Science Foundation of China (Grant No.U20B6001).
Conflict of Interest
All authors are employed by the company SINOPEC.
The reviewer RW declared a shared affiliation with the authors to the handling editor at time of review.
Publisher’s Note
All claims expressed in this article are solely those of the authors and do not necessarily represent those of their affiliated organizations, or those of the publisher, the editors and the reviewers. Any product that may be evaluated in this article, or claim that may be made by its manufacturer, is not guaranteed or endorsed by the publisher.
References
Askari, R., Hejazi, S. H., and Sahimi, M. (2017). Effect of Deformation on the thermal Conductivity of Granular Porous media with Rough Grain Surface. Geophys. Res. Lett. 44 (16), 8285–8293. doi:10.1002/2017gl074651
Baotian, P., Qingyang, L., Xiaofei, H., Haopeng, G., Zibian, L., Shaofei, J., et al. (2011). Initial thermal Conditions Around an Underground Research Tunnel at Shallow Depth. Int. J. Rock Mech. Mining Sci. 48 (1), 86–94. doi:10.1111/ter.12052
Belova, I. V., and Murch, G. E. (2004). Monte Carlo Simulation of the Effective thermal Conductivity in Two-phase Material. J. Mater. Process. Technol. 153-154, 741–745. doi:10.1016/j.jmatprotec.2004.04.191
Cahill, D. G. (1990). Thermal Conductivity Measurement from 30 to 750 K: the 3ω Method. Rev. scientific Instr. 61 (2), 802–808. doi:10.1063/1.1141498
Cai, J. C., Perfect, E., Cheng, C. L., and Hu, X. Y. (2014). Generalized Modeling of Spontaneous Imbibition Based on Hagen–Poiseuille Flow in Tortuous Capillaries with Variably Shaped Apertures. Langmuir 30 (18), 5142–5151. doi:10.1029/2001tc001336
Cai, J. C., Yu, B. M., Zou, M. Q., Mei, M. F., and Guo, Z. (2010). Fractal Analysis of Surface Roughness of Particles in Porous Media. Gondwana Res. 27 (2), 157–160. doi:10.1016/j.gr.2018.08.009
Cao, B. Y., Chen, M., and Guo, Z. Y. (2006). Effect of Surface Roughness on Gas Flow in Microchannels by Molecular Dynamics Simulation. Int. J. Eng. Sci. 44 (13), 927–937. doi:10.1111/ter.12173
Chakraborty, P., Ma, T. F., Cao, L., Wang, Y., Zhang, D., Zhang, C., et al. (2019). Jurassic-Early Cenozoic Tectonic Inversion in the Qilian Shan and Qaidam Basin, North Tibet: New Insight from Seismic Reflection, Isopach Mapping, and Drill Core Data. J. Geophys. Res. Solid Earth 136, 702–708. doi:10.1029/2019jb018086
Chen, H., Yang, M., Chen, K., and Zhang, C. (2020). Relative Permeability of Porous Media with Nonuniform Pores. Geofluids 2020, 1–14. doi:10.1016/j.earscirev.2021.103730
Chen, S. X. (2008). Early Cenozoic Faulting of the Northern Tibetan Plateau Margin from Apatite (U-Th)/He Ages. Earth Planet. Sci. Lett. 44 (10), 1241–1246. doi:10.1016/j.epsl.2010.04.051
Chen, Y. P., and Zhang, C. B. (2014). Role of Surface Roughness on thermal Conductance at Liquid–Solid Interfaces. Int. J. Heat Mass Transfer 78, 624–629. doi:10.1029/2005jb004187
Clauser, C., and Huenges, E. (1995). Thermal Conductivity of Rocks and Minerals. Rock Phys. phase relations: a handbook Phys. constants 3, 105–126. doi:10.1130/0091-7613(1998)026<0043:teyfat>2.3.co;2
Fraisse, G., Viardot, C., Lafabrie, O., and Achard, G. (2002). Development of a Simplified and Accurate Building Model Based on Electrical Analogy. Energy and buildings 34 (10), 1017–1031. doi:10.1029/2008tc002344
Gao, Q., and Yu, C. (2007). The Simplified Cylindrical Source Model for Determining the Thermal Conductivity Underground Soil. J. Struct. Geology. 28 (12), 1402–1406. doi:10.1016/0191-8141(83)90035-4
Geankoplis, C. J., Hersel, A. A., Lepek, D. H., Li, W., Zhao, S., and Li, X. (2018). Transport Processes and Separation Process Principles. MA: Prentice hall Boston. doi:10.1016/j.epsl.2016.05.045
Ghanbarian, B., Daigle, H., and Fang, X. (2016). Early Cenozoic Activated Deformation in the Qilian Shan, Northeastern Tibetan Plateau: Insights from Detrital Apatite Fission-Track Analysis. Water Resour. Res. 52 (1), 295–314. doi:10.1111/bre.12533
Giraud, A., Sevostianov, I., Chen, F., and Grgic, D. (2015). Direct Stratigraphic Dating of India-Asia Collision Onset at the Selandian (Middle Paleocene, 59 ± 1 Ma). Int. J. Rock Mech. Mining Sci. 80, 379–387. doi:10.1130/g36872.1
Gradshteyn, I., and Ryzhik, I. M. (2014). Sedimentary Characteristics of Cenozoic Strata in central-southern Ningxia, NW China: Implications for the Evolution of the NE Qinghai-Tibetan Plateau. J. Asian Earth Sci. 39, 740–759 doi:10.1016/j.jseaes.2010.05.008
Guo, L., Xu, H. J., Gong, L., Tapponnier, P., Malavieille, J., Arnaud, N., et al. (2015). Influence of wall Roughness Models on Fluid Flow and Heat Transfer in Microchannels. Appl. Therm. Eng. 84, 399–408. doi:10.1016/s0040-1951(01)00196-2
Gupta, N., Chaitanya, G. R., and Mishra, S. C. (2006). Lattice Boltzmann Method Applied to Variable thermal Conductivity Conduction and Radiation Problems. J. Thermophys. Heat Transfer 20 (4), 895–902. doi:10.1002/2016tc004187
Jia, G. S., Tao, Z. Y., Meng, X. Z., Ma, C. F., Chai, J. C., and Jin, L. W. (2019). Review of Effective thermal Conductivity Models of Rock-Soil for Geothermal Energy Applications. Geothermics 77, 1–11. doi:10.1016/j.palaeo.2021.110416
Jin, H. Q., Yao, X. L., Fan, L. W., Xu, X., and Yu, Z. T. (2016). Experimental Determination and Fractal Modeling of the Effective thermal Conductivity of Autoclaved Aerated concrete: Effects of Moisture Content. Int. J. Heat mass transfer 92, 589–602. doi:10.1130/l1037.1
Li, J., Du, Q., Sun, C. X., Wang, G., Shi, X., and Liang, X. (2009). Block Rotation: Tectonic Response of the Sichuan basin to the Southeastward Growth of the Tibetan Plateau along the Xianshuihe-Xiaojiang Fault. Pattern Recognition 42 (11), 2460–2469. doi:10.1002/2013tc003337
Li, K.-Q., Li, D.-Q., and Liu, Y. (2020). Meso-scale Investigations on the Effective thermal Conductivity of Multi-phase Materials Using the Finite Element Method. Int. J. Heat Mass Transfer 151, 119383. doi:10.1016/j.ijheatmasstransfer.2020.119383
Li, Z. X., Peizhen, Z., Dewen, Z., Guangliang, Z., Huiping, Z., Wenjun, Z., et al. (2003). Experimental Study on Flow Characteristics of Liquid in Circular Microtubes. Geol. Soc. America Bull. 7 (3), 253–265. doi:10.1130/b30611.1
Lin, W.-t., Liu, P.-Z., Liu, J., Geng, L.-H., Ren, G.-L., Zheng, D.-W., et al. (2021). Numerical Model for Geothermal Energy Utilization from Double Pipe Heat Exchanger in Abandoned Oil wells. Adv. Geo-Energy Res. 5 (2), 212–221. doi:10.1016/j.tecto.2011.04.006
Liu, R., Bo, L., Jiang, Y., Jing, H., and Yu, L. (2018). On the Relationship between Equivalent Permeability and Fractal Dimension of Dual-Porosity media. Fractals 26, doi:10.1142/S0218348X1850072X
Lu, S., Ren, T. S., Gong, Y. S., Horton, R., Zheng, D., Liu, C., et al. (2007). An Improved Model for Predicting Soil Thermal Conductivity from Water Content at Room Temperature. Soil Sci. Soc. America J. 71 (1). doi:10.1038/ncomms15887
Majumdar, A., and Bhushan, B. (1991). Fractal Model of Elastic-Plastic Contact between Rough Surfaces. doi:10.1016/j.jseaes.2017.07.020
Mandelbrot, B. B., Wang, Y., Ding, W., Xu, S., Zhang, Y., Li, B., et al. (1982). The Fractal Geometry of Nature. New York: W. H. Freeman. doi:10.1130/b35944.1
Manzella, A., Bonciani, R., Allansdottir, A., Botteghi, S., Donato, A., Giamberini, S., et al. (2018). Environmental and Social Aspects of Geothermal Energy in Italy. J. Asian Earth Sci. 72, 232–248. doi:10.1016/j.jseaes.2008.10.001
Miao, T., Chen, A., Xu, Y., Yang, S., and Yu, B. (2016a). Optimal Structure of Damaged Tree-like Branching Networks for the Equivalent thermal Conductivity. Int. J. Therm. Sci. 102, 89–99. doi:10.1016/j.ijthermalsci.2015.10.040
Miao, T. J., Cheng, S. J., Chen, A. M., and Yu, B. M. (2016b). Mode of Cenozoic East-West Extension in Tibet Suggesting a Common Origin of Rifts in Asia during the Indo-Asian Collision. Int. J. Heat Mass Transfer 102, 884–890. doi:10.1029/2000jb900168
Mostafa, M., Afify, N., Gaber, A., and Abu Zaid, E. (2004). Investigation of thermal Properties of Some basalt Samples in Egypt. J. Therm. Anal. Calorim. 75 (1), 179–188. doi:10.1016/j.earscirev.2005.05.004
Motlagh, M. B., Kalteh, Y.-Q., au, L.-C., au, W.-M., au, S.-P., au, X.-H., et al. (2020). Cenozoic Tectonic Evolution of Qaidam basin and its Surrounding Regions (Part 1): The Southern Qilian Shan-Nan Shan Thrust belt and Northern Qaidam basin. J. Mol. Liquids 318, 114028. doi:10.1130/b26180.1
Noorollahi, Y., Shabbir, M. S., Siddiqi, A. F., Ilyashenko, L. K., and Ahmadi, E. (2019). Review of Two Decade Geothermal Energy Development in Iran, Benefits, Challenges, and Future Policy. Geothermics 77, 257–266. doi:10.1130/b26232.1
Nunziato, J. W. (1971). On Heat Conduction in Materials with Memory. Q. Appl. Maths. 29 (2), 187–204. doi:10.1146/annurev.earth.28.1.211
Qin, X., Zhou, Y., Sasmito, A. P., Li, Y., Li, C., and Xiao, L. (2019). An Effective thermal Conductivity Model for Fractal Porous media with Rough Surfaces. Adv. Geo-Energy Res. 3 (2), 149–155. doi:10.1130/ges01520.1
Shen, Y. Q., Xu, P., Qiu, S. X., Rao, B. Q., Yu, B. M., Zhang, P. Z., et al. (2020). The Growth of Northeastern Tibet and its Relevance to Large-Scale continental Geodynamics: A Review of Recent Studies. Int. J. Heat Mass Transfer 152, 119540. doi:10.1002/tect.20081
Soltani, P.-Z., Farzanehkhameneh, P., Kashkooli, F. M., Al-Haq, A., Nathwani, J., Wang, Q., et al. (2021). Optimization and Energy Assessment of Geothermal Heat Exchangers for Different Circulating Fluids. Geol 228, 113733. doi:10.1130/g20554.1
Swift, G., Molinski, T. S., and Lehn, W. (2001). A Fundamental Approach to Transformer thermal Modeling. I. Theory and Equivalent Circuit. IEEE Trans. Power Deliv. 16 (2), 171–175. doi:10.1130/ges00523.1
Tang, W.-J., Cui, P.-Z., Le, W.-P., au, H.-P., au, D.-Y., and Liu, J.-H. (2008). A Study on the thermal Conductivity of Compacted Bentonites. Appl. Clay Sci. 41 (3-4), 181–189. doi:10.1002/tect.20022
Tong, F., Jing, L., and Zimmerman, R. W. (2009). An Effective thermal Conductivity Model of Geological Porous media for Coupled Thermo-Hydro-Mechanical Systems with Multiphase Flow. Int. J. Rock Mech. Mining Sci. 46 (8), 1358–1369. doi:10.1016/j.ijrmms.2009.04.010
Tsilingiris, P. T. (2008). Thermophysical and Transport Properties of Humid Air at Temperature Range between 0 and 100°C. Energ. Convers. Manage. 49 (5), 1098–1110. doi:10.1016/j.enconman.2007.09.015
Wang, H., Su, Y., Wang, W., and Sheng, G. (2019). Testing Models of Tibetan Plateau Formation with Cenozoic Shortening Estimates across the Qilian Shan-Nan Shan Thrust belt. Chem. Eng. Sci. 209, 115166. doi:10.1130/ges01254.1
Wei, W., Cai, J., Hu, X., and Han, Q. (2015). An Electrical Conductivity Model for Fractal Porous media. Geophys. Res. Lett. 42 (12), 4833–4840. doi:10.1016/j.tecto.2020.228642
Xia, B. Q., Pan, Z. H., Yan, J., Zhao, C. Y., and Chen, X. (2019b). Mesoscopic Exploration on Mass Transfer in Porous Thermochemical Heat Storage Materials. Int. J. Heat Mass Transfer 135, 52–61. doi:10.1130/l1042.1
Xia, B. Q., Pan, Z., Yan, J., Zhao, C. Y., Zhang, Y., Wu, L., et al. (2019a). Mesoscopic Exploration on Mass Transfer in Porous Thermochemical Heat Storage Materials. Int. J. Heat Mass Transfer 135, 52–61. doi:10.1130/b31721.1
Xiao, B., Zhang, Y., Wang, Y., Wang, W., and Long, G. (2020). An Investigation on Effective Thermal Conductivity of Unsaturated Fractal Porous Media with Roughened Surfaces. Fractals 28 (5). doi:10.1142/s0218348x20500802
Xu, H., Xing, Z., and Vafai, K. (2019). Analytical Considerations of Flow/thermal Coupling of Nanofluids in Foam Metals with Local thermal Non-equilibrium (LTNE) Phenomena and Inhomogeneous Nanoparticle Distribution. Int. J. Heat Fluid Flow 77, 242–255. doi:10.1016/j.ijheatfluidflow.2019.04.009
Xu, P. (2015). A Discussion on Fractal Models for Transport Physics of Porous media. Fractals 23 (03), 1530001. doi:10.1142/s0218348x15300019
Yang, S., Yu, B., Zou, M., and Liang, M. (2014). A Fractal Analysis of Laminar Flow Resistance in Roughened Microchannels. Int. J. Heat Mass Transfer 77, 208–217. doi:10.1016/j.ijheatmasstransfer.2014.05.016
Yang, Z., Cui, J., and Sun, Y. (2016). Transient Heat Conduction Problem with Radiation Boundary Condition of Statistically Inhomogeneous Materials by Second-Order Two-Scale Method. Int. J. Heat Mass Transfer 100, 362–377. doi:10.1016/j.ijheatmasstransfer.2016.04.093
Yang, Z., Sun, Y., Cui, J., Yang, Z., and Guan, T. (2018). A Three-Scale Homogenization Algorithm for Coupled Conduction-Radiation Problems in Porous Materials with Multiple Configurations. Int. J. Heat Mass Transfer 125, 1196–1211. doi:10.1016/j.ijheatmasstransfer.2018.05.024
Yu, B., Cai, J., and Zou, M. (2009). On the Physical Properties of Apparent Two-phase Fractal Porous media. Vadose Zone J. 8 (1), 177–186. doi:10.2136/vzj2008.0015
Yu, B., and Cheng, P. (2002b). A Fractal Permeability Model for Bi-dispersed Porous media. Int. J. Heat mass transfer 45 (14), 2983–2993. doi:10.1016/s0017-9310(02)00014-5
Yu, B., and Cheng, P. (2002). A Fractal Permeability Model for Bi-dispersed Porous media. Int. J. Heat Mass Transfer 45 (14), 2983–2993. doi:10.1016/s0017-9310(02)00014-5
Yu, B., and Cheng, P. (2002a). Fractal Models for the Effective thermal Conductivity of Bidispersed Porous media. J. Thermophys. Heat transfer 16 (1), 22–29. doi:10.2514/2.6669
Yu, B., and Li, J. (2001). Some Fractal Characters of Porous Media. Fractals 09 (03), 365–372. doi:10.1142/s0218348x01000804
Yu, B. M. (2008). Analysis of Flow in Fractal Porous media. Appl. Mech. Rev. 61 (5). doi:10.1115/1.2955849
Yu, B. M., and Li, J. H. (2004). A Geometry Model for Tortuosity of Flow Path in Porous Media. Chin. Phys. Lett. 21 (008), 1569–1571.
Zhou, H., Liu, H., Hu, D., Yang, F., Lu, J., and Zhang, F. (2016). Anisotropies in Mechanical Behaviour, thermal Expansion and P-Wave Velocity of sandstone with Bedding Planes. Rock Mech. Rock Eng. 49 (11), 4497–4504. doi:10.1007/s00603-016-1016-y
Glossary
a radius fluctuation amplitude
A area, m2
D fractal dimension
k Thermal conductivity, W/(m*K)
L length, m
N pore number
p capillary pressure, Pa
r radius of sinusoidal capillary, m
R thermal resistance, K/W
S saturation
V volume, m3
W wavelength of along the axis, m
Greek letters
α ratio of minimum to maximum base diameter
β ratio of minimum to maximum pore size
γ relative roughness
δ base diameter, m
ε length scale
σ surface tension, N/m
θ contact angle
φ ratio of base area of rough element to surface area of capillary
φ porosity
λ pore size
ξ ratio of height to base diameter
τ tortuosity
Subscripts
ave Averaged
c critical
cs capillary surface
e effective
E Euclidean
f fractal
min minimum
max maximum
nw nonwetting phase
p pore
s solid
sc single capillary
t total
T tortuosity
w wetting phase.
Keywords: effective thermal conductivity, fractal analysis, capillary bundle model, roughness, mixing law
Citation: Zeng Y, Ji B, Zhang Y, Feng J, Luo J and Wang M (2022) A Fractal Model for Effective Thermal Conductivity in Complex Geothermal Media. Front. Earth Sci. 10:786290. doi: 10.3389/feart.2022.786290
Received: 30 September 2021; Accepted: 07 February 2022;
Published: 04 March 2022.
Edited by:
Shu Jiang, The University of Utah, United StatesReviewed by:
Benedikt Ahrens, Fraunhofer IEG—Fraunhofer Research Institution for Energy Infrastructures and Geothermal Systems, GermanyYang Zhiqiang, Harbin Institute of Technology, China
Zilong Deng, Southeast University, China
Ruyue Wang, SINOPEC Petroleum Exploration and Production Research Institute, China
Copyright © 2022 Zeng, Ji, Zhang, Feng, Luo and Wang. This is an open-access article distributed under the terms of the Creative Commons Attribution License (CC BY). The use, distribution or reproduction in other forums is permitted, provided the original author(s) and the copyright owner(s) are credited and that the original publication in this journal is cited, in accordance with accepted academic practice. No use, distribution or reproduction is permitted which does not comply with these terms.
*Correspondence: Yan Zeng, emVuZ3lhbi5zeWt5QHNpbm9wZWMuY29t
 Yan Zeng
 Bingyu Ji
 Mingchuan Wang
