Corrigendum: New Paleomagnetic Constraints on the Early Cretaceous Paleolatitude of the Lhasa Terrane (Tibet)
 Zhenyu Li1,2*
 Lin Ding1,2,3
 Andrew K. Laskowski4,5William B. Burke4Yaofei Chen6Peiping Song1
 Yahui Yue1,2Jing Xie1,2
- 1State Key Laboratory of Tibetan Plateau Earth System Science, Resources and Environment (TPESRE), Institute of Tibetan Plateau Research, Chinese Academy of Sciences, Beijing, China
- 2Center for Excellence in Tibetan Plateau Earth Sciences, Chinese Academy of Sciences, Beijing, China
- 3University of Chinese Academy of Sciences, Beijing, China
- 4Department of Earth Sciences, Montana State University, Bozeman, MT, United States
- 5Department of Geosciences, University of Arizona, Tucson, AZ, United States
- 6Institute of Science and Technology Strategy, Jiangxi Academy of Sciences, Nanchang, China
New zircon U-Pb dating results from the Zonggei Formation volcanics indicate that the volcanic rocks formed at ∼114–110 Ma. Paleomagnetic data, petrography, and rock magnetism confirm the primary nature of isolated characteristic remanent magnetizations carried by titanomagnetite and hematite. A statistical analysis of the combined results from the Zonggei and Duoni formations reveals a group-mean direction of D±ΔD = 0.4° ± 6.0°, I±ΔI = 22.2° ± 5.6°, α95 = 5.6°, k = 35.2 after bedding correction based on 20 group-mean directions. The corresponding paleopole was calculated to be λp = 70.3°N, φp = 270.5°E with A95 = 5.2°. The interpretation of our data alongside the Cenozoic data from the Tethyan Himalaya indicates that the India–Asia collision initiated by 61.7 ± 3.0 Ma at 13.0° ± 1.8°N, assuming a single-collision model. Intracontinental crustal shortening totaling 1,770 ± 470 km took place on the Asian side since the onset of India–Asia collision. Furthermore, the data show that the Neo-Tethys Ocean reached its maximum N-S width of 7,100 ± 530 km at ∼132 Ma and shrank to 6,400 ± 550 km by ∼115 ± 5 Ma. This is consistent with previous estimates based on the geophysical images of the subducted Neo-Tethyan slab beneath Eurasia.
Highlights
• Our data set supports the conclusion that the Lhasa terrane stayed at ∼13.0°N during 115 ± 5 Ma.
• Crustal shortening totaling 1,770 ± 470 km has occurred on the Asian side since the onset of the initial India–Asia collision.
• The Neo-Tethys Ocean reached its maximum N-S width of 7,100 ± 530 km at ∼132 Ma and shrank to 6,400 ± 550 km at ∼115 Ma.
1 Introduction
The Himalayan-Tibetan orogenic belt is the highest and largest archetype in the world. Most of the crustal shortening was driven by the Cenozoic India–Asia collision, making it an ideal setting to examine the effects of continent–continent collision and to quantify the resultant intracontinental deformation (Chang and Zhen, 1973; Achache et al., 1984; Besse et al., 1984; Patriat and Achache, 1984; Yin and Harrison, 2000; Ding et al., 2005; 2016; van Hinsbergen et al., 2011a; 2011b). The precise age of collision initiation, defined as the first contact between India and Eurasia, is still debated. Published estimates range from ∼70 to 60 Ma (Yin and Harrison, 2000; Ding et al., 2005; Cai et al., 2011; van Hinsbergen et al., 2012; Hu et al., 2015, 2016a, 2016b; Parsons et al., 2020) to as recently as ∼34 Ma (Aitchison et al., 2007). Many prior studies have attempted to resolve this issue over the past three decades (e.g., Achache et al., 1984; Patriat and Achache, 1984; Yin and Harrison, 2000; Ding et al., 2005; Aitchison et al., 2007; Dupont-Nivet et al., 2010; Liebke et al., 2010; Tan X-D et al., 2010; Najman et al., 2010, 2017; Sun Z-M et al., 2008, 2010, 2012; Meng et al., 2012; van Hinsbergen et al., 2012; Lippert et al., 2014; Ma et al., 2014; Yang et al., 2015; Bian et al., 2017; Yuan et al., 2020). The accurate dating of the collision onset age and paleolatitude is strongly dependent on the precollisional paleogeography of the southern Lhasa terrane, northern Tethyan Himalayan terrane, and Indian subcontinent (e.g., Patzelt et al., 1996; Chen et al., 2010; Yi Z-Y, et al., 2011; Sun Z-M et al., 2008, 2010, 2012; Lippert et al., 2014; Ma et al., 2014; Yang T.-S. et al., 2015; Bian et al., 2017, 2019; Qin et al., 2019; Yuan et al., 2020) (Figure 1).
FIGURE 1
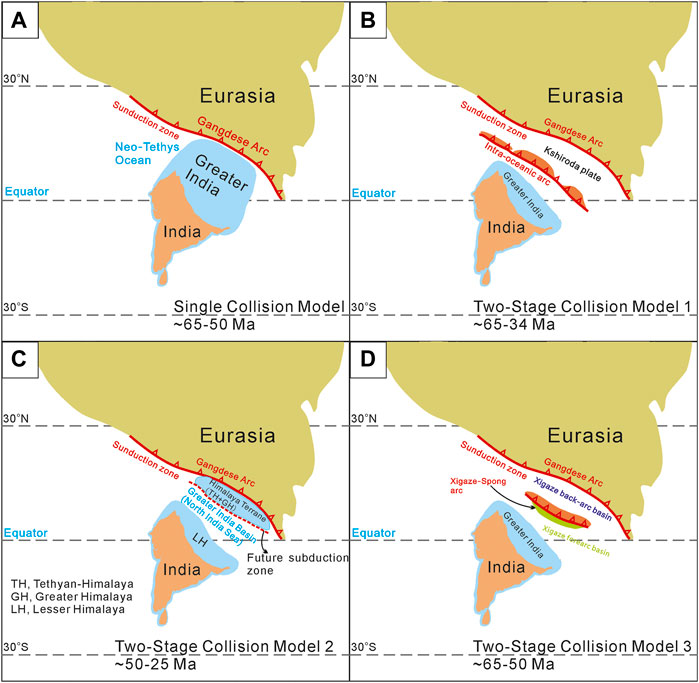
FIGURE 1. Four competing tectonic models for interpreting the initial India–Asia collision in early Cenozoic time. (A) Single-stage collision model derived from Gansser, (1966), Patzelt et al. (1996) and Parsons et al. (2020); (B) Two-stage collision model 1, which was proposed by Patriat and Achache (1984); (C) Two-stage collision model 2, which is firstly quantified by paleomagnetic analysis (van Hinsbergen et al., 2012, 2019); and (D) Two-stage collision model 3, which was proposed by Kapp and DeCelles (2019). Abbreviations are as follows: TH, Tethyan Himalaya; GH, Greater Himalaya; LH, Lesser Himalaya.
Despite the controversy regarding the timing and configuration of collision onset, much progress has been made in understanding the tectonic evolution of the India–Asia collision. Notably, in recent years, several authors have concluded that the India–Asia collision is not as straightforward as previously thought. An emergent view holds that collision was a complex process in which two or more tectonic plates collided with each other in what is today the central part of the southern Tibetan Plateau. Until now, different authors have proposed several mutually exclusive models with different geometries. Herein, we present each of the models and make direct comparisons. Those who are interested in further exploration of this topic are referred to several recent studies (e.g., Aitchison et al., 2007; Yi et al., 2011; van Hinsbergen et al., 2012, 2019; Hu et al., 2016b; Kapp and DeCelles, 2019; Parsons et al., 2020). The different tectonic models can be divided into four categories according to their stages of development as follows: 1) single-collision models; 2) two-stage collision models with an intraoceanic arc; 3) two-stage collision models with the Greater India Basin (GIB) hypothesis; and 4) two-stage collision models with an exotic Xigaze-Spong arc.
The predominant view of prior studies is that a collision took place when a single oceanic basin closed between two continental plates (also referred to as the single-collision model) (e.g., Achache et al., 1984; Ding et al., 2005; Cai et al., 2011; Wu et al., 2014; Hu et al., 2015, 2016a, 2016b; DeCelles et al., 2014; Baral et al., 2019) (Figure 1A). The single-collision model was initially proposed by authors during the early investigations of the Tibetan Plateau (e.g., Argand, 1924; Gansser, 1964, 1966, 1980). Subsequent studies focused on the geometry of continental Greater India and timing of collision within the single-subduction framework (Figure 1A) (Argand, 1924; Gansser, 1964; Klootwijk et al., 1992; Şengör and Natal’in, 1996; Patzelt et al., 1996; Ding et al., 2005; Cai et al., 2011; Hu et al., 2016a; Searle, 2019; Wang et al., 2018). The most important argument in support of this model is the fact that only one suture zone, marked by distinctive ophiolite and mélange, is preserved along the Indus-Yarlung Zangbo suture zone (IYZSZ). This implies that the Neo-Tethys Ocean was consumed along a single subduction zone (e.g., DeCelles et al., 2014; Hu et al., 2016b). The most significant challenge to this model is the large deficit between the documented shortening and the convergence between India and Asia. Prior studies predict extremely large convergence values (∼2,000–4,800 km) that far exceed documented crustal shortening across the orogen based on a 60–50 Ma collision age (Johnson, 2002; Aitchison et al., 2007; van Hinsbergen et al., 2012; Kapp and DeCelles, 2019) (Figure 1A). Despite the challenges, several recent papers adopt the single-collision model due to its compatibility with geological data (e.g., Tapponnier et al., 1982; Ding et al., 2005; Hu et al., 2016b).
The earliest two-stage collision model was proposed by Patriat and Achahe (1984), who argued that there might have been an intra-oceanic arc (the Ladakh island arc) to the south of the India–Asia suture. In this interpretation, Greater India collided with the island arc at approximately 54 Ma, and India–Asia collision initiated shortly thereafter at approximately 50 Ma. This interpretation was later explored by other workers using tomographic imaging and/or geological evidence (Van der Voo et al., 1999; Aitchison and Davis, 2004; Aitchison et al., 2007; Aitchison et al., 2011) (Figure 1B). The two-stage model is compatible with the paleomagnetic data from Cretaceous rocks in the Dazhuqu region (Abrajevitch et al., 2005) and has been bolstered by further data synthesis (Abrajevitch et al., 2005; Aitchison et al., 2007; Parsons et al., 2020). Furthermore, it is supported by some paleomagnetic and geophysical studies (Van der Voo et al., 1999; Abrajevitch et al., 2005; Aitchison et al., 2007), although the geological evidence for the second suture zone is lacking. However, this model did not reasonably explain the deceleration of India between 60 and 50 Ma (Klootwijk et al., 1992; Copley et al., 2010; van Hinsbergen et al., 2011a).
Two-stage subduction models involving a microcontinent on the lower-plate side (GIB) have also been proposed to explain the shortening deficit (Sinha Roy, 1976; Hsu et al., 1995). Subsequent studies tested this model using paleomagnetic and tomographic imaging analysis (van Hinsbergen et al., 2012, 2019), with a focus on determining whether the GIB [referred to as North India Sea by Yuan et al. (2020) existed (Figure 1C)]. The timeline proposed in these studies begins with ∼118–68 Ma rifting of Greater Himalaya and Tethyan Himalaya composite terrane from the Lesser Himalaya and Indian plate. From 60 to 50 Ma, Greater Himalaya and Tethyan Himalaya composite terrane collided with Lhasa terrane, and the GIB was consumed along a north-directed subduction zone, which would have separated Greater Himalayan rocks from Lesser Himalayan rocks. The consumption of the GIB was completed by 30–20 Ma (van Hinsbergen et al., 2012, 2019). Direct paleomagnetic observations from two locations in the Tethyan Himalaya (Yuan et al., 2020) support this interpretation, though in that study, the GIB was referred to as the North India Sea and the timing on the rifting of the Tethyan-Himalayan and Greater Himalayan TH+GH composite terrane was tightly constrained to ∼75–53/48 Ma. However, some key discrepancies, such as the lack of geological evidence for a suture zone within the central part of the Himalayan thrust belt (e.g., Searle, 2019; Kapp and DeCelles, 2019; Parsons et al., 2020) and sediment transport pathways for Cretaceous-earliest Paleocene Jidula Fm. sediments (Hu et al., 2010) in the Tethyan Himalaya, require explanation.
Recently, Kapp and DeCelles (2019) proposed a new tectonic model in which the Xigaze-Spong continental arc rifted from the southern Lhasa terrane between 90 and 70 Ma to form a back-arc basin on the upper-plate side of the India–Asia suture. Subsequently, a new subduction zone formed within the back-arc basin shortly after India collided with the Xigaze-Spong arc (Kapp and DeCelles, 2019) (Figure 1D). The consumption of the back-arc lithosphere would have occurred between 60 and 45 Ma. This model is compatible with the available geological data, but the primary geological evidence for the Xigaze back-arc basin is lacking (Kapp and DeCelles, 2019; Parsons et al., 2020).
Paleomagnetism provides quantitative estimates of convergence and crustal shortening triggered by continental collision throughout the Cenozoic India–Asia collision. Despite the accumulation of numerous paleomagnetic data sets from the Cretaceous and Cenozoic rocks of the Lhasa terrane, the estimates of crustal shortening are still debated, with published estimates ranging from only hundreds of kilometers (Tan X-D et al., 2010) to over 2,000 km (Besse et al., 1984; Patriat and Achache, 1984; Johnson, 2002; Chen, J-S et al., 2010; Sun et al., 2010, 2012; Ma et al., 2014; Yang et al., 2015; Bian et al., 2017; Li, Z-Y et al., 2017; Tong et al., 2017).
In addition to the issues mentioned above, the determination of the north-south width of the Neo-Tethys oceanic basin is a key part of reconstructing the India–Asia collision (Van der Voo et al., 1999; Ji et al., 2009; Chen, W-W et al., 2012). This information is critical to reconstruct the evolution of the Neo-Tethys Ocean and the position of the Lhasa terrane before collision initiation. Scholars have made some major progress on this topic from different perspectives such as tomographic imaging analysis, magmatism, and paleomagnetism (Van der Voo et al., 1999; Ji et al., 2009; Chen, W-W et al., 2012).
In this study, we obtained new paleomagnetic and geochronological results from the northern Lhasa terrane to address five key questions: 1) What was the exact emplacement age of the Zonggei Formation volcanic rocks that we sampled for paleomagnetism? 2) What was the accurate paleolatitude of the Lhasa terrane during the Early Cretaceous based on the results from the Zonggei Formation volcanic rocks? 3) How much intracontinental crustal shortening has occurred within Eurasia since collision initiation? 4) What was the north–south width of the Neo-Tethys Ocean during the Early Cretaceous time based on the integration of ∼132–117 Ma paleolatitudes acquired from the Tethyan Himalaya and the interior of the Indian plate and what was the paleolatitudinal variation of the Lhasa terrane throughout Early Jurassic to Early Cretaceous time? To this end, we designed and performed the geological mapping and sampling of the Zonggei Fm. volcanic rocks to test the consistency and validity of previously obtained results from the Duoni Fm. volcano-sedimentary rocks, which are close to the sampling locations of this study in the Nagqu region.
2 Geological Setting
The Lhasa terrane is situated in southern Tibet and is bounded by the Bangong-Nujiang suture zone (BNSZ) to the north and the IYZSZ to the south (Allégre et al., 1984; Dewey et al., 1988; Yin and Harrison, 2000; Ding et al., 2005; Wang et al., 2015; Hu et al., 2016a, 2016b) (Figure 1A). The final accretion of the Lhasa terrane to Eurasia predates the arrival of the Indian subcontinent and formed the southernmost margin of Asia over a long period (Şengör, 1987; Yin and Harrison, 2000; Pan et al., 2004; Ding et al., 2005; Kapp et al., 2005, 2007; Leier et al., 2007; Zhu et al., 2016). The northern Lhasa terrane is comprised of Jurassic-Cretaceous sedimentary and Mesozoic igneous rocks (Leeder, et al., 1988; Leier et al., 2007; Zhu et al., 2009, 2013) that form an E-W-trending belt of volcano-sedimentary sequences (Ma and Yue, 2010; Zhu et al., 2009, 2011, 2013).
The study area is in the Nagqu basin of the northern Lhasa terrane (Figure 2), which comprises a conspicuous Early Cretaceous magmatic belt distributed along the northern Lhasa terrane in the Nagqu area. Some scholars suggested that this magmatic belt represents a magmatic arc immediately south of the BNSZ (Ma and Yue, 2010; Zhu et al., 2009, 2011, 2013). Both of the units focused on in this study, namely, the Zonggei Formation volcanic rocks and previously sampled Duoni Formation volcano-sedimentary rocks, are a part of this magmatic belt.
FIGURE 2
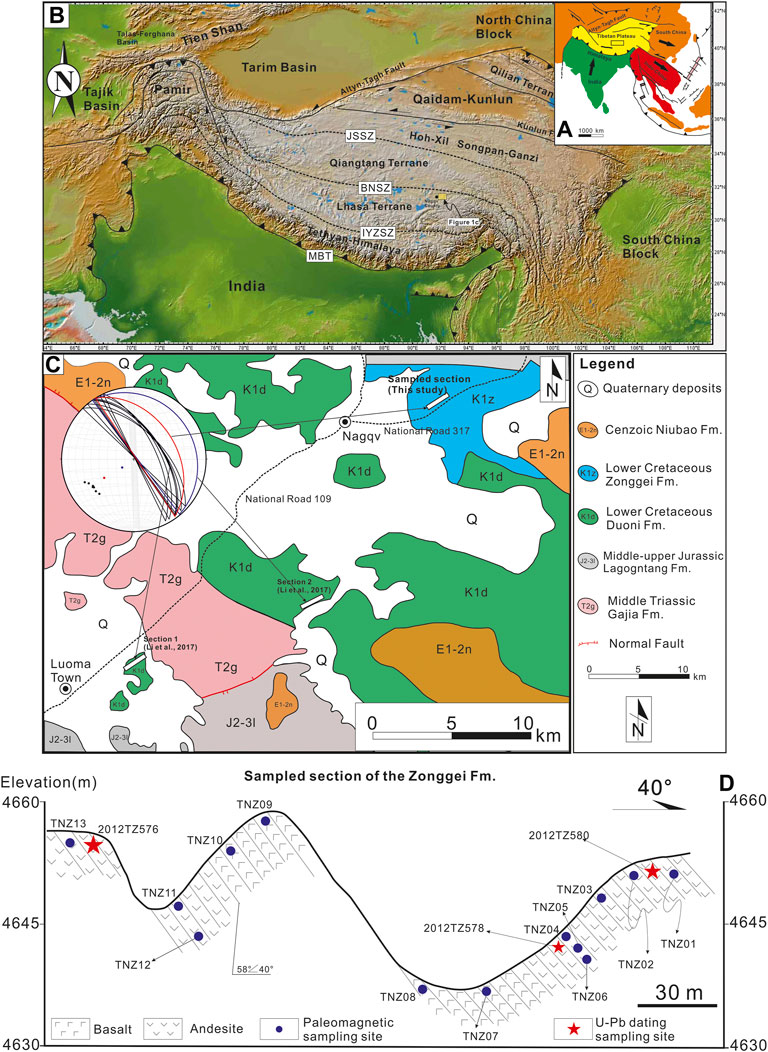
FIGURE 2. Topographic and geological map of the study area and adjoining areas on the Tibetan Plateau. (A) Tectonic framework of the Tibetan Plateau and neighboring area based on Tapponnier et al. (1982). The study area (in the Nagqu region) is located in the northern Lhasa terrane of central Tibet (enclosed by rectangle). (B) Simplified tectonic division of the Tibetan Plateau and detailed location of the study area in this study. Some abbreviations are as follows: JSSZ, Jinsha suture zone; BNSZ, Bangong-Nujiang suture zone; IYZSZ, Indus-Yarlung Zangbo suture zone; MBT, Main boundary thrust. (C) Geological map of the study area near Nagqu County (scale, 1:250,000), where the Zonggei Formation volcanic outcrops are located on the northern side of the National Highway 317, approximately 5 km northeast of Nagqu County. Stereo projection showing bedding attitudes and associated poles to the planes from sampled Section 1 and Section 2 (Li Z. et al., 2017) and the sampled section in this study. (D) Sketched cross section of the Zonggei Formation volcanic rocks we sampled on the northern side of National Highway 317; blue dots denote the paleomagnetic sampling sites, while red pentagons denote the sampling sites for U-Pb dating bulk samples.
Regionally, the Lower Cretaceous Zonggei Formation (K2z) is unconformably underlain by the Duoni Formation, which primarily comprises andesite, basaltic andesite, and andesitic breccia (BGSXAR, 2005). The Zonggei Formation volcanic rocks were previously thought to have formed in Late Cretaceous time, whereas we revise the crystallization age with updated zircon U-Pb dating results (see Section 4 below for details) that indicate Early Cretaceous (114–110 Ma) crystallization.
In the study area, there is an unconformity between the underlying Middle-Upper Jurassic Lagongtang Formation (J2-3) and the overlying Lower Cretaceous Duoni Formation (K1d). The latter is comprised of slate and medium- to fine-grained sandstone. Occasionally, the andesite and basaltic andesite of the Duoni Formation volcanic rocks are exposed. For example, volcanic lava flows are intercalated with 3–4 sandstone layers in Section 1 that were sampled in Li Z. et al. (2017) (Figures 2B,C). Several types of fossils, including Weichselia reticulata, a global standard-type fossil with a characteristic Lower Cretaceous age, Pernidella sp., Spongiom orphan sp., and Coniopteris sp., were reported from sedimentary layers in the Duoni Formation (BGSXAR, 2005). Furthermore, previous research provides the dating results of ∼120 Ma for the Duoni Formation volcanic rocks (Li, Z-Y et al., 2017). Therefore, based on reported radiometric dating results and fossils, the Duoni Formation is Early Cretaceous in age. In the field, the Zonggei Formation volcanic lava flows, the Duoni Formation lava flows, and sedimentary sandstone layers (documented by Li, Z-Y et al., 2017) dip 16°–60° to the northeast in the study area (i.e., striking E-W and NW-SE) (Figures 2C,D; Table 1). This tilting of the Zonggei Fm. volcanics and the Duoni Fm. volcano-sedimentary rocks was chiefly caused by the folding activity that occurred during the onset of the India–Asia collision and is hence constrained to the early Cenozoic time (BGSXAR, 2005).
TABLE 1
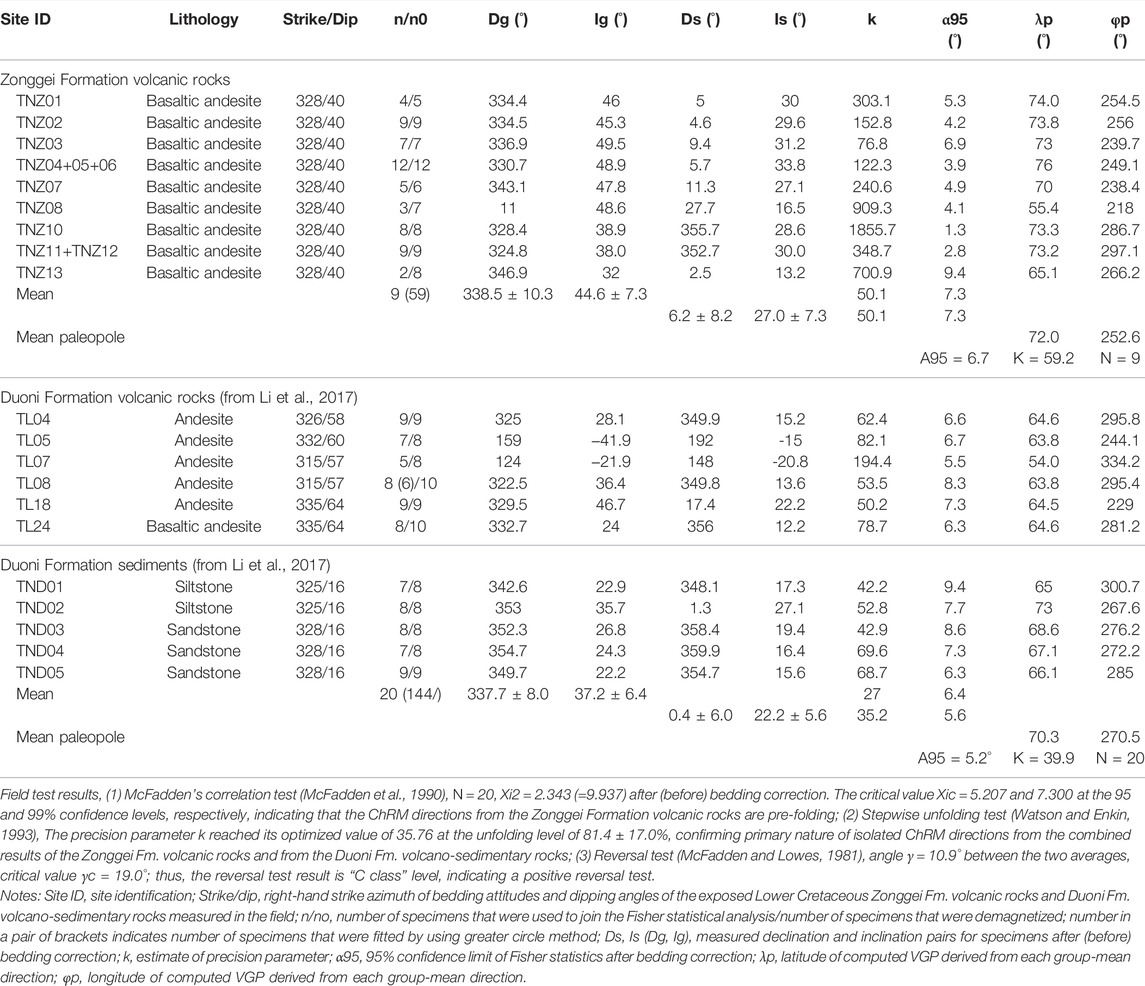
TABLE 1. Summary of all ChRM group-means of the Zonggei Fm. volcanic rocks and selected results from the Duoni Fm. volcano-sedimentary rocks.
3 Sampling and Methods
Three bulk samples, each weighing 1–2 kg, were collected for radiometric dating from freshly exposed volcanic rocks in the sampled section along the northern side of National Highway 317 approximately 8 km northeast of Nagqu County.
The zircon U-Pb dating method (see Supporting Information for details) was used to date the Zonggei Formation volcanic rocks, whereas stepwise thermal demagnetization techniques were used to resolve ChRM directions. When combined, these data provide a paleolatitude for the Lhasa terrane during the Early Cretaceous time. In total, 108 independently oriented paleomagnetic samples were drilled from 13 paleomagnetic sites in the Zonggei Formation. The sampled outcrops are distributed along the northern side of National Highway 317 within Nagqu County (GPS coordinates: 31.48°N, 92.1028°E) (Figures 2C,D).
Within each site, 8–9 independently oriented paleomagnetic samples were collected in a small area (∼1 m) using a portable gasoline-powered drill (Figure 2D). All samples were oriented in situ using both magnetic and sun compasses where possible. The differences between the readings of the two compasses were limited to ±2°; hence, corrections were not necessary. At the sampling site (31.48°N, 92.1°E), the present geomagnetic field (PGF) and present dipole field (PDF) directions-Dec = 0.06°, Inc = 48.78° and Dec = 0.0°, Inc = 50.77°—were calculated based on the IGRF_2020 and geocentric axial dipole (GAD) models, respectively. Additionally, we used techniques including petrographic investigations and rock magnetic experimental work to determine the compositions of the dominant remanence carriers and to monitor possible chemical alterations and mineralogical phase transformations during the complete heating–cooling cycle under air atmosphere. Please refer to Section 5 Magnetic Mineralogy and Petrography below for further details.
4 Zircon U-Pb Dating
The zircon U-Pb dating results from the three bulk samples (2012TZ576, 2012TZ578, and 2012TZ580) are 114.0 ± 0.8 Ma (MSWD = 3.1, n = 18) (2012TZ576), 111.2 ± 0.7 Ma (MSWD = 5.4, n = 20) (2012TZ578), and 110.5 ± 0.4 Ma (MSWD = 1.5, n = 23) (2012TZ580) (Figure 3; Supplementary Table S2 in Supporting Information). Therefore, the Zonggei Formation volcanic rocks formed at ∼114–110 Ma, indicating an emplacement age during the late Aptian to early Albian time.
FIGURE 3
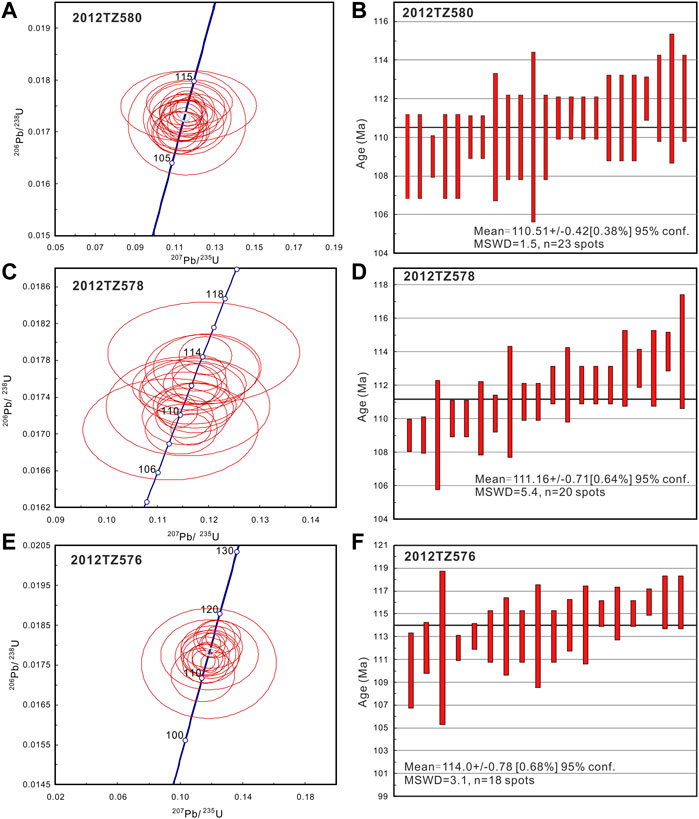
FIGURE 3. Diagrams showing concordant ages (left column) and weighted mean ages (right column) for dating samples of the Zonggei Formation volcanic rocks in this study. (A,B) Concordant and weighted mean ages for U-Pb dating results of the sample 2012TZ580, collected from the Zonggei Formation volcanic rocks near paleomagnetic site TNZ01 (see Figure 2D for details). (C,D) Concordant and weighted mean ages for U-Pb dating results of the sample 2012TZ578, collected from the Zonggei Formation volcanic rocks near paleomagnetic site TNZ04 (see Figure 2D). (E,F) Concordant and weighted mean ages for U-Pb dating results of the sample 2012TZ576, collected from the Zonggei Formation volcanic rocks near paleomagnetic site TNZ13 (see Figure 2D). See Supporting Information Supplementary Table S2 for detailed data on the U-Pb isotopic compositions and dating results.
5 Magnetic Mineralogy and Petrography
5.1 Rock Magnetism
Typical rock magnetic analyses including magnetic hysteresis parameters (i.e., the saturated magnetization Ms, the saturated remanent magnetization Mrs, and coercivity Hc), isothermal remanent magnetization (IRM) acquisition curves, and the backfield demagnetization of saturated IRM were performed using a Model 3900 vibrating sample magnetometer (provided by Princeton Instruments). These data were used to identify the dominant remanence carriers that reside in the paleomagnetic specimens of the Zonggei Formation volcanic rocks and set appropriate stepwise demagnetization schemes and steps for paleomagnetic specimens. In addition, the temperature dependence of magnetic susceptibility for some pilot samples was also measured. This process involved a complete heating–cooling cycle from room temperature to the maximum temperature of 700°C under air atmosphere. Measurements were completed using an MFK-1-FA device (AGICO Instruments Company) coupled to a CS-4 temperature control apparatus. Selected samples were crushed and milled to powder before analysis. All rock magnetic measurements were completed at the Paleomagnetism and Geochronology Laboratory (PGL), Institute of Geology and Geophysics, Chinese Academy of Sciences (IGGCAS).
5.1.1 Hysteresis Loops, Isothermal Remanent Magnetization Acquisition Curves, and Backfield Demagnetization Experiments
Hysteresis loops, IRM acquisition curves, and backfield demagnetization curves were measured for representative samples of the Zonggei Formation volcanic rocks. All experiments were conducted in a room-temperature environment (see Figure 4). Some samples exhibit typical wasp-waisted hysteresis loops (e.g., TNZ01-8) (Figure 4A), suggesting the presence of two or more magnetic minerals with contrasting coercivities (i.e., the existence of both low- and high-coercivity magnetic mineral grains such as titanomagnetite and hematite) (Tauxe et al., 1996). In this type of hysteresis loop, the coercivity is typically less than 100 mT. Furthermore, the corresponding IRM acquisition curves show a rapid increase below 200 mT, which acquired some 80% of the SIRM, suggesting the presence of low-coercivity magnetic mineral grains. However, it is worth noting that the IRM intensity increases gradually above 200 mT and the saturation is still not fully reached at 1.5 T, indicating the presence of high-coercivity magnetic mineral grains such as hematite grains in the samples (Figure 4). This is also verified through the temperature dependence of the magnetic susceptibility experiments discussed below.
FIGURE 4
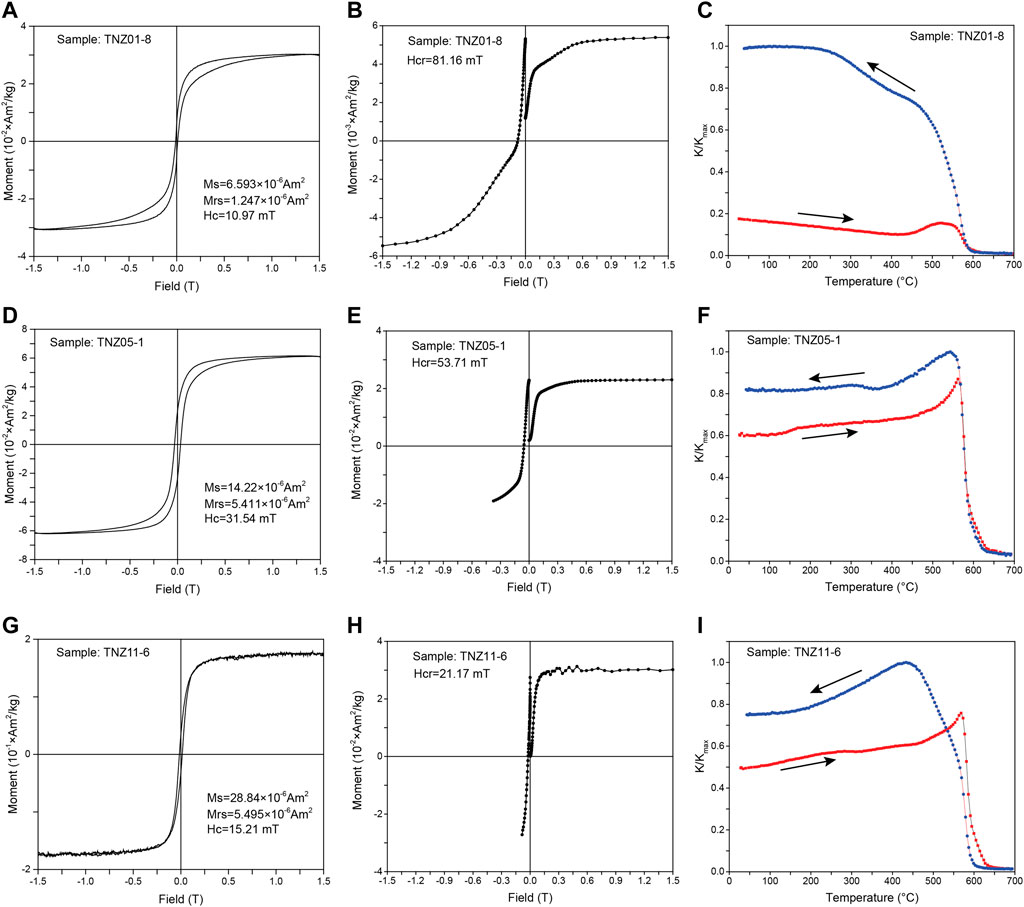
FIGURE 4. Rock magnetic results for selected samples from the Zonggei Formation volcanic rocks. (A,D,G) hysteresis loops and detailed values of hysteresis parameters for representative samples; (B,E,H), IRM acquisition curves and backfield demagnetization of saturated IRM for representative samples; (C,F,I) temperature dependence of magnetic susceptibility curves (heating-cooling cycle from room temperature up to 700°C).
The second type of hysteresis loop is broadly similar to the third type (Figure 4D) but has a higher coercivity value. In the second type of hysteresis loop (TNZ05-1) (Figure 4D), the data also show a wasp-waisted loop but not as clearly as in sample TNZ01-8. The hysteresis loop is completely closed at 1.5 T, indicating that low-coercivity magnetic mineral grains dominate the magnetic components in the sample. The IRM acquisition curves and backfield demagnetization curves also corroborate this hypothesis. The IRM acquisition curve increases rapidly below 200 mT, and it then increases gradually until it is fully saturated at 1.5 T (Figure 4E), indicating the dominance of soft magnetic components (i.e., low-coercivity magnetic mineral grains) in the samples.
The third type of hysteresis loop clearly shows that low-coercivity magnetic mineral grains (Figure 4G) dominate the magnetic components, and these grains are likely Ti-poor titanomagnetite (or magnetite) grains with coercivity values much lower than 100 mT. The IRM acquisition curves and backfield demagnetization curves also exhibit that the saturation was fully reached below 200 mT (Figure 4H), confirming that the soft magnetic component dominates the magnetic minerals.
5.1.2 Temperature Dependence of the Magnetic Susceptibility Measurements
To further check the magnetic minerals and monitor possible chemical alterations and phase transformations of magnetic minerals, an assessment of the temperature dependence of magnetic susceptibility was also performed at the PGL in IGGCAS. All six samples exhibit a remarkable decrease in magnetic susceptibility near the Curie point of stoichiometric magnetite grains (∼585°C) during a complete heating–cooling cycle (see Figures 4C,F,I). Moreover, all samples show that the heating curves are significantly lower than the cooling curves, which could be reasonably explained by the exsolution of a small portion of magnetic mineral grains such as titanomagnetite into strong magnetic minerals such as magnetite grains during the heating–cooling cycle (Dunlop and Özdemir, 1997). Additionally, it is worth noting that some samples show a minor decrease in magnetic susceptibility at approximately 650°C –700°C (TNZ01-8 and TNZ05-1) (Figures 4C,F), which is very close to the Neél temperature of hematite (∼680°C), indicating the presence of hematite grains in these samples. Given that the magnetic susceptibility of titanomagnetite is hundreds of times that of hematite, we speculate that these kinds of samples are dominated by hematite grains, which are supported by the hysteresis loops, IRM acquisition curves, petrographic investigations, and stepwise thermal demagnetization results below. In summary, we postulate that both Ti-poor titanomagnetite and hematite grains are the dominant remanence carriers in the samples of the Zonggei Formation volcanic rocks.
5.2 Petrography
We selected representative samples to perform petrographic investigations to reflect the textures of samples and mineral compositions, grain shapes, sizes, and mineral distribution in bulk samples (see Figure 5, Figure 6).
FIGURE 5
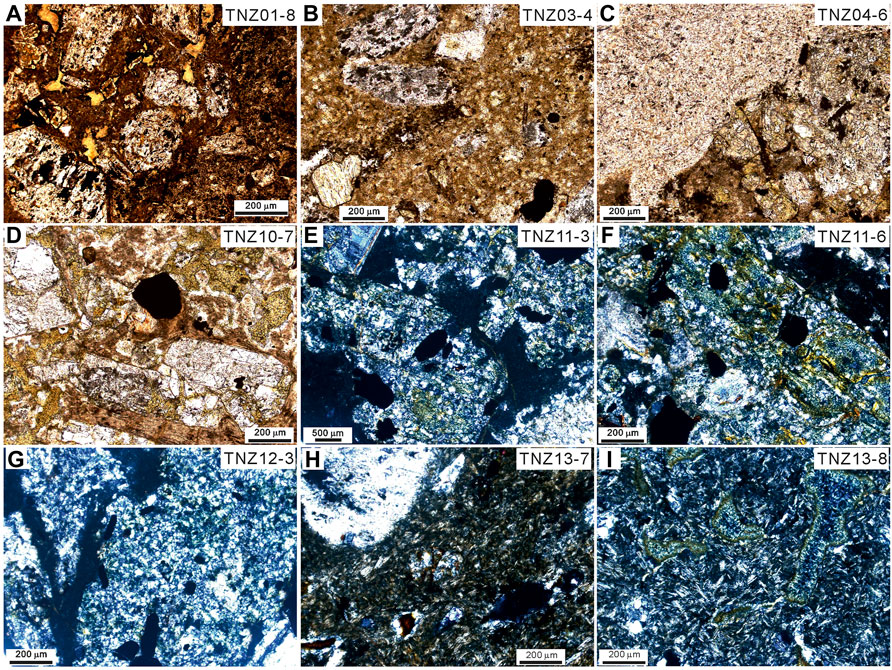
FIGURE 5. Transmitted-light (A–D) and cross-polarized-light (E–I) photomicrographs for representative samples of the Lower Cretaceous Zonggei Formation volcanic rocks.
FIGURE 6
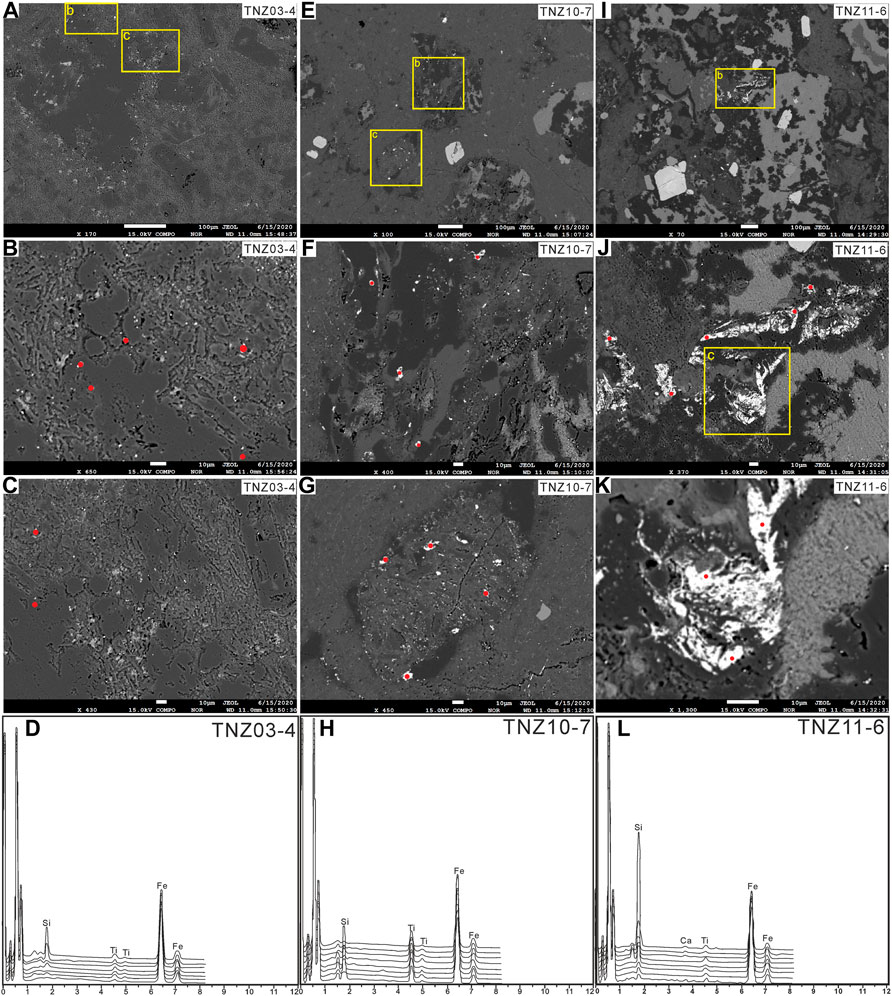
FIGURE 6. BSE images and EDS analysis for representative samples from the Zonggei Formation volcanic rocks. The red-colored dots in subfigures of (B,C), (F, G), and (J,K) indicate spots where the EDS analyses were performed. Measurements and analytical results are shown in subfigures (D,H,L). Areas enclosed by yellow rectangles are enlarged in subsequent subfigures.
A microscopic examination of representative samples was performed using an electron probe microanalyzer (EPMA) (JXA-8230, JEOL) set in back-scattering electron (BSE) imaging mode with an acceleration voltage of 15 kV and a working distance of 11.0 mm. This instrument is installed at the Laboratory of Continental Collision and Plateau Uplift (LCPU), Institute of Tibetan Plateau Research (ITPCAS). The examination sought to check whether the hematite particles in some paleomagnetic samples were produced by low-temperature oxidation from original Ti-poor titanomagnetite and determine the diagenetic conditions of different magnetic minerals. Polished samples were carbon-coated before analysis and energy-dispersive spectrometer (EDS) measurements were carried out by utilizing an EPMA equipped with an X-Max 50 EDS analyzer (provided by the OXFORD Instruments PLC, Abingdon, United Kingdom).
BSE analysis shows that most samples are dominantly porphyritic and consist of long strip-shaped microcrystalline plagioclase and interstitial irregular Fe-oxide and pyroxene grains ranging in size from 5 to 20 μm and conspicuously lacking oxidized rims (Figure 5, Figure 6). This rules out the possibility of pervasive low-temperature oxidation. Furthermore, the presence of these magnetic grains is consistent with a primary magmatic origin rather than secondary oxidation (Huang, et al., 2015).
In summary, we interpret the Fe-O minerals in our samples to be Ti-poor titanomagnetite and hematite based on BSE, EDS, and rock magnetic analyses (Figure 4, Figure 5, Figure 6). Moreover, the EPMA data suggest that both magnetite and hematite grains were formed from the exsolution of Ti-poor titanomagnetite particles rather than low-temperature oxidation processes that post-date the cooling of the lavas. This interpretation is further supported by the demagnetization behaviors of the paleomagnetic specimens from the Zonggei Formation volcanic rocks below (Figure 7).
FIGURE 7
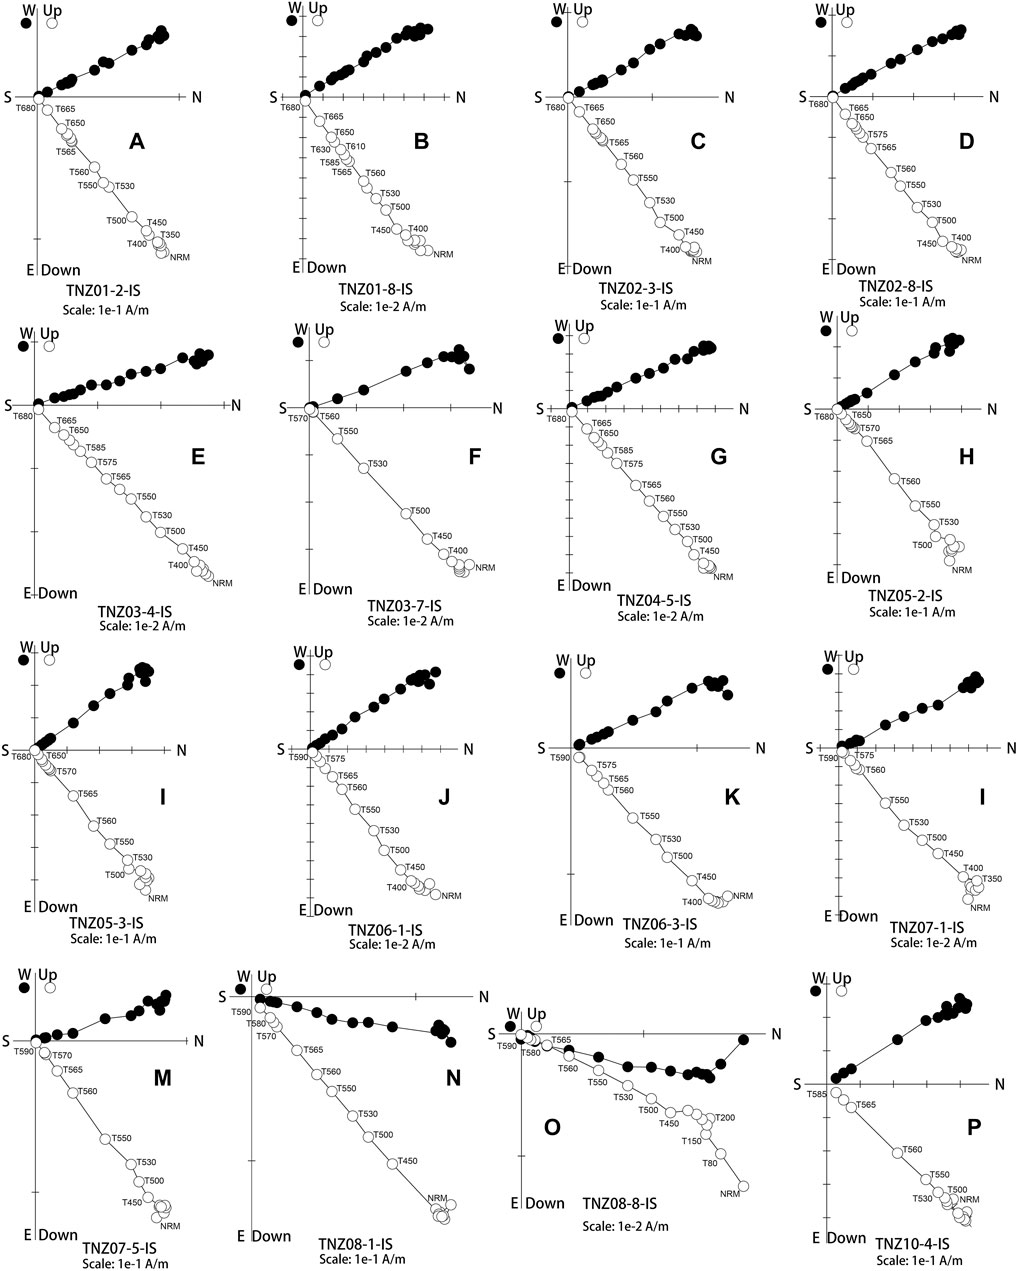
FIGURE 7. Orthogonal vector projection of thermal demagnetization results for representative specimens of the Lower Cretaceous Zonggei Formation volcanic rocks, which are plotted in geographic coordinates. Closed (open) circles represent projection of vector end-points onto the horizontal (vertical) plane. Thermal (°C) demagnetization steps are labeled with the capital letter T and are followed by the temperature step (e.g., T500).
6 Paleomagnetic Procedures
All paleomagnetic specimens were subjected to a progressive thermal demagnetization inside a magnetically shielded room with a residual magnetic field of <300 nT at the Paleomagnetism and Environmental Magnetism (PMEM) Laboratory, China University of Geosciences (Beijing). An ASC-48 thermal demagnetizer with a residual magnetic field of <10 nT inside the oven and JR-6A dual-speed spinner magnetometer (AGICO Instruments Company) were used. The temperature increments for stepwise thermal demagnetization were set to 50°C at low temperatures and decreased to 5°C–10°C at high temperatures when the maximum unblocking temperatures of Ti-poor titanomagnetite (∼575°C) and titanohematite (∼680°C) were nearly reached. Subsequently, we projected our thermal demagnetization results onto orthogonal vector diagrams (Zijderveld, 1967) and isolated different magnetic components by using principal component analysis (Kirschvink, 1980). The software packages PmagPy (Tauxe et al., 2016, https://earthref.org/PmagPy), the online paleomagnetic analysis portal Paleomagnetism.org (version 2.2.0) (Koymans et al., 2016, 2020), PMGSC (version 4.2) (Enkin, 1994), and PaleoMac (Cogné, 2003) were used to analyze paleomagnetic direction data, statistical analysis, and plot data. The statistical analysis of different isolated magnetic components was performed by using Fisher statistics (Fisher, 1953).
7 Paleomagnetic Results
In total, we thermally demagnetized 72 out of 108 specimens from 13 paleomagnetic sites. Northward-seeking and downward high-temperature directions were successfully resolved from 59 specimens, and no reversed polarity direction data were found in any of these specimens (Figure 7; Table 1). This is consistent with the statistical analysis of these isolated 59 high-temperature components (HTCs) (Figure 8), which are consistent with characteristics of the Cretaceous Normal Superchron (CNS, 123–83 Ma) (Olierook et al., 2019).
FIGURE 8
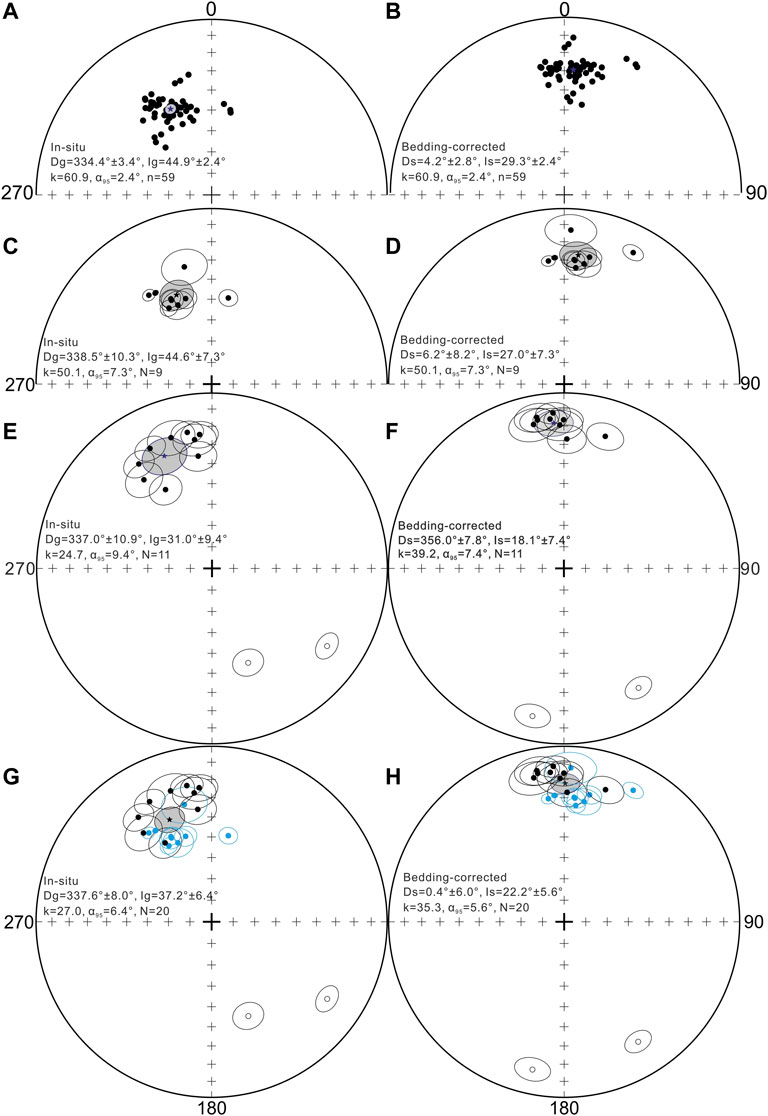
FIGURE 8. Equal-area projections of isolated site-mean ChRM directions with corresponding 95% confidence ellipses before and after tilt correction (left and right columns). (A,B) Equal-area projections of filtered ChRMs from isolated 59 specimens of the Lower Cretaceous Zonggei Formation volcanic rocks with Fisher mean and corresponding 95% confidence ellipses before and after tilt correction (left and right columns); (C,D) equal-area projections of site-mean ChRM directions isolated from 9 group-means of the Zonggei Formation volcanic rocks with Fisher mean and corresponding 95% confidence ellipses before and after tilt correction (left and right columns); (E,F) equal-area projections of 11 site-mean directions with Fisher mean and corresponding 95% confidence ellipses of the Duoni Fm. volcano-sedimentary rocks before and after tilt correction (left and right columns); (G,H) equal-area projections of combined 9 group-mean directions of the Lower Cretaceous Zonggei Formation volcanic rocks and filtered 11 site-mean directions from results of the Duoni Formation volcano-sediments, which are derived from Li Z. et al. (2017) with Fisher means and corresponding 95% confidence ellipses before and after tilt correction (left and right columns). Solid and open symbols represent projections onto lower and upper hemisphere, respectively. Stars with light gray-colored ellipses indicate the overall mean directions and the 95% confidence limits before and after tilt correction, respectively. Blue solid circles represent the 9 group-mean directions from the Lower Cretaceous Zonggei Formation volcanic rocks in this study.
Generally, most specimens exhibit a straightforward linear trajectory toward the origin and only one single component can be resolved from the initial demagnetization step to the maximum unblocking temperatures of the magnetite and hematite present in the specimens (Figures 7A–N,P; Table 1). Additionally, two components were present in several specimens (Figure 7O), and the HTC was usually isolated, following the removal of a viscous or low-temperature component by demagnetization steps at temperatures less than 250°C –300°C.
For other sites, if each paleomagnetic site was collected from an individual lava flow, then one single site-mean direction was treated as one group-mean direction. By applying Fisher statistics to all of these groups, we obtained an average group-mean direction of D±ΔD = 6.2° ± 8.2°, I±ΔI = 27.0° ± 7.3°, α95 = 7.3°, with k = 50.1, n = 9 (D±ΔD = 338.5° ± 10.3°, I±ΔI = 44.6° ± 7.3°, α95 = 7.3°, with k = 50.1) after (before) bedding correction for the 9 group-mean directions (Figures 8C,D). The corresponding paleomagnetic pole was hence calculated to be λp = 72.0°N, φp = 252.6°E with A95 = 6.7°, K = 59.2 based on the above 9 group-mean ChRM directions (Table 1).
Li, Z.-Y. et al. (2017) also acquired meaningful paleomagnetic and geochronological results from the Duoni Formation volcano-sedimentary rocks. They collected samples from the Duoni Formation rocks in and around Luoma Town, which is ∼10–15 km south of Nagqu County (Figure 2C). Because an obvious inclination-shallowing effect was absent in their sedimentary rock specimens, they combined the Duoni Formation volcanic specimens with sandstone specimens and obtained a formation-mean direction of D±ΔD = 356.4° ± 6.3°, I±ΔI = 16.4° ± 6.3°, α95 = 6.3°, with k = 29.3, n = 19 (D±ΔD = 333.5° ± 7.4°, I±ΔI = 33.5° ± 7.4°, α95 = 7.4°, with k = 21.4) after (before) bedding correction for the Duoni Formation based on the 14 site-mean directions of volcanic rocks (Section 1 in Figure 2C) and 5 site-mean directions of sediments (Section 2 in Figure 2C).
The sampling location for this study area (Figures 2B,C) are ∼20 and ∼10 km away from Section 1 and Section 2 in Li, Z-Y et al. (2017), respectively. Given that our results are consistent with those of the Duoni Formation volcano-sedimentary rocks (120.2 ± 0.5 Ma) in Li, Z-Y et al. (2017), we established data selection criteria and selected data from the results of the Zonggei Formation volcanic rocks (9 group-mean directions) and the results of the Duoni Formation volcano-sedimentary rocks (11 sites). These were incorporated into a combined group-mean direction over these two formations (Figures 8G,H; Table 1). Subsequently, we obtained a combined data set that includes 20 group-mean directions from the Zonggei Formations volcanic rocks and the Duoni Formation volcano-sedimentary rocks. Accordingly, the statistical analysis of these combined 20 group-mean directions yields the following: D±ΔD = 0.4° ± 6.0°, I±ΔI = 22.2° ± 5.6°, α95 = 5.6°, with k = 35.3 (D±ΔD = 337.7° ± 8.0°, I±ΔI = 37.2° ± 6.4°, α95 = 6.4°, with k = 27) after (before) bedding correction.
The combined 20 group-mean directions show that the precision parameter k-value and associated parameter α95 improved significantly after grouping compared to the Fisher mean direction before bedding correction (Figures 8G,H; Table 1). In addition, the overall 20 group-mean directions pass the reversal test at the 95% confidence level (class C: γangle = 10.9°, γcritical = 19.0°) (McFadden and Lowes, 1981; McFadden and McElhinny, 1990) and fold tests (see Table 1; Supplementary Figure S1 in Supporting Information) (McFadden, 1990; Watson and Enkin, 1993), indicating a prefolding origin and the primary nature of the isolated ChRM directions of the combined results.
Based on the obtained radiometric dating results and positive field test results, we conclude that the remanence magnetizations were acquired over a sufficiently long time interval to average out paleosecular variation. In this study, our data set from the Zonggei Formation volcanic rocks is exclusively taken from a single normal polarity corresponding to the Cretaceous Normal Superchron (CNS) (123–83 Ma) (Olierook et al., 2019). By combining these data with published results from the Duoni Formation volcano-sedimentary rocks, we can quantify the paleosecular variation by using the conventional method of comparing observed VGP scatter parameter Sλ to established paleosecular variation models (e.g., McFadden et al., 1991; Johnson et al., 2008). The VGP scatter parameter Sλ is defined here as Sλ=
These observations, which are consistent with paleosecular variation models, together with rock magnetic analysis (see Figure 4, Figure 5, Figure 6 for details), petrographic investigations (see Figure 5, and Figure 6 for details), and positive field tests (Table 1; Supplementary Figure S1 in Supporting Information), all support the primary nature of the remanence magnetizations of the combined analysis of the Zonggei Formation volcanic rocks and the Duoni Formation volcano-sedimentary rocks.
8 Discussion
In this study, we adopted reference poles from the well-constructed master APW paths of both Eurasian and Indian continents from 130 Ma to the present day (0 Ma) (Supplementary Table S1 in Supporting information) (Torsvik et al., 2008, 2012). For the convenience of comparison, we have calculated all paleolatitudes at the reference site (29.5°N, 91.0°E), which is on the northern bank of the Yarlung Zangbo River and represented the southernmost margin of Eurasia during the Early Cretaceous.
8.1 Precollisional Paleogeography of the Lhasa Terrane in Early Cretaceous Time
We calculated the paleolatitude at the reference site (29.5°N, 91.0°E) of the southernmost margin of the Lhasa terrane in the Early Cretaceous time to be 12.3° ± 6.7°N based on the paleomagnetic results from the Zonggei Formation volcanic rocks alone and 9.8° ± 5.2°N (Table 2) based on the combined results obtained in this study and previously published results from the Duoni Formation volcano-sedimentary rocks.
TABLE 2
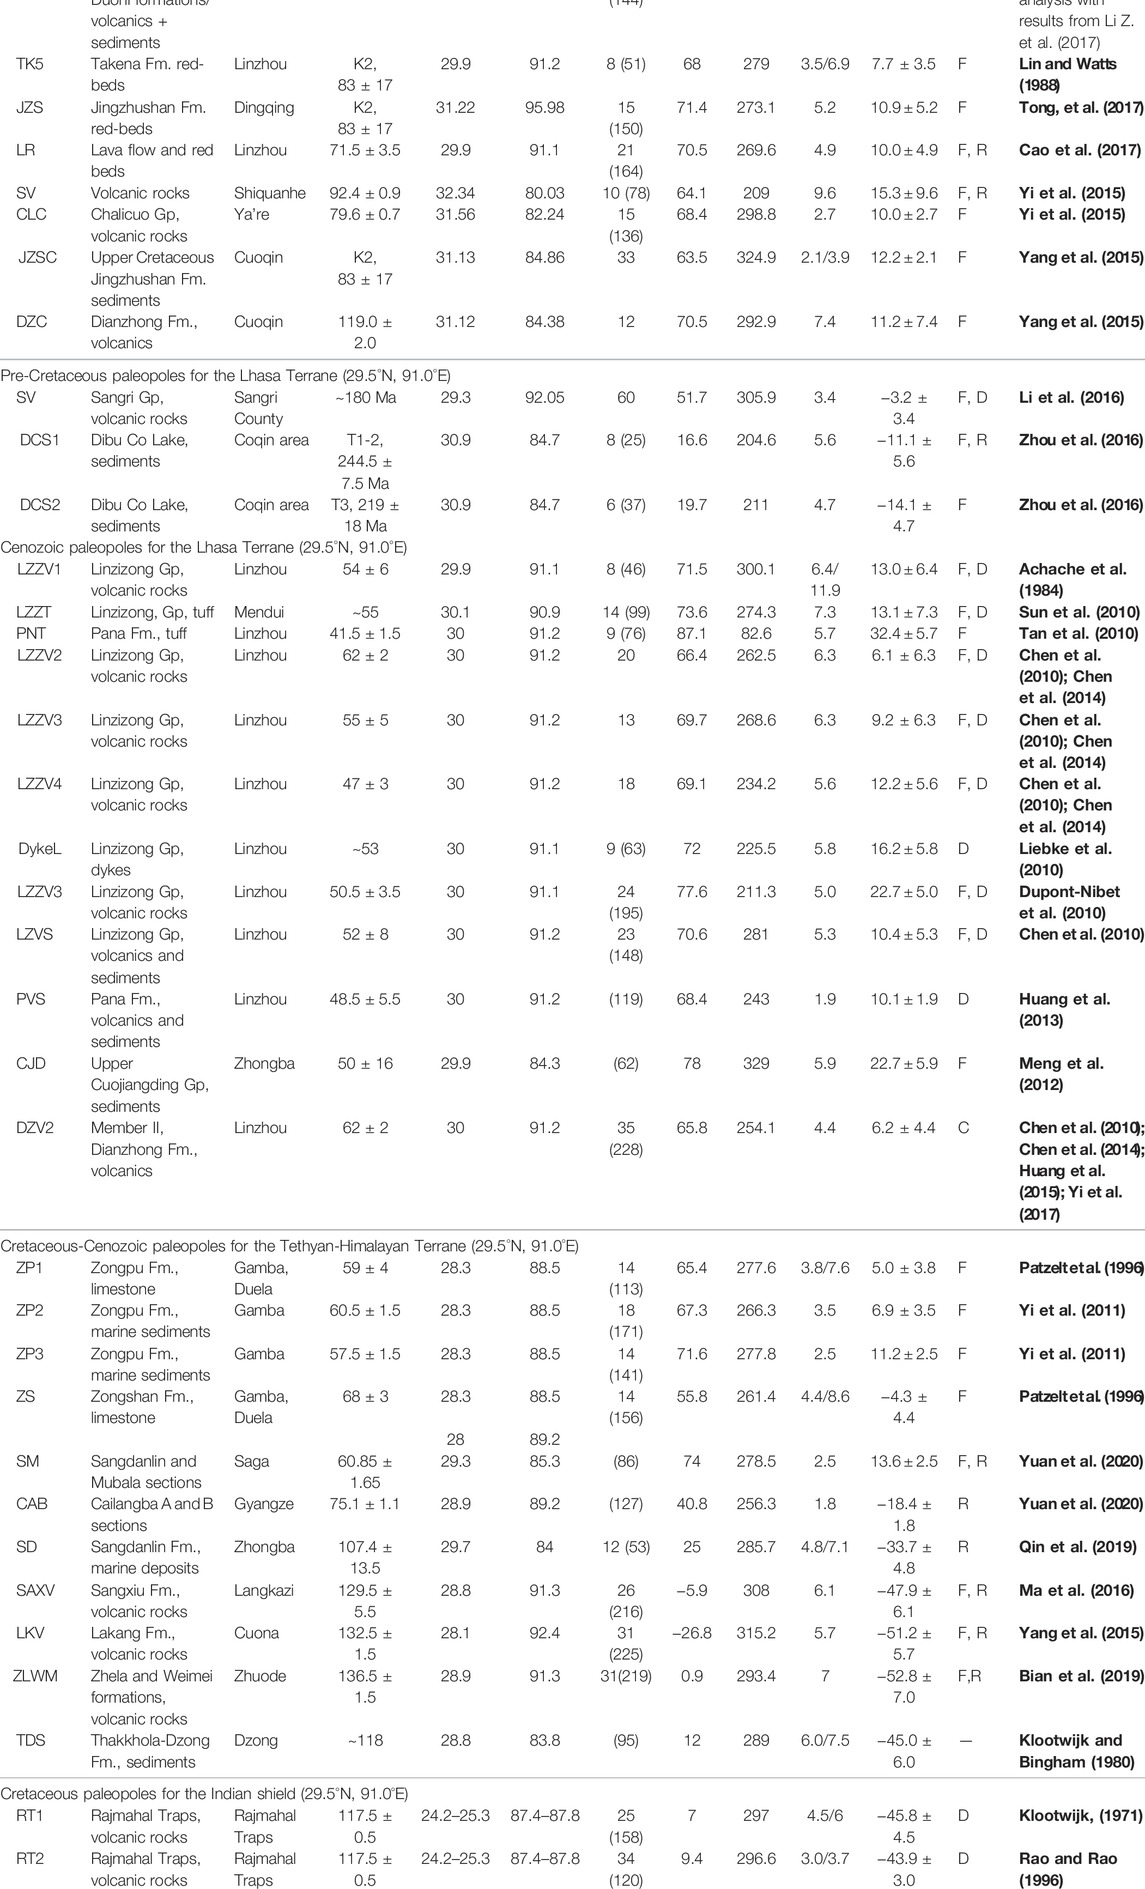
TABLE 2. Summary of Cretaceous and Early Cenozoic paleomagnetic poles from the Lhasa and Tethyan-Himalayan (two are from interior of Indian craton) terranes.
Recently, large amounts of Cretaceous and Early Cenozoic paleomagnetic results were published from northern and southern parts of the Lhasa terrane (Table 2; Figure 9, and Figure 10) (e.g., Achache et al., 1984; Besse et al., 1984; Patriat and Achache, 1984; Sun et al., 2008, 2010, 2012; Chen et al., 2010; Dupont-Nivet et al., 2010; Liebke et al., 2010; Chen et al., 2012; Meng et al., 2012; Tang et al., 2013; Ma et al., 2014; Yang et al., 2015; Yi et al., 2015; Bian et al., 2017; Cao et al., 2017; Li, Z-Y et al., 2017; Tong et al., 2017). We compiled the paleomagnetic results from English and Chinese publications, evaluated them according to the established criteria (Van der Voo, 1990; Meert et al., 2020), and divided them into two groups, namely, the Cretaceous-pole and Cenozoic-pole groups (Table 2; Figure 9).
FIGURE 9
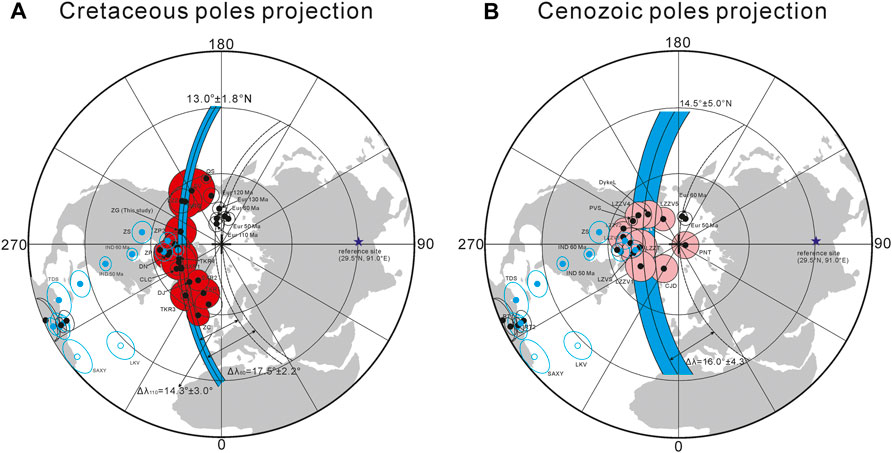
FIGURE 9. Equal-area projections showing distributions of Cretaceous paleopoles (A) and Cenozoic paleopoles (B) of the Lhasa terrane and the Tethyan Himalayan terrane based on this study and previously published results, with corresponding 95% confidence ellipses. See Table 2 in the main text for values and cited references. The deep blue star indicates the reference site (29.5°N, 91.0°E), which represents the southernmost margin of Eurasia long before the India–Asia collision when calculating the paleolatitudes of the Lhasa and Tethyan Himalayan terranes in this study. The dashed lines represent the small circle running through the reference poles of Eurasia, India, and the Tethyan Himalayan terrane centered on the reference site. (A) Black dots with red-filled circles represent the selected Cretaceous paleopoles that were fitted by the small-circle method (Mardia and Gadsden, 1977) and the corresponding 95% confidence circles; (B) black dots with pink-filled circles represent the selected Cenozoic paleopoles that were fitted by the small-circle method (Mardia and Gadsden, 1977) and corresponding 95% confidence circles. Blue dots with 95% confidence circles represent the reference poles of the Indian continent (from Torsvik et al., 2012) and the Tethyan Himalayan terrane. The light-blue strip areas with solid black line and dashed lines in (A,B) represent the small circles and corresponding 95% confidence limits passing through the selected Cretaceous and Cenozoic paleopoles centered on the reference site (29.5°N, 91.0°E) in this study, respectively. See the main text and Table 2 for details.
FIGURE 10
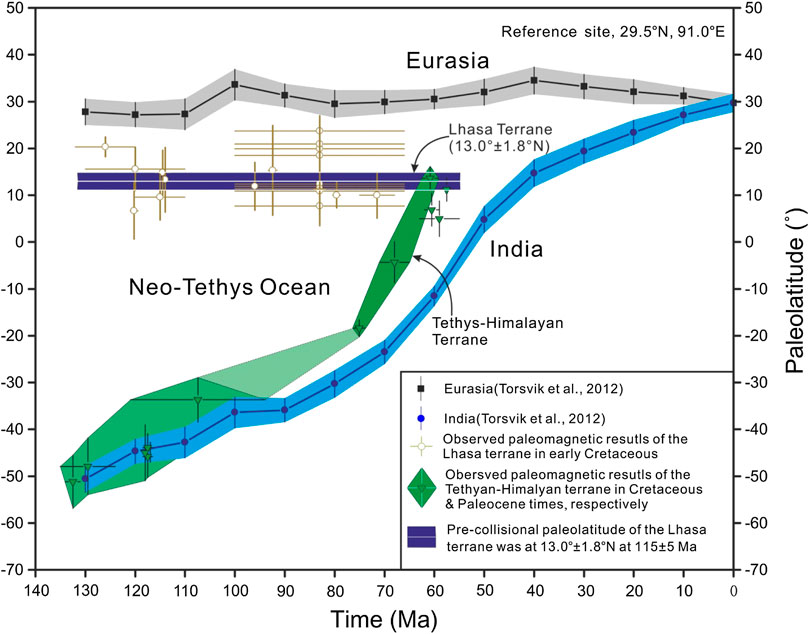
FIGURE 10. Paleolatitudes evolution of the Eurasian and Indian continents, the Lhasa terrane, and the Tethyan Himalayan terrane as a function of time. Cretaceous paleomagnetic poles of the Lhasa terrane, which were compiled from previously published results, are listed in Table 2. All paleolatitudes were calculated for the reference site (29.5°N, 91.0°E). Expected paleolatitudes of the Eurasian and Indian continents are drawn from Torsvik et al. (2008, 2012).
For the Cretaceous-pole group, a total of nineteen paleopoles were included (Table 2; Figure 9). Considering that the data of TKR2 from Westphal et al. (1983) were likely contaminated by an overprint component as noted by Achache et al. (1984), they were excluded from further analysis. Additionally, the SXV data from Tan et al. (2010) probably resulted from records with inadequately averaged paleosecular variation and were thus excluded from further analysis in this study. ZG+DN was also excluded from further analysis because it overlapped with both ZG and DN. The remaining nineteen available paleopoles (i.e., TKR1, SXR1, WRG, SXR2, TKR3, TKR4, ZC, DJ, LZZ, QS, DN, ZG, TK5, JZS, LR, SV, CLC, JZSC, and DZC) were joined in the subsequent small-circle fitting analysis (Table 2; Figure 9).
Small-circle analysis (Mardia and Gadsden, 1977) was used to fit selected poles to yield an average paleolatitude for the Lhasa terrane in the Cretaceous and Cenozoic periods, respectively (Table 2; Figure 9). In the data compilation, it is noteworthy that either the Cretaceous paleopoles or the Cenozoic paleopoles from the Lhasa terrane were aligned along a small circle, with consistent paleolatitudes that indicate that the Lhasa terrane was located within a band of 10°–15°N from the Cretaceous to Cenozoic time. Consequently, the Cretaceous-pole group yielded an average paleolatitude of 13.0° ± 1.8° centered on the reference site (29.5°N, 91.0°E), indicating a subtropical location of the Lhasa terrane during the Cretaceous time. We also applied the same analysis to the data set from the Cenozoic-pole group (Table 2; Figure 9). After data quality evaluation (Q ≥ 5 for each pole), all twelve compiled paleomagnetic data points (i.e., LZZV1, LZZT, PNT, LZZV2, LZZV3, LZZV4, DykeL, LZZV5, LZVS, PVS, CJD, and DZV2) were added to the small-circle analysis. Consequently, the analysis of the Cenozoic-pole group yielded an average paleolatitude of 14.5° ± 5.0° for the reference site (29.5°N, 91.0°E), which is consistent with the paleolatitude (13.0° ± 1.8°N) of the Lhasa terrane in the Cretaceous. In combination with the fitted paleolatitude of the southernmost margin of the Lhasa terrane in Cretaceous and Cenozoic times, the latitudinal difference Δλ in between these two periods was calculated to be 1.5° ± 4.3° (160 ± 470 km), clearly indicating that the Lhasa terrane experienced no detectable north–south convergence with respect to stable Asia from the Early Cretaceous to early Cenozoic time. This period is immediately prior to initial India–Asia collision (i.e., from at least 120 to 60 Ma). Hence, this also shows that the Lhasa terrane remained stationary at ∼10°–15°N in the Northern Hemisphere over a long period, which has been supported by many previous studies (Achache et al., 1984; Sun et al., 2008, 2010, 2012; Liebke et al., 2010; Ma et al., 2014; Yang et al., 2015; Li, Z-Y et al., 2017; Tong et al., 2017; Ma et al., 2018). The coincident paleolatitude of 13.0° ± 1.8° of the Lhasa terrane in Cretaceous time is fundamentally in accord with the results (13.1° ± 2.7°) obtained from the Duoni Formation volcano-sedimentary rocks within uncertainty (Li, Z-Y et al., 2017).
This finding is in line with geological and geophysical evidence through a large number of studies over the past three decades. Scientists have recognized that the Lhasa terrane accreted onto Eurasia shortly before or during the Early Cretaceous and has thus been amalgamated to Eurasia since that time (e.g., Yan M-D et al., 2016; Li et al., 2017a, 2017b; Chen et al., 2020). Note that a paleomagnetic study on the Yanshiping Group also argued that the Lhasa terrane had reached ∼12°N and already collided with the Qiangtang terrane as early as ∼160 Ma (Late Jurassic) and then amalgamated by mid-Cretaceous time (Yan et al., 2016). In short, we conclude that the Lhasa terrane remained at ∼13°N for at least 60–70 Myr (from 120 Ma to shortly before the India–Asia collision in the early Paleocene) and did not experience a distinct north–south plate motion with respect to Eurasia. This is because it had already become the new stable southern margin of Eurasia since at least 120 Ma.
Additionally, it is noteworthy that the geochronological and paleomagnetic results obtained from small-circle analysis (13.0° ± 1.8°N) in this study are consistent with an already published result (13.1° ± 2.7°N) from the Duoni Fm. volcano-sedimentary rocks, which are ca. 20 km southwest of the research area in this study, hence confirming the validity of these two studies and indicating the primary nature of the remanent magnetizations acquired from the Zonggei and Duoni formations.
8.2 Implications to Timing of Initial India–Asia Collision
It has been widely accepted that the IYZSZ is the tectonic boundary between the Lhasa and Tethyan Himalayan terranes (e.g., Achache et al., 1984; Patriat and Achache, 1984; Yin and Harrison, 2000; Ding et al., 2005; van Hinsbergen et al., 2011b; Hu et al., 2015, 2016a, 2016b). The intersection or overlap of the paleolatitudes of the Lhasa and Tethyan Himalayan terranes can be viewed as the beginning of the initial collision between the Indian and Eurasian continents during the early Cenozoic. This has been widely accepted by those who argue for the single-collision model.
Over the past three decades, paleomagnetists have carried out a series of studies on both sides of the Lhasa and Tethyan Himalayan terranes (Patriat and Achache, 1984; Besse et al., 1984; Patzelt et al., 1996; Sun et al., 2008, 2010, 2012; Chen et al., 2010, 2014; Dupont-Nivet et al., 2010; Tan et al., 2010; Liebke et al., 2010; Yi et al., 2011; Meng et al., 2012; Ma et al., 2014; Yang et al., 2015; Bian et al., 2017; Li, Z-Y et al., 2017; Tong et al., 2017). On the Asian side, we compiled previously published paleomagnetic data from the Lhasa terrane over the past few decades and selected them one by one by establishing a data filter based on data selection criteria (Van der Voo, 1990; Meert et al., 2020). A new paleopole (λp = 72.0°N, φp = 252.6°E, with A95 = 6.7°) from the Zonggei Fm. alone indicates that Lhasa was at 12.3° ± 6.7°N. Moreover, as discussed above, further analysis using the small-circle fitting technique (Mardia and Gadsden, 1977) indicates that the Lhasa terrane stayed at 13.0° ± 1.8°N.
Notably, the Lhasa terrane experienced very limited latitudinal movement (1.5° ± 4.3°) (160 ± 470 km) from 120 Ma to the early Cenozoic immediately before the initial India–Asia collision (Sun, Z-M et al., 2010, 2012; Ma et al., 2014; Yi et al., 2015; Li, Z-Y et al., 2017) (Figure 9), suggesting that the Lhasa terrane remained almost stationary throughout 120–60 Ma (Yang et al., 2015; Li, Z-Y et al., 2017; Tong et al., 2017). Therefore, the precollisional paleogeography of 13.0° ± 1.8°N for the Lhasa terrane during the Early Cretaceous time can be used to represent the stable southernmost margin of Eurasia at the time immediately before the initial contact between India and Asia.
On the Indian side (including the Tethyan Himalaya), paleomagnetists have obtained meaningful results from the Zongpu and Zongshan formations in the Gamba and Duela areas, respectively (Patzelt et al., 1996). Yi et al. (2011) later carried out an integrated study on the Zongpu Formation in the Gamba area and obtained two paleopoles located at λp = 67.3°N, φp = 266.3°E with A95 = 3.5° at 60.5 ± 1.5 Ma and λp = 71.6°N, φp = 277.8°E with A95 = 2.5° at 57.5 ± 1.5 Ma. These two data sets are widely accepted to be of high quality. Nevertheless, in recent years, some authors have argued that based on petrographic investigations, the dominant remanence carriers present in the Zongpu Fm. carbonates in the Gamba area are framboidal magnetite particles, i.e., diagenetic products, which are not consistent with a detrital or biogenic origin (Huang et al., 2017a; 2017b). In other words, the Zongpu Fm. carbonate rocks have likely been chemically remagnetized (Huang et al., 2017a). These new findings challenge the reliability of the resolved ChRMs from the Zongpu carbonate rocks in the Gamba area. Subsequently, Yi et al. (2017) conducted a detailed reanalysis of the paleomagnetic data sets obtained from the Zongpu Fm. and concluded that the ChRMs resolved from the Zongpu limestone are probably associated with early diagenetic minerals instead of the product of later chemical remagnetization. Thus, the paleomagnetic results of the Zongpu limestones are indeed suitable for paleogeographic reconstruction. Similarly, Roperch and Dupont-Nivet (2021) also proposed that these Paleocene carbonates are more likely of early diagenetic origin. They suggested that the previously interpreted widespread remagnetization across the Tibetan Plateau should be reassessed with caution.
Scholars from Peking University (Beijing, China) also made a systematic work on magnetic extracts by using petrography. They observed a large amount of SD euhedral magnetite particles residing in carbonate rocks in the Gamba area, which are consistent with a detrital or biogenic origin (Zhao, 2021; Zhao et al., 2021). Both types of magnetite particles can faithfully record paleomagnetic directions over billions of years (Kirschvink and Lowenstam, 1979; Taduno et al., 2006; Taduno et al., 2010).
It is worth noting that several lines of evidence from other research areas also argue for the primary nature of the ChRM directions resolved from the Zongpu Fm. carbonates in the Gamba area. These lines of evidence include the following: 1) the isotopic records of carbon and oxygen from bulk carbonate at Gamba spanning the key interval of the Paleocene-Eocene thermal maximum are well consistent with the carbon isotope records from the Ocean Drilling Program site 690, indicating no sign of any alteration of these geological records in later periods (Zhang et al., 2019). 2) The photomicrographs of carbonate rock samples in Huang et al. (2017a) and section A of Yi et al. (2011) displaying well-preserved fossils (including benthic foraminifer, echinoderm, ostracod, and green algae with particles/matrix) do not show any signs of orogenic fluids (Li and Hu, 2020). 3) The isotopic ratios of strontium (87Sr/86Sr) from calcite match well with the global oceanic strontium isotope record, indicating that the carbonates in the Gamba area have not been altered by orogenic fluids (Wang et al., 2008). In addition, the presence of abundant detrital and biogenic magnetite particles identified in the Zongpu Fm. limestone rules out the possibility of widespread chemical remagnetization in the Gamba area (Zhao, 2021; Zhao et al., 2021). Therefore, these lines of key evidence, as well as analytical results, suggest that the ChRMs resolved from the Zongpu carbonates in the Gamba area (Patzelt et al., 1996; Yi et al., 2011) are of primary origin and hence can be used for paleogeographic reconstruction.
As previously highlighted, recent research provides two new poles of λp = 40.8°N, φp = 256.3°E with A95 = 1.8° at 76.2–74 Ma (i.e., 75.1 ± 1.1 Ma) from the Cailangba sections (A and B) located in the Gyangze area and λp = 74.0°N, φp = 278.5°E with A95 = 2.5° at 62.5–59.2 Ma (i.e., 60.85 ± 1.65 Ma) from the Sangdanlin and Mubala sections in the Saga area (Yuan et al., 2020). Given that these two newly obtained paleopoles can be directly compared to paleopoles from the uppermost Cretaceous Zongshan Formation in the Gamba and Duela areas (Patzelt et al., 1996; Yi et al., 2011), we are in favor of using the paleopoles derived from these two studies (Patzelt et al., 1996; Yuan et al., 2020) to calculate the exact paleolatitudes of the Tethyan Himalayan terrane (representing the northernmost margin of Greater India at the time) immediately before the initial India–Asia collision. Thus, the paleolatitudes of the Lhasa and Tethyan Himalayan terranes in early Cenozoic time can be compared to infer the accurate timing of the India–Asia.
The northernmost margin (i.e., Tethyan-Himalayan terrane) of Greater India is calculated to have been located at −18.4° ± 1.8°S at 75.1 ± 1.1 Ma and at −4.3° ± 4.4°S at 71–65 Ma (68 ± 3 Ma) (Figure 10; Table 2) based on the available data sets. From the perspective of the rate of northward motion, the Tethyan-Himalayan terrane moved northward consistently with the Greater Indian plate at a velocity of ∼225–270 mm/yr (i.e., 225–270 km/Myr) during the time interval of ∼75.1–60.85 Ma (Table 2) and had already passed the equator and reached the paleolatitude of 13.6° ± 2.5°N in the Northern Hemisphere by ∼62.5–59.2 Ma (60.85 ± 1.65 Ma) (Figure 10; Table 2). Thus, the paleolatitude of the Tethyan Himalayan terrane had already overlapped that of the southernmost margin of the Lhasa terrane by 60.85 ± 1.65 Ma. In other words, the initial contact between these two continental terranes should have taken place earlier than 60.85 ± 1.65 Ma.
If we use the northward movement rate of the Tethyan Himalayan terrane based on the already published results (see the previous discussion of the calculated the paleolatitudes of the Tethyan Himalayan terrane at different times) (Table 2), then the northernmost margin of the Tethyan Himalaya moved northward at a velocity of ∼225–270 mm/yr during the time interval of ∼75.1–60.85 Ma and ∼277.89 mm/yr during the time interval of ∼68–60.85 Ma. Thus, it is reasonable to conservatively use a northward movement velocity of 225 mm/yr (225 km/Myr) here for the northward convergence rate of the Tethyan Himalayan terrane to estimate when and where these two continents collided. Under this assumption, starting at ∼68 Ma, the paleolatitude of the Tethyan Himalaya shifts northward with decreasing age and some 6.35 Myr later falls within the 95% confidence interval of the paleolatitude of the Lhasa terrane, indicating that the paleolatitude of the Tethyan Himalayan terrane intersected the coeval paleolatitude of the Lhasa terrane. In other words, at as late as 61.7 ± 3.0 Ma (i.e., 64.7–58.7 Ma) (Figure 10), the northernmost margin of the Greater Indian continent started to collide with the southernmost margin of the Eurasian continent, so the initial India–Asia collision very likely occurred during the period of 64.7–58.7 Ma (Figure 10). Our result agrees well with the previous estimate (59.3 Ma) from the Duoni Formation volcano-sedimentary rocks (Li Z. et al., 2017).
This accurate estimate of the timing of the collision between the Lhasa terrane to the north and the Tethyan Himalayan terrane to the south can be viewed as the onset of the India–Asia collision if the single-collision model is favored. Thus, our data set indicates that the initial India–Asia collision likely occurred at 13.0° ± 1.8°N during the period of 64.7–58.7 Ma (i.e., 61.7 ± 3.0 Ma) under the assumptions that the Tethyan Himalayan terrane moved northward at the velocity of 225 mm/yr and there was no relative motion between the Tethyan Himalayan terrane and the rest of the cratonic India subcontinent, which is highly consistent with previous estimates (Patriat and Achache, 1984; Klootwijk et al., 1992; Copley et al., 2010; van Hinsbergen et al., 2011a; Torsvik et al., 2012).
Moreover, for clarity, we also consider the timing of the onset of the India–Asia collision by using the fitted Cenozoic paleolatitude of 14.5° ± 5.0°N to represent the southernmost margin of the Lhasa terrane under the assumption of the single-collision model. Then, following the analytical method we used before, it can be calculated that the timing of the onset of the India–Asia collision is 64.2–58.2 Ma (61.2 ± 3.0 Ma), which is in excellent agreement with the timing of the onset of the India–Asia collision based on a fitted Cretaceous paleolatitude of 13.0° ± 1.8°N for the southernmost margin of the Lhasa terrane at the 95% confidence limit. In other words, these results are mutually consistent with each other at the 95% confidence limit.
Therefore, here, we use the fitted Cretaceous paleolatitude of 13.0° ± 1.8°N as the southernmost margin of the Lhasa terrane before the India–Asia collision because 1) abundant paleomagnetic studies also support this conclusion (in other words, other paleomagnetists have demonstrated the validity of using the Cretaceous paleolatitude of the Lhasa terrane to represent the paleolatitude immediately before the India–Asia collision (e.g., Achache et al., 1984; Lin and Watts, 1988; Sun Z-M, et al., 2008, 2012; Chen W-W et al., 2012; Tang X-D et al., 2013; Ma Y-M et al., 2014; Yang et al., 2015; Yi Z-Y et al., 2015; Bian et al., 2017; Cao et al., 2017; Li Z. et al., 2017; Tong Y-B et al., 2017); 2) Cenozoic paleomagnetic data sets were acquired from red beds and volcanic rocks spanning the time interval of 62–41.5 Ma, a part of which postdates the India–Asia collision (thus, the use of Cenozoic data sets to discuss timing of the onset of the India–Asia collision introduces post-collisional effects); and 3) we used the fitted paleolatitude of the Lhasa terrane in Cretaceous time to represent the paleolatitude of the Lhasa terrane shortly before the India–Asia collision occurred in early Cenozoic time because this is the interpretation we made based on the data set obtained firsthand (i.e., Zonggei Fm. volcanics) in combination with previously published Cretaceous results. This is also a reasonable interpretation for our paleomagnetic data set from the Zonggei Fm. volcanics. Thus, given the originality of this batch of paleomagnetic data set, it is clear that we also demonstrate the robustness of the previously obtained paleomagnetic results from the Duoni Fm. volcano-sedimentary rocks (Li Z. et al., 2017). In short, our analysis of the fitted Cretaceous paleolatitude based on the paleomagnetic results of the Zonggei Fm. volcanics and previous studies is reasonable and valid.
It is worth noting that our estimate of the timing of initial India–Asia collision is also consistent with the result (60.5 ± 1.5 Ma, i.e., 62–59 Ma) derived from the upper Cretaceous Jingzhushan Formation on the northeastern edge of the Lhasa terrane (Tong et al., 2017), which is also supported by several lines of substantial geological evidence (Beck et al., 1995; Lee and Lawver, 1995; Ding et al., 2005; DeCelles et al., 2014; Wu et al., 2014; Hu et al., 2015, 2016a, 2016b).
Recently, scientists have studied the timing of initial India–Asia collision from the perspectives of biostratigraphic constraints and sedimentary records (DeCelles et al., 2014; Wu et al., 2014; Hu et al., 2015, 2016a; Qasim et al., 2018; Wei et al., 2020). For instance, DeCelles et al. (2014) and Wu et al. (2014) confirmed that the first arrival of Asia-derived sediments deposited on the northern Indian continental margin occurred at ∼60 Ma in both the Sangdanlin and Gyangze foreland basins, which are located close to the IYZSZ. These independent geological facts consistently indicate that the initial India–Asia collision should have occurred by ∼60 Ma, which is in accord with our result of ∼64.7–58.7 Ma (61.7 ± 3.0 Ma). More recently, Hu, X-M et al. (2015, 2016a) performed systematic provenance analysis on the Sangdanlin Formation sediments and a continuous section covering the upper Cretaceous Padana Fm., the uppermost Qubeiya Fm., the Lower Paleocene Quxia Fm., and the Paleocene-Lower Eocene Jialazi Fm. sediments, and they concluded that the initial India–Asia collision likely occurred at 59 ± 1 Ma (mid-Paleocene) or during the period of 66–58 Ma based on sharp changes in sediment provenance in the abovementioned formations deposited on the passive margin (Tethyan Himalaya) of the Indian plate. These results are very consistent with our estimate based on paleomagnetism. In addition to these studies, earlier studies demonstrated that the obduction of the Yarlung Zangbo ophiolite (and accretionary prism) onto India could not have occurred prior to the initial India–Asia collision and that the ophiolite obduction could have started only when collision began in the mid-Paleocene (∼65–60 Ma) (Beck et al., 1995; Ding et al., 2005; Hu et al., 2016b).
However, in recent years, the two-stage collision model with the GIB hypothesis (van Hinsbergen et al., 2012, 2019) as well as its variant (i.e., the two-stage collision model with the North India Sea hypothesis) (Yuan et al., 2020) has been further endorsed by several recent paleomagnetic case studies (e.g., Yang et al., 2015; Ma et al., 2016; Yuan et al., 2020) and the presence of Cretaceous alkaline basalts within the Tethyan Himalaya (Jadoul et al., 1998; Hu et al., 2010). However, it is still challenged by some significant geological facts including the absence of the remnants of oceanic crust, ophiolites, or deep marine sediments along the MCT (Le Fort, 1975; Yin and Harrison, 2000; Hu et al., 2016b; Searle, 2019), missing traces of the matching linear magmatic arc belt, fore-arc basin, and accretionary prism along the southern margin of the Greater Himalayan terrane due to the subduction of seafloor of GIB underneath the TH+GH composite terrane and provenance of Jidula Formation sandstones deposited in Tethyan Himalaya (Hu et al., 2012). Moreover, if the GIB is assumed to have existed from ∼118 to 68 Ma, then this requires the Indian plate to have been surrounded by oceanic spreading centers; however, this is not consistent with the rapid northward motion of the Indian plate during Cretaceous time (e.g., Copley et al., 2010; van Hinsbergen et al., 2011a; Kapp and DeCelles, 2019; Parsons et al., 2020).
Nevertheless, as mentioned above, the two-stage collision model with the GIB hypothesis is inspiring and promising and cannot be ruled out by currently available paleomagnetic data sets, but conservatively, we reached our conclusions with more caution and are in favor of the single-collision model to interpret our data set in this study. The validity of this promising two-stage collision model with GIB hypothesis requires more evidence from other research areas.
8.3 Estimates of Intracontinental Crustal Shortening Within Asia North of the Lhasa Terrane
The precise estimates of intracontinental crustal shortening occurring in both Asia and India have been a controversial issue based on currently existing geological and paleomagnetic data. To date, the proposed crustal shortening estimate on the Asian side has varied widely from 180 ± 280 km (Tan et al., 2010), 780 ± 240 km (Yang et al., 2015), 1,000 ± 300 km (Ma et al., 2014), to nearly 2,000 km (1,900 ± 700 km) (Tang et al., 2013). In fact, this issue is strongly dependent on when and where the initial India–Asia collision occurred and how fast the Indian continent moved northward with respect to stable Asia after the initial contact between the two continents.
As we have noted before (see Section 8.1), the latitudinal difference Δλ of the southernmost margin of the Lhasa terrane between the Early Cretaceous and the early Cenozoic immediately before initial India–Asia collision was 1.5° ± 4.3° (160 ± 470 km), which clearly suggests that the Lhasa terrane did not experience conspicuous north–south convergence relative to stable Asia between the Early Cretaceous and the early Cenozoic immediately before the initial India–Asia collision (i.e., from ∼120 to 61.7 ± 3.0 Ma). Based on this observation, the precollisional paleolatitude of 13.0° ± 1.8° of the Lhasa terrane in the Cretaceous is used in this study to reconstruct the intracontinental crustal shortening that occurred on the Asian side north of the Lhasa terrane.
For the ease of comparison, our analysis combines the calculated paleolatitude obtained in this study with those derived from the 120 to 110 Ma reference paleopoles of Eurasia below for the reference site (29.5°N, 91.0°E) (Figure 10). Here, we define the parameter Δλ120 as the paleolatitudinal difference between the paleolatitude calculated from the small-circle analysis of compiled paleopoles and the paleolatitude calculated from the 120 Ma reference paleopole (Torsvik et al., 2012), and similar definitions are applied to the parameters Δλ110, Δλ60, and Δλ50 below.
Our calculations yield Δλ120 = 14.2° ± 2.5° and Δλ110 = 14.3° ± 3.0°(Figure 9), suggesting that ∼1,570 ± 270 km and 1,580 ± 330 km of latitudinal crustal shortening have occurred across Tibet and stable Asia north of the Lhasa terrane since 120 and 110 Ma, respectively.
Furthermore, we find that the corresponding paleolatitudinal differences of Δλ60 and Δλ50 are Δλ60 = 16.0° ± 4.3° and Δλ50 = 17.5° ± 4.6° (Figure 9) (see foregoing definition of Δλ60 and Δλ50 for details), suggesting that ∼1,770 ± 470 km and 1,940 ± 510 km of latitudinal crustal shortening has occurred across Tibet and Eurasia north of the Lhasa terrane since 60 and 50 Ma, respectively. It is important to note that these four values (i.e., Δλ120, Δλ110, Δλ60, and Δλ50), which reflect the magnitudes of intracontinental crustal shortening occurring across the interior of Tibet and Eurasia, are consistent with each other within uncertainty. For clarity, here, we use the Δλ60 (i.e., 1,770 ± 470 km) as the estimate of crustal shortening that has occurred across the interior of Tibet and stable Asia. Thus, the Δλ110 (1,580 ± 330 km) was used as a reference value for the estimate of crustal shortening within the Asian hinterland since the Early Cretaceous time.
The estimates of intracontinental crustal shortening on the Asian side since the initial India–Asia collision (∼60 Ma) and since the 110 Ma obtained in this study are consistent with the estimate of latitudinal crustal shortening (1,450 ± 400 km since 120 Ma) from the Duoni Formation volcano-sedimentary rocks (see Figure 9) (Li Z. et al., 2017). Notably, our estimate on crustal shortening since the initial India–Asia collision is in excellent agreement with the paleomagnetic data (1,300 ± 910 km) from the upper Cretaceous Jingzhushan Formation sediments on the northeastern edge of the Lhasa terrane (Tong et al., 2017) and certain important paleomagnetic studies (Achache et al., 1984; Besse et al., 1984; Patriat and Achache, 1984; Tang et al., 2013; Li Z. et al., 2017; Tong et al., 2017).
Based on current data sets from balanced cross sections and field mapping, geologists have summarized that the crustal shortening within Tibet north of the IYZSZ since the initial India–Asia collision. Scholars have concluded that approximately 1,400 km of north–south shortening has been absorbed/accommodated during the Cenozoic (Meyer et al., 1998; Yin and Harrison, 2000; Spurlin et al., 2005; Volkmer et al., 2007). The intracontinental crustal shortening distributed within Tibet on the Asian side has been partitioned as follows: approximately 46% of the 470 km north–south crustal shortening (∼215 km) has occurred within the Lhasa terrane since the onset of the India–Asia collision (Volkmer et al., 2007). Additionally, over 900 km of N-S shortening has been absorbed north of the Lhasa terrane through a series of Cenozoic fold-and-thrust systems (including the Shiquanhe-Gaize-Amdo thrust system, the Fenghuoshan-Nangqian fold belt in the Qiangtang terrane, the Qimen-Tagh-North Kunlun thrust system and the Nanshan thrust system in the Qaidam-Kunlun terrane, and the Main Pamir thrust system) (Meyer et al., 1998; Yin and Harrison, 2000; Spurlin et al., 2005; van Hinsbergen et al., 2011b). Moreover, conservatively, approximately 250 km of southeastward extrusion of the Indochina block along several major strike-slip faults can be reconciled with dextral transpression in SE Tibet during the mid-Tertiary (van Hinsbergen et al., 2011b).
Moreover, we note that Parsons et al. (2021), through the tomographic imaging analysis of a prominent subducted lithospheric slab anomaly beneath southeastern Asia, have proposed that the India–Asia collision zone underwent 1,000–2,000 km of northward migration, implying that the same magnitude (i.e., 1,000–2,000 km) of crustal shortening has occurred since the onset of the India–Asia collision. This estimate, acting as an independent evidence from tomographic imaging, is in excellent agreement with our conclusion.
In short, this work on the reconstruction of intracontinental crustal shortening is consistent with our estimate in this study. In the long run, more robust high-quality volcanic-based paleomagnetic data sets are needed to constrain the estimate.
Therefore, here, we reached the conclusion that both the calculated estimate of 1,770 ± 470 km of crustal shortening occurring on the Asian side since the initial India–Asia collision and the reference value of the estimate (i.e., 1,580 ± 330 km) since ca. 115 ± 5 Ma are in accordance with the previously published result (1,450 ± 400 km) from the Duoni Fm. volcano-sedimentary rocks, which are ca. 20 km southwest of the research area in this study, hence confirming the validity and of these two studies.
8.4 Implications for the Width of the Neo-Tethys Ocean in the Early Cretaceous and Kinematic Reconstruction of the Lhasa Terrane Since the Early Jurassic
We have noted that both Ma et al. (2016) and Yang et al. (2015) have obtained high-quality paleomagnetic results from the 135–124 Ma Sangxiu Formation volcanics (i.e., SAXY in Table 2) (Figure 10) in the Langkazi area and from the 134–131 Ma volcanic rocks in the Cuona area (Figure 10; Table 2) in the Tethyan Himalayan terrane, respectively. In the early 1980s, Klootwijk and Bingham (1980) obtained paleomagnetic data (labeled TDS in Table 2) from the sediments in the Thakkhola-Dzong Formation in the Dzong area, Nepal, which can be successfully used to reconstruct the paleogeography of the Tethyan Himalayan terrane at ∼118 Ma. It is clear that these three results are in excellent agreement with the expected paleolatitudes of the Indian plate calculated from the Indian reference paleopoles (Klootwijk and Bingham, 1980; Torsvik et al., 2012; Ma Y-M et al., 2016; Yang T.-S. et al., 2015) (Table 2). We calculate the northernmost margin of Greater India (i.e., the reference site 29.5°N, 91.0°E) to have been located at −51.2° ± 5.7°S, −47.9° ± 6.1°S, and −45.0° ± 6.0°S in the Southern Hemisphere at 132.5 ± 1.5, 129.5 ± 5.5, and ∼118 Ma, respectively.
Considering that the Lhasa terrane remained at ∼13.0°N from ∼120 Ma to the early Cenozoic immediately before the initial India–Asia collision, we use the paleolatitude of 13.0° ± 1.8°N to represent the exact location of the southernmost margin of Asia. The calculated paleolatitudinal difference between the southernmost margin of the Lhasa terrane and the northernmost margin (−45.0° ± 6.0°S, TDS) (Table 2) of Greater India is 58.0° ± 5.0° at ∼118–115 Ma. Thus, the distance between the southernmost margin of the Lhasa terrane and the northernmost margin of Greater India is estimated to have been 6,400 ± 550 km at 115 ± 5 Ma. Furthermore, this calculation also suggests that the paleolatitudinal differences between the southernmost margin of the Lhasa terrane and the northernmost margin of Greater India were 64.2° ± 4.8° and 60.9° ± 5.0° at 132.5 ± 1.5 and 129.5 ± 5.5 Ma, respectively. Hence, the north–south distances between the southernmost margin of the Lhasa terrane and the northernmost margin of Greater India were 7,100 ± 530 km and 6,700 ± 550 km at ∼132.5 ± 1.5 and ∼129.5 ± 5.5 Ma, respectively (Figure 10; Table 2). Note that our estimate of the width of the Neo-Tethys Ocean is consistent with an estimated Neo-Tethys Ocean width of ∼7,000 km north of the Tibetan Himalaya (Van der Voo et al., 1999), as derived from the observations of the remnants of the subducted Tethyan oceanic slab by tomographic imaging. It is clear that the scale of the Neo-Tethys Ocean basin shrank from 7,100 ± 530 to 6,400 ± 550 km during 132.5 ± 1.5 to 115 ± 5 Ma.
Additionally, scientists have demonstrated that the Indian plate separated from Gondwana at 140–120 Ma (van Hinsbergen et al., 2011a; Gibbons et al., 2013; van Hinsbergen et al., 2019) and that the Neo-Tethys Ocean experienced continuous expansion before 130–120 Ma, reaching its maximum width sometime between 130 and 120 Ma (Van der Voo et al., 1999; Chen et al., 2012; Gibbons et al., 2013). Recent studies also indicate that the Neo-Tethyan oceanic crust started to subduct beneath the Lhasa terrane at 180 Ma (Li et al., 2016; Wang et al., 2018). Furthermore, Chen et al. (2020) used provenance analysis to show that the initial Lhasa-Qiangtang collision very likely occurred at 146–140 Ma and that the Lhasa terrane subsequently became part of stable Eurasia (Chen et al., 2020) and remained stationary at 13.0 ± 1.8°N for at least 60 Myr.
In short, the long-lasting subduction history of the Neo-Tethyan oceanic seafloor started from at least the Early Jurassic. Greater India can be viewed as fixed within East Gondwanaland at high-middle paleolatitudes in the Southern Hemisphere, whereas the Lhasa terrane exhibited constant northward movement during the same period (Figure 10). Therefore, the Neo-Tethyan Ocean was in an expansion stage until the Lhasa terrane completed amalgamation with the Qiangtang terrane in the Early Cretaceous, became part of stable Asia, and stayed at ∼13°N for over 60 Myr (Figure 11). Accordingly, the north–south width of the Neo-Tethys Ocean reached its maximum scale at 130–120 Ma prior to the separation of India from Australia-Antarctica and its subsequent northward movement, which initiated during the same period (i.e., ∼140–120 Ma). Assuming that the Lhasa terrane remained stationary at ∼13.0° in the Northern Hemisphere for ∼60 Myr (from 120 Ma to ∼61.7 ± 3.0 Ma), kinematically, the abovementioned shrinking trend of the Neo-Tethyan Ocean can be reasonably explained by the long-standing continuous northward movement of the Greater Indian plate with respect to the stable Eurasia to the north (Figure 11).
FIGURE 11
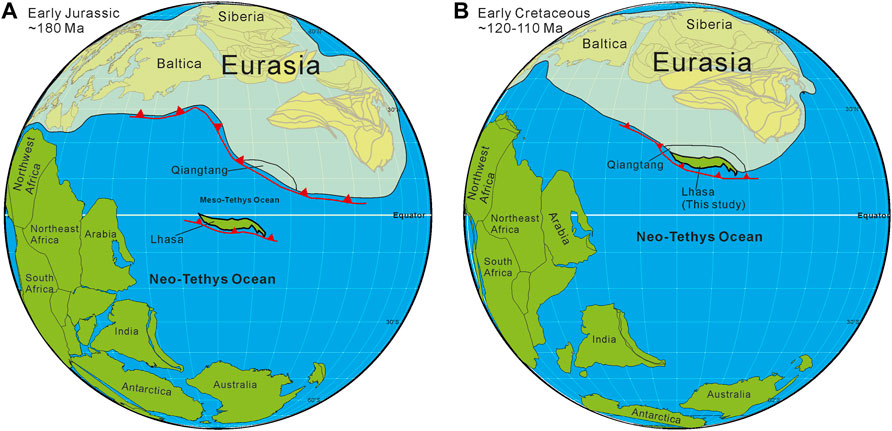
FIGURE 11. Paleogeographic reconstructions of the Eurasian and Indian continents and the Lhasa terrane at 180 Ma (Early Jurassic) and 120–110 Ma (Early Cretaceous), respectively. The paleomagnetic data sets of the Lhasa terrane at 180 Ma and the period of 120–110 Ma are from Li et al. (2016) and this study. The data sets for the Africa, India, Antarctica, Australia and Madagascar are from Torsvik et al. (2012). The paleomagnetic data for Asian geological terranes are from Huang et al. (2018).
In summary, we have made a reconstruction of the Lhasa terrane, Indian continent, and Eurasia at ∼180 Ma (Figure 11A) and 120–110 Ma (Figure 11B) based on the already published results for the Lhasa terrane from Li et al. (2016) and the data presented in this study. The Lhasa terrane was in an equatorial area (-3.2° ± 3.4°S) (Table 2, Figure 11) in the Southern Hemisphere at 180 Ma and then moved northward until the Lhasa-Qiangtang collision occurred; since then, it has represented the southernmost margin of Eurasia and has remained at ∼13°N since at least 120 Ma (Figure 11). This reconstruction of the Lhasa terrane during the Late Mesozoic plays an important role in interpreting the kinematic evolution of the Lhasa terrane within the eastern Tethyan realm.
9 Conclusion
We carried out an integrated study involving paleomagnetism and zircon U-Pb geochronology on the Zonggei Formation volcanic rocks to constrain the paleolatitude and kinematic behavior of the Lhasa terrane during the Early Cretaceous. Based on the obtained data set and our interpretations, we have reached the following conclusions: 1) The zircon U-Pb dating results show that the Zonggei Formation formed at 114–110 Ma (latest Aptian to early Albian). 2) The rock magnetism (Figure 4) and petrographic investigations (Figure 5, and Figure 6) demonstrate that both Ti-poor titanomagnetite and hematite magnetic minerals are the dominant remanence carriers in the Zonggei Fm. volcanics. Combined with previously published data sets from the Duoni Fm. volcano-sedimentary rocks (Li Z. et al., 2017), the positive fold and reversal tests suggest the primary nature of the ChRM directions of the Zonggei Formation volcanic rocks. 3) Our paleomagnetic analysis indicates that the initial India–Asia collision very likely occurred at ca. 64.7–58.7 Ma (61.7 ± 3.0 Ma) at a paleolatitude of 13.0° ± 1.8°N. Furthermore, intracontinental crustal shortening on the Asian side since the initial India–Asia collision is estimated to be 1,770 ± 470 km, which is consistent within uncertainty with previously published crustal shortening estimates and substantial geological evidence. 4) On the basis of the paleomagnetic analysis, the maximum N-S width of the Neo-Tethys Ocean is constrained to approximately 7,100 ± 530 km at 132.5 ± 1.5 Ma. The ocean basin then constantly shrank from this maximum width to 6,700 ± 550 km and 6,400 ± 550 km at 129.5 ± 5.5 Ma and 115 ± 5 Ma, respectively, which is essentially in line with the geophysical and geological evidence from southern Tibet (Van der Voo et al., 1999; Ji et al., 2009). Finally, we reconstructed the kinematic evolution of the Lhasa terrane since ∼180 (Early Jurassic) until 120–110 Ma (Early Jurassic) (Figure 11), which is much earlier than the initial India–Asia collision. This kinematic evolution represents a tight constraint on the long-lasting northward movement trend of the Lhasa terrane through the middle to late Mesozoic time.
Data Availability Statement
The original contributions presented in the study are included in the article/Supplementary Material, further inquiries can be directed to the corresponding author.
Author Contributions
LD and ZL conceived key scientific ideas of the project and designed the geological mapping and sampling in the field in northern Lhasa area as well as made paleogeographic interpretation. LD, ZL, and PS were involved in the field sampling. ZL performed paleomagnetic measurements. YY, YC, and JX performed zircon U-Pb dating work and back-scattered electron (BSE) and energy dispersive spectroscopy images. LD, ZL, AL, and WB performed paleomagnetic data analysis and the paleogeographic and tectonic interpretation and wrote the manuscript. All authors actively contributed to the interpretation of the results and the discussion of reconstructing paleolatitude of the Lhasa terrane in the Early Cretaceous. All authors contributed to the article and approved the submitted version.
Funding
This study was financially supported by the National Natural Science Foundation of China (41861134035, 41472185, and 41972241), the Second Tibetan Plateau Scientific Expedition and Research Program (STEP) (Grant No. 2019QZKK0708); and the Strategic Priority Research Program held by Chinese Academy of Sciences (Grant No. XDA20070301).
Conflict of Interest
The authors declare that the research was conducted in the absence of any commercial or financial relationships that could be construed as a potential conflict of interest.
Publisher’s Note
All claims expressed in this article are solely those of the authors and do not necessarily represent those of their affiliated organizations, or those of the publisher, the editors and the reviewers. Any product that may be evaluated in this article, or claim that may be made by its manufacturer, is not guaranteed or endorsed by the publisher.
Acknowledgments
We appreciate handling editor Prof. Junsheng Nie and reviewers Professors Yongxiang Li, Zhiming Sun and Andy Parsons for their helpful suggestions that greatly improved the manuscript. We acknowledge Prof. Paul Kapp for his constructive comments on an early version of the manuscript. We thank Matthew P. Dettiner for his kind help in polishing English expressions and grammar that improved the manuscript. We are grateful to Professors Lisa Tauxe and Caicai Liu for their help with technical assistance in preparation of the manuscript. We are indebted to Houqi Wang for his help in making Figure 1. We benefitted from insightful discussions with Drs. Liyun Zhang, Jie Zhao and Yonggang Yan.
Supplementary Material
The Supplementary Material for this article can be found online at: https://www.frontiersin.org/articles/10.3389/feart.2022.785726/full#supplementary-material
References
Abrajevitch, A., Ali, J., Aitchison, J., Badengzhu, B. D., Davis, A., Liu, J., et al. (2005). Neotethys and the India-Asia Collision: Insights from a Palaeomagnetic Study of the Dazhuqu Ophiolite, Southern Tibet. Earth Planet. Sci. Lett. 233, 87–102. doi:10.1016/j.epsl.2005.02.003
Achache, J., Courtillot, V., and Zhou, Y.-X. (1984). Paleogeographic and Tectonic Evolution of Southern Tibet since Middle Cretaceous Time: New Paleomagnetic Data and Synthesis. J. Geophys. Res. 89, 10311–10339.
Aitchison, J. C., Ali, J. R., and Davis, A. M. (2007). When and where Did India and Asia Collide? J. Geophys. Res. 112 (B05423), 1–21. doi:10.1029/2006jb004706
Aitchison, J. C., and Davis, A. M. (2004). “Evidence for the Multiphase Nature of the India-Asia Collision from the Yarlung Tsangpo Suture Zone, Tibet,” in Aspects of the Tectonic Evolution of China. Editors J. Malpas, C. J. N. Fletcher, J. R. Ali, and J. C. Aitchison (The Geological Society of London), Vol. 226, 217–233.
Aitchison, J. C., Xia, X., Baxter, A. T., and Ali, J. R. (2011). Detrital Zircon U-Pb Ages along the Yarlung-Tsangpo Suture Zone, Tibet: Implications for Oblique Convergence and Collision between India and Asia. Gondwana Res. 20, 691–709. doi:10.1016/j.gr.2011.04.002
Allégre, C. J., Courtillot, V., Tapponnier, P., Hirn, A., Mattauer, M., Coulon, C., et al. (1984). Structural and Evolution of the Himalaya-Tibet Orogenic belt. Nature 307, 17–22.
Argand, E. (1924). “La tectonique de l’Asie,” in Presented at the Proceedings of 13th Internatioanl Geological Congress, 171–372. (Congr. Rep).
Baral, U., Lin, D., Goswami, T. K., Sarma, M., Qasim, M., and Bezbaruah, D. (2019). Detrital Zircon U-Pb Geochronology of a Cenozoic Foreland basin in Northeast India: Implications for Zircon Provenance during the Collision of the Indian and Asian Plates. Terra Nova 31, 18–27. doi:10.1111/ter.12364
Beck, R. A., Burbank, D. W., Sercombe, W. J., Riley, G. W., Barndt, J. K., Berry, J. R., et al. (1995). Stratigraphic Evidence for an Early Collision between Northwest India and Asia. Nature 373 (6509), 55–58. doi:10.1038/373055a0
Besse, J., Courtillot, V., Pozzi, J. P., Westphal, M., and Zhou, Y. X. (1984). Palaeomagnetic Estimates of Crustal Shortening in the Himalayan Thrusts and Zangbo Suture. Nature 311, 621–626. doi:10.1038/311621a0
Bian, W., Yang, T., Ma, Y., Jin, J., Gao, F., Wang, S., et al. (2019). Paleomagnetic and Geochronological Results from the Zhela and Weimei Formations Lava Flows of the Eastern Tethyan Himalaya: New Insights into the Breakup of Eastern Gondwana. J. Geophys. Res. Solid Earth 124, 44–64. doi:10.1029/2018JB016403
Bian, W., Yang, T., Ma, Y., Jin, J., Gao, F., Zhang, S., et al. (2017). New Early Cretaceous Palaeomagnetic and Geochronological Results from the Far Western Lhasa Terrane: Contributions to the Lhasa-Qiangtang Collision. Sci. Rep. 7 (16216), 1–14. doi:10.1038/s41598-017-16482-3
Bureau of Geology Survey of Xizang Autonomous Region (BGSXAR), (2005). Regional Geology Report of Tibet. Tibet: Geological Survey of Xizang Autonomous Region. (in Chinese).
Cai, F., Ding, L., and Yue, Y. (2011). Provenance Analysis of Upper Cretaceous Strata in the Tethys Himalaya, Southern Tibet: Implications for Timing of India-Asia Collision. Earth Planet. Sci. Lett. 305, 195–206. doi:10.1016/j.epsl.2011.02.055
Cao, Y., Sun, Z., Li, H., Pei, J., Jiang, W., Xu, W., et al. (2017). New Late Cretaceous Paleomagnetic Data from Volcanic Rocks and Red Beds from the Lhasa Terrane and its Implications for the Paleolatitude of the Southern Margin of Asia Prior to the Collision with India. Gondwana Res. 41, 337–351. doi:10.1016/j.gr.2015.11.006
Chang, C.-F., and Zhen, X.-L. (1973). Some Tectonic Features of the Mt. Jomo Lungma Area, Southern Tibet, China. Sci. Sinica 16, 257–265. (in Chinese with English Abstract).
Chen, J., Huang, B., and Sun, L. (2010). New Constraints to the Onset of the India-Asia Collision: Paleomagnetic Reconnaissance on the Linzizong Group in the Lhasa Block, China. Tectonophysics 489, 189–209. doi:10.1016/j.tecto.2010.04.024
Chen, J., Huang, B., Yi, Z., Yang, L., and Chen, L. (2014). Paleomagnetic and 40Ar/39Ar Geochronological Results from the Linzizong Group, Linzhou Basin, Lhasa Terrane, Tibet: Implications to Paleogene Paleolatitude and Onset of the India-Asia Collision. J. Asian Earth Sci. 96, 162–177. doi:10.1016/j.jseaes.2014.09.007
Chen, W., Yang, T., Zhang, S., Yang, Z., Li, H., Wu, H., et al. (2012). Paleomagnetic Results from the Early Cretaceous Zenong Group Volcanic Rocks, Cuoqin, Tibet, and Their Paleogeographic Implications. Gondwana Res. 22, 461–469. doi:10.1016/j.gr.2011.07.019
Chen, Y., Ding, L., Li, Z., Laskowski, A. K., Li, J., Baral, U., et al. (2020). Provenance Analysis of Cretaceous Peripheral Foreland basin in central Tibet: Implications to Precise Timing on the Initial Lhasa-Qiangtang Collision. Tectonophysics 775 (228311), 228311–228317. doi:10.1016/j.tecto.2019.228311
Cogné, J. P. (2003). PaleoMac: A Macintosh Application for Treating Paleomagnetic Data and Making Plate Reconstructions. Geochem. Geophys. Geosyst. 4 (1), 1–8. doi:10.1029/2001GC000227
Copley, A., Avouac, J.-P., and Royer, J.-Y. (2010). India-asia Collision and the Cenozoic Slowdown of the Indian Plate: Implications for the Forces Driving Plate Motions. J. Geophys. Res. 115 (B03410), 1–14. doi:10.1029/2009JB006634
Cox, A. (1970). Latitude Dependence of the Angular Dispersion of the Geomagnetic Field. Geophys. J. Int. 20, 253–269. doi:10.1111/j.1365-246X.1970.tb06069.x
DeCelles, P. G., Kapp, P., Gehrels, G. E., and Ding, L. (2014). Paleocene-Eocene Foreland basin Evolution in the Himalaya of Southern Tibet and Nepal: Implications for the Age of Initial India-Asia Collision. Tectonics 33, 824–849. doi:10.1002/2014TC003522
Deenen, M. H. L., Langereis, C. G., van Hinsbergen, D. J. J., and Biggin, A. J. (2011). Geomagnetic Secular Variation and the Statistics of Palaeomagnetic Directions. Geophys. J. Int. 186, 509–520. doi:10.1111/j.1365-246X.2011.05050.x
Dewey, J. F., Shacleton, R. M., Chang, C.-F., and Sun, Y.-Y. (1988). The Tectonic Evolution of the Tibetan Plateau. Philos. Trans. R. Soc. Lond. (Ser. A) 327, 379–413.
Ding, L., Kapp, P., and Wan, X. (2005). Paleocene-Eocene Record of Ophiolite Obduction and Initial India-Asia Collision, South central Tibet. Tectonics 24 (TC3001), a–n. doi:10.1029/2004TC001729
Ding, L., Qasim, M., Jadoon, I. A. K., Khan, M. A., Xu, Q., Cai, F., et al. (2016). The India-Asia Collision in north Pakistan: Insight from the U-Pb Detrital Zircon Provenance of Cenozoic Foreland basin. Earth Planet. Sci. Lett. 455, 49–61. doi:10.1016/j.epsl.2016.09.003
Dunlop, D. J., and Özdemir, Ö. (1997). Rock Magnetism: Fundamentals and Frontiers. Cambridge: Cambridge University Press, 74–76.
Dupont-Nivet, G., Lippert, P. C., van Hinsbergen, D. J. J., Meijers, M. J. M., and Kapp, P. (2010). Palaeolatitude and Age of the Indo-Asia Collision: Palaeomagnetic Constraints. Geophys. J. Int. 182, 1189–1198. doi:10.1111/j.1365-246X.2010.04697.x
Enkin, R. J. (1994). A Computer Program Package for Analysis and Presentation of Paleomagnetic Data. Pac. Geosci. Centre, Geol. Surv. Can. 16, 1–16.
Fisher, R. (1953). Dispersion on a Sphere. Proc. R. Soc. A: Math. Phys. Eng. Sci. 217, 295–305. doi:10.1098/rspa.1953.0064
Gansser, A. (1966). The Indian Ocean and the Himalayas-A Geological Interpretation. Eclogae Geol. Helv. 67, 479–507.
Gansser, A. (1980). The Significance of the Himalayan Suture Zone. Tectonophysics 62, 37–52. doi:10.1016/0040-1951(80)90134-1
Gibbons, A. D., Whittaker, J. M., and Müller, R. D. (2013). The Breakup of East Gondwana: Assimilating Constraints from Cretaceous Ocean Basins Around India into a Best-Fit Tectonic Model. J. Geophys. Res. Solid Earth 118, 808–822. doi:10.1002/jgrb.50079
Hsü, K. J., Guitang, P., and Sengör, A. M. C. (1995). Tectonic Evolution of the Tibetan Plateau: A Working Hypothesis Based on the Archipelago Model of Orogenesis. Int. Geology. Rev. 37 (6), 473–508. doi:10.1080/00206819509465414
Hu, X., Garzanti, E., Moore, T., and Raffi, I. (2015). Direct Stratigraphic Dating of India-Asia Collision Onset at the Selandian (Middle Paleocene, 59 ± 1 Ma). Geology 43 (10), 859–862. doi:10.1130/g36872.1
Hu, X., Garzanti, E., Wang, J., Huang, W., An, W., and Webb, A. (2016b). The Timing of India-Asia Collision Onset - Facts, Theories, Controversies. Earth-Science Rev. 160, 264–299. doi:10.1016/j.earscirev.2016.07.014
Hu, X., Jansa, L., Chen, L., Griffin, W. L., O'Reilly, S. Y., and Wang, J. (2010). Provenance of Lower Cretaceous Wölong Volcaniclastics in the Tibetan Tethyan Himalaya: Implications for the Final Breakup of Eastern Gondwana. Sediment. Geology. 223 (3-4), 193–205. doi:10.1016/j.sedgeo.2009.11.008
Hu, X., Wang, J., BouDagher-Fadel, M., Garzanti, E., and An, W. (2016a). New Insights into the Timing of the India - Asia Collision from the Paleogene Quxia and Jialazi Formations of the Xigaze Forearc basin, South Tibet. Gondwana Res. 32, 76–92. doi:10.1016/j.gr.2015.02.007
Hu, X.-M., Sinclair, H. D., Wang, J.-G., Jiang, H. H., and Wu, F.-Y. (2012). Late Cretaceous-Paleogene Stratigraphic and Basin Evolution in the Zhepure Mountain of Southern Tibet: Implications for the Timing of the India-Asia Initial Collision. Sediment. Geol. 24, 1–24. doi:10.1111/j.1365-2117.2012.00542.x
Huang, B., Yan, Y., Piper, J. D. A., Zhang, D., Yi, Z., Yu, S., et al. (2018). Paleomagnetic Constraints on the Paleogeography of the East Asian Blocks during Late Paleozoic and Early Mesozoic Times. Earth-Science Rev. 186, 8–36. doi:10.1016/j.earscirev.2018.02.004
Huang, W., Dupont-Nivet, G., Lippert, P. C., van Hinsbergen, D. J. J., Dekkers, M. J., Waldrip, R., et al. (2015). What Was the Paleogene Latitude of the Lhasa Terrane? A Reassessment of the Geochronology and Paleomagnetism of Linzizong Volcanic Rocks (Linzhou basin, Tibet). Tectonics 34, 594–622. doi:10.1002/2014tc003787
Huang, W., Dupont-Nivet, G., Lippert, P. C., van Hinsbergen, D. J. J., and Hallot, E. (2013). Inclination Shallowing in Eocene Linzizong Sedimentary Rocks from Southern Tibet: Correction, Possible Causes and Implications for Reconstructing the India-Asia Collision. Geophys. J. Int. 194, 1390–1411. doi:10.1093/gji/ggt188
Huang, W., Lippert, P. C., Jackson, M. J., Dekkers, M. J., Zhang, Y., Li, J., et al. (2017a). Remagnetization of the Paleogene Tibetan Himalayan Carbonate Rocks in the Gamba Area: Implications for Reconstructing the Lower Plate in the India–Asia Collision. J. Geophys. Res. Solid Earth 122, 808–825. doi:10.1002/2016JB013662
Huang, W., Lippert, P. C., Zhang, Y., Jackson, M. J., Dekkers, M. J., Li, J., et al. (2017b). Remagnetization of Carbonate Rocks in Southern Tibet: Perspectives from Rock Magnetic and Petrographic Investigations. J. Geophys. Res. Solid Earth 122, 2434–2456. doi:10.1002/2017JB013987
Jadoul, F., Berra, F., and Garzanti, E. (1998). The Tethys Himalayan Passive Margin from Late Triassic to Early Cretaceous (South Tibet). J. Asian Earth Sci. 16 (2-3), 173–194. doi:10.1016/S0743-9547(98)00013-0
Ji, W.-Q., Wu, F.-Y., Chung, S.-L., Li, J.-X., and Liu, C.-Z. (2009). Zircon U-Pb Geochronology and Hf Isotopic Constraints on Petrogenesis of the Gangdese Batholith, Southern Tibet. Chem. Geology. 262, 229–245. doi:10.1016/j.chemheo.2009.01.02010.1016/j.chemgeo.2009.01.020
Johnson, C. L., Constable, C. G., Tauxe, L., Barendregt, R., Brown, L. L., Coe, R. S., et al. (2008). Recent Investigations of the 0-5 Ma Geomagnetic Field Recorded by Lava Flows. Geochem. Geophys. Geosyst. 9 (Q04032), a–n. doi:10.1029/2007GC001696
Johnson, M. R. W. (2002). Shortening Budgets and the Role of continental Subduction during the India-Asia Collision. Earth-Science Rev. 59, 101–123. doi:10.1016/s0012-8252(02)00071-5
Kapp, P., DeCelles, P. G., Gehrels, G. E., Heizler, M., and Ding, L. (2007). Geological Records of the Lhasa-Qiangtang and Indo-Asian Collisions in the Nima Area of central Tibet. Geol. Soc. Am. Bull. 119 (7/8), 917–932. doi:10.1130/b26033.1
Kapp, P., and DeCelles, P. G. (2019). Mesozoic-Cenozoic Geological Evolution of the Himalayan-Tibetan Orogen and Working Tectonic Hypotheses. Am. J. Sci. 319, 159–254. doi:10.2475/03.2019.01
Kapp, P., Yin, A., Harrison, T. M., and Ding, L. (2005). Cretaceous-Tertiary Shortening, basin Development, and Volcanism in central Tibet. Geol. Soc. America Bull. 117, 865–878. doi:10.1130/B25595.1
Kirschvink, J. L., and Lowenstam, H. A. (1979). Mineralization and Magnetization of chiton Teeth: Paleomagnetic, Sedimentologic, and Biologic Implications of Organic Magnetite. Earth Planet. Sci. Lett. 44, 193–204. doi:10.1016/0012-821X(79)90168-7
Kirschvink, J. L. (1980). The Least-Squares Line and Plane and the Analysis of Palaeomagnetic Data. Geophys. J. Int. 62 (3), 699–718. doi:10.1111/j.1365-246X.1980.tb02601.x
Klootwijk, C. T., and Bingham, D. K. (1980). The Extent of Greater India, III. Palaeomagnetic Data from the Tibetan Sedimentary Series, Thakkhola Region, Nepal Himalaya. Earth Planet. Sci. Lett. 51 (2), 381–405. doi:10.1016/0012-821x(80)90219-8
Klootwijk, C. T., Gee, J. S., Peirce, J. W., Smith, G. M., and McFadden, P. L. (1992). An Early India-Asia Contact: Paleomagnetic Constraints from Ninetyeast Ridge, ODP Leg 121. Geol 20, 395–398. doi:10.1130/0091-7613(1992)020<0395:aeiacp>2.3.co;2
Klootwijk, C. T. (1971). Palaeomagnetism of The-Upper Gondwana-Rajmahal Traps, Northeast India. Tectonophysics 12 (6), 449–467. doi:10.1016/0040-1951(71)90045-x
Koymans, M. R., HinsbergenPastor-Galan, D. J. J. D., Pastor‐Galán, D., Vaes, B., and Langereis, C. G. (2020). Towards FAIR Paleomagnetic Data Management through Paleomagnetism.Org 2.0. Geochem. Geophys. Geosyst. 21, e2019GC008838. doi:10.1029/2019GC008838
Koymans, M. R., Langereis, C. G., Pastor-Galán, D., and van Hinsbergen, D. J. J. (2016). Paleomagnetism.org: An Online Multi-Platform Open Source Environment for Paleomagnetic Data Analysis. Comput. andGeosciences 93, 127–137. doi:10.1016/j.cageo.2016.05.007
Lee, T.-Y., and Lawver, L. A. (1995). Cenozoic Plate Reconstruction of Southeast Asia. Tectonophysics 251, 85–138. doi:10.1016/0040-1951(95)00023-2
Leeder, M. R., Smith, A. B., and Yin, J.-X. (1988). Sedimentology, Palaeoecology and Palaeoenvironmental Evolution of the 1985 Lhasa to Golmud Geotraverse. Phil. Trans. R. Soc. Lond. A. 327, 107–143. doi:10.1098/rsta.1988.0123
Le Fort, P. (1975). Himalayas: The Collided Range. Present Knowledge of the Continental Arc. Am. J. Sci. 275, 1–44.
Leier, A. L., Kapp, P., Gehrels, G. E., and DeCelles, P. G. (2007). Detrital Zircon Geochronology of Carboniferous?Cretaceous Strata in the Lhasa Terrane, Southern Tibet. Basin Res. 19, 361–378. doi:10.1111/j.1365-2117.2007.00330.x
Li, J., and Hu, X. (2020). A Photomicrograph Dataset of Late Cretaceous to Early Paleogene Carbonate Rocks in Tibetan Himalaya. China Scientific Data 5, 1. doi:10.11922/sciencedb.j00001.00081
Li, S., Ding, L., Guilmette, C., Fu, J., Xu, Q., Yue, Y., et al. (2017a). The Subduction-Accretion History of the Bangong-Nujiang Ocean: Constraints from Provenance and Geochronology of the Mesozoic Strata Near Gaize, central Tibet. Tectonophysics 702, 42–60. doi:10.1016/j.tecto.2017.02.023
Li, S., Guilmette, C., Ding, L., Xu, Q., Fu, J.-J., and Yue, Y.-H. (2017b). Provenance of Mesozoic Clastic Rocks within the Bangong-Nujiang Suture Zone, central Tibet: Implications for the Age of the Initial Lhasa-Qiangtang Collision. J. Asian Earth Sci. 147, 469–484. doi:10.1016/j.jseaes.2017.08.019
Li, Z., Ding, L., Lippert, P. C., Song, P., Yue, Y., and van Hinsbergen, D. J. J. (2016). Paleomagnetic Constraints on the Mesozoic Drift of the Lhasa Terrane (Tibet) from Gondwana to Eurasia. Geology 44, 727–730. doi:10.1130/G38030.1
Li, Z., Ding, L., Song, P., Fu, J., and Yue, Y. (2017). Paleomagnetic Constraints on the Paleolatitude of the Lhasa Block during the Early Cretaceous: Implications for the Onset of India-Asia Collision and Latitudinal Shortening Estimates across Tibet and Stable Asia. Gondwana Res. 41, 352–372. doi:10.1016/j.gr.2015.05.013
Liebke, U., Appel, E., Ding, L., Neumann, U., Antolin, B., and Xu, Q. (2010). Position of the Lhasa Terrane Prior to India-Asia Collision Derived from Palaeomagnetic Inclinations of 53 Ma Old Dykes of the Linzhou Basin: Constraints on the Age of Collision and post-collisional Shortening within the Tibetan Plateau. Geophys. J. Int. 182, 1199–1215. doi:10.1111/j.1365-246x.2010.04698.x
Lin, J.-L., and Watts, D. R. (1988). Palaeomagnetic Results from the Tibetan Plateau. Philos. Trans. R. Soc. Lond. (Ser. A) 327, 239–262.
Lippert, P. C., van Hinsbergen, D. J. J., and Dupont-Nivet, G. (2014). “Early Cretaceous to Present Latitude of the central Proto-Tibetan Plateau: A Paleomagnetic Synthesis with Implications for Cenozoic Tectonics, Paleogeography, and Climate of Asia,” in Toward an Improved Understanding of Uplift Mechanisms and the Elevation History of the Tibetan Plateau. Editors J. Nie, B. K. Horton, and G. D. Hoke (Geological Society of America Bulletin), Vol. 507, 1–21. doi:10.1130/2014.2507(01)
Ma, G.-L., and Yue, Y.-H. (2010). Cretaceous Volcanic Rocks in Northern Lhasa Block: Constraints on the Tectonic Evolution of the Gangdese Arc. Acta Petrologica Et Mineralogica 20, 525–538. (in Chinese with English Abstract).
Ma, Y., Yang, T., Bian, W., Jin, J., Zhang, S., Wu, H., et al. (2016). Early Cretaceous Paleomagnetic and Geochronologic Results from the Tethyan Himalaya: Insights into the Neotethyan Paleogeography and the India-Asia Collision. Sci. Rep. 6 (21605), 1–11. doi:10.1038/srep21605
Ma, Y., Yang, T., Yang, Z., Zhang, S., Wu, H., Li, H., et al. (2014). Paleomagnetism and U-Pb Zircon Geochronology of Lower Cretaceous Lava Flows from the Western Lhasa Terrane: New Constraints on the India-Asia Collision Process and Intracontinental Deformation within Asia. J. Geophys. Res. Solid Earth 119, 7404–7424. doi:10.1002/2014JB011362
Mardia, K. V., and Gadsden, R. J. (1977). A Small Circle of Best Fit for Spherical Data and Areas of Vulcanism. Appl. Stat. 26, 238–245. doi:10.2307/2346963
McFadden, P. L. (1990). A New Fold Test for Palaeomagnetic Studies. Geophys. J. Int. 103, 163–169. doi:10.1111/j.1365-246x.1990.tb01761.x
McFadden, P. L., and Lowes, F. J. (1981). The Discrimination of Mean Directions Drawn from Fisher Distributions. Geophys. J. Int. 67, 19–33. doi:10.1111/j.1365-246x.1981.tb02729.x
McFadden, P. L., and McElhinny, M. W. (1990). Classification of the Reversal Test in Palaeomagnetism. Geophys. J. Int. 103, 725–729. doi:10.1111/j.1365-246x.1990.tb05683.x
McFadden, P. L., Merrill, R. T., McElhinny, M. W., and Lee, S. (1991). Reversals of the Earth's Magnetic Field and Temporal Variations of the Dynamo Families. J. Geophys. Res. 96, 3923–3933. doi:10.1029/90jb02275
Meert, J. G., Pivarunas, A. F., Evans, D., Pisarevsky, S. A., and Salminen, J. M. (2020). The Magnificent Seven: A Proposal for Modest Revision of the Quality Index Tectonophys. 790, 228549. doi:10.1016/j.tecto.2020.228549
Meng, J., Wang, C., Zhao, X., Coe, R., Li, Y., and Finn, D. (2012). India-asia Collision Was at 24°N and 50 Ma: Palaeomagnetic Proof from Southernmost Asia. Sci. Rep. 2 (925), 1–11. doi:10.1038/srep00925
Meyer, B., Tapponnier, P., Bourjot, L., Métivier, F., Gaudemer, Y., Peltzer, G., et al. (1998). Crustal Thickening in Gansu-Qinghai, Lithospheric Mantle Subduction, and Oblique, Strike-Slip Controlled Growth of the Tibet Plateau. Geophys. J. Int. 135, 1–47. doi:10.1046/j.1365-246x.1998.00567.x
Najman, Y., Appel, E., Boudagher-Fadel, M., Bown, P., Carter, A., Garzanti, E., et al. (2010). Timing of India-Asia Collision: Geological, Biostratigraphic, and Palaeomagnetic Constraints. J. Geophys. Res. 115 (B12416), 1–18. doi:10.1029/2010JB007673
Najman, Y., Jenks, D., Godin, L., Boudagher-Fadel, M., Millar, I., Garzanti, E., et al. (2017). The Tethyan Himalayan Detrital Record Shows that India-Asia Terminal Collision Occurred by 54 Ma in the Western Himalaya. Earth Planet. Sci. Lett. 459, 301–310. doi:10.1016/j.epsl.2016.11.036
Olierook, H. K. H., Jourdan, F., and Merle, R. E. (2019). Age of the Barremian-Aptian Boundary and Onset of the Cretaceous Normal Superchron. Earth-Science Rev. 197 (102906), 102906–102922. doi:10.1016/j.earscirev.2019.102906
Pan, G.-T., Ding, J., Yao, D.-S., and Wang, L.-Q. (2004). Guidebook of 1:1,500,000 Geological Map of the Qinghai-Xizang (Tibet) Plateau and Adjacent Areas. Chengdu: China Chengdu Cartographic Publishing House.
Parsons, A. J., Hosseini, K., Palin, R. M., and Sigloch, K. (2020). Geological, Geophysical and Plate Kinematic Constraints for Models of the India-Asia Collision and the post-Triassic central Tethys Oceans. Earth-Science Rev. 208, 103084. doi:10.1016/j.earscirev.2020.103084
Parsons, A. J., Sigloch, K., and Hosseini, K. (2021). Australian Plate Subduction Is Responsible for Northward Motion of the India‐Asia Collision Zone and ∼1,000 Km Lateral Migration of the Indian Slab. Geophys. Res. Lett. 48, e2021GL094904. doi:10.1029/2021GL094904
Patriat, P., and Achache, J. (1984). India-eurasia Collision Chronology Has Implications for Crustal Shortening and Driving Mechanism of Plates. Nature 311, 615–621. doi:10.1038/311615a0
Patzelt, A., Li, H., Wang, J., and Appel, E. (1996). Palaeomagnetism of Cretaceous to Tertiary Sediments from Southern Tibet: Evidence for the Extent of the Northern Margin of India Prior to the Collision with Eurasia. Tectonophysics 259, 259–284. doi:10.1016/0040-1951(95)00181-6
Pozzi, J.-P., Westphal, M., Xiu Zhou, Y., Sheng Xing, L., and Yao Chen, X. (1982). Position of the Lhasa Block, South Tibet, during the Late Cretaceous. Nature 297, 319–321. doi:10.1038/297319a0
Qasim, M., Ding, L., Khan, M. A., Jadoon, I. A. K., Haneef, M., Baral, U., et al. (2018). Tectonic Implications of Detrital Zircon Ages from Lesser Himalayan Mesozoic-Cenozoic Strata, Pakistan. Geochem. Geophys. Geosyst. 19, 1636–1659. doi:10.1002/2017gc006895
Qin, S.-X., Li, Y.-X., Li, X.-H., Xu, B., and Luo, H. (2019). Paleomagnetic Results of Cretaceous Cherts from Zhongba, Southern Tibet: New Constraints on the India-Asia Collision. J. Asian Earth Sci. 173, 42–53. doi:10.1016/j.jseaes.2019.01.012
Rao, G. V. S. P., and Rao, J. M. (1996). Palaeomagnetism of the Rajmahal Traps of India: Implication to the Reversal in the Cretaceous Normal Superchron. J. Geomagn. Geoelec 48, 993–1000. doi:10.5636/jgg.48.993
Roperch, P., and Dupont-Nivet, G. (2021). Are Carbonates from the India-Asia Collision Remagnetized? Vienna: EGU General Assembly. doi:10.5194/egusphere-egu21-15842
Searle, M. P. (2019). “Timing of subduction initiation, arc formation, ophiolite obduction and India‐Asia collision in the Himalaya,” in Himalayan Tectonics: A Modern Synthesis. Editors P. J. Treloar, and M. P. Searle (The Geological Society of London Special Publications), Vol. 483, 19–37.
Şengör, A. M. C., and Natal’in, B. (1996). “Paleotectonics of Asia: Fragments of a Synthesis,” in The Tectonic Evolution of Asia. Editors A. Yin, and T. M. Harrison (Cambridge, UK: Cambridge University Press).
Şengör, A. M. C. (1987). Tectonics of the Tethysides: Orohenic Collage Development in a Collisional Setting. Annu. Rev. Earth Planet. Sci. 15, 213–244.
Sinha Roy, S. (1976). A Possible Himalayan Microcontinent. Nature 263, 117–120. doi:10.1038/263117a0
Spurlin, M. S., Yin, A., Horton, B. K., Zhou, J., and Wang, J. (2005). Structural Evolution of the Yushu-Nangqian Region and its Relationship to Syncollisional Igneous Activity, East-central Tibet. Geol. Soc. America Bull. 117, 1293–1317. doi:10.1130/B25572.1
Sun, Z.-M., Jiang, W., Pei, J.-L., and Li, H.-B. (2008). New Early Cretaceous Paleomagnetic Data from Volcanic Rocks of the Eastern Lhasa Block and its Tectonic Implications. Acta Petrologica Sinica 24, 1621–1626. (in Chinese with English Abstract).
Sun, Z., Jiang, W., Li, H., Pei, J., and Zhu, Z. (2010). New Paleomagnetic Results of Paleocene Volcanic Rocks from the Lhasa Block: Tectonic Implications for the Collision of India and Asia. Tectonophysics 490, 257–266. doi:10.1016/j.tecto.2010.05.011
Sun, Z., Pei, J., Li, H., Xu, W., Jiang, W., Zhu, Z., et al. (2012). Palaeomagnetism of Late Cretaceous Sediments from Southern Tibet: Evidence for the Consistent Palaeolatitudes of the Southern Margin of Eurasia Prior to the Collision with India. Gondwana Res. 21, 53–63. doi:10.1016/j.gr.2011.08.003
Tan, X., Gilder, S., Kodama, K. P., Jiang, W., Han, Y., Zhang, H., et al. (2010). New Paleomagnetic Results from the Lhasa Block: Revised Estimation of Latitudinal Shortening across Tibet and Implications for Dating the India-Asia Collision. Earth Planet. Sci. Lett. 293, 396–404. doi:10.1016/j.epsl.2010.03.013
Tang, X.-D., Huang, B.-C., Yang, L.-K., Yi, Z.-Y., Qiao, Q.-Q., and Chen, L.-W. (2013). Paleomagnetism and Ar-Ar Geochronology of Cretaceous Volcanic Rocks in the Middle Lhasa Terrane, China and Tectonic Implications. Chin. J. Geophys. 56, 136–149. (in Chinese with English abstract).
Tapponnier, P., Peltzer, G., Le Dain, A. Y., Armijo, R., and Cobbold, P. (1982). Propagating Extrusion Tectonics in Asia: New Insights from Simple Experiments with Plasticine. Geol 10, 611–616. doi:10.1130/0091-7613(1982)10<611:petian>2.0.co;2
Tarduno, J. A., Cottrell, R. D., and Smirnov, A. V. (2006). The Paleomagnetism of Single Silicate Crystals: Recording Geomagnetic Field Strength during Mixed Polarity Intervals, Superchrons, and Inner Core Growth. Rev. Geophys. 44, RG1002. doi:10.1029/2005RG000189
Tarduno, J. A., Cottrell, R. D., Watkeys, M. K., Hofmann, A., Doubrovine, P. V., Mamajek, E. E., et al. (2010). Geodynamo, Solar Wind, and Magnetopause 3.4 to 3.45 Billion Years Ago. Science 327, 1238–1240. doi:10.1126/science.1183445
Tauxe, L., Mullender, T. A. T., and Pick, T. (1996). Potbellies, Wasp-Waists, and Superparamagnetism in Magnetic Hysteresis. J. Geophys. Res. 101, 571–583. doi:10.1029/95JB03041
Tauxe, L., Shaar, R., Jonestrask, L., Swanson‐Hysell, N. L., Minnett, R., Koppers, A. A. P., et al. (2016). PmagPy: Software Package for Paleomagnetic Data Analysis and a Bridge to the Magnetics Information Consortium (MagIC) Database. Geochem. Geophys. Geosyst. 17, 2450–2463. doi:10.1002/2016GC006307
Tong, Y., Yang, Z., Pei, J., Wang, H., Xu, Y., and Pu, Z. (2017). Paleomagnetism of the Upper Cretaceous Red-Beds from the Eastern Edge of the Lhasa Terrane: New Constraints on the Onset of the India-Eurasia Collision and Latitudinal Crustal Shortening in Southern Eurasia. Gondwana Res. 48, 86–100. doi:10.1016/j.gr.2017.04.018
Torsvik, T. H., Müller, R. D., Voo, R. V., Steinberger, B., and Gaina, C. (2008). Global Plate Motion Frames: Toward a Unified Model. Rev. Geophys. 46, 1–44. doi:10.1029/2007rg000227
Torsvik, T. H., Van der Voo, R., Preeden, U., Mac Niocaill, C., Steinberger, B., Doubrovine, P. V., et al. (2012). Phanerozoic Polar Wander, Palaeogeography and Dynamics. Earth-Science Rev. 114, 325–368. doi:10.1016/j.earscirev.2012.06.007
Van der Voo, R., Spakman, W., and Bijwaard, H. (1999). Tethyan Subducted Slabs under India. Earth Planet. Sci. Lett. 171, 7–20. doi:10.1016/s0012-821x(99)00131-4
Van der Voo, R. (1990). The Reliability of Paleomagnetic Data. Tectonophysics 184, 1–9. doi:10.1016/0040-1951(90)90116-p
van Hinsbergen, D. J. J., Kapp, P., Dupont-Nivet, G., Lippert, P. C., DeCelles, P. G., and Torsvik, T. H. (2011b). Restoration of Cenozoic Deformation in Asia and the Size of Greater India. Tectonics 30 (TC5003), a–n. doi:10.1029/2011TC002908
van Hinsbergen, D. J. J., Lippert, P. C., Dupont-Nivet, G., McQuarrie, N., Doubrovine, P. V., Spakman, W., et al. (2012). Greater India Basin Hypothesis and a Two-Stage Cenozoic Collision between India and Asia. Proc. Natl. Acad. Sci. 109, 7659–7664. doi:10.1073/pnas.1117262109
van Hinsbergen, D. J. J., Lippert, P. C., Li, S., Huang, W., Advokaat, E. L., and Spakman, W. (2019). Reconstructing Greater India: Paleogeographic, Kinematic, and Geodynamic Perspectives. Tectonophysics 760, 69–94. doi:10.1016/j.tecto.2018.04.006
van Hinsbergen, D. J. J., Steinberger, B., Doubrovine, P. V., and Gassmöller, R. (2011a). Acceleration and Deceleration of India-Asia Convergence since the Cretaceous: Roles of Mantle Plumes and continental Collision. J. Geophys. Res. 116 (B06101), 1–20. doi:10.1029/2010JB008051
Volkmer, J. E., Kapp, P., Guynn, J. H., and Lai, Q. (2007). Cretaceous-Tertiary Structural Evolution of the north central Lhasa Terrane, Tibet. Tectonics 26 (TC6007), a–n. doi:10.1029/2005TC001832
Wang, H.-Q., Ding, L., Kapp, P., Cai, F.-L., Clinkscales, C., Xu, Q., et al. (2018). Earliest Cretaceous Accretion of Neo-Tethys Oceanic Subduction along the Yarlung Zangbo Suture Zone, Sangsang Area, Southern Tibet. Tectonophysics 744, 373–389. doi:10.1016/j.tecto.2018.07.024
Wang, J.-G., Hu, X.-M., Boudagher-Fadel, M., Wu, F.-Y., and Sun, G.-Y. (2015). Early Eocene Sedimentary Recycling in the Kailas Area, Southwestern Tibet: Implications for the Initial India-Asia Collision. Sediment. Geology. 315, 1–13. doi:10.1016/j.sedgeo.2014.10.009
Wang, X., Wan, X., and Li, G. (2008). Late Cretaceous to Early Paleogene Strontium Isotopic Stratigraphy in the Gamba Area, Tibet. Geology. China 4, 598–607. doi:10.3969/j.issn.1000-3657.2008.04.004
Watson, G. S., and Enkin, R. J. (1993). The Fold Test in Paleomagnetism as a Parameter Estimation Problem. Geophys. Res. Lett. 20, 2135–2137. doi:10.1029/93gl01901
Wei, Z., Li, X., Li, Y., Fan, X., Wang, J., Zhang, C., et al. (2020). Discovery of Vestige Sedimentary Archives of the India‐Asia Collision in the Eastern Yarlung Zangbo Suture Zone. J. Geophys. Res. Solid Earth 125 (e2019JB018192), 1–26. doi:10.1029/2019JB018192
Westphal, M., Pozzi, J.-P., Zhou, Y. X., Xing, L. S., and Chen, X. Y. (1983). Palaeomagnetic Data about Southern Tibet (Xizang) ? I. The Cretaceous Formations of the Lhasa Block. Geophys. J. Int. 73, 507–521. doi:10.1111/j.1365-246x.1983.tb03327.x
Wu, F.-Y., Ji, W.-Q., Wang, J.-G., Liu, C.-Z., Chung, S.-L., and Clift, P. D. (2014). Zircon U-Pb and Hf Isotopic Constraints on the Onset Time of India-Asia Collision. Am. J. Sci. 314, 548–579. doi:10.2475/02.2014.04
Yan, M., Zhang, D., Fang, X., Ren, H., Zhang, W., Zan, J., et al. (2016). Paleomagnetic Data Bearing on the Mesozoic Deformation of the Qiangtang Block: Implications for the Evolution of the Paleo- and Meso-Tethys. Gondwana Res. 39, 292–316. doi:10.1016/j.gr.2016.01.012
Yang, T., Ma, Y., Bian, W., Jin, J., Zhang, S., Wu, H., et al. (2015). Paleomagnetic Results from the Early Cretaceous Lakang Formation Lavas: Constraints on the Paleolatitude of the Tethyan Himalaya and the India-Asia Collision. Earth Planet. Sci. Lett. 428, 120–133. doi:10.1016/j.epsl.2015.07.040
Yang, T.-S., Ma, Y.-M., Zhang, S.-H., Bian, W.-W., Yang, Z.-Y., and Wu, H.-C. (2015). New Insights into the India‐Asia Collision Process from Cretaceous Paleomagnetic and Geochronologic Results in the Lhasa Terrane. Gondwana Res. 28, 625–641. doi:10.1016/j.gr.2014.06.010
Yi, Z.-Y., Huang, B.-C., Chen, J.-S., Chen, L.-W., and Wang, H.-L. (2011). Paleomagnetism of Early Paleogene marine Sediments in Southern Tibet, China: Implications to Onset of the India-Asia Collision and Size of Greater India. Earth Planet. Sci. Lett. 309, 153–165. doi:10.1016/j.epsl.2011.07.001
Yi, Z., Appel, E., and Huang, B. (2017). Comment on "Remagnetization of the Paleogene Tibetan Himalayan carbonate rocks in the Gamba area: Implications for reconstructing the lower plate in the India-Asia collision" by Huang et al. J. Geophys. Res. Solid Earth 122, 4852–4858. doi:10.1002/2017JB014353
Yi, Z., Huang, B., Yang, L., Tang, X., Yan, Y., Qiao, Q., et al. (2015). A Quasi-Linear Structure of the Southern Margin of Eurasia Prior to the India-Asia Collision: First Paleomagnetic Constraints from Upper Cretaceous Volcanic Rocks Near the Western Syntaxis of Tibet. Tectonics 34, 1431–1451. doi:10.1002/2014TC003571
Yin, A., and Harrison, T. M. (2000). Geologic Evolution of the Himalayan-Tibetan Orogen. Annu. Rev. Earth Planet. Sci. 28, 211–280. doi:10.1146/annurev.earth.28.1.211
Yuan, J., Yang, Z., Deng, C., Krijgsman, W., Hu, X., Li, S., et al. (2020). Rapid Drift of the Tethyan Himalaya Terrane before Two-Stage India-Asia Collision. Natl. Sci. Rev. 1, nwaa173. doi:10.1093/nsr/nwaa173
Zhang, Q., Willems, H., Ding, L., and Xu, X. (2019). Response of Larger Benthic Foraminifera to the Paleocene-Eocene thermal Maximum and the Position of the Paleocene/Eocene Boundary in the Tethyan Shallow Benthic Zones: Evidence from South Tibet. Geol. Soc. Am. Bull. 131, 84–98. doi:10.1130/B31813.1
Zhao, Q., Huang, B., Yi, Z., and Xue, P. (2021). High-Resolution Petrographic Evidence Confirming Detrital and Biogenic Magnetites as Remanence Carriers for Zongpu Carbonates in the Gamba Area, South Tibet. Front. Earth Sci. 9, 713469. doi:10.3389/feart.2021.713469
Zhao, Q. (2021). Reconnaissance of the Paleogeography of the India-Asia Collision. Ph.D Thesis. Beijing, China: Peking University.
Zhou, Y., Cheng, X., Yu, L., Yang, X., Su, H., Peng, X., et al. (2016). Paleomagnetic Study on the Triassic Rocks from the Lhasa Terrane, Tibet, and its Paleogeographic Implications. J. Asian Earth Sci. 121, 108–119. doi:10.1016/j.jseaes.2016.02.006
Zhu, D.-C., Li, S.-M., Cawood, P. A., Wang, Q., Zhao, Z.-D., Liu, S.-A., et al. (2016). Assembly of the Lhasa and Qiangtang Terranes in central Tibet by Divergent Double Subduction. Lithos 245, 7–17. doi:10.1016/j.lithos.2015.06.023
Zhu, D.-C., Mo, X.-X., Niu, Y., Zhao, Z.-D., Wang, L.-Q., Liu, Y.-S., et al. (2009). Geochemical Investigation of Early Cretaceous Igneous Rocks along an East-West Traverse throughout the central Lhasa Terrane, Tibet. Chem. Geology. 268, 298–312. doi:10.1016/j.chemgeo.2009.09.008
Zhu, D.-C., Zhao, Z.-D., Niu, Y., Dilek, Y., Hou, Z.-Q., and Mo, X.-X. (2013). The Origin and Pre-cenozoic Evolution of the Tibetan Plateau. Gondwana Res. 23, 1429–1454. doi:10.1016/j.gr.2012.02.002
Zhu, D.-C., Zhao, Z.-D., Niu, Y., Mo, X.-X., Chung, S.-L., Hou, Z.-Q., et al. (2011). The Lhasa Terrane: Record of a Microcontinent and its Histories of Drift and Growth. Earth Planet. Sci. Lett. 301, 241–255. doi:10.1016/j.epsl.2010.11.005
Keywords: Lhasa terrane, India–Asia collision, Neo-Tethys ocean, paleolatitude, geochronology, intracontinental crustal shortening
Citation: Li Z, Ding L, Laskowski AK, Burke WB, Chen Y, Song P, Yue Y and Xie J (2022) New Paleomagnetic Constraints on the Early Cretaceous Paleolatitude of the Lhasa Terrane (Tibet). Front. Earth Sci. 10:785726. doi: 10.3389/feart.2022.785726
Received: 29 September 2021; Accepted: 08 February 2022;
Published: 19 May 2022.
Edited by:
Junsheng Nie, Lanzhou University, ChinaReviewed by:
Yong-Xiang Li, Nanjing University, ChinaZhiming Sun, Chinese Academy of Geological Sciences (CAGS), China
Copyright © 2022 Li, Ding, Laskowski, Burke, Chen, Song, Yue and Xie. This is an open-access article distributed under the terms of the Creative Commons Attribution License (CC BY). The use, distribution or reproduction in other forums is permitted, provided the original author(s) and the copyright owner(s) are credited and that the original publication in this journal is cited, in accordance with accepted academic practice. No use, distribution or reproduction is permitted which does not comply with these terms.
*Correspondence: Zhenyu Li, lizy@itpcas.ac.cn