 Zichuan Qin
 Fangbo Qin
 Ying Li
 Congyu Yu
94% of researchers rate our articles as excellent or good
Learn more about the work of our research integrity team to safeguard the quality of each article we publish.
Find out more
ORIGINAL RESEARCH article
Front. Earth Sci., 03 February 2022
Sec. Paleontology
Volume 10 - 2022 | https://doi.org/10.3389/feart.2022.783481
This article is part of the Research TopicTechnological Frontiers in Dinosaur Science Mark a New Age of Opportunity for Early Career ResearchersView all 9 articles
Histology is key to understand physiology, development, growth and even reproduction of extinct animals. However, the identification and interpretation of certain structures, such as osteons, medullary bone (MB), and Lines of Arrested Growth (LAGs), are not only based on personal judgments, but also require considerable labor for subsequent analysis. Due to the dearth of available specimens, only a few quantitative histological studies have been proceeded for limited dinosaur taxa, most of which focus primarily on their growth, namely, LAGs and other growth lines without much attention to other histological structures. Here we develop a deep convolutional neural network-based method for automated osteohistological segmentation. Raw images are firstly divided into sub-images and the borders are expanded to guarantee the osteon regions integrity. ResNet-50 is employed as feature extractor and atrous spatial pyramid pooling (ASPP) is used to capture multi-scale information. A dual-resolution segmentation strategy is designed to observe the primary and secondary osteon regions from the matrix background. Finally, a segmented map with different osteon regions is obtained. This deep convolutional neural network-based model is tested on a histological dataset derived from various taxa in Alvarezsauria, a highly specialized group of non-avian theropod dinosaurs. The results show that large-scale quantitative histological analysis can be achieved by neural network-based methods, and previously hidden information by traditional methods can be revealed. Phylogenetic mapping of osteon segmentation results suggests a developmental pathway towards miniaturized body sizes in the evolution of Alvarezsauria, which may resemble the transition from non-avian dinosaurs to birds.
Histology provides a unique chance to study the physiology, development, growth and even reproduction of extinct animals including non-avian dinosaurs. Most paleontological histological studies focus on the microstructure of fossil skeletal tissues, such as bones, cartilage, and also eggshells. The earliest histological work on dinosaur fossils can be traced back to Hylaeosaurus and Pelorosaurus by Mantell (1850), Mantell (1851), who provided the first description of microstructures in dinosaur bones, which was revisited by a thorough review on the early history of paleontological histology (Falcon-Lang and Digrius, 2014). Another review by Bailleul et al. (2019) provided a systematic summary of recent histological study advancements in techniques, discoveries, and perspectives.
Most histological studies are destructive for fossil specimens and there are only few non-avian dinosaur taxa have found available specimens for large scale comparative studies, thus quantitative histological studies are limited. Many quantitative histological studies focus on the growth and evolution of extinct organisms, including the gigantism and secondary dwarfism of sauropod dinosaurs (Sander et al., 2006; Lehman and Woodward, 2008), the growth pattern in dinosaurs and pterosaurs, particularly T. rex and Psittacosaurus (Erickson and Tumanova, 2000; Erickson et al., 2004; Padian et al., 2004; Erickson et al., 2009; Zhao et al., 2013). However, most of quantitative studies rely on manually collected statistics, for example counting the number of growth lines and calculating areas of osteons, etc. Machine learning based methods have only been recently introduced in histological studies by Haridy et al. (2021). Moreover, researchers may have different interpretations on the same structures, for example the identification of medullary bones, which are crucial to understand the sex and reproduction of extinct animals (Canoville et al., 2020). Although the identifications of most histological structures have reached tremendously congruent during the rapid advancements of fossil histology during the decade (Erickson 2014; Bailleul et al., 2019), the lack of baselines for evaluation, personal bias, and considerable cost of time in data processing are challenging future development of histological studies.
With the recent development of convolutional neural network (CNN) in image processing, CNN based feature learning methods have shown their great potential in biomedical image segmentation. Ronneberger et al. (2015) presented U-Net, which was named after its symmetrical encoding and decoding branches in a U-shape framework, for segmentation of neuronal structures in electron microscopic stacks. The network was trained in an end-to-end manner that directly provides segmentation maps based on the raw images, skip connections in its U-shape framework can improve the performance of the expansive path, thus the U-Net has become a popular architecture for biomedical image segmentation tasks.
Dilated convolution can obtain larger receptive field than traditional convolution layers. Gu et al. (2019) integrated dense atrous convolution (DAC) and residual multi-kernel pooling (RMP) blocks with encoder-decoder structure for medical image segmentation. DAC with different rates and RMP are employed to extract high-level features and preserve spatial information. In order to exploit the useful information from features in different levels, Wang et al. (2019) developed an attention module to integrate the outputs of multiple levels. Then atrous spatial pyramid pooling (ASPP) with dilated convolution was employed to capture multi-scale information.
The features learned by the standard convolution layers are not distinctive when the different target categories are similar and dense connection is a better choice. Gibson et al. (2018) adopted dense feature stacks in the encoder blocks for better feature extraction. Zhou Z. et al. (2020) presented UNet++, which consists of U-Nets of varying depths and the encoders are densely connected. Chen L. et al. (2018) presented Dense-Res-Inception Net (DRINet) for organ segmentation of CT images. Dense connection blocks are used in the encoder blocks and residual inception block are used in the decoder blocks. Skip connections are not used for computation efficiency.
Besides, additional priori knowledge can further improve the performance. Oktay et al. (2018) designed a shape regularization loss to facilitate image segmentation. The shape information is encoded to a vector by a trained encoder. As for low-contrast images, Zhou S. et al. (2020) designed a High-Resolution Encoder–Decoder Networks for blurry medical image segmentation, which includes three main pathways: skip connection, distilling pathway and high-resolution pathway. Contour information has been integrated with segmentation task to improve accuracy.
The manual analysis of large-size fossil images is tedious and unfriendly for even paleontology experts, which also might involve subjective errors. Motivated by pursuing automatic objective analysis of osteon distribution in fossil histological images, we utilized the deep learning-based segmentation method to recognize the osteon regions of interest: vascular canal (VC) and circular lamellar bone (CLB). Since there are primary and secondary osteons distributed in bone thin sections, here a dual-resolution segmentation strategy is designed to observe the primary and secondary osteon regions from the background. The model performance was tested on a dataset comprising bone thin sections derived from Alvarezsauria (Dinosauria: Theropoda).
The segmentation is realized by a deep convolutional neural networks (CNN) model Φ. The model’s input is a fossil image
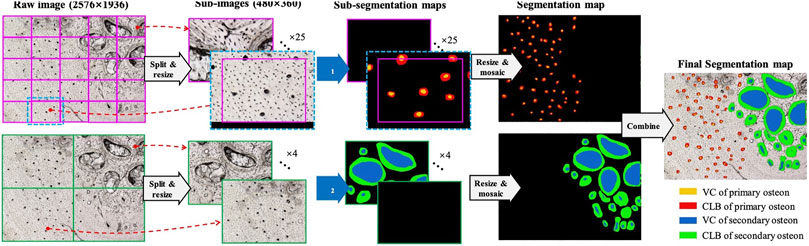
FIGURE 1. Segmentation strategy for fossil osteon image.
The fossil osteon images have three characteristics. First, the osteon sizes are not in the consistent level across different dinosaur taxa and bones. Larger dinosaur bones can accommodate larger osteon sizes, so that some osteons captured onto the images are larger. Second, the fossil histological images have the resolution of 2,576 × 1936, compared to the ordinary image’s resolution such as 512 × 512. If we use the entire image as the segmentation model’s input, the computation complexity will be high and the mini-batch based model training will be more difficult to conduct. Third, the primary osteons are usually significantly smaller than the secondary osteons and are often incomplete due to distortion from secondary osteons, which leads to a tradeoff between the small primary osteons’ clearness and the large second osteons’ shape-completeness if using a single resolution to view the image. Considering the three problems, we propose the following three methods, respectively.
1) Osteon Size Sampling:
For the fossil images of a certain dinosaur taxon, we manually and randomly sampled
2) Split and Mosaic strategy:
Instead of inputting the entire large image into the segmentation model Φ, we firstly split the entire image into
Given an entire image with the size of
Considering that an osteon region might locate at the border of sub-images, the split operation will cause the osteon region separated into the two or more different sub-images. A simple strategy to relieve this problem is to pad the sub-images in the split operation and center-crop the sub-segmentation maps before the mosaic operation. As illustrated in Figure 1, when a sub-image (magenta rectangle with the size of
3) Dual-Resolution Segmentation strategy:
As aforementioned, the primary osteon region could be significantly smaller than the secondary osteon region. Although the deep CNN based segmentation model has the multi-scale perception ability, we cannot split the raw image with a single sub-image size meanwhile guaranteeing that both the primary and secondary region are clearly and completely observed. Therefore, the dual-resolution segmentation strategy is designed, which use the higher and lower resolution to observe the primary and the secondary osteon regions, respectively.
Apparently, the observation resolution is determined by the sub-image size
, where
As is shown in Figure 1, the same raw images are processed by two pipelines with two different resolutions. The upper branch is for the primary osteon, with the higher resolution and the smaller sub-image size. The lower branch is for the secondary osteon, with the lower resolution and the larger sub-image size. We train two segmentation models Φ1 and Φ2, for the upper and lower branches, respectively. Φ1 and Φ2 share the same model structure but are trained on the two different datasets Δ1 and Δ2. For example, if there are
The proposed segmentation model is derived from DeepLabv3+ (Chen L. C.et al., 2018), whose structure is shown in Figure 2. DeepLabv3+ model is mainly characterized by its atrous spatial pyramid pooling (ASPP) block and brief structure with only one skip connection route. We customized the original DeepLabv3+ model as described below.
1) ResNet-50 (He et al., 2016) is used as the backbone feature extractor, outputting a feature map with 2048 channels and 16 output-stride. Output-stride is the ratio of input image resolution to map resolution.
2) ASPP block is configured with four branches: an image pooling branch, a 1 × 1 convolution branch and three 3 × 3 convolution branches with the atrous rates of
3) The skip connection pulls out the low-level feature map, i.e. the output of the 8th layer in ResNet-50. The low-level feature map with 64 channels is adapted to 32-channel by 1 × 1 convolution. The 256-channel high-level feature map is resized to 4× larger with bilinear-interpolation, and concatenated with the low-level features. Thus the final encoder output is a 288-channel multi-scale feature map.
4) In the decoder, the three convolution layers have 3 × 3 kernel and 1 × 1 stride. The first two layers have the 128-channel outputs, and the last layer has the 4-channel output with the 4 output-stride. The first two channels are for segmentation and the last two for contour prediction. Finally, the 4× up-sampling with bilinear interpolation is used to resize the maps to the input size. Batch normalization is applied after convolutional layers to stabilize the training, and Rectified Linear Unit (ReLU) are used for activation. For the training of deep CNN segmentation model, we use the standard cross-entropy loss.
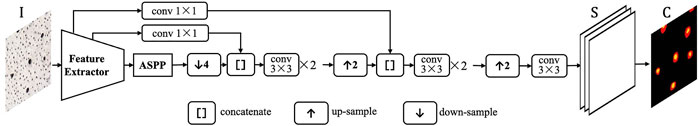
FIGURE 2. Deep CNN structure for fossil osteon segmentation.
For histological thin sections, we sampled 6 taxa of Alvarezsauria dinosaurs from different localities and ages (Table 1.). Long bones including fibula, tibia, femur, and metatarsal are sampled to acquire the growth information. The preparation of bone thin sections can be found in detail in Qin et al. (2021). The primary and secondary osteons are labelled by authors as groundtruth. In total 146 thin sections images with resolution of 2,576 × 1936 are obtained. Only thin section images under normal light are sampled.
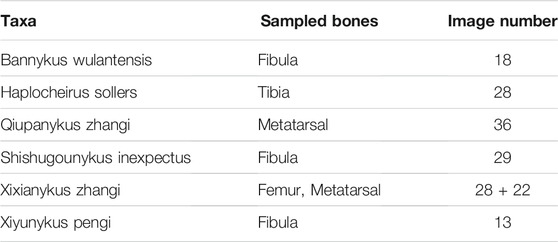
TABLE 1. Sampled Alvarezsaurian dinosaur bone thin sections.
Considering the large pixel size of each thin section image, we first sub-divide each 2,576 × 1936 image into four 1,288 × 968 sub-images (Data Availability: folder Sub-images). Due to their poorly defined boundaries of osteons and large portion of non-tissue areas, Haplocheirus images are excluded from the final dataset. But we still incorporate the raw images in the supplementary materials. Among the rest 146 raw thin section images, 107 images are selected as training dataset and 39 as testing dataset, users can divide the training and testing dataset as needed. Both the training and testing datasets comprise specimens from five Alvarezsaurian dinosaur taxa ranging from large to small body sizes to avoid additional bias in sampling. The primary and secondary osteons in both the training dataset and testing dataset are labelled by authors as the groundtruth, in which every labeled image was cross validated by different authors to reduce the subjective influence to the minimum.
As two segmentation models Φ1 and Φ2 are used for the primary and secondary osteon segmentation, the two models are training separately but under similar training parameters, except the batch sizes due to the significant size differences between primary and secondary osteons. We trained both models for 50 epochs and assigned batch sizes of 16 and 1 for primary and secondary osteons, respectively. Input image sizes are cropped into 256 × 256 in the center of the raw images (Figure 1).
The segmentation results are sorted in the order of intersection over union (IOU):
, thus better segmented images tend to have an IOU score close to 1. After excluding outlier images with too few or no osteon, the segmentation results reached a best IOU score of 0.697 and 0.772 for primary and secondary osteons, respectively. The predicted segmentations and their corresponding original images and groundtruth are illustrated in Figure 3. Several outliers have reached better IOU scores but there are too few osteons in the vision field. The median IOU score for primary and secondary osteons are 0.476 and 0.409. We also calculate the dice, namely the Sørensen–Dice coefficient, to measure the performance of our models in segmenting both the vascular canal (VC) and the entire osteons in different taxa.
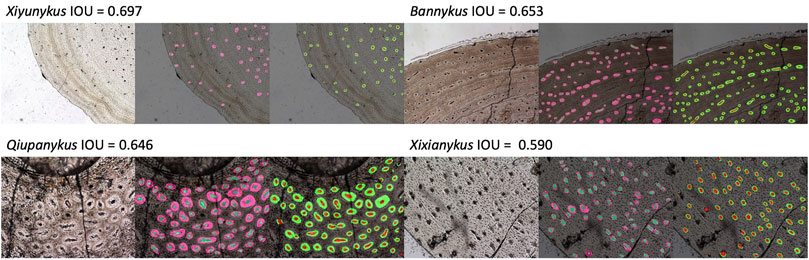
FIGURE 3. Segmentation results of primary and osteons, from left to right: original image, groundtruth, and prediction. The smaller circle in each larger circle labels the vascular canal.
Therefore,
, where TP is true positive, FP is false positive, and FN is false negative.
Alvarezsauria is a highly specialized group of non-avian theropod dinosaurs with worldwide distribution (Bonaparte 1991; Altangerel et al., 1993; Hutchinson and Chiappe, 1998; Naish and Dyke, 2004; Choiniere et al., 2010; Qin et al., 2019; Qin et al., 2021). They have a lot of unique features including the extremely reduced forelimbs and digits, and also resemble birds in many aspects including cranial kinesis, keeled sternums, and backward pointed pubis. During their evolution, Alvarezsaurian dinosaurs suffered sustained miniaturization, which might be due to the transition in diet (Xu et al., 2018; Qin et al., 2021).
Osteon is a fundamental structure in cortical bone. With a roughly cycle shape from transverse bone thin sections, its size and density are informative to both the growth and evolution of organisms. In our segmentation maps, the basalmost taxon Shishugounykus has an average size of individual osteon significantly higher than all other taxa and the density of its primary osteon is correspondingly lower. Two larger Early Cretaceous taxa, Bannykus and Xiyunukus have higher primary osteon density and smaller primary osteon areas than the smaller Late Cretaceous taxa Xixianykus and Qiupanykus (Figures 3, 4C,D). The decrease of primary osteon density and increase in sizes probably indicate more rapid growth due to the truncated period of growing that lead to the substantial miniaturization during the evolution of Alvarezsaurians.
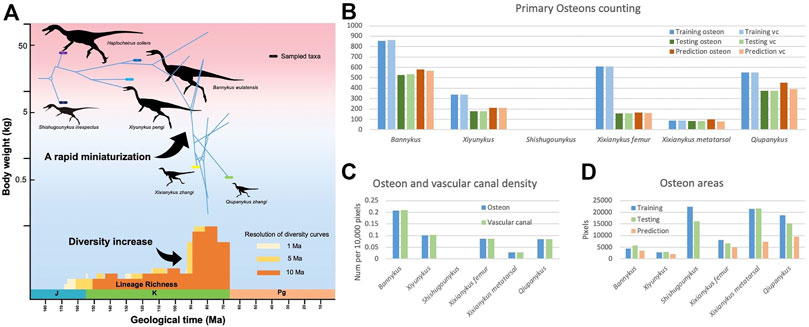
FIGURE 4. (A). simplified Alvarezsauria phylogeny including taxa used in this study, modified from Qin et al. (2021). (B). Number of primary osteons and vascular canal in training, testing, and predicting datasets. (C). Average density of vascular canal in primary osteons. (D). Average areas of primary osteons.
We also noticed that almost all predicted areas of the primary osteons are significantly lower than the groundtruth in both training and testing datasets (Figure 4D), while the predicted areas of the centered vascular canal are close to the groundtruth. Such contrast indicates that the localization of osteons, with the high contrast between dark-colored vascular canal and light-colored surrounding regions, is a relatively easy task for the neural network, but the subsequent expansion to segment the entire osteon unit is more challenging due to vaguely defined border in many images. Moreover, although we applied image-split, center-cropping, and padding to reduce the influences from incomplete osteons, bone remodeling during growth lead to the destruction of many primary osteons and bring challenges in correctly segmenting the entire unit. Another major problem leading to the poor performance in part of the dataset may be small sample size, particularly primary osteons in Shishugounykus (Table 2) that shows outlier 0 in both precision and recall evaluation, indicating a zero value of true positives in segmentation results. There are only 7 and 2 primary osteons manually labeled in the training and testing datasets, respectively. Thin sections from other taxa comprise tens to hundreds of osteons thus avoid such extreme evaluation. On the other hand, generally well-preserved fossils result in better performance, for example Xiyunykus and Banykus specimens, while more poorly preserved fossils with numerous fractures and non-tissue areas can only be deficiently segmented like the Qiupanykus specimen. By sampling better preserved fossils and use sub-divided images that bypass those noises may lead to better segmentation performance, but whether such sampling strategy introduces other kinds of bias remains to be tested.
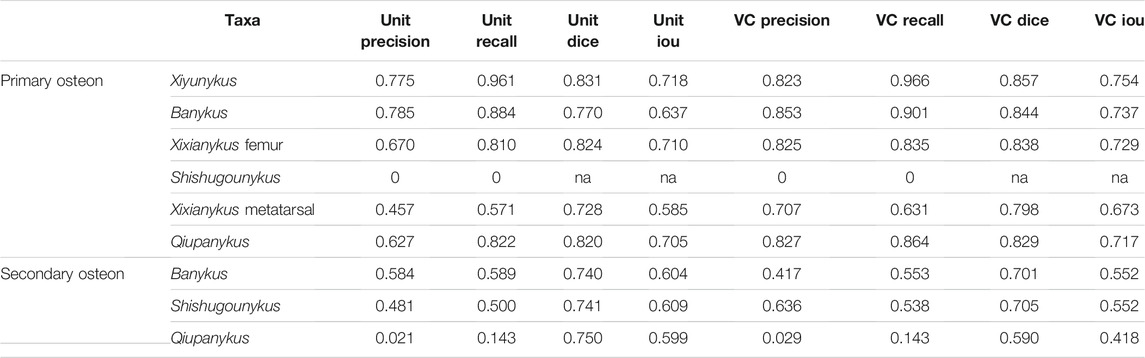
TABLE 2. Detailed segmentation results.
Due to the limit of available specimens, this study trained models based on a dataset covering neither the complete phylogeny nor the ontogeny of known Alvarezsaurian dinosaurs, which shall significantly influence the performance of segmentation prediction. As most well performed CNNs are trained on enormous datasets, which may comprise millions or even more images, adding new data to train our CNN is highly likely to improve its performance and may strengthen its generalization to more broadly sampled dinosaur specimens. Based on the increasing of paleontological images, data-driven studies using CNNs would soon facilitate paleontologists studying evolutionary questions.
The datasets presented in this study can be found in online repositories. The names of the repository/repositories and accession number(s) can be found in the article/Supplementary Material.
ZQ and CY designed the project. ZQ provide the raw bone thin section images. FQ and YL designed the neural network and performed the training. Everyone put efforts in labeling the datasets groundtruth, analysing the results and preparing the manuscript.
The authors declare that the research was conducted in the absence of any commercial or financial relationships that could be construed as a potential conflict of interest.
All claims expressed in this article are solely those of the authors and do not necessarily represent those of their affiliated organizations, or those of the publisher, the editors and the reviewers. Any product that may be evaluated in this article, or claim that may be made by its manufacturer, is not guaranteed or endorsed by the publisher.
We thank Xu Xing at the Institute of Vertebrate Paleontology and Paleoanthropology, Beijing, China for providing the histological thin sections and constructive comments. We also thank Shukang Zhang at the Institute of Vertebrate Paleontology and Paleoanthropology, Beijing, China for assistance in preparing these bone thin sections and photographing. We further thank 3 reviewers for their comments and feedback that substantially improve the quality of this paper. CY is funded by the Newt and Calista Gingrich Endowment.
Altangerel, P., Norell, M. A., Chiappe, L. M., and Clark, J. M. (1993). Flightless Bird from the Cretaceous of Mongolia. Nature 362 (6421), 623–626. doi:10.1038/362623a0
Bailleul, A. M., O’Connor, J., and Schweitzer, M. H. (2019). Dinosaur Paleohistology: Review, Trends and New Avenues of Investigation. PeerJ 7, e7764. doi:10.7717/peerj.7764
Bonaparte, J. F. (1991). Los vertebrados fósiles de la Formación Río Colorado, de la ciudad de Neuquén y cercanías, Cretácico superior. Argentina: Museo Argentino de Ciencias Naturales" Bernardino Rivadavia" e Instituto.
Canoville, A., Schweitzer, M. H., and Zanno, L. (2020). Identifying Medullary Bone in Extinct Avemetatarsalians: Challenges, Implications and Perspectives. Phil. Trans. R. Soc. B 375, 20190133. doi:10.1098/rstb.2019.0133
Chen, L., Bentley, P., Mori, K., Misawa, K., Fujiwara, M., and Rueckert, D. (2018). DRINet for Medical Image Segmentation. IEEE Trans. Med. Imaging 37 (11), 2453–2462. doi:10.1109/TMI.2018.2835303
Chen, L. C., Zhu, Y., Papandreou, G., Schroff, F., and Adam, H. (2018). “Encoder-Decoder with Atrous Separable Convolution for Semantic Image Segmentation,” in Computer Vision – ECCV 2018 (Lecture Notes in Computer Science). Editors V Ferrari, M. Hebert, C. Sminchisescu, and Y. Weiss (Cham: Springer International Publishing), 833–851. doi:10.1007/978-3-030-01234-2_49
Choiniere, J. N., Xu, X., Clark, J. M., Forster, C. A., Guo, Y., and Han, F. (2010). A Basal Alvarezsauroid Theropod from the Early Late Jurassic of Xinjiang, China. Science 327 (5965), 571–574. doi:10.1126/science.1182143
Erickson, G. M., and Tumanova, T. A. (2000). Growth Curve of Psittacosaurus Mongoliensis Osborn (Ceratopsia: Psittacosauridae) Inferred from Long Bone Histology. Zoolog. J. Linn. Soc. 130 (4), 551–566. doi:10.1111/j.1096-3642.2000.tb02201.x
Erickson, G. M., Makovicky, P. J., Currie, P. J., Norell, M. A., Yerby, S. A., and Brochu, C. A. (2004). Gigantism and Comparative Life-History Parameters of Tyrannosaurid Dinosaurs. Nature 430 (7001), 772–775. doi:10.1038/nature02699
Erickson, G. M., Makovicky, P. J., Inouye, B. D., Zhou, C.-F., and Gao, K.-Q. (2009). A Life Table forPsittacosaurus Lujiatunensis: Initial Insights into Ornithischian Dinosaur Population Biology. Anat. Rec. 292 (9), 1514–1521. doi:10.1002/ar.20992
Erickson, G. M. (2014). On Dinosaur Growth. Annu. Rev. Earth Planet. Sci. 42 (1), 675–697. doi:10.1146/annurev-earth-060313-054858
Falcon-Lang, H. J., and Digrius, D. M. (2014). Palaeobotany Under the Microscope: History of the Invention and Widespread Adoption of the Petrographic Thin Section Technique. Quekett Journal of Microscopy 42, 253–280.
Gibson, E., Giganti, F., Hu, Y., Bonmati, E., Bandula, S., Gurusamy, K., et al. (2018). Automatic Multi-Organ Segmentation on Abdominal CT with Dense V-Networks. IEEE Trans. Med. Imaging 37 (8), 1822–1834. doi:10.1109/TMI.2018.2806309
Gu, Z., Cheng, J., Fu, H., Zhou, K., Hao, H., Zhao, Y., et al. (2019). CE-net: Context Encoder Network for 2D Medical Image Segmentation. IEEE Trans. Med. Imaging 38 (10), 2281–2292. doi:10.1109/TMI.2019.2903562
Haridy, Y., Osenberg, M., Hilger, A., Manke, I., Davesne, D., and Witzmann, F. (2021). Bone Metabolism and Evolutionary Origin of Osteocytes: Novel Application of FIB-SEM Tomography. Sci. Adv. 7 (14), eabb9113. doi:10.1126/sciadv.abb9113
He, K., Zhang, X., Ren, S., and Sun, J. (2016). Identity Mappings in Deep Residual Networks. arXiv:1603.05027 [cs] [Preprint]. Available at: http://arxiv.org/abs/1603.05027 (Accessed May 23, 2021).
Hutchinson, J. R., and Chiappe, L. M. (1998). The First Known Alvarezsaurid (Theropoda: Aves) from North America. J. Vertebr. Paleontol. 18 (3), 447–450. doi:10.1080/02724634.1998.10011073
Lehman, T. M., and Woodward, H. N. (2008). Modeling Growth Rates for Sauropod Dinosaurs. Paleobiology 34 (2), 264–281. doi:10.1666/0094-8373(2008)034[0264:mgrfsd]2.0.co;2
Mantell, G. A. (1850). XVI. On the Pelorosaurus; an Undescribed Gigantic Terrestrial Reptile Whose Remains Are Associated with Those of the Iguanodon and Other Saurians in the Strata of Tilgate Forest, in Sussex. Phil. Trans. R. Soc. 140, 379–390. doi:10.1098/rstl.1850.0017
Mantell, G. A. (1851). On a Dorsal Dermal Spine of the Hylæosaurus Recently Discovered in the Strata of Tilgate forest. Proc. R. Soc. Lond. 5, 957–958. doi:10.1098/rspl.1843.0248
Naish, D., and Dyke, G. J. (2004). Heptasteornis Was No Ornithomimid, Troodontid, Dromaeosaurid or Owl: The First Alvarezsaurid (Dinosauria: Theropoda) from Europe. Neues Jahrbuch Fur Geologie Und Palaontologie - Monatshefte 2004, 385–4001. doi:10.1127/njgpm/2004/2004/385
Oktay, O., Ferrante, E., Kamnitsas, K., Heinrich, M., Bai, W., Caballero, J., et al. (2018). Anatomically Constrained Neural Networks (ACNNs): Application to Cardiac Image Enhancement and Segmentation. IEEE Trans. Med. Imaging 37 (2), 384–395. doi:10.1109/TMI.2017.2743464
Padian, K., Horner, J. R., and De Ricqlès, A. (2004). Growth in Small Dinosaurs and Pterosaurs: The Evolution of Archosaurian Growth Strategies. J. Vertebr. Paleontol. 24, 555–571. doi:10.1671/0272-4634(2004)024[0555:gisdap]2.0.co;2
Qin, Z., Clark, J., Choiniere, J., and Xu, X. (2019). A New Alvarezsaurian Theropod from the Upper Jurassic Shishugou Formation of Western China. Sci. Rep. 9, 11727. doi:10.1038/s41598-019-48148-7
Qin, Z., Zhao, Q., Choiniere, J. N., Clark, J. M., Benton, M. J., and Xu, X. (2021). Growth and Miniaturization Among Alvarezsauroid Dinosaurs. Curr. Biol. 31, 3687–3693. doi:10.1016/j.cub.2021.06.013
Ronneberger, O., Fischer, P., and Brox, T. (2015). U-net: Convolutional Networks for Biomedical Image Segmentation. arXiv:1505.04597 [cs] [Preprint]. Available at: http://arxiv.org/abs/1505.04597 (Accessed May 23, 2021).
Sander, M. P., Mateus, O., Laven, T., and Knötschke, N. (2006). Bone Histology Indicates Insular Dwarfism in a New Late Jurassic Sauropod dinosaur. Nature 441 (7094), 739–741. doi:10.1038/nature04633
Wang, Y., Ni, D., Dou, H., Hu, X., Zhu, L., Yang, X., et al. (2019). Deep Attentive Features for Prostate Segmentation in 3D Transrectal Ultrasound. IEEE Trans. Med. Imaging 38 (12), 2768–2778. doi:10.1109/TMI.2019.2913184
Xu, X., Choiniere, J., Tan, Q., Benson, R. B. J., Clark, J., Sullivan, C., et al. (2018). Two Early Cretaceous Fossils Document Transitional Stages in Alvarezsaurian Dinosaur Evolution. Curr. Biol. 28, 2853–2860. doi:10.1016/j.cub.2018.07.057
Zhao, Q., Benton, M. J., Sullivan, C., Martin Sander, P., and Xu, X. (2013). Histology and Postural Change during the Growth of the Ceratopsian dinosaur Psittacosaurus Lujiatunensis. Nat. Commun. 4 (1), 2079. doi:10.1038/ncomms3079
Zhou, S., Nie, D., Adeli, E., Yin, J., Lian, J., and Shen, D. (2020). High-Resolution Encoder-Decoder Networks for Low-Contrast Medical Image Segmentation. IEEE Trans. Image Process. 29, 461–475. doi:10.1109/TIP.2019.2919937
Keywords: dinosaur, histology, osteon, deep learning, segmentation, alvarezsauria
Citation: Qin Z, Qin F, Li Y and Yu C (2022) Intelligent Objective Osteon Segmentation Based on Deep Learning. Front. Earth Sci. 10:783481. doi: 10.3389/feart.2022.783481
Received: 26 September 2021; Accepted: 13 January 2022;
Published: 03 February 2022.
Edited by:
Daniel Vidal, National University of Distance Education (UNED), SpainReviewed by:
Linda Satour, University of Oran 2, AlgeriaCopyright © 2022 Qin, Qin, Li and Yu. This is an open-access article distributed under the terms of the Creative Commons Attribution License (CC BY). The use, distribution or reproduction in other forums is permitted, provided the original author(s) and the copyright owner(s) are credited and that the original publication in this journal is cited, in accordance with accepted academic practice. No use, distribution or reproduction is permitted which does not comply with these terms.
*Correspondence: Congyu Yu, Y3l1QGFtbmgub3Jn
Disclaimer: All claims expressed in this article are solely those of the authors and do not necessarily represent those of their affiliated organizations, or those of the publisher, the editors and the reviewers. Any product that may be evaluated in this article or claim that may be made by its manufacturer is not guaranteed or endorsed by the publisher.
Research integrity at Frontiers
Learn more about the work of our research integrity team to safeguard the quality of each article we publish.