 Birhanu A. Kibret
 Atalay Ayele
 Derek Keir
- 1Institute of Geophysics, Space Science and Astronomy, Addis Ababa University, Addis Ababa, Ethiopia
- 2School of Ocean and Earth Science, University of Southampton, Southampton, United Kingdom
- 3Dipartimento di Scienze Della Terra, Università Degli Studi di Firenze, Florence, Italy
We applied the receiver function (RF) technique on high-quality teleseismic earthquake data recorded by the RiftVolc broadband network from February 2016 to October 2017. We calculate RFs at 17 stations, which are inverted to estimate Vs, and Vp/Vs structure beneath the Central Main Ethiopian Rift and the Eastern plateau. The observed slow S-wave velocity (Vs) in the uppermost crust (<6 km depth) is interpreted as sedimentary and/or volcanic layers. Beneath the rift valley, crustal Vs is heterogeneous both laterally and with depth. In particular, slow Vs (∼2–3 km/s) is localised beneath volcanic centres in the upper-mid crust but ubiquitously slow in the lower crust with Vs as low as ∼3.5 km/s common. The slow lower crust is associated with high Vp/Vs ratios of ∼1.9–2.0. The Vs and Vp are consistent with the observed seismic velocities, and interpreted the presence of the small fraction (<5%) of partial melt from previous seismic imaging studies of the lower crust. In addition, the velocity contrast is small between the lower crust and upper mantle. The results suggest that partial melt in the lower crust beneath magmatically active rifts might be more widespread than previously thought and an important component of the magma plumbing system. In contrast, Vs is far more homogeneous and faster beneath the Eastern Plateau, with a distinct velocity contrast between the crust and upper mantle suggesting less crustal deformation than what is observed beneath the central rift zone.
Introduction
The Main Ethiopian Rift (MER) is an active continental rift where magmatic intrusion is thought to play a key role by accommodating extension and thermally weakening the lithosphere (Kendall et al., 2005; Daniels et al., 2014). Since the start of the Ethiopia-Afar Geoscientific Lithospheric Experiment (Bastow et al., 2011) in the early 2000s, consecutive and successful controlled and passive seismic deployments helped to delineate the seismic structure of the MER crust, especially the P-wave velocity (Vp) structure and crustal thickness (e.g., Ebinger et al., 2017). A major finding of previous P-wave images is that the Vp of the crust beneath the MER is faster than that of standard continental crust (Zandt and Ammon, 1995), a feature interpreted as caused by post-Miocene mafic intrusions that have accommodated extension (e.g., Keranen et al., 2004; Mackenzie et al., 2005).
More recently, however, the advent of ambient noise tomography at periods sufficiently short has facilitated imaging of shear-wave velocity (Vs) of the crust (e.g., Kim et al., 2012; Chambers et al., 2019). Results from these studies show that the MER crust has far slower Vs than the standard continental crust, with the absolute magnitude of the velocities in places interpreted to require the presence of partial melt (e.g., Chambers et al., 2019). The joint crustal seismic properties of relatively fast Vp and slow Vs are peculiar and poorly explored in previous literature. In addition, all previous constraints on the Vs structure of the MER come from models derived from surface wave imaging techniques, such as ambient noise tomography, with a lack of independent constraints provided by alternative methods.
In order to address this and provide additional and independent constraints on the Vs structure of the MER crust, we applied the receiver function (RF) techniques using open-source codes from Computer Programs for Seismology (CPS) (Herrmann and Ammon, 2004) to estimate the velocity of the crust and upper mantle. To this effect, we have used 17 new seismic stations deployed as part of the 2016–2017 RiftVolc project (Greenfield et al., 2019; Lavayssière et al., 2019) to improve our understanding of the spatial variations of the crustal Vs structure within the central MER (CMER) and adjacent Eastern Plateau. In addition, we use the RF technique to constrain the Vp and Vp/Vs ratio. In investigating the heterogeneous structure, we have chosen two vertical cross-sections to represent the area of our study (Figure 1). One profile (A–A′) is along the rift, and the other profile is across the rift (B–B′). This study improves on the previous velocity models and Moho depth estimates of the CMER and Eastern Plateau (Dugda et al., 2005; Keranen et al., 2009) by using a relatively large number of broadband seismic stations compared with the previous studies.
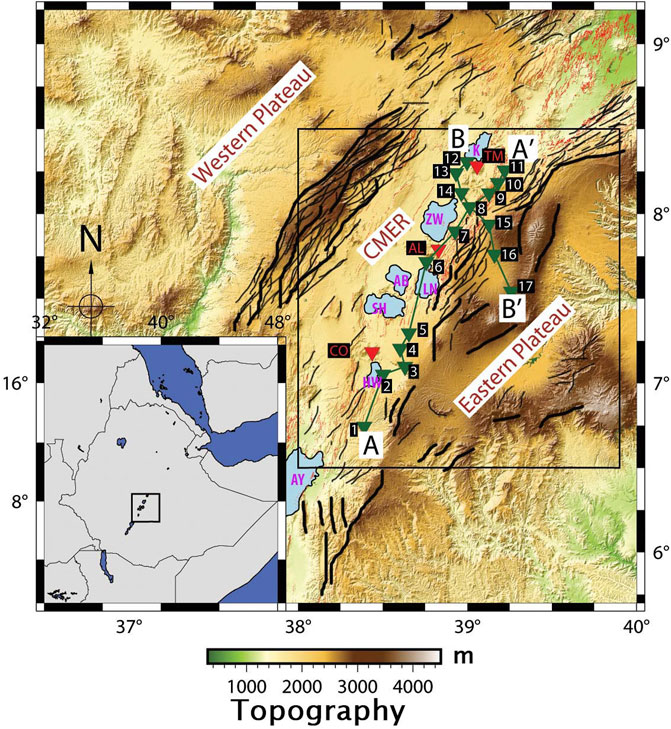
FIGURE 1. The black rectangle is the study area in the Central Main Ethiopian Rift. Profile AA′ is along the eastern side of the Central Main Ethiopian Rift floor (along-rift) profile. Profile BB′ is the across-rift profile. Green reversed triangles represent the station location of 17 stations. Red -reversed triangles represent the locations of Corbetti (CO), Aluto (AL), and Tulu Moye (TM) calderas. The red thin and dense line represents the faults of the Main Ethiopian Rift (MER) (Corti et al., 2020). The bottom left corner inset shows the regional map, with a square for the area of our study. Names of the lakes are labelled by pink-coloured letters as AY (Abaya), HW (Hawasa), SH (Shala), AB (Abayata), LN (Langano), ZW (Ziway), and K (Koka).
Tectonic setting and crustal structure
The CMER formed within the Oligocene Ethiopian flood basalt province and is thought to have initiated at between ∼20 and ∼10 Ma (e.g., Wolfenden et al., 2004; Bonini et al., 2005; Corti, 2009). The extension was initially localized to several ∼60-km-long, NE-SW striking, high-angle (>60°) border faults that bound the rift, such as the Boru-Toru and the Goba-Bonga structural lineament on the western side of the rift, and the Asela-Sire Border Fault on the eastern side of the rift (Bonini et al., 2005; Corti et al., 2020). Since the Quaternary, the locus of tectonic and magmatic activity within the CMER is thought to have become focused to a ∼20-km-wide zone of small offset faults, aligned cones, and active volcanic centres within the rift valley floor known as the Wonji Fault Belt (WFB), and also at a few rift marginal magmatic systems, such as the Silti-Debre Zeyit Fault Zone (SDFZ) towards the western side of the rift (Woldegabriel et al., 1990; Rooney et al., 2014; Chiasera et al., 2018).
Constraints on the crustal structure in the CMER come from several geophysical techniques including seismology, magnetotellurics (MT), and inversion of gravity data. Constraints on crustal thickness come from sparse RF measurements (Dugda et al., 2005; Keranen et al., 2009; Kibret et al., 2019), the wide-angle controlled-source along-rift EAGLE project line, and the intra-crustal Vs structure using ambient noise tomography (Kim et al., 2012; Chambers et al., 2019).
Previous RF studies in the CMER using relatively sparse station spacing show that the crust is 27- to 40-km thick in the rift (Dugda et al., 2005; Keranen et al., 2009) and 33- to 44-km thick beneath the plateaus (Dugda et al., 2005; Kibret et al., 2019). The crustal structure beneath the Western Plateau is more heterogeneous (33- to 44-km thick) (Keranen et al., 2009) than that beneath the Eastern Plateau (38- to 41 km thick) (Dugda et al., 2005; Keranen et al., 2009; Kibret et al., 2019). Wide-angle controlled-source seismology provides further constraints in the CMER, and Western and Eastern Plateaus. The EAGLE across-rift line shows similar crustal thicknesses of 38–40 km beneath the CMER (Dugda et al., 2005; Maguire et al., 2006; Stuart et al., 2006), and 35–45 and 37–42 km beneath the Western and Eastern Plateaus, respectively (Dugda et al., 2005; Stuart et al., 2006; Cornwell et al., 2010; Hammond et al., 2011; Kibret et al., 2019).
The southern end of the EAGLE along-rift wide-angle controlled-source line is as far south as Lake Hawasa (near HAWA station) and shows a varied along-rift crustal structure in the CMER (Mackenzie et al., 2005; Maguire et al., 2006). The Vp structure, modelled by the wide-angle 2D profile studies, shows that the velocities of the upper crustal layers beneath the rift are 5%–10% higher than outside the rift, a feature interpreted to be caused by mafic intrusions associated with magmatic centres (Mackenzie et al., 2005; Maguire et al., 2006). Consistent with this, 3D controlled-source tomography of the upper crust by Keranen et al. (2004) imaged rift parallel high Vp (∼6.5–6.8 km/s) elongated bodies with a size of 20-km wide and 50-km long, and interpreted them as cooled mafic intrusions that are separated laterally from one another in a right-stepping en-echelon pattern, which corresponds with the surface segmentation of the WFB. These fast Vp regions correlate to a region of distinct positive Bouguer anomalies in gravity studies that are modelled as regions of dense rock (∼3,000 kg/m3) such a gabbro (e.g., Mahatsente et al., 1999; Cornwell et al., 2006).
In addition to the earliest studies revealing crustal structure in the MER based on Vp structure, later studies applied surface waves to render the Vs structure. Ambient noise tomography has been used to construct Rayleigh-wave group velocity maps covering the northern MER (NMER), CMER, and southern MER (SMER), and parts of the surrounding plateaus (Kim et al., 2012; Chambers et al., 2019). Chambers et al. (2019) also presented an absolute 3D Vs model of the crust and uppermost mantle of the region. An important feature of the Vs images is that the MER crust is mostly significantly slower than away from the rift, in contrast to the Vp, which is generally faster within the rift. The absolute Vs of less than 3.20 km/s + 0.03 in the lower crust are difficult to explain except with the presence of a fluid phase in the rock, such as partial melt (Chambers et al., 2019). In addition, slow Vs (<3.6 km/s) in the uppermost crust observed by Chambers et al. (2019) is consistent with the presence of sediments and/or partial melt (Diaferia and Cammarano, 2017).
Some studies reported that the anomalous high temperature is an important player on velocity structure in the case when it can trigger the transition of α–β quartz. In case of hydrated compositions (as one can presume about the current case study for the rift zone), the amphibole breakdown at increasing pressure and temperature produces a discontinuity that can be detected by RF or refraction studies (Guerri et al., 2015; Diaferia and Cammarano, 2017).
Similarly, several MT studies carried out in the CMER identify high conductivity anomalies associated with young surface volcanism (Whaler and Hautot, 2006). These conductive anomalies tend to be imaged in the uppermost crust at <1–2 km, in the upper crust at ∼3–6 km depth, and in the mid-lower crust at 20–25 km depth (Ebinger et al., 2017; Hübert et al., 2018). The shallowest anomaly is interpreted as being caused by hydrothermal fluids, whereas the other deeper high conductivity anomalies are interpreted to be caused by partial melt in the subvolcanic plumbing system (Ebinger et al., 2017; Hübert et al., 2018). Broadly speaking, there is a good correlation between the loci of slow Vs from seismology and high conductivities, giving additional remark to the idea that these anomalies are caused by partial melt (Chambers et al., 2019).
Data and methods
Data
The data were acquired from the RiftVolc temporary network project that was conducted from February 2016 to October 2017 and recorded by three-component broadband Guralp CMG-6TD and Guralp CMG-ESPCD seismometers with a 50-Hz sampling rate. We downloaded the teleseismic waveform data and instrument responses of the RiftVolc project data archived at the Incorporated Research Institutions for Seismology (IRIS) Data Management Center (DMC).
To constrain the Vs and Vp/Vs structure beneath 17 stations, which are deployed along and across the CMER 60 teleseismic earthquakes with magnitudes, Mw ≥ 6 and source-to-receiver epicentral distances between 30° and 90° (Figure 2) were chosen. However, after calculating the RFs, only 8–38 signals were selected per station based on the percentage of signal power fit (Table 1).
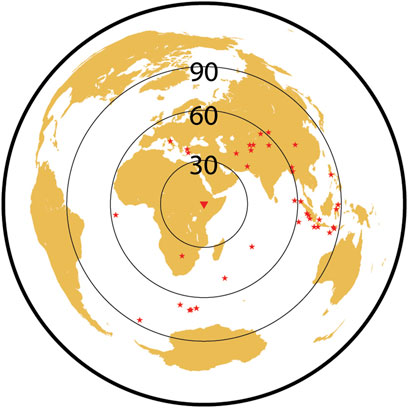
FIGURE 2. Red circles are locations of the teleseismic earthquakes used for the study. The data collected are in the distance ranging from 30° to 90° in the time range of February 2016 to October 2017. The dark blue triangle is the central location of the 17 seismic stations used in this study.
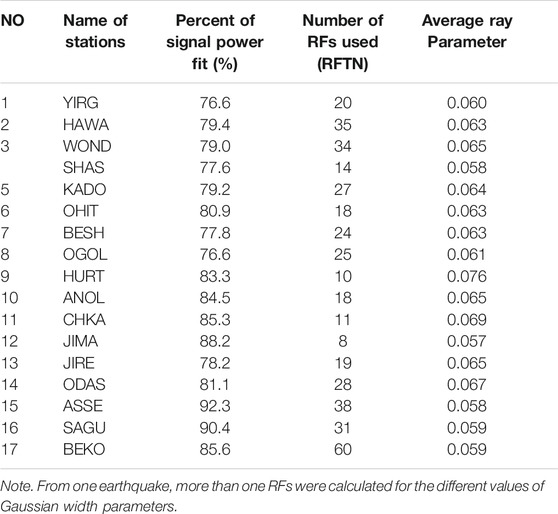
TABLE 1. The table shows the names of stations, the percent of signal power fit between observed and synthetic seismograms, and the number of receiver functions (RFs) used in the analysis during the model fit calculations.
Data were processed in SAC format. We applied a cosine taper function for the P-waveform signal for a length of 50 s (10 s before and 40 s after the onset of the P-wave arrival) before computing the RFs. To reduce the influence of low-frequency noise on the RFs, all the signals were filtered with a Butterworth bandpass filter of between 0.01 and 5 Hz to ensure the stability of the RFs and to avoid aliasing when decimating the data. Finally, each three-component signal was reviewed to remove signals that contained low signal-to-noise ratios and/or when any of the three components were not recorded properly due to instrument malfunction.
Methods
We applied an RF technique using time series teleseismic earthquakes to provide constraints on the local velocity structure of the crustal and upper mantle (Langston, 1979; Ammon et al., 1990). To extract the RF for each event, we first window the three-component seismograms starting from 10 s before and 40 s after the predicted P arrival. Selected teleseismic seismograms are rotated to radial (R), tangential (T), and vertical (Z) components from east–west, north–south, and vertical components, respectively. Each pair of horizontal-component signals (i.e., north–south and east–west components) was rotated to their corresponding radial and transverse directions.
A straightforward frequency domain deconvolution can be unstable due to spectral holes in the vertical component, and stabilization of this process can be obtained by either “pre-whitening” (Roninson, 1982; Yilmaz, 2001); or “water-level” algorithms. The former adds a small component of random noise to the vertical component, while the latter sets a lower bound on the magnitude of the denominator terms (the vertical seismogram spectral elements) in a frequency domain spectral division. In this study, converted phases are isolated by iterative, time-domain spiking deconvolution (Gurrola et al., 1995; Ligorria and Ammon, 1999) with pre-whitening to stabilize the filtering. Iterative time domain deconvolution works well even with complex signals. However, regardless of a deconvolution algorithm, the response at the receiver depends on the complexity of structures. Simple structures generally lead to better RF images (Ligorria and Ammon, 1999). After deconvolving the vertical from the radial component, we removed the signature of source, travel path, and instrumental response effects (Langston, 1979; Ammon et al., 1990; Dugda et al., 2005; Kibret et al., 2019) employing the signals coming from four different back azimuths (Figure 3).
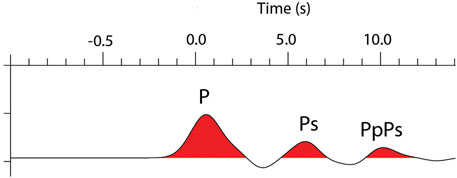
FIGURE 3. This is a sampled receiver function (RF), which is calculated from the deconvolution of the horizontal from the vertical component. The deconvolution is processed from the data collected by the ASSE station from an earthquake coming from a ∼178° azimuth. The diagram shows the direct P and the converted Ps and the PpPs multiples.
The RF technique is a time series when the radial component trace is deconvolved from its vertical component seismogram, where the timing and amplitude of the RF phases are sensitive to the near receiver local Earth structure beneath the seismic station (Langston, 1979). The dominant signal in the first few seconds of the RF is the Ps conversion from the Moho and/or intracrustal velocity contrast followed by reverberated phases within the crust (e.g., Last et al., 1997; Hammond, 2014). In case of using a relatively dense array, RFs can show the fine crustal heterogeneity, anisotropy, and dipping structures (Eckhardt and Rabbel, 2011; Liu and Niu, 2012; Niu and James, 2002; Thybo et al., 2019; Youssof et al., 2013, Youssof et al., 2015).
Each RF was deconvolved for 20 iterations with a limiting error of 0.001 by applying three different Gaussian width parameters of 0.5, 1.0, and 2.5. We applied an iterative deconvolution algorithm (Kiknchi and Kanamori, 1982), which is calculated by the division of the denominator from the numerator (Herrmann and Ammon, 2004). Also, in each case, we allowed iteration to continue until the change in misfit resulting from the addition of a spike was 0.01% (Ligorria and Ammon, 1999). The degree of fit between the synthetic and observed RFs is calculated from the three Gaussian width parameters. A sample of two RFs is selected from 17 stations based on their percent of fit to demonstrate the overall results throughout each step (Figures 4, 5).
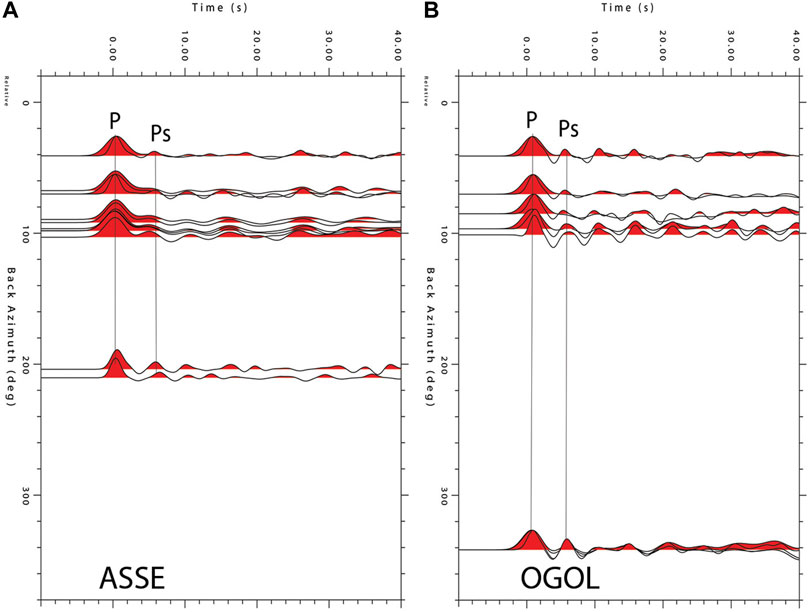
FIGURE 4. (A) and (B) are examples of RFs calculated for signals coming from different azimuths. Positive values were filled with red ink to emphasize prominent features, such as the direct P and the Ps phase, which is the P-to-S conversion.
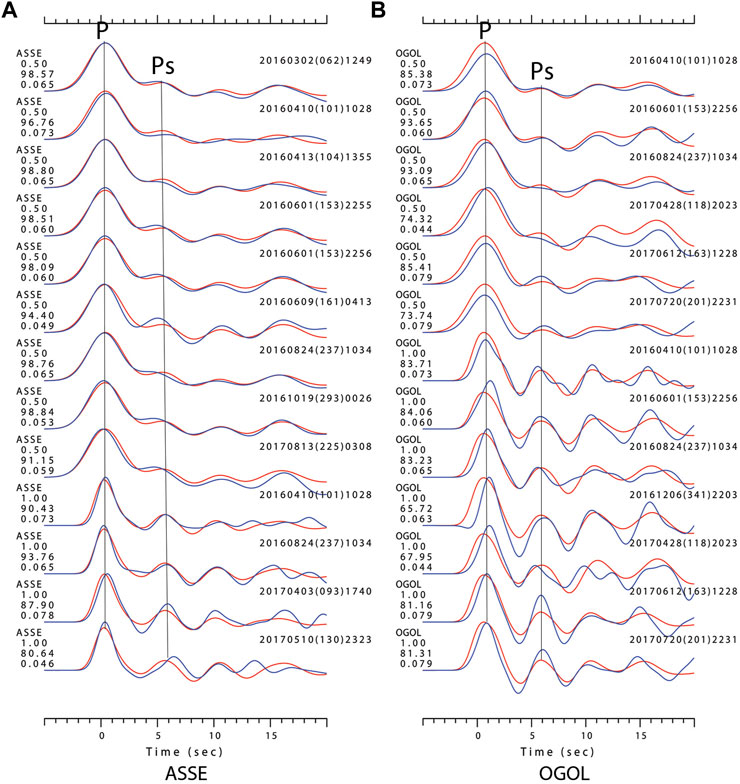
FIGURE 5. (A) and (B) are RFs of ASSE and OGOL stations. The ASSE station located on the eastern plateau, which is the best fit RF of this study, whereas station OGOL is located in the central MER (CMER) rift margin near the eastern plateau, which has the largest misfit of all the RFs. Blue-coloured RFs in the background are synthetic, whereas the red-coloured RFs on top are the observed RFs. P represents the direct primary wave, and Ps is the converted phase at the Moho. The numbers on the left show the station name, Gaussian width parameter, percentage of fit, and the applied ray parameters for the specified RF. The numbers to the right of the RFs are the occurrence time of the earthquakes. In (A), two signals and in (B) six signals are calculated twice for the Gaussian width parameters of 0.5 and 1.0.
The study applies the ak135 velocity model (Kennett et al., 1995) as the initial velocity model to calculate the best fit velocity structure. Finally, we identified the level of the model fit of the observed and synthetic models by using both visual inspection and the calculated percentage of signal power fit. When the synthetic signals show a high degree of a misfit from the calculated RFs, both RFs and the synthetic models are automatically discarded.
The observed (red colour) and synthetic (blue colour) RFs (Figure 5) as well as the initial and the final velocity models (Figure 6) are calculated by using programs from Herrmann and Ammon (2004). The final velocity models are calculated from the global velocity model ak135. The calculated absolute velocity values at every 2-km depth are obtained from the inversions of the RFs. The uncertainties of the calculated RFs are estimated from the percentage of fit between the observed and the calculated RF. Subsequently, well-constrained Vs structures of the crust and upper mantle are provided in the 2D profiles.
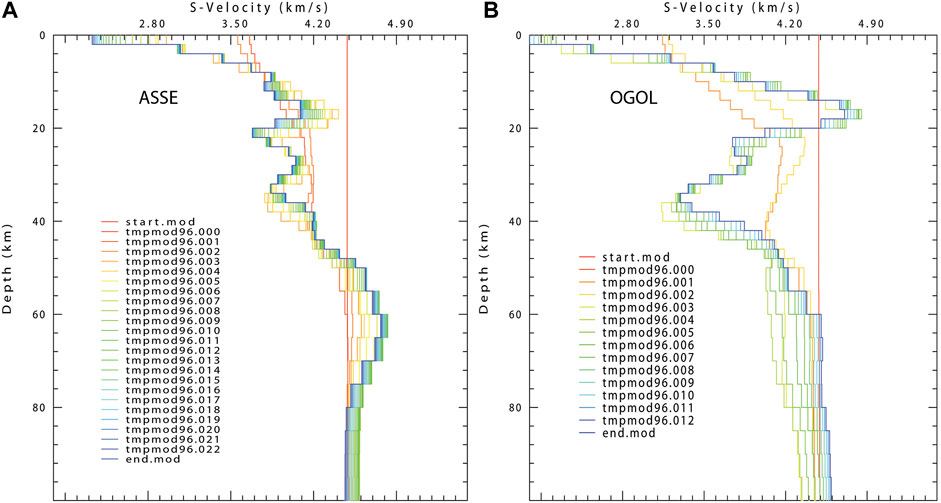
FIGURE 6. Panels (A) and (B) are the two representative velocity models for the ASSE and OGOL stations. The nearly vertical start. mod is an initial half space velocity model derived from the ak135 global velocity model (Kennett et al., 1995) and the end. mod is the final and best-fit velocity model. The tmpmod96. xxx are the calculated velocity models from the relatively less fit RFs during an inversion.
We applied the Delaunay triangulation interpolation method to estimate unknown velocities based on several known calculated velocities (Ping et al., 2009). The method uses three velocities at a time by assuming no points inside the circumference of any triangle. We applied this interpolation method as implemented in the GMT plotting software (Wessel et al., 2019) by triangulating and contouring the calculated velocity values to image the 2D velocity versus depth plots.
Crustal thickness and Vp/Vs ratio are estimated from the a priori known Vp value obtained from two-dimensional wide-angle seismic modelling from the EAGLE controlled-source survey (Mackenzie et al., 2005; Maguire et al., 2006) in the region. During our inversion, we calculated Vs values at 2-km-depth intervals. Again, we employed the mathematical model by Last et al. (1997) and Zhu and Kanamori, (2000) to get the Moho depth (H) at each station, where tPs − tP is the time interval between the arrival of the direct P wave and the Moho Ps converted phase, and p is the average ray parameter calculated from RFs.
Results
We computed observed and synthetic RFs at 17 stations where the degree of fit is between 77%–92% (at station OGOL and ASSE, respectively), as shown in Table 1. The range of degree of fit between observed and synthetic seismograms is similar to what is previously reported (70%–90%) in Ethiopia and Kenya by Dugda et al. (2005).
The current RFs are obtained with two clusters of range of back-azimuths of 30°–110o and 185°–260o (Figure 4). The first arrival spike is the direct incident P wave at the surface; however, the subsequent arrivals correspond to the partition of converted and reverberated phases (Figures 3 and 5).
For the two examples of observed RF in Figure 4, we present the RF of each event with the corresponding synthetic RF in Figure 5. In this model, the red-coloured RFs are the observed signals, whereas the blue colour shows the synthetic ones. The observed and synthetic RFs (Figure 5) show a high degree of fit for the Gaussian width parameters of α = 0.5 and α = 1.0.
Figure 6 indicates the 1D velocity models for the chosen two stations. These velocity models are calculated from the blue-coloured synthetic RFs shown in Figure 5. They are calculated in the depth range of 2–100 km. The blue-coloured nearly vertical line is the initial velocity model, which is assumed as a homogeneous half space with a Vs of ∼4.48 km/s, which is the value of most of the lithosphere in the ak135 velocity model (Kennett et al., 1995).
From the calculated 1D Vs models shown in Figure 6, the red-coloured 1D velocity value is the final and best fit calculated Vs model. From the models, the ASSE station, which is located on the Eastern Plateau shows very small heterogeneity in the upper and lower crust. However, station OGOL is located on the CMER floor and shows a heterogeneous velocity structure with a relatively high velocity of up to ∼4.6 ± 0.1 km/s in the upper crust and a relatively low velocity of as low as 3.4 ± 0.1 km/s in the lower crust.
For the remainder of the stations, we have shown the results in the form of the along- and across-rift profiles (Figure 7). Broadly speaking, the velocity models show a distinctive reduction in Vs in the mid to lower crust similar to that observed at OGOL (Figure 6), or a more regular increase in Vs with depth as observed at ASSE (Figure 6). Closer inspection for the stations along the rift shows that the velocity model varies considerably spatially with both styles of velocity structure observed in different places within the rift. In contrast, the across-rift profile shows that the stations on the Eastern Plateau have a velocity structure more similar to ASSE.
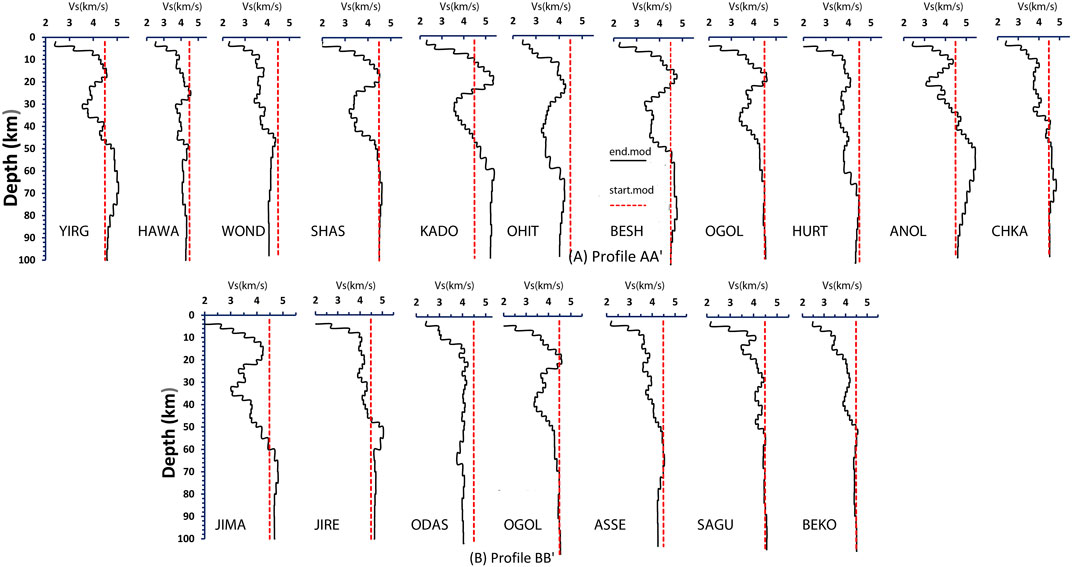
FIGURE 7. Figure (A) The 1D velocity model for the along-rift profile AA′, which is located along the eastern margin of the central main Ethiopian rift profile. (B) The 1D velocity model for the across-rift profile, which includes the rift side (JIMA, JIRE, ODAS, and OGOL) and plateau side (ASSE, SAGU, and BEKO) stations.
The upper to mid crustal high-velocity material (∼4–4.5 ± 0.1 km/s) observed in OGOL is also observed in the rift beneath YIRG, SHAS, KADO, and BESH stations for the depth range of 4–25 km (Figure 7). At these stations and beneath the observed high-velocity upper to mid crust, there is a relatively slow Vs (∼3.5 ± 0.1 km/s) for the depth range of ∼24–45 km. The slow velocity deep crust is commonly beneath normal upper-to-middle crust (4–4.3 km/s) such as beneath the JIMA station. In contrast, beneath JIRE, ODAS, ASSE, and SAGU stations (Figure 7), crustal Vs are relatively homogeneous.
Figure 8B1 shows the 2D Vs structure and Figure 8B2 the corresponding Vp/Vs ratio of the along-rift profile in the CMER obtained from the Delaunay triangulation interpolation method. Throughout the crust, the depth to particular velocity contours generally deepens with proximity to the major volcanic centres. This is especially pronounced in the 5- to 20-km depth range where the Vs increase significantly in regions in between the major volcanic centres. For example, beneath the two high topographic peaks (marked as Aluto and Tulumoye) observed in Figures 8A1,A2, there are slow velocity (<3.8 km/s) and high Vp/Vs ratio zones in the upper-mid crust. A similar slow velocity zone in the upper-mid crust is also observed beneath the Wondo-Genet remnant Mega caldera rim. Vs is generally slow (∼3.1–3.7 ± 0.1 km/s) in the lower crust beneath the CMER, with less spatial variation in velocities compared with that observed in the upper-mid crust. Generally, our findings are consistent with previous ambient noise tomography results showing the presence of slow S-velocity shallow crust beneath mega calderas, such as beneath Aluto and Tulu Moye, and slow Vs found more ubiquitously in the lower crust (Chambers et al., 2019).
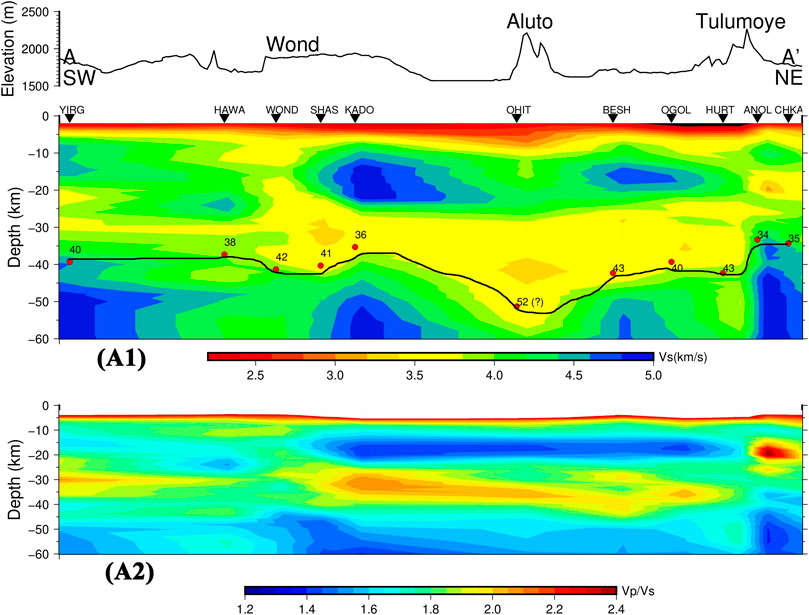
FIGURE 8. (A1) shows a 2D vertical slice along the eastern margin of the central Main Ethiopian Rift, which is obtained from profile AA′ of Figure 1 covering from station YIRG (1,756 m) to CHKA (1,604 m). (A2) shows the Vp/Vs ratio values at various depth points. Red indicates slower velocity and blue faster velocity. B2 shows the values of Vp/Vs for the rift and the plateau side of the profile. Blue indicates low Vp/Vs, and red indicates high Vp/Vs ratio.
Figures 9B1,B2 show the variations in Vs and Vp/Vs structure across the rift, respectively. In a similar fashion to the along-rift profile, the topmost ∼5 km of the upper crust of the across-rift profile is a very low seismic velocity (2.0–3.2 km/s) material. The border fault of the eastern side of the CMER is marked by a topographic step from ∼1,700 m in the rift to ∼2,700 m on the rift margin (Figure 9). Outside of the rift on the rift flank, we observe a fairly homogeneous crustal structure with a distinct lack of slow velocities in the lower crust. Instead, the seismic velocity mostly increases with depth. In addition, there is a sharp increase in seismic velocity at ∼45 km depth, where previous studies based on different methods showed this change as Moho discontinuity (e.g., Mahatsente et al., 1999; Mackenzie et al., 2005; Cornwell et al., 2006), as shown in Table 2. However, similar to the along-rift profile, within the rift on the across rift profile, we see a more heterogenous velocity structure. At 20- to 35-km depths, particularly slow Vs and high Vp/Vs ratios are found beneath the eastern part of the across-rift profile beneath the JIMA and OGOL stations. In this depth interval, the lowest velocities are found beneath the eastern side of the CMER spatially associated with the surface position of the WFB volcanic centres.
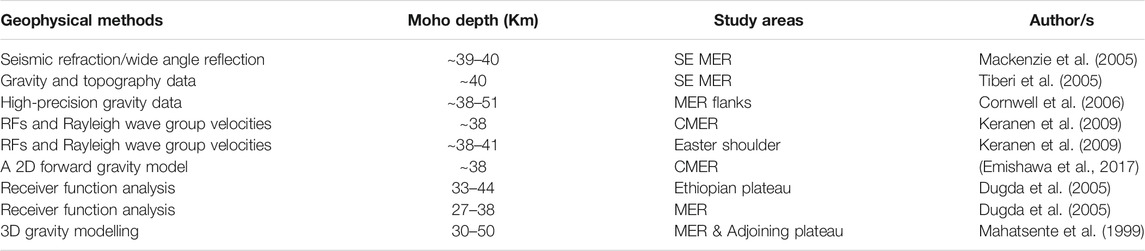
TABLE 2. A summary of the findings of previous gravity and seismic methods studied in the SE plateau and the central main Ethiopian rift valley for the determination of Moho depth.
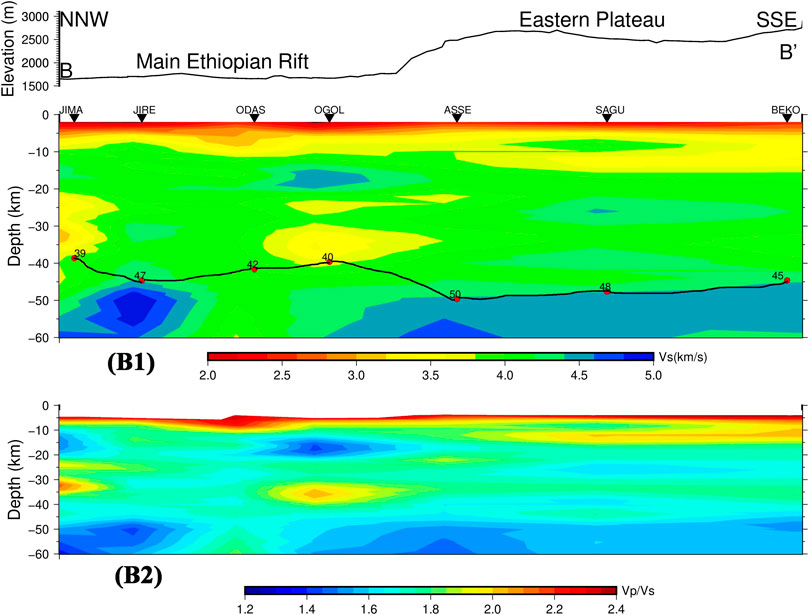
FIGURE 9. (B1) shows a 2D vertical slice across the rift profile BB′ of Figure 1 ranging from JIMA (in Central WFB) with an altitude of 1,659 m to BEKO (Eastern Plateau) having an elevation of 2,848 m. Red indicates slower velocity and blue faster velocity. B2 shows the values of Vp/Vs for the rift and the plateau side of the profile. Blue indicates low Vp/Vs, and red indicates high Vp/Vs ratio.
Discussion
We discuss here the Vs and Vp/Vs structure of the rift obtained from our data analysis in the context of magmatic and tectonic extensional processes, and with the aid of a priori constraints of Vp ∼6.8 km/s (e.g., Dugda et al., 2005; Mackenzie et al., 2005; Maguire et al., 2006). We also compare our findings with constraints inferred from density and conductivity analysis conducted in the area. We use both one- and two-dimensional Vs profiles to interpret velocity variations in the lithosphere to answer basic questions about the nature of the crust and upper mantle when rifting modifies the lithosphere.
S-wave velocity structure within the rift
The slow velocity (2–3 km/s) imaged at 2–6 km depth is similar to the proposed Vs of ∼1.9–2.8 km/s typical of layered sediments (Benoit et al. (2006). This is also in good agreement with the work of Chambers et al. (2019), which interprets a similarly low velocity at the topmost upper crust as sedimentary and/or volcanic layers. This result agree with the interpretation of Cornwell et al. (2006), which interprets the existence of an upper crustal low-density (2,380 kg/m3) layer that represents interspersed volcaniclastics, lava flows, and lacustrine sediments within the rift valley (Wolfenden et al., 2004). In support of this interpretation, the low Vs of the uppermost crust extends to greatest depths within the rift valley than outside of it (Figure 9).
Both profiles shown in Figure 7 represent significant variations in the 1D velocity models. In particular, a number of the stations show elevated seismic velocity at 6–25 km, while others are less fast. When stations are organised spatially from NW to NE in Figure 8A1, the spatial variability of this is clearer. Typically, along rift, in-between the magmatic centres (such as beneath station YIRG, SHAS, KADO, BESH, and OGOL), the high Vs (∼4–4.5 km/s) is present in the upper-to-mid crust. The across-rift profile in Figure 9 shows that these regions of higher Vs in the upper/mid crust are localised beneath the Wonji Fault Belt. The high seismic velocities coupled with their Wonji Fault belt position favours an interpretation of their origin being a solidified mafic intrusion, an interpretation in line with previous seismic imaging (Chambers et al., 2019), and spatially match high positive Bouguer anomalies constrained in gravity studies (Mahatsente et al., 1999; Tiberi et al., 2005; Cornwell et al., 2006). The average slow-velocity (∼3.5 ± 0.1 km/s) regions at ∼24–45 km depth may represent a less mafic modification of a normal continental crust of Vp/Vs <1.85 (Zandt and Ammon, 1995), or a more complex modification from felsic intrusion, and/or presence of partial melt with a Vp/Vs value of >1.9.
Beneath 25-km depth in the lower crust, the 1D models show that the majority of seismic stations show a reduction in Vs in the lower crust to 3.1–3.7 ± 0.1 km/s (Figure 7). Figure 8 shows that this feature is spatially ubiquitous. There is some spatial variability in the magnitude of the velocity inversion (Figures 8A1,A2), with a hint that the most pronounced slow Vs regions in the lower crust are beneath the volcanic centres, such as Aluto, although this pattern is not particularly clear elsewhere. These regions of slow Vs correlate to high Vp/Vs of ∼1.9–2.1. The observation of slow Vs and high Vp/Vs in the lower crust in the rift valley is consistent with the ambient noise tomography by Chambers et al. (2019), which shows that the slowest velocities for all depths within the MER range from 3.28 ± 0.01 km/s at 10-km depth to 3.83 ± 0.01 km/s at 40-km depth. The magnitude of the slow Vs at this depth range, combined with the high Vp/Vs, is consistent with previous deep crustal imaging studies, which combined interpret between 0.5% and 5% partial melt (e.g., Chambers et al., 2019). More tightly constraining melt fraction from the seismic velocities alone is difficult since Vp and Vs measurements are potentially explainable by either lower melt fractions aligned vertically as dikes or more elevated melt fractions aligned as sills (Paulatto et al., 2010; Paulatto et al., 2012; Paulatto et al., 2019; Dvorkin, 2020). However, dominance of horizontal sill-like melt alignment is favoured by inversions for radial anisotropy derived from surface waves for the MER (e.g., Chambers et al., 2021), and petrological models of the deep crustal magma plumbing system globally (e.g., Annen et al., 2006). The interpretation of partial melt in the lower crust is also supported by high conductivities in the lower crust observed in crustal-scale MT studies at comparable depths (Whaler and Hautot, 2006).
Profile AA′ in Figure 8 shows variations in the Vs structure, which provides insights into the crustal-scale magma plumbing system. The ubiquitous slow Vs suggests a diffuse interconnected melt-rich lower crust beneath most of the rift valley, with potentially higher melt concentration beneath the volcanic centres. In contrast, in the upper half of the crust, slower Vs beneath the volcanic centres, with anomalously fast Vs in between the volcanic centres, is consistent with volcanic segment-centred melt supply, in which subvolcanic melt reservoirs focus and store melt, which is delivered episodically mafic intrusion along the rift axis. Such an upper crustal plumbing system has been proposed in Afar on the basis of episodic segment-centred fed dyke intrusions observed with InSAR and seismicity (Keir et al., 2009; Barnie et al., 2016). Here in the MER, a similar subvolcanic plumbing system is consistent with the seismic velocity structure of the upper/mid crust. In addition, in the MER, observations of such rifting episodes are lacking, with geodetic observations of magma-related ground deformation being restricted to volcanic centres such as Aluto and Tulu Moye (Biggs et al., 2011; Albino and Biggs, 2021). Similarly, localised subvolcanic pockets of melt beneath the volcanic centres (Gleeson et al., 2017) suggest localised longer-lived magma bodies in the shallow crust of the volcanic centres. However, our seismic imaging of the deeper crust suggests that the distribution of melt in the lower crust might well be widespread and enable significant melt transport along rift.
S-wave velocity structure of the Eastern Plateau
In contrast to the rift valley floor, the Vs structure beneath the Eastern Plateau is remarkably homogeneous (Figure 9B1). In addition, the distinctive increase in Vs at ∼45 km depth, is remarkably similar to constraints on the Moho depth computed in our study, consistent with a previous wide-angle active source, and passive source RF studies (Mackenzie et al., 2005; Maguire et al., 2006), and adds support observations that the Moho beneath the Eastern Plateau is a sharp and distinctive seismological boundary (e.g., Ogden et al., 2019). This profile shows a smooth transition toward the shoulder compared with the western plateau margin in which sharp lateral contrast between plateau and rift is observed (Chambers et al., 2019). Limited heterogeneity of the crustal and mantle structure beneath the Eastern Plateau is typical of regions of stable continental crust with limited history of deformation and modification by magmatism (e.g., Thompson et al., 2010; Youssof et al., 2013, Youssof et al., 2015). The strong contrast in velocity structure from the Eastern Plateau into the rift (Figure 9) is in sharp contrast to the conjugate side of the rift valley, with the Western Plateau showing evidence for significant magmatic modification (e.g., Mackenzie et al., 2005; Chambers et al., 2019), indicating strong asymmetry to the rifting process. The lack of evidence for magmatic modification of the crust beneath the Eastern Plateau also favours a model of dynamic uplift from a deep-seated asthenospheric anomaly (e.g., Sembroni et al., 2016), as opposed to uplift being compensated by crustal magmatic additions (e.g., Keranen et al., 2009; Chambers et al., 2019).
Our study reveals new important insights regarding the variability in crustal structure and melt fraction on a local scale beneath the volcanic regions of the MER. The results demonstrate the continued need for more future efforts to understand crustal structure and distribution of partial melt in the wider sense beneath and near the East African rift. We would like to point out the need to have more international collaboration—although we would imagine that long-term and sustainable research in Ethiopia really needs local scientists to lead the way.
Conclusion
We use RF to delineate the Vs structure of the lithosphere beneath 17 stations in the CMER, which are arranged in two profiles along and across the rift valley. The observed low Vs (∼2–3 km/s) uppermost crust (<6-km depth) is interpreted as sedimentary and/or volcanic layers. Beneath the rift valley crust, Vs is heterogeneous laterally and with depth. In particular, slow Vs and high Vp/Vs ratio is localised beneath volcanic centres in the upper-mid crust but ubiquitously slow in the lower crust. The Vs and Vp are consistent with the presence of the small fraction (<5%) partial melt interpreted in previous seismic imaging studies of the lower crust. In addition, the velocity contrast is small between the lower crust and upper mantle in the rift. The results suggest that partial melt in the lower crust beneath magmatically active rifts might be more widespread than previously thought and is an important component of the magma plumbing system. In contrast, Vs is more homogeneous and faster beneath the Eastern Plateau, with a distinct and sharp velocity contrast observed between the crust and upper mantle at Moho, jointly indicative of very little crustal modification from magmatism.
Data Availability Statement
The datasets presented in this study can be found in online repositories. The names of the repository/repositories and accession number(s) can be found at: https://ds.iris.edu/wilber3/find_event.
Author Contributions
BK customized the Computer Program for Seismology software and wrote some essential scripts. All the three authors developed the concept of this paper. BK selected and processed the teleseismic signals, conducted the modelling of all datasets, and led the writing of the paper. All authors contributed to the write up, discussion, and interpretation of the result of the paper.
Funding
The research work is sponsored by Addis Ababa University. The project was funded by the Natural Environment Research Council under NERC Grant NE/L013932/1. The publication charges were covered by the University of Southampton, and the laptop used to conduct the analysis was purchased using GCRF-UKRI funding from Ian Bastow, Imperial Collage London.
Conflict of Interest
The authors declare that the research was conducted in the absence of any commercial or financial relationships that could be construed as a potential conflict of interest.
Publisher’s Note
All claims expressed in this article are solely those of the authors and do not necessarily represent those of their affiliated organizations, or those of the publisher, the editors, and the reviewers. Any product that may be evaluated in this article, or claim that may be made by its manufacturer, is not guaranteed nor endorsed by the publisher.
Acknowledgments
We would like to thank those who participated in the RiftVolc project. We also want to acknowledge the IRIS Data Management Center (IRIS DMC). Similarly, I would like to furnish my deepest thanks to Prof. Robert Herrmann who affords his software packages entitled “Computer Program for Seismology” to the scientific community. We would also like to thank Prof. Giacomo Corti for allowing us to use the fault pattern in the location map. Ultimately, we would like to acknowledge Addis Ababa University for providing the opportunity to conduct this research.
Supplementary Material
The Supplementary Material for this article can be found online at: https://www.frontiersin.org/articles/10.3389/feart.2022.773783/full#supplementary-material
References
Albino, F., and Biggs, J. (2021). Magmatic Processes in the East African Rift System: Insights from a 2015–2020 Sentinel-1 InSAR Survey. Geochem. Geophys. Geosyst. 22, 1–24. doi:10.1029/2020gc009488
Ammon, C. J., Randall, G. E., and Zandt, G. (1990). On the Nonuniqueness of Receiver Function Inversions. J. Geophys. Res. 95 (B10), 15303–15318. doi:10.1029/JB095iB10p15303
Annen, C., Blundy, J. D., and Sparks, R. S. J. (2006). The Genesis of Intermediate and Silicic Magmas in Deep Crustal Hot Zones. J. Pet. 47, 505–539. doi:10.1093/petrology/egi084
Barnie, T. D., Oppenheimer, C., and Pagli, C. (2016). Does the Lava lake of Erta ‘Ale Volcano Respond to Regional Magmatic and Tectonic Events? an Investigation Using Earth Observation Data. Geol. Soc. Lond. Spec. Publications 420 (1), 181–208. doi:10.1144/sp420.15
Bastow, I. D., Keir, D., and Daly, E. (2011). The Ethiopia Afar Geoscientific Lithospheric Experiment (EAGLE): Probing the Transition from continental Rifting to Incipient Seafloor Spreading. Geol. Soc. America Bull. 478, 51–76. doi:10.1130/2011.2478(04)
Benoit, M. H., Nyblade, A. A., and Pasyanos, M. E. (2006). Crustal Thinning between the Ethiopian and East African Plateaus from Modeling Rayleigh Wave Dispersion. Geophys. Res. Lett. 33, 1–5. doi:10.1029/2006gl025687
Biggs, J., Bastow, I. D., Keir, D., and Lewi, E. (2011). Pulses of Deformation Reveal Frequently Recurring Shallow Magmatic Activity beneath the Main Ethiopian Rift. Geochem. Geophys. Geosyst. 12, 1–11. doi:10.1029/2011gc003662
Bonini, M., Corti, G., Innocenti, F., Manetti, P., Mazzarini, F., Abebe, T., et al. (2005). Evolution of the Main Ethiopian Rift in the Frame of Afar and Kenya Rifts Propagation. Tectonics 24 (1), a–n. doi:10.1029/2004TC001680
Chambers, E. L., Harmon, N., Keir, D., and Rychert, C. A. (2019). Using Ambient Noise to Image the Northern East African Rift. Geochem. Geophys. Geosystems 20, 2091–2109. doi:10.1029/2018gc008129
Chambers, E. L., Harmon, N., Rychert, C., and Keir, D. (2021). Variations in Melt Emplacement beneath the Northern East African Rift from Radial Anisotropy. Earth Planet. Sci. Lett. 573, 1–13. doi:10.1016/j.epsl.2021.117150
Chiasera, B., Rooney, T. O., Girard, G., Yirgu, G., Grosfils, E., Ayalew, D., et al. (2018). Magmatically Assisted Off-Rift Extension-The Case for Broadly Distributed Strain Accommodation. Geosphere 14, 1544–1563. doi:10.1130/ges01615.1
Cornwell, D. G., Mackenzie, G. D., England, R. W., Maguire, P. K. H., Asfaw, L. M., and Oluma, B. (2006). Northern Main Ethiopian Rift Crustal Structure from New High-Precision Gravity Data. Geol. Soc. Lond. Spec. Publications 259, 307–321. doi:10.1144/gsl.sp.2006.259.01.23
Cornwell, D. G., Maguire, P. K. H., England, R. W., and Stuart, G. W. (2010). Imaging Detailed Crustal Structure and Magmatic Intrusion across the Ethiopian Rift Using a Dense Linear Broadband Array. Geochem. Geophys. Geosystems 11, n/a. doi:10.1029/2009gc002637
Corti, G. (2009). Continental Rift Evolution: From Rift Initiation to Incipient Break-Up in the Main Ethiopian Rift, East Africa. Earth-Science Rev. 96, 1–53. doi:10.1016/j.earscirev.2009.06.005
Corti, G., Sani, F., Florio, A. A., Greenfield, T., Keir, D., Erbello, A., et al. (2020). Tectonics of the Asela-Langano Margin, Main Ethiopian Rift (East Africa). America Geophys. Union 412, 1–43. doi:10.1038/35084058
Daniels, K. A., Bastow, I. D., Keir, D., Sparks, R. S. J., and Menand, T. (2014). Thermal Models of Dyke Intrusion during Development of Continent–Ocean Transition. Earth Planet. Sci. Lett. 385, 145–153. doi:10.1016/j.epsl.2013.09.018
Diaferia, G., and Cammarano, F. (2017). Seismic Signature of the continental Crust: What Thermodynamics Says. An Example from the Italian peninsula. Tectonics 36, 3192–3208. doi:10.1002/2016tc004405
Dugda, M. T., Nyblade, A. A., Julia, J., Langston, C. A., Ammon, C. J., and Simiyu, S. (2005). Crustal Structure in Ethiopia and Kenya from Receiver Function Analysis: Implications for Rift Development in Eastern Africa. J. Geophys. Res. 110, B01303. doi:10.1029/2004jb003065
Dvorkin, J. (2020). “Rock Physics: Recent History and Advances”, in. Geophys. Ocean Waves Stud. Editors. K. S. Essa, M. Di Risio, D. Celli, and D. Pasquali (London, United Kingdom: IntechOpen), 1–24. doi:10.5772/intechopen.92161
Ebinger, C. J., Keir, D., Bastow, I., Whaler, K., Hammond, J., Ayele, A., et al. (2017). Crustal Structure of Active Deformation Zones in Africa: Implications for Global Crustal Processes: Africa Crust. Tectonics 36, 37–57. doi:10.1002/2017tc004526Avaliable At: https://agupubs.onlinelibrary.wiley.com/doi/full/10.1002/2017TC004526
Eckhardt, C., and Rabbel, W. (2011). P-receiver Functions of Anisotropic continental Crust: a Hierarchic Catalogue of Crustal Models and Azimuthal Waveform Patterns. Geophys. J. Int. 187 (1), 439–479. doi:10.1111/j.1365-246x.2011.05159.x
Emishaw, L., Laó-Dávila, D. A., Abdelsalam, M. G., Atekwana, E. A., and Gao, S. S. (2017). Evolution of the Broadly Rifted Zone in Southern Ethiopia Through Gravitational Collapse and Extension of Dynamic Topography. Tectonophysics 699, 213–226.
Gleeson, M. L. M., Michael, J. S., David, M. P., Tamsin, A. M., William, H., Gezahegn, Y., et al. (2017). Constraining Magma Storage Conditions at a Restless Volcano in the Main Ethiopian Rift Using Phase Equilibria Models. J. Volcanology Geothermal Res. 337, 44–61. doi:10.1016/j.jvolgeores.2017.02.026
Greenfield, T., Keir, D., Kendall, J.-M., and Ayele, A. (2019). Seismicity of the Bora-Tullu Moye Volcanicfield, 2016-2017. Geochem. Geophys. Geosyst. 20, 548–570. doi:10.1029/2018gc007648
Guerri, M., Cammarano, F., and Connolly, J. A. D. (2015). Effects of Chemical Composition, Water and Temperature on the Physical Properties of the continental Crust. Geochem. Geophys. Geosyst. 16, 2431–2449. doi:10.1002/2015gc005819
Gurrola, H., Baker, G. E., and Minster, J. B. (1995). Simultaneous Time-Domain Deconvolution with Application to the Computation of Receiver Functions. Geophys. J. Int. 120 (3), 537–543. doi:10.1111/j.1365-246X.1995.tb01837.x
Hammond, J. O. S. (2014). Constraining Melt Geometries beneath the Afar Depression, Ethiopia from Teleseismic Receiver Functions: The Anisotropic H-K Stacking Technique. Geochem. Geophys. Geosyst. 15, 1316–1332. doi:10.1002/2013gc005186
Hammond, J. O. S., Kendall, J. M., Stuart, G., Keir, D., Ebinger, C., Ayele, A., et al. (2011). The Nature of the Crust beneath the Afar Triple junction: Evidence from Receiver Functions. Geochem. Geophys. Geosyst. 12, 1–24. doi:10.1029/2011gc003738
Herrmann, R. B., and Ammon, C. J. (2004). Surface Waves, Receiver Functions and Crustal Structure, Computer Programs in Seismology Version 3.30. Saint Louis, MO: Saint Louis University.
Hübert, J., Whaler, K., and Fisseha, S. (2018). The Electrical Structure of the Central Main Ethiopian Rift as Imaged by Magnetotellurics: Implications for Magma Storage and Pathways. J. Geophys. Res. 123, 6019–6032. doi:10.1029/2017jb015160
Keir, D., Hamling, I. J., Ayele, A., Calais, E., Ebinger, C., Wright, T., et al. (2009). Evidence for Focused Magmatic Accretion at Segment Centers from Lateral dike Injections Captured beneath the Red Sea Rift in Afar. The Geol. Soc. America 37, 59–62. doi:10.1130/g25147a.1
Kendall, J. M., Stuart, G., Ebinger, C., Bastow, I., and Keir, D. (2005). Magma-assisted Rifting in Ethiopia. Nature 433, 146–148. doi:10.1038/nature03161
Kennett, B. L. N., Engdah, E. R., and Buland, R. (1995). Constraints on Seismic Velocities in the Earth from Traveltimes. Geophys. J. Int. 122, 108–124. doi:10.1111/j.1365-246x.1995.tb03540.x
Keranen, K. M., Klemperer, S. L., and Gloaguen, R. (2004). Three-dimensional Seismic Imaging of a Proto-ridge axis in the Main Ethiopian Rift. Geology 32, 949–952. doi:10.1130/g20737.1
Keranen, K. M., Klemperer, S. L., Julia, J., Lawrence, J. F., and Nyblade, A. A. (2009). Low Lower Crustal Velocity across Ethiopia: Is the Main Ethiopian Rift a Narrow Rift in a Hot Craton. Geochem. Geophys. Geosystems 10 (5), n/a. doi:10.1029/2008GC002293
Kibret, B. A., Ayele, A., and Keir, D. (2019). Crustal Thickness Estimates beneath Four Seismic Stations in Ethiopia Inferred from P-Wave Receiver Function Studies. J. Afr. Earth Sci. 150, 264–271. doi:10.1016/j.jafrearsci.2018.11.005
Kiknchi, M., and Kanamori, H. (1982). Inversion of Complex Body Waves. Bull. Seismol. Soc. Am. 72, 491–506.
Kim, S., Nyblade, A. A., Rhie, J., Baag, C. E., and Kang, T. S. (2012). Crustal S-Wave Velocity Structure of the Main Ethiopian Rift from Ambient Noise Tomography. Geophys. J. Int. 191 (2), 865–878. doi:10.1111/j.1365-246x.2012.05664.x
Langston, C. A. (1979). Structure under Mount Rainier, Washington, Inferred from Teleseismic Body Waves. J. Geophys. Res. Solid Earth 84 (B9), 4749–4762. doi:10.1029/JB084iB09p04749
Last, R. J., Nyblade, A. A., and Langston, C. A. (1997). Crustal Structure of the East African Plateau from Receiver Functions and Rayleigh Wave Phase Velocities. J. Geophys. Res. 102 (24), 469483–470424. doi:10.1029/97jb02156
Lavayssière, A., Greenfield, T., Keir, D., Ayele, A., and Kendall, J. (2019). Local Seismicity Near the Actively Deforming Corbetti Volcano in the Main Ethiopian Rift. J. Volcanology Geothermal Res. 381, 227–237. doi:10.5194/egusphere-egu2020-21585
Ligorria, J. P., and Ammon, C. (1999). Iterative Deconvolution and Receiver Function Estimation. Bull. Seismol. Soc. Am. 89, 1395–1400. doi:10.1785/bssa0890051395
Liu, H., and Niu, F. (2012). Estimating Crustal Seismic Anisotropy with a Joint Analysis of Radial and Transverse Receiver Function Data. Geophys. J. Int. 188, 144–164. doi:10.1111/j.1365-246x.2011.05249.x
Mackenzie, G., Thybo, H., and Maguire, P. (2005). Crustal Velocity Structure across the Main Ethiopian Rift: Results from Two-Dimensional Wide-Angle Seismic Modelling. Geophys. J. Int. 162, 994–106. doi:10.1111/j.1365-246x.2005.02710.x
Maguire, P., Keller, R., Klemperer, S., Mackenzie, G. D., Keranen, K., Harder, S., et al. (2006). Crustal Structure of the Northern Main Ethiopian Rift from the EAGLE Controlled Source Survey; a Snapshot of Incipient Lithospheric Break-Up. Geol. Soc. Spec. Publ. 259, 269–292. doi:10.1144/gsl.sp.2006.259.01.21
Mahatsente, R., Jentzsch, G., and Jahr, T. (1999). Crustal Structure of the Main Ethiopian Rift from Gravity Data: 3-dimensional Modeling. Tectonophysics 313, 363–382. doi:10.1016/s0040-1951(99)00213-9
Niu, F., and James, D. E. (2002). Fine Structure of the Lowermost Crust beneath the Kaapvaal Craton and its Implications for Crustal Formation and Evolution. Earth Planet. Sci. Lett. 200, 121–130. doi:10.1016/s0012-821x(02)00584-8
Ogden, C. S., Bastow, I. D., Gilligan, A., and Rondenay, S. (2019). A Reappraisal of the H–κ Stacking Technique: Implications for Global Crustal Structure. Geophys. J. Int. 219, 1491–1513. doi:10.1093/gji/ggz364
Paulatto, M., Annen, C., Henstock, T. J., Kiddle, E., Minshull, T. A., Sparks, R. S. J., et al. (2012). Magma Chamber Properties Fromintegrated Seismic Tomography and thermal Modeling at Montserrat. Geochem. Geophys. Geosyst. 13, 1–18. doi:10.1029/2011gc003892
Paulatto, M., Minshull, T. A., Baptie, B., Dean, S., Hammond, J. O. S., Henstock, T., et al. (2010). Upper Crustal Structure of an Active Volcano from Refraction/reflection Tomography, Montserrat, Lesser Antilles. Geophys. J. Int. 180 (2), 685–696. doi:10.1111/j.1365-246x.2009.04445.x
Paulatto, M., Moorkamp, M., Hautmann, S., Hooft, E., Morgan, J. V., and Sparks, R. S. J. (2019). Vertically Extensive Magma Reservoir Revealed from Joint Inversion and Quantitative Interpretation of Seismic and Gravity Data. J. Geophys. Res. 124 (11), 170–111. doi:10.1029/2019jb018476
Ping, D., Jiatian, L., Xiaoqing, Z., and Jia, L. (2009). “A New Interpolation Model of Convex Hull in Delaunay Triangulation,” in International Symposium on Spatial Analysis, Spatial-Temporal Data Modeling, and Data Mining, Wuhan, China, October 13–14, 2009 (Wuhan, China: SPIE), 7492 1–9. doi:10.1117/12.838405
Rooney, T. O., Bastow, I. D., Keir, D., Mazzarini, F., Movsesian, E., Grosfils, E., et al. (2014). The Protracted Development of Focused Magmatic Intrusion during continental Rifting. Tectonics 33, 875–897. doi:10.1002/2013tc003514
Roninson, E. A. (1982). A Historical Perspective of Spectrum Estimation. Proceedings of the IEEE 70, 885–907.
Sembroni, A., Faccenna, C., Becker, T. W., Molin, P., and Abebe, B. (2016). Long-Term, Deep-Mantle Support of the Ethiopia-Yemen Plateau. Tectonics 35, 469–488. doi:10.1002/2015tc004000
Stuart, G., Bastow, I. D., and Ebinger, C. J. (2006). Crustal Structure of the Northern Main Ethiopian Rift from Receiver Function Studies. Geol. Soc. Lond. Spec. Publications 259, 253–267. doi:10.1144/gsl.sp.2006.259.01.20
Thompson, D. A., Bastow, I. D., Helffrich, G., Kendall, J. M., Wookey, J., Snyder, D. B., et al. (2010). Precambrian Crustal Evolution: Seismic Constraints from the Canadian Shield. Earth Planet. Sci. Lett. 297 (3-4), 655–666. doi:10.1016/j.epsl.2010.07.021
Thybo, H., Youssof, M., and Artemieva, I. M. (2019). Southern Africa Crustal Anisotropy Reveals Coupled Crust-Mantle Evolution for over 2 Billion Years. Nat. Commun. 10, 1–10. doi:10.1038/s41467-019-13267-2
Tiberi, C., Ebinger, C., Ballu, V., Stuart, G., and Oluma, B. (2005). Inverse Models of Gravity Data from the Red Sea–Aden–East African Rifts Triple junction Zone. Geophys. J. Int. 163 (2), 775–787. doi:10.1111/j.1365-246x.2005.02736.x
Wessel, P., Luis, J. F., Uieda, L., Scharroo, R., Wobbe, F., Smith, W. H. F., et al. (2019). The Generic Mapping Tools Version 6. Geochem. Geophys. Geosystems 20, 1–9. doi:10.1029/2019gc008515
Whaler, K., and Hautot, S. (2006). The Electrical Resistivity Structure of the Crust beneath the Northern Ethiopian Rift. Geol. Soc. Lond. Spec. Publications 251, 293–305. doi:10.1144/gsl.sp.2006.259.01.22
Woldegabriel, G., Aronson, J., and Walter, R. (1990). Geology, Geochronology, and Rift basin Development in the central Sector of the Main Ethiopia Rift. Geol. Soc. America Bull. - GEOL SOC AMER BULL 102, 439–458. doi:10.1130/0016-7606(1990)102<0439:ggarbd>2.3.co;2
Wolfenden, E., Ebinger, C., Yirgu, G., Deino, A., and Ayalew, D. (2004). Evolution of the Northern Main Ethiopian Rift: Birth of a Triple junction. Earth Planet. Sci. Lett. 224, 213–228. doi:10.1016/j.epsl.2004.04.022
Yilmaz, Ö. (2001). Seismic Data Analysis: Processing, Inversion, and Interpretation of Seismic Data. Society of Exploration Geophysicists. Tulsa.
Youssof, M., Thybo, H., Artemieva, I. M., and Levander, A. (2013). Moho Depth and Crustal Composition in the Southern Africa. Tectonophysics 609, 267–287. doi:10.1016/j.tecto.2013.09.001
Youssof, M., Thybo, H., Artemieva, I. M., and Levander, A. (2015). Upper Mantle Structure beneath Southern African Cratons from Seismic Finite-Frequency P- and S-Body Wave Tomography. Earth Planet. Sci. Lett. 420, 174–186. doi:10.1016/j.epsl.2015.01.034
Zandt, G., and Ammon, C. J. (1995). Continental Crustal Composition Constrained by Measurements of Crustal Poisson's Ratio. Nature 374, 152–154. doi:10.1038/374152a0
Keywords: Vp/Vs, magma plumbing, volcanic centres, crustal structure, partial melt, moho depth, intrusion, Main Ethiopian rift
Citation: Kibret BA, Ayele A and Keir D (2022) Modelling S-Wave Velocity Structure Beneath the Central Main Ethiopian Rift Using Receiver Functions. Front. Earth Sci. 10:773783. doi: 10.3389/feart.2022.773783
Received: 10 September 2021; Accepted: 24 January 2022;
Published: 17 March 2022.
Edited by:
Tolulope Morayo Olugboji, University of Rochester, United StatesReviewed by:
Tim Greenfield, University of Cambridge, United KingdomMohammad Youssof, University of Copenhagen, Denmark
Copyright © 2022 Kibret, Ayele and Keir. This is an open-access article distributed under the terms of the Creative Commons Attribution License (CC BY). The use, distribution or reproduction in other forums is permitted, provided the original author(s) and the copyright owner(s) are credited and that the original publication in this journal is cited, in accordance with accepted academic practice. No use, distribution or reproduction is permitted which does not comply with these terms.
*Correspondence: Birhanu A. Kibret, YmlyaGFudS5hYmVyYUBhYXUuZWR1LmV0