 Shaobo Zhang
 Lixia Meng
 Yong Zhao
 Xianyu Yang
 Anning Huang
- 1School of Atmospheric Sciences/Plateau Atmosphere and Environment Key Laboratory of Sichuan Province/Joint Laboratory of Climate and Environment Change, Chengdu University of Information Technology, Chengdu, China
- 2School of Atmospheric Sciences, Nanjing University, Nanjing, China
As a unique climate phenomenon induced by the Tibetan Plateau (TP) heat flux, the TP monsoon is closely connected with the global climate, especially pertaining to the TP. However, the current research focuses more on the influence of the TP monsoon on the TP and eastern China, but not including Central Asia. This paper analyzed the relationship between the TP monsoon index and Central Asia summer precipitation by JRA55 reanalysis data and Global Precipitation Climatology Centre (GPCC) monthly precipitation. The results showed a significant positive relationship between the TP monsoon index and summer precipitation in Central Asia. When the TP monsoon was strong, there was cold advection in the upper troposphere over Central Asia, and the resulting thermal wind caused a cyclonic circulation anomaly in the mid-upper troposphere over Central Asia. This in turn led to a cyclonic circulation anomaly to water vapor transport in the lower troposphere. The abnormal upward movement also caused more precipitation in this area, which explains the positive correlation between the TP monsoon and the precipitation in Central Asia. Based on this physical mechanism, the temperature of the mid-upper troposphere over Central Asia was closely related to the TP monsoon, and it was a key factor that affected summer precipitation changes in Central Asia.
Introduction
The arid and semiarid regions in Central Asia, including Kazakhstan, Kyrgyzstan, Tajikistan, Turkmenistan, and Uzbekistan, are sensitive and vulnerable to climate variations (Hu et al., 2014). Roughly taking 100°E as the boundary, the arid area of central Asia is controlled by westerly circulation; this area was named the “westerly mode” (Huang et al., 2013). Huang et al. (2015) also found that the “westerly mode” of precipitation changes under the modern climate background was most prominent feature on the interdecadal scale in summer.
As one of the largest arid regions in the middle latitudes in the world, Central Asia is likely to be strongly influenced by climate warming. Xu et al. (2015) found that the average increasing rate in annual precipitation was 3.9 mm/10 a in the arid lands of Central Asia, and there were significant increasing trends in precipitation in Kazakhstan, Kyrgyzstan, and Tajikistan. Similar results were also found in Hu et al. (2017). When considering extreme precipitation, Yao et al. (2021) found that all extreme precipitation-related indices except for consecutive dry days experienced an increasing trend during 1936–2005. Moreover, based on the Coupled Model Intercomparison Project 5 (CMIP5) model simulations, the annual total wet-day precipitation, Rx1 1-day precipitation amount, and consecutive dry days in Central Asia were projected to increase robustly during 2006–2100 under representative concentration pathway (RCP) 4.5 and RCP 8.5; higher RCPs had higher rates of extreme precipitation and lower signal-to-noise ratios. Jiang et al. (2020) also found that at the end of the 21st century, a robust increase in annual mean precipitation under all scenarios was found. Limiting global warming to under 1.5°C can help reduce the occurrence and associated impact of precipitation extremes in East-Central Asia (Zhang et al., 2020).
Many factors have been used to discuss the contribution to precipitation in Central Asia. When considering the ocean signals, Chen et al. (2018) found that the seasonal precipitation of Central Asia was closely related to ENSO. Zhao and Zhang (2016) also found that SST warming in the tropical Indian ocean influenced the summer rainfall changes over Central Asia. When talking about the land signal, Yang et al. (2016) found that the spring soil moisture has a positive contribution to summer precipitation over northern Europe, Central Asia, and the southern region of North America but a negative contribution to the central part of North America, Arabia, and India. In terms of atmospheric factors, Bothe et al. (2012) found that the moisture supply to Central Asia was primarily due to the mid-latitude westerlies with contributions from higher latitudes. Wei et al. (2017) also found an out-of-phase rainfall variation over Central Asia, closely related to the southeast-northwest Asian westerly jet stream. The change in westerly circulation may be the main factor affecting the evolution of precipitation in the arid region of Central Asia (Chen et al., 2011). Chen et al. (2021) also found that the East Asian summer monsoon has experienced a persistent weakening trend since 1958, causing an increasing contribution of monsoonal water vapor transport and enhancing summer precipitation in Central Asia. Besides these factors, Peng et al. (2018) also found that human-induced warming increased the specific humidity over all of Central Asia, increasing (decreasing) the precipitation over eastern (western) Central Asia. However, relatively few studies have been conducted between the Tibetan Plateau (TP) and Central Asia.
The phenomenon of the “TP monsoon” was first discovered by Ye et al. (1957) and later indicated by Xu and Gao (1962). In the same year, Gao and Tang introduced the concept of the TP monsoon at the annual meeting of the Gansu Meteorological Society. Later, Tang et al. (1979) and Tang et al. (1984) reported the climatic characteristics and interannual variation characteristics of the TP monsoon, which prompted people to pay more attention to the TP monsoon. Since the time that Tang et al. (1979) defined the TP monsoon index based on the 600 hPa geopotential height anomaly field, much research on the TP monsoon has been conducted. Qi et al. (2015) found that when the TP summer monsoon was strong, the southerly wind in Central Asia was abnormal with convergence, and the south Xinjiang region had an abnormal easterly wind, which was conducive to the transportation of water vapor to this area, and the precipitation was relatively high. Zhao et al. (2014), Zhao et al. (2016) and Zhao et al. (2019) further investigated the influence of the TP monsoon on weather and climate in Central Asia by comparing the relationship between the TP monsoon and precipitation in the Tarim Basin, and found that mid-upper tropospheric temperature (MUTT) play an important role in linking the TP monsoon and the south Asian monsoon with summer rainfall over the Tarim Basin of China.
As the third pole of the world, the TP has a significant impact on the climate of the TP and its surrounding areas. However, past studies have focused on the TP itself or its effect on the lower reaches of the TP, while relatively few studies have been conducted on the upper stream and north side of the TP. As shown in Figure 1, Central Asia is located in the northwest of the TP. What is the relationship between the precipitation in Central Asia and the TP monsoon? Based on this consideration, this paper studied the relationship between the TP monsoon and precipitation in Central Asia and discussed the role of the mid-upper tropospheric temperature in the relationship.
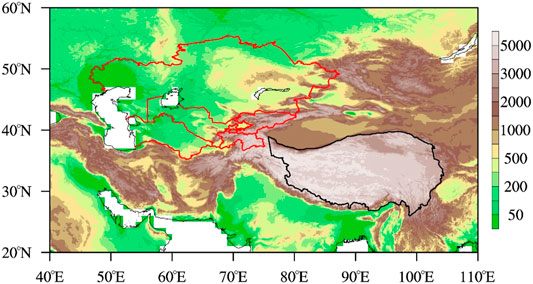
FIGURE 1. Altitude distribution of the study area. In the figure, the area with thick black solid line is the TP, and the area with red solid line is the five countries of Central Asia.
Data and Methods
Data
The Global Precipitation Climatology Centre (GPCC) provides gridded gauge-analysis products derived from quality-controlled station data. After comparing these data with other reanalysis data, Hu et al. (2018) found that GPCC was more suitable for studies of long-term precipitation variations over Central Asia. Here, monthly precipitation data from 1979–2019 were used.
The Japan Meteorological Agency (JMA) conducted JRA-55, the second Japanese global atmospheric reanalysis project. It covers 55 years, extending back to 1958. Compared to its predecessor (JRA-25), JRA-55 is based on a new data assimilation and prediction system that improves many deficiencies found in the first Japanese reanalysis (Kobayashi et al., 2015). The isobaric surface wind field and geopotential height field from 1979 to 2019 were used to calculate the TP monsoon index, and the upper air circulation field was also applied.
Method
As a result of the heat flux of the TP, there was an apparent wind field convergence and low-pressure center at 600 hPa on the TP (Figure 2A). Compared with the winter westerly wind field, the wind field of summer showed a significant change. Based on wind field standardization seasonal variability (Figure 2B) defined by Li and Zeng (2000), Zhang et al. (2015) defined a TP monsoon index to reflect the seasonal changes in the TP wind field. The formula is
where i and j are the number of grid points,
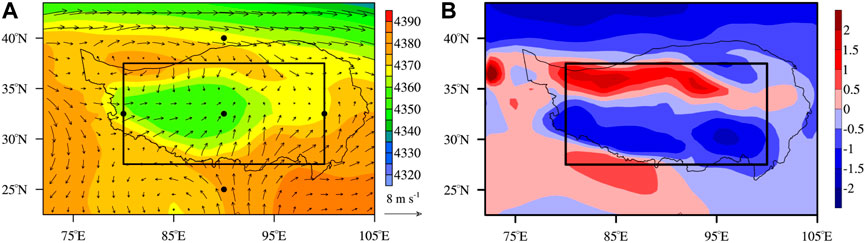
FIGURE 2. (A) Multiyear mean circulation (vectors, unit: m s−1) and geopotential height (shaded areas, unit: m) of 600 hPa in summer. (B) Multiyear mean wind field standardization seasonal variability index at 600 hPa in the summer (unit: 1). The black line in (A) denotes the TP boundary. The solid markers in (A) and rectangular lines in (A) and (B) indicate the regions selected for the calculation of TP monsoon indices.
Compared with the classic TP monsoon index (Tang et al., 1979), the correlation coefficient between the new and classic TP monsoon index two was 0.63, so the new index PMI was used here. Furthermore, a more detailed comparison also showed that the new index could reflect the summer precipitation on the TP, especially for the southeastern part of the TP (Zhang et al., 2019).
Results
As shown in Figure 3A, there was a significant positive correlation area in Central Asia. The correlation coefficient in some regions reached 0.6 or above, showing the close relationship between the TP monsoon and Central Asia precipitation. The area-averaged precipitation in the region (39–49°N, 54–78°E, the rectangular area in Figure 3A) was further calculated, and the time series of summer precipitation in Central Asia was obtained. As shown in Figure 3B, the TP monsoon index series and the precipitation series in Central Asia had an excellent corresponding relationship (r = 0.33), which could pass the 95% confidence level student’s t-test, showing the significant relationship between the TP monsoon and Central Asia precipitation.
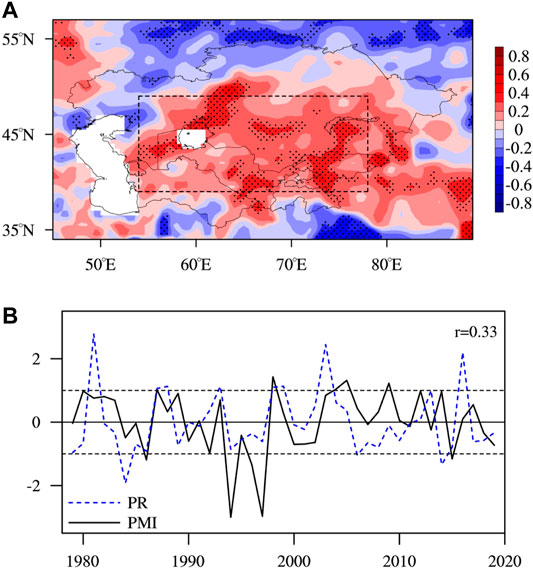
FIGURE 3. (A) Spatial distribution of the correlation coefficient between the TP monsoon index and summer precipitation. (B) Time series of the TP summer monsoon index and summer precipitation in Central Asia. The rectangular lines in (A) indicate the regions selected for the calculation of summer precipitation. The dotted area in (A) is the area that passed the 90% confidence level student’s t-test.
As shown in Figures 3A,B, there was a significant positive correlation between the TP monsoon and summer precipitation in Central Asia. To analyze the physical mechanism behind their correlation, five maximum years (1987, 1998, 2004, 2005, 2009) and five minimum years (1986, 1994, 1996, 1997, 2015) of the TP monsoon index were chosen to perform synthetic analysis. Moreover, using the TP monsoon index as the regression factor, the regression coefficients of different physical quantities were also analyzed.
In Figure 4A, the summer circulation at 200 hPa was controlled by westerly winds over Central Asia, and there was a jet stream with a zonal wind greater than 25 m/s. There was a high-temperature center on the south side of the jet stream and a low-temperature center on the north side of the jet stream. The composite results of the maximum and minimum years of the TP monsoon showed that when the TP monsoon was stronger, the zonal wind on the south side of the jet was stronger, and the zonal wind on the north side of the jet was weaker. Such an anomalous distribution was conducive to the southerlies of the Central Asian jet stream (Figure 4B). From Figure 4C, there was a cyclonic circulation anomaly in southern Central Asia, and the easterly wind anomaly in northern Central Asia was consistent with the weaker westerly airflow in Figure 4B. In addition, there was also an anticyclonic circulation anomaly at higher latitudes of Central Asia, causing a significant northeasterly wind anomaly on the northeastern side of Central Asia. Combined with the low-temperature distribution characteristics in high latitudes in Figure 4A, it can be found that such wind field anomalies will facilitate cold air at higher latitudes to go south, leading to cold advection in the temperature field. Affected by this, there was a negative anomaly in the temperature over the northern part of Central Asia, as shown in Figure 4D. Similarly, the cyclonic circulation anomaly in southern Central Asia also had southwest wind anomalies in southeastern Central Asia, which made the temperature field on the southern side of Central Asia have a positive anomaly. Furthermore, the TP monsoon index was used as an independent variable to regress the variables mentioned above. As shown in Figures 4E–G, the spatial distribution characteristics of the regression coefficients were similar to the results of the synthetic analysis. Based on the synthetic analysis and regression analysis results, the influence of the TP monsoon on the 200 hPa wind field in the region was significant.
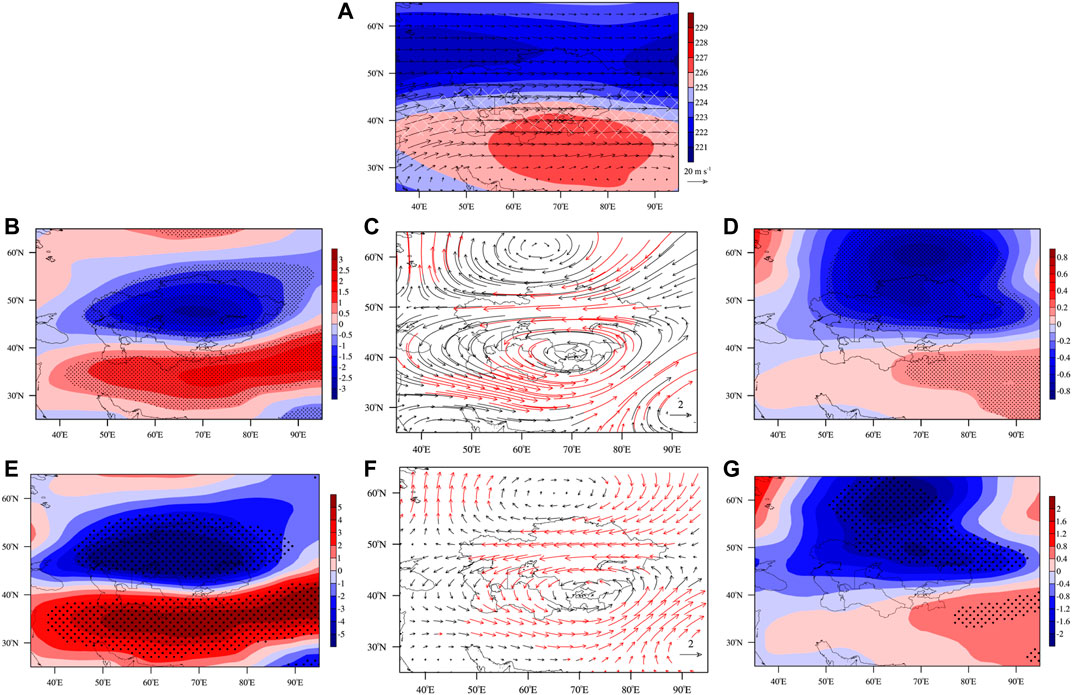
FIGURE 4. (A) Multiyear averaged 200 hPa summer wind field (vectors, unit: m s−1) and temperature (shaded areas, unit: K). (B–D) are the differences in 200 hPa zonal wind, wind field, and temperature between the maximum and minimum TP monsoon index years, respectively, (E–G) are the regression coefficient distributions of the TP monsoon index for 200 hPa zonal wind, wind field, and temperature field, respectively. The white shaded area in (A) is the area where the zonal wind is greater than 25 m s−1. Dotted area in (B,D,E,G) and red wind field in (C,F) is the area that passed the 90% confidence level student’s t-test.
At 500 hPa, the results of the synthetic analysis showed that there was an anomalous anticyclonic circulation in the northern part of Central Asia, while there was an anomaly in the southern part of Central Asia (Figure 5A). Affected by this, there was a specific negative geopotential height anomaly in the southern part of Central Asia, while a positive geopotential height anomaly existed in the northern part of Central Asia (Figure 5B). The result of the regression analysis was similar to this result, and the area that passed student’s t-test in the regression analysis was broader, which also reflected that the 500 hPa circulation field anomaly was closely related to the 200 hPa upper troposphere.
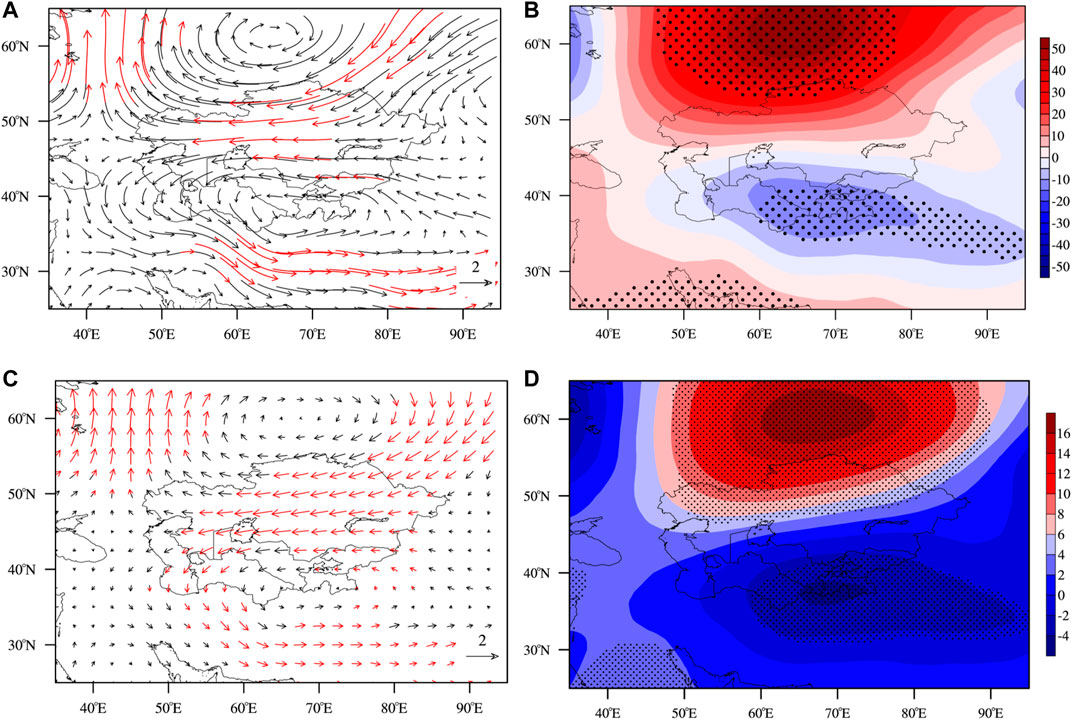
FIGURE 5. (A,B) shows the difference in the 500 hPa wind field and geopotential height between the maximum and minimum TP monsoon index years, respectively; (C,D) show the regression coefficient distribution of the TP monsoon index for the 500 hPa wind field and geopotential height, respectively. The red wind field in (A,C) and dotted area in (B,D) are the areas that passed the 90% confidence level student’s t-test.
Consistent with the 500 hPa circulation field in Figure 5, the water vapor transport integrated from the ground to the 500 hPa showed similar characteristics, as shown in Figure 6. There was a particular cyclonic circulation anomaly in southern Central Asia while an anticyclonic circulation anomaly in northern Central Asia. Regression analysis also showed similar characteristics. However, compared to the 500 hPa circulation field, the features of the water vapor transport field were weaker, and there were fewer areas that passed student’s t-test. Because the water vapor transport was affected by many influencing factors, the TP monsoon alone could not fully explain the variance in water vapor transport. Nevertheless, the corresponding spatial difference characteristics of the water vapor transport field indicated that the TP monsoon also impacted water vapor transport in Central Asia.
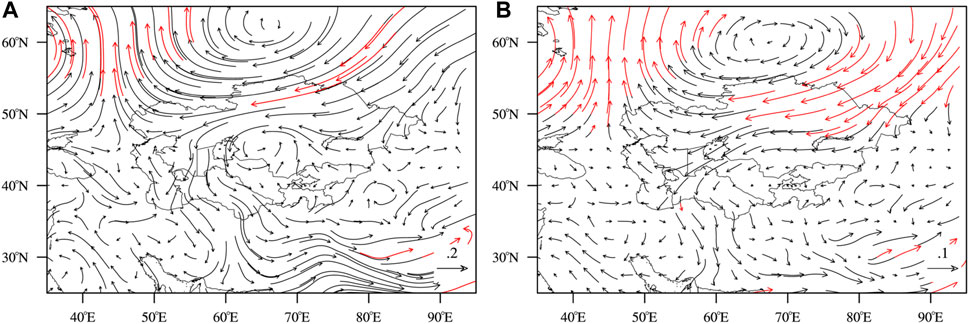
FIGURE 6. (A) Difference in the water vapor transport in the lower troposphere between the maximum and minimum TP monsoon index years. (B) Regression coefficient distribution of the TP monsoon index for water vapor transport in the lower troposphere. The red wind field in (A,B) is the area that passed the 90% confidence level student’s t-test.
The vertical profile showed that there was a significant updraft near 47°N, which corresponded to the negative geopotential height anomaly that existed over this area at 500 hPa (Figure 7A). Affected by the anticyclonic circulation anomaly in the high latitude area of 200 hPa, cold advection occurred over this area, resulting in a significant negative temperature anomaly near 250 hPa in the troposphere, as shown in Figure 7B. The thermal wind brought about by the cold advection also forced the region to appear ascending, which could also explain the significant ascending motion in Figure 7A. The regression analysis results also showed similar results, reflecting the considerable influence of the TP monsoon.
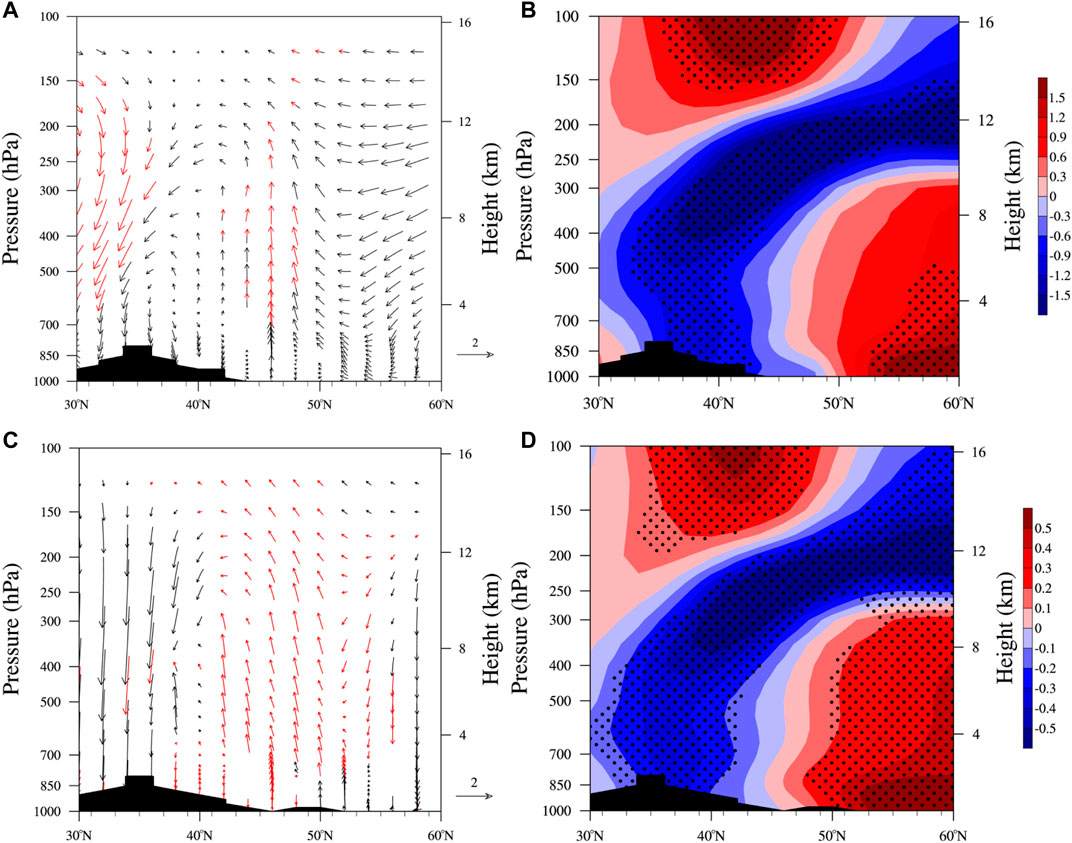
FIGURE 7. (A,B) shows the difference in the zonal profile after the radial average of the wind field and temperature between the maximum and minimum TP monsoon index years, respectively. (C,D) depict the regression coefficient distributions of the TP monsoon index for a zonal profile after the radial average of the wind field and temperature, respectively. The red wind field in (A,C) and the dotted area in (B,D) show the area that passed the 90% confidence level student’s t-test.
From the above analysis, it could be seen that the lower temperature caused by cold advection in the upper troposphere might be the key factor to the change in the vertical wind field and the change in precipitation in the area. Therefore, the temperature field of 500–200 hPa was integrated and used to calculate its relationship with the TP monsoon index. As shown in Figure 8A, there was a significant positive correlation between the TP monsoon index and the temperature of the mid-upper troposphere in Central Asia. The area-averaged temperature of the mid-upper troposphere in Central Asia was further calculated and defined as the mid-upper tropospheric temperature index (MUTTI, 35–48°N, 50–85°E, the rectangular area in Figure 8A). According to the time series of MUTTI and the TP monsoon index, there was a clear negative correspondence between them. The correlation coefficient reaches −0.42, which could pass the 99% confidence level student’s t-test, showing the close relationship between the TP monsoon and the temperature of the mid-upper troposphere in Central Asia.
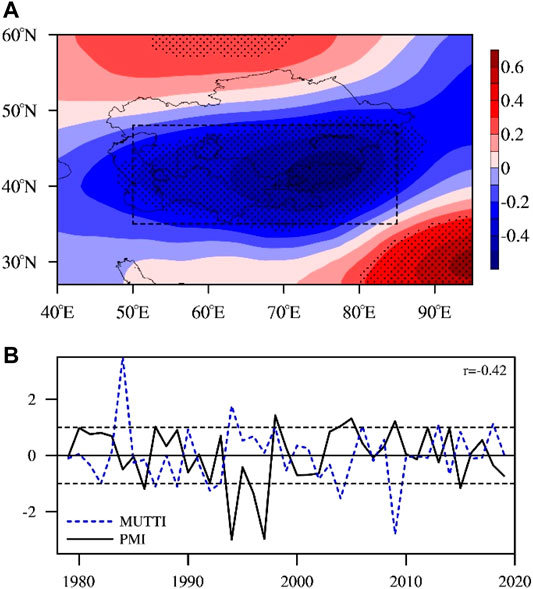
FIGURE 8. (A) Distribution of the correlation coefficient between the TP monsoon index and the mid-upper tropospheric temperature. (B) Time series of the TP monsoon index and the mid-upper tropospheric temperature index (MUTTI). The rectangular lines in (A) indicate the regions selected for the calculation of MUTTI, and the dotted area in (A) shows the area that passed the 90% confidence level student’s t-test.
By calculating the correlation coefficient between MUTTI and summer precipitation in Central Asia, it was found that MUTTI and summer precipitation in Central Asia were mainly negatively correlated (Figure 9A). When calculating the regional average precipitation in Central Asia (39–49°N, 54–78°E, the rectangular area in Figure 9A) to obtain the year-by-year time series of Central Asia precipitation, there was a significant correlation between the MUTTI and Central Asia precipitation, as shown in Figure 9B, and the correlation coefficient reached −0.34, which could pass the 90% confidence level student’s t-test.
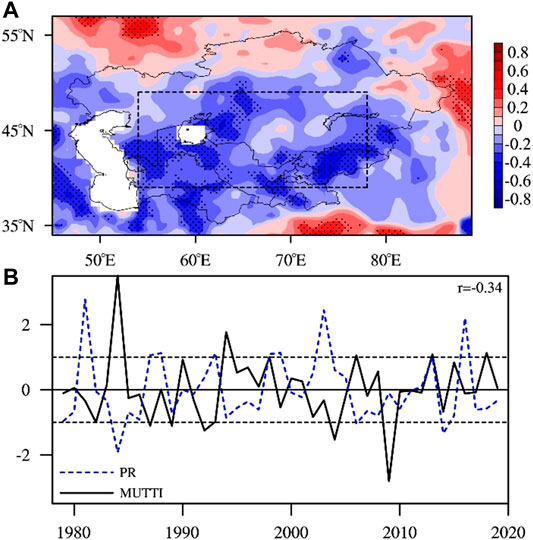
FIGURE 9. (A) Distribution of the correlation coefficient between the MUTTI and summer precipitation in Central Asia. (B) Time series of MUTTI and summer precipitation in Central Asia. The rectangular lines in (A) indicate the regions selected for the calculation of regional precipitation, and the dotted area in (A) shows the area that passed the 90% confidence level student’s t-test.
Using MUTTI as an independent variable to regress the 200 hPa circulation field (Figure 10). There was a positive center of the geopotential height regression coefficient at 200 hPa over Central Asia (Figure 10A). Affected by this, there was also an anticyclonic circulation anomaly with regression coefficients over Central Asia (Figure 10B). The spatial distribution of this regression coefficient was partly opposite to the results of the TP monsoon regression coefficient in Figure 4, which was mainly due to the negative correlation between the TP monsoon index and MUTTI, as shown in Figure 8B. Similar results were also found at 500 hPa, and there was a positive regression coefficient center of the geopotential height in southern Central Asia (Figure 11A). Additionally, there was an anticyclonic circulation anomaly in south Central Asia (Figure 11B). Compared the results between Figure 10 and Figure 11, the result at 200 hPa was more obvious.
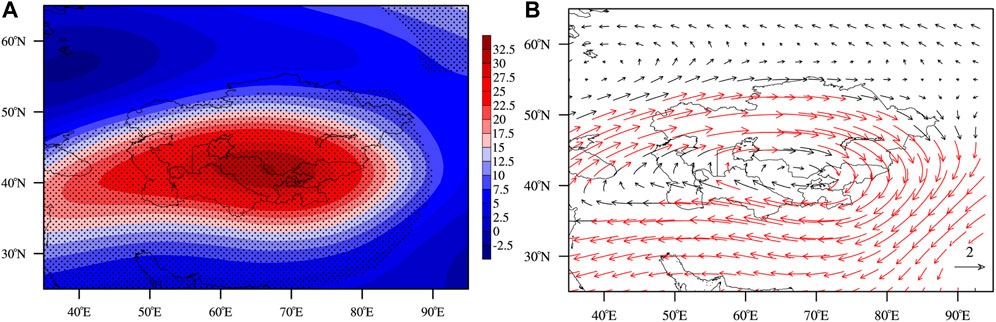
FIGURE 10. (A,B) show the regression coefficients of MUTTI for geopotential height and wind field of 200 hPa, respectively. The dotted area in (A) and the red wind field in (B) show the area that passed the 90% confidence level student’s t-test.
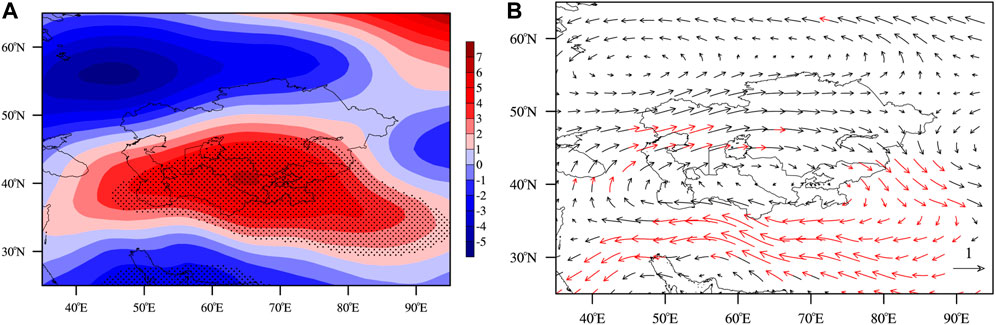
FIGURE 11. (A,B) show the regression coefficients of MUTTI for geopotential height and wind field at 500 hPa, respectively. The dotted area in (A) and the red wind field in (B) show the area that passed the 90% confidence level student’s t-test.
When considering the vertical profile, there was an ascending movement near 52°N in the northern part of Central Asia, while a sinking movement existed to the south of 52°N (Figure 12A). Affected by the sinking movement, precipitation in Central Asia decreased, which could also explain the negative correlation between MUTTI and summer precipitation in Central Asia (Figure 9A). As shown in Figure 12B, the MUTTI was closely related to the temperatures of the middle and lower troposphere and there was a positive center at 250 hPa in the troposphere, which was similar with the result in Figure 7D.
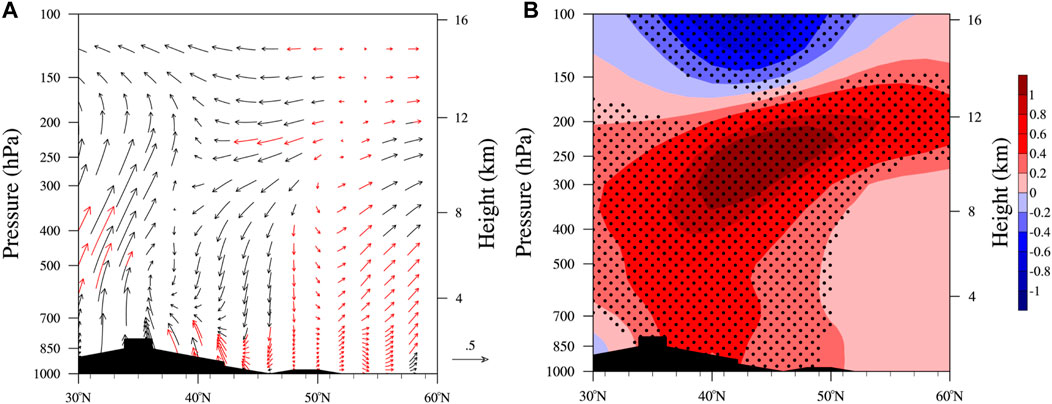
FIGURE 12. (A,B) show the regression coefficients of MUTTI for a zonal profile after the radial average of the wind field and temperature, respectively. The red wind field in (A) and the dotted area in (B) show the area that passed the 90% confidence level student’s t-test.
In a word, when the MUTTI was higher, there were positive geopotential height anomalies and anticyclonic circulation anomalies at the middle and upper troposphere. Affected by the circulation field, there was mainly sinking movement in Central Asia, which could explain the negative correlation between MUTTI and summer precipitation in Central Asia.
Discussion
The monsoon is an area where the prevailing wind direction changes significantly in winter and summer. The near surface level wind field has certain changes over TP due to the transition of the TP heat flux from winter to summer, so Tang et al. (1979) firstly defined this phenomenon as the TP monsoon. Later, Tang and Reiter (1984) also found a similar “plateau monsoon” over the western United States. Because of the spatial complexity of the TP land use, it is difficult to observe and simulate the TP thermal condition well. As we know, the reanalysis data showed a better performance on the isobaric circulation field compared with the surface variables, and this is more prominent on the TP where observational data is relatively scarce. Therefore, it is reasonable to use the TP monsoon index to replace the TP thermal conditions. Though the TP monsoon is the result of the thermal condition changes of the underlying surface, the TP monsoon is also affected by other factors such as the atmospheric circulation, so the TP monsoon cannot be equated with the TP thermal conditions.
The monthly simulation results of the BCC-CSM2-MR in CMIP6 from 1979 to 2014 were used to verify the above results. As shown in Figure 13A, there was apparent wind convergence on the TP in summer. There was also a significant positive correlation between the TP monsoon and summer precipitation in Central Asia, as shown in Figure 13B. However, because BCC-CSM2-MR was a global model, the distribution characteristics of the correlation coefficients were slightly different from those in Figure 3A. Nevertheless, the overall features were similar, which verified that there was a relationship between the TP monsoon and Central Asia precipitation.
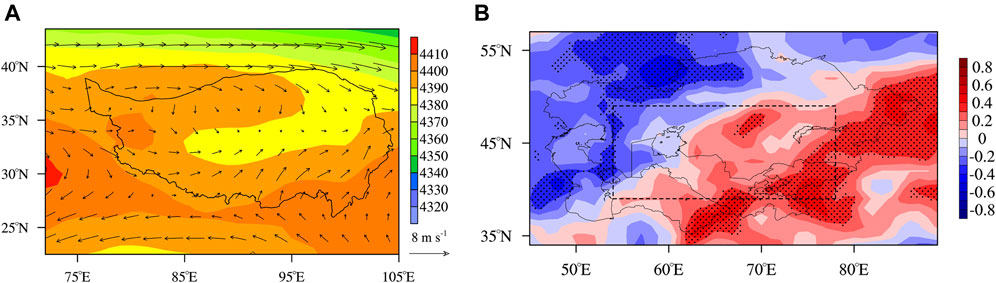
FIGURE 13. (A) Multiyear mean circulation (vectors, unit: m s−1) and geopotential height (shaded areas, unit: m) in summer. (B) Spatial distribution of the correlation coefficient between the TP monsoon index and summer precipitation. The data used here were the historical run of 1979–2014 from BCC-CMS2-MR. The dotted area in (B) shows the area that passed the 90% confidence level student’s t-test.
Furthermore, regression analysis results of BCC-CMS2-MR showed that when the TP monsoon index was stronger, the temperature in the southern part of Central Asia at 200 hPa was higher, and the temperature in the northern part of Central Asia was lower (Figure 14A). Combined with the northeast wind anomaly over the region (Figure 14B), there was a certain cold advection at 200 hPa. Therefore, the temperature in the upper layer of the northern part of Central Asia was colder (Figure 14D). The high-altitude cold advection also caused a negative geopotential height anomaly in southern Central Asia at 500 hPa (Figure 14C). Under the action of thermal wind, the abnormal rise in this area could explain the significant positive correlation between summer precipitation in southern Central Asia and the TP monsoon index. This finding was also consistent with the analysis results of the reanalysis data.
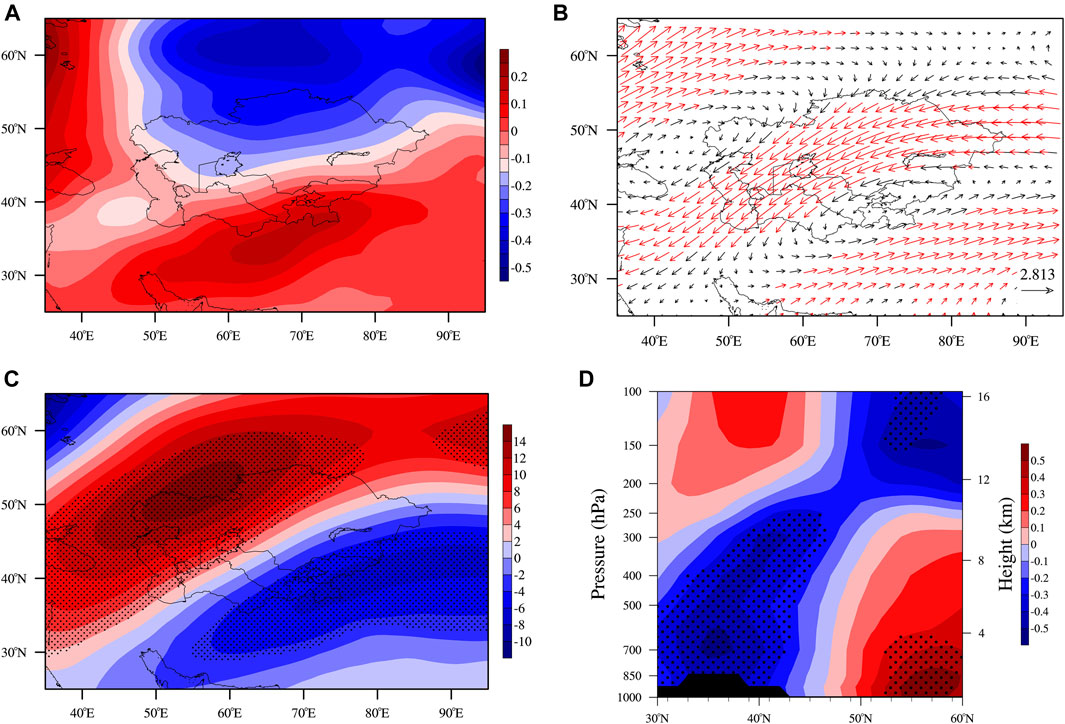
FIGURE 14. Regression coefficient distribution of the TP monsoon index for (A) the 200 hPa summer temperature (shaded areas, unit: K), (B) the 200 hPa wind field, and (C) the 500 hPa geopotential height (shaded areas, unit: m). (D) shows the regression coefficient distribution of the TP monsoon index for a zonal profile after the radial average of the temperature. The data used here were the historical run of 1979–2014 from BCC-CMS2-MR. The red wind field in (B) and dotted area in (A,C,D) are the areas that passed the 90% confidence level student’s t-test.
Conclusion
The TP monsoon was closely related to the precipitation in Central Asia, and there was a significant positive correlation. When the TP monsoon was strong, there was cold advection in the upper troposphere over Central Asia; in addition, the resulting thermal wind caused a cyclonic circulation anomaly in the mid-upper troposphere over Central Asia, which in turn led to a specific response to water vapor transport in the lower troposphere. The abnormal upward movement also caused more precipitation in this area, which explains the positive correlation between the TP monsoon and precipitation in Central Asia.
The temperature of the mid-upper troposphere over Central Asia was closely related to the TP monsoon, and it was a key factor affecting summer precipitation changes in Central Asia. When the temperature in the mid-upper troposphere over Central Asia was higher, there was an anomaly of anticyclonic circulation in the upper troposphere over Central Asia, which lead to the sinking movement in southern Central Asia and the reduced precipitation there.
Data Availability Statement
Publicly available datasets were analyzed in this study. This data can be found here: https://rda.ucar.edu/datasets/ds628.1, https://esgf-node.llnl.gov/projects/cmip6 and https://www.dwd.de/EN/ourservices/gpcc/gpcc.html.
Author Contributions
SZ and YZ contributed to the idea and research of the study. LM performed the statistical analysis. XY wrote sections of the manuscript. AH organized the database. All authors contributed to manuscript revision, read, and approved the submitted version.
Funding
This work was funded by the Sichuan Science and Technology Program (Grant No. 2020JDJQ0050), the National Natural Science Foundation of China (Grant Nos. 41875102 and 42105034), the Plateau Atmosphere and Environment Key Laboratory of Sichuan Province (Grant No. PAEKL-2018-Y2), and Chengdu University of Information Technology Introduces Talent Research Start-up Project (Grant No. KYTZ201737). All sources of funding received for the research being submitted.
Conflict of Interest
The authors declare that the research was conducted in the absence of any commercial or financial relationships that could be construed as a potential conflict of interest.
Publisher’s Note
All claims expressed in this article are solely those of the authors and do not necessarily represent those of their affiliated organizations, or those of the publisher, the editors and the reviewers. Any product that may be evaluated in this article, or claim that may be made by its manufacturer, is not guaranteed or endorsed by the publisher.
References
Bothe, O., Fraedrich, K., and Zhu, X. (2012). Precipitation Climate of Central Asia and the Large-Scale Atmospheric Circulation. Theor. Appl. Climatol 108 (3-4), 345–354. doi:10.1007/s00704-011-0537-2
Chen, C., Zhang, X., Lu, H., Jin, L., Du, Y., and Chen, F. (2021). Increasing Summer Precipitation in Arid Central Asia Linked to the Weakening of the East Asian Summer Monsoon in the Recent Decades. Int. J. Climatol 41 (2), 1024–1038. doi:10.1002/joc.6727
Chen, F., Huang, W., Jin, L., Chen, J., and Wang, J. (2011). Spatiotemporal Precipitation Variations in the Arid Central Asia in the Context of Global Warming. Sci. China Earth Sci. 54 (12), 1812–1821. doi:10.1007/s11430-011-4333-8
Chen, X., Wang, S., Hu, Z., Zhou, Q., and Hu, Q. (2018). Spatiotemporal Characteristics of Seasonal Precipitation and Their Relationships with ENSO in Central Asia during 1901-2013. J. Geogr. Sci. 28 (9), 1341–1368. doi:10.1007/s11442-018-1529-2
Hu, Z., Zhang, C., Hu, Q., and Tian, H. (2014). Temperature Changes in Central Asia from 1979 to 2011 Based on Multiple Datasets. J. Clim. 27 (3), 1143–1167. doi:10.1175/jcli-d-13-00064.1
Hu, Z., Zhou, Q., Chen, X., Li, J., Li, Q., Chen, D., et al. (2018). Evaluation of Three Global Gridded Precipitation Data Sets in central Asia Based on Rain Gauge Observations. Int. J. Climatol 38 (9), 3475–3493. doi:10.1002/joc.5510
Hu, Z., Zhou, Q., Chen, X., Qian, C., Wang, S., and Li, J. (2017). Variations and Changes of Annual Precipitation in Central Asia over the Last century. Int. J. Climatol 37, 157–170. doi:10.1002/joc.4988
Huang, W., Chen, F., Feng, S., Chen, J., and Zhang, X. (2013). Interannual Precipitation Variations in the Mid-latitude Asia and Their Association with Large-Scale Atmospheric Circulation. Chin. Sci. Bull. 58 (32), 3962–3968. doi:10.1007/s11434-013-5970-4
Huang, W., Chen, J., Zhang, X., Feng, S., and Chen, F. (2015). Definition of the Core Zone of the "Westerlies-Dominated Climatic Regime", and its Controlling Factors during the Instrumental Period. Sci. China Earth Sci. 58 (5), 676–684. doi:10.1007/s11430-015-5057-y
Jiang, J., Zhou, T., Chen, X., and Zhang, L. (2020). Future Changes in Precipitation over Central Asia Based on CMIP6 Projections. Environ. Res. Lett. 15 (5), 054009. doi:10.1088/1748-9326/ab7d03
Kobayashi, S., Ota, Y., Harada, Y., Ebita, A., Moriya, M., Onoda, H., et al. (2015). The JRA-55 Reanalysis: General Specifications and Basic Characteristics. J. Meteorol. Soc. Jpn. 93 (1), 5–48. doi:10.2151/jmsj.2015-001
Li, J., and Zeng, Q. (2000). Significance of the Normalized Seasonality of Wind Field and its Rationality for Characterizing the Monsoon. Sci. China Ser. D-earth Sci. 43 (6), 646–653. doi:10.1007/bf02879509
Peng, D., Zhou, T., Zhang, L., and Wu, B. (2018). Human Contribution to the Increasing Summer Precipitation in Central Asia from 1961 to 2013. J. Clim. 31 (19), 8005–8021. doi:10.1175/jcli-d-17-0843.1
Qi, Y., Feng, S., Huang, J., Ran, J., and Long, Z. (2015). Influence of Plateau Summer Monsoon on Summer Precipitation in the Arid and Semi-arid Regions of the central and East Asia. Plateau Meteorology 34 (6), 1566–1574. doi:10.7522/j.issn.1000-0534.2014.00088 (In Chinese).
Tang, M., Liang, J., Shao, M., and Shi, G. (1984). Preliminary Analysis on Inter-annual Variation of Plateau Monsoon. Plateau Meteorology 3 (3), 76–82.
Tang, M., and Reiter, E. R. (1984). Plateau Monsoons of the Northern Hemisphere: A Comparison between North America and Tibet. Mon. Wea. Rev. 112 (4), 617–637. doi:10.1175/1520-0493(1984)112<0617:pmotnh>2.0.co;2 (In Chinese)
Tang, M., Shen, Z., and Chen, Y. (1979). On Climatic Characteristics of the Xizang Plateau Monsoon. Acta Geographica Sinica 46 (1), 33–42. doi:10.11821/xb197901004 (In Chinese)
Wei, W., Zhang, R., Wen, M., and Yang, S. (2017). Relationship between the Asian Westerly Jet Stream and Summer Rainfall over Central Asia and North China: Roles of the Indian Monsoon and the South Asian High. J. Clim. 30 (2), 537–552. doi:10.1175/jcli-d-15-0814.1
Xu, L., Zhou, H., Du, L., Yao, H., and Wang, H. (2015). Precipitation Trends and Variability from 1950 to 2000 in Arid Lands of Central Asia. J. Arid Land 7 (4), 514–526. doi:10.1007/s40333-015-0045-9
Xu, S., and Gao, Y. (1962). The Monsoon Phenomenon in Tibetan Plateau. Acta Geographica Sinica 28 (2), 111–123. (In Chinese)
Yang, K., Wang, C., and Bao, H. (2016). Contribution of Soil Moisture Variability to Summer Precipitation in the Northern Hemisphere. J. Geophys. Res. Atmos. 121 (20), 108–112. doi:10.1002/2016jd025644
Yao, J., Chen, Y., Chen, J., Zhao, Y., Tuoliewubieke, D., Li, J., et al. (2021). Intensification of Extreme Precipitation in Arid Central Asia. J. Hydrol. 598, 125760. doi:10.1016/j.jhydrol.2020.125760
Ye, D., Luo, S., and Zhu, B. (1957). The Wind Structure and Heat Balance in the Lower Tropophere over Tibetan Plateau and its Surrounding. Acta Meteorologica Sinica 28 (2), 108–121. (In Chinese)
Zhang, M., Yu, H., King, A. D., Wei, Y., Huang, J., and Ren, Y. (2020). Greater Probability of Extreme Precipitation under 1.5 °C and 2 °C Warming Limits over East-Central Asia. Climatic Change 162 (2), 603–619. doi:10.1007/s10584-020-02725-2
Zhang, S., Lü, S., Ao, Y., and Ma, D. (2015). A New Plateau Monsoon Index Based on Wind Dynamical Normalized Seasonality and its Application. Plateau Meteorology 34 (4), 881–889. doi:10.7522/j.issn.1000-0534.2015.00067 (In Chinese)
Zhang, S., Lü, S., Zhao, Y., and Yang, X. (2019). An Improvement of the Plateau Monsoon index Based on Seasonal Variation of Wind and its Comparison with Other Indexes. Acta Meteorologica Sinica 77 (2), 315–326. doi:10.11676/qxxb2019.019 (In Chinese)
Zhao, Y., Huang, A., Zhou, Y., Huang, D., Yang, Q., Ma, Y., et al. (2014). Impact of the Middle and Upper Tropospheric Cooling over Central Asia on the Summer Rainfall in the Tarim Basin, China. J. Clim. 27 (12), 4721–4732. doi:10.1175/jcli-d-13-00456.1
Zhao, Y., Huang, A., Zhou, Y., and Yang, Q. (2016). The Impacts of the Summer Plateau Monsoon over the Tibetan Plateau on the Rainfall in the Tarim Basin, China. Theor. Appl. Climatol 126 (1-2), 265–272. doi:10.1007/s00704-015-1576-x
Zhao, Y., Yu, X., Yao, J., Dong, X., and Li, H. (2019). The Concurrent Effects of the South Asian Monsoon and the Plateau Monsoon over the Tibetan Plateau on Summer Rainfall in the Tarim Basin of China. Int. J. Climatol 39 (1), 74–88. doi:10.1002/joc.5783
Keywords: Tibetan Plateau monsoon, Central Asia, summer precipitation, mid-upper troposphere temperature, Tibetan Plateau (TP)
Citation: Zhang S, Meng L, Zhao Y, Yang X and Huang A (2022) The Influence of the Tibetan Plateau Monsoon on Summer Precipitation in Central Asia. Front. Earth Sci. 10:771104. doi: 10.3389/feart.2022.771104
Received: 05 September 2021; Accepted: 31 January 2022;
Published: 09 March 2022.
Edited by:
Tomas Halenka, Charles University, CzechiaReviewed by:
Chenghai Wang, Lanzhou University, ChinaAshok Kumar Jaswal, India Meteorological Department, India
Copyright © 2022 Zhang, Meng, Zhao, Yang and Huang. This is an open-access article distributed under the terms of the Creative Commons Attribution License (CC BY). The use, distribution or reproduction in other forums is permitted, provided the original author(s) and the copyright owner(s) are credited and that the original publication in this journal is cited, in accordance with accepted academic practice. No use, distribution or reproduction is permitted which does not comply with these terms.
*Correspondence: Yong Zhao, emhhb3k2MDhAY3VpdC5lZHUuY24=