 Yuan Jung Tsai
 Yi Jing Chen1
 Kun-An Hsu
94% of researchers rate our articles as excellent or good
Learn more about the work of our research integrity team to safeguard the quality of each article we publish.
Find out more
ORIGINAL RESEARCH article
Front. Earth Sci., 11 February 2022
Sec. Geohazards and Georisks
Volume 10 - 2022 | https://doi.org/10.3389/feart.2022.759556
This article is part of the Research TopicIntegration of State-of-Art Techniques for Landslide Hazard Assessment and for the Mitigation Caused by the Subsequent Multimodal DisasterView all 11 articles
Underclimate changes, extreme rainfall events can cause catastrophic sediment-related disasters such as large-scale landslides. To work on disaster prevention, the government has investigated the location of potential large-scale landslides by a geological and geomorphological approach. However, the activity of potential large-scale landslides has to rely on expensive on-site monitoring system, for example, observed drill hole of groundwater and underground displacement. Recently, the variation of stream electronic conductivity has been proposed to investigate the activity of large-scale landslide in Japan. Therefore, this study applied this concept in Taiwan. First, the temporal and spatial variations of stream electronic conductivity near the potential large-scale landslide have been surveyed. Accordingly, an interesting finding is that the spring water from the potential large-scale landslide can increase the concentration of chemical ion, and thus, the value of stream electronic conductivity increases. Second, the comparison of rainfall data, stream electronic conductivity, and ground surface displacement has been analyzed. There is a sound agreement between stream electronic conductivity and ground surface displacement. This result implied that stream electronic conductivity could be a possible index to monitoring the activity of potential large-scale landslides indirectly.
Extreme climatic effects have accelerated rainfall-induced large-scale landslides (LSLs) (Stanley and Kirschbaum, 2017; Kirschbaum and Stanley, 2018); therefore, occurrence assessment has emerged as the critical issue in slope management. After the Hsiaolin Village disaster caused by Typhoon Morakot in Taiwan in 2009, it has become imperative for the government to prevent and mitigate rainfall-induced LSLs. Numerous potential large-scale landslide (PLSL) areas (with an area exceeding 10 ha, depth in excess of 10 m, or volume greater than 100,000 m3) have been identified using high-resolution topographic images (Lin et al., 2012). Marui (2017) pointed out that the investigation of LSLs can be detected by specific topographic features, such as “double ridge,” “head scarp,” and “gully.” Chigira (2014) called it a geological and geomorphological approach and has wildly applied it for the detection of LSLs. However, the images could only elucidate areas of deformation that the time of occurrence of the deformation remains unknown. Also, there is currently a lack of precision of quantitative methods to accurately predict when the PLSL will collapse.
Extant research indicates that LSL incidence is closely correlated with rainfall, infiltration processes, and groundwater alteration (Celia and Binning, 1992; Van Asch et al., 1999; Mantovani et al., 2000; Trigo et al., 2005; Ray and Jacobs, 2007; Miyamoto and Imaizumi, 2012). As rainfall infiltrates the slope, the inherent slope mass increases, thereby increasing driving force. At the same time, infiltration causes pore water pressure to rise and makes effective stress decrease, following reduced resistance force. This process finally decreases overall safety factors. This indicates that precipitous elevation in pore water pressure and sudden drop in effective stress lead to slope instability (Terzaghi, 1943; Lee et al., 2019). The research indicated that the monitoring of infiltration and groundwater plays an important role in the rainfall-induced LSLs.
In the case of PLSL, the phreatic surface could exist at a very deep location (Wei et al. 2019; Wei et al. 2020). Thus, the installation of deep groundwater wells for real-time monitoring is high cost and difficult to maintain as the PLSL with high activity. The observation of infiltration and groundwater volume poses significant challenges; some scholars have deployed stream electrical conductivity (EC) as an alternative to groundwater observation. Jitousono et al. (2006) investigated stream EC in catchment areas finding significant groundwater volume flowed out in the area where landslides occurred, causing the EC of the water body to be significantly higher than the areas where no collapse occurred and can be used to estimate the location of such groundwater springs. Jitousono (2014) proposed a relationship between LSLs and EC values, mentioning that with landslide occurrence, the measured conductivity value will be significantly higher than the value upstream of the landslide. Jitousono (2014) pointed out that the time consumed for the groundwater draining outside the slope is longer than the infiltration, so that groundwater can carry out a higher concentration of chemical ions and the spring water is with a higher EC value; the concept is shown in Figure 1. Weng et al. (2018) also discussed landslide rates and EC in Taiwan. Using survey results for 24 catchment areas, they found that catchment areas with high landslide rates also have higher EC values measured at the outlet. These research studies implied that the observation of stream EC could be an alternative option to the monitoring of PLSL.
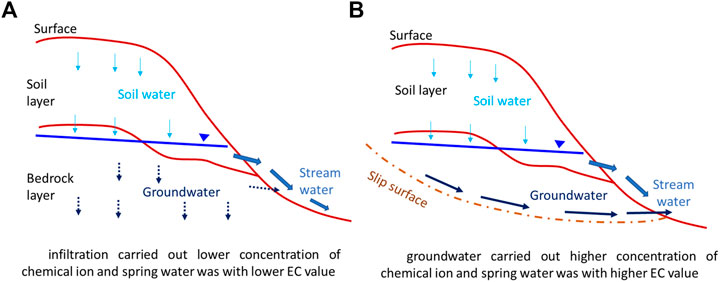
FIGURE 1. Concept of stream EC variation corresponding to infiltration and groundwater. (A) Infiltration carried out lower concentration of chemical ion and spring water was with lower EC value. (B) Groundwater carried out higher concentration of chemical ion and spring water was with higher EC value.
The purpose of this study is to focus on the application of stream EC on the PLSL. A catchment where PLSL existed was chosen to be the study area. The recorded data of stream EC, rainfall, and ground surface displacement in the catchment were collected to understand the relationship between stream EC and PLSL. This study was conducted in two stages. First, the temporal and spatial changes in EC across the PLSL in the catchment area were used to elicit the understanding of the spatial relationship between the PLSL and the EC variation. Second, the relationship between EC variation and landslide activity was probed by conducting correlation analysis between parameters, such as accumulated rainfall, surface deformation, and EC. Finally, the potential application of stream EC on the PLSL was suggested in this study.
In the present study, the study area, the collection data, and the data processing were introduced in Section 2. In Section 3, the relationship between stream EC and PLSL was discussed, which includes the spatial characteristics of stream EC response to the location of PLSL, and the activity of PLSL related to the evolution of stream EC. In Section 4, the finding about the relationship between the stream EC and the PLSL and its potential application were concluded.
The selected study area was ZulinPLSL, located in the Kaoping River basin of southern Taiwan (Figure 2E). The study area has a catchment area of 133 ha, a river length of 945 m, and an average elevation distribution ranging from 1,300 m to 6,650 m, with a slope of 32° (Figure 2A). The catchment area stratum mainly belongs to the Changshan Formation Low-Grade Pelites (Figure 2B). This area was severely damaged by Typhoon Morakot in 2009, as shown in Figure 2C and Figure 2D. The landslides induced by typhoon was about 30 ha, with houses and roads in the area pervasively destroyed.
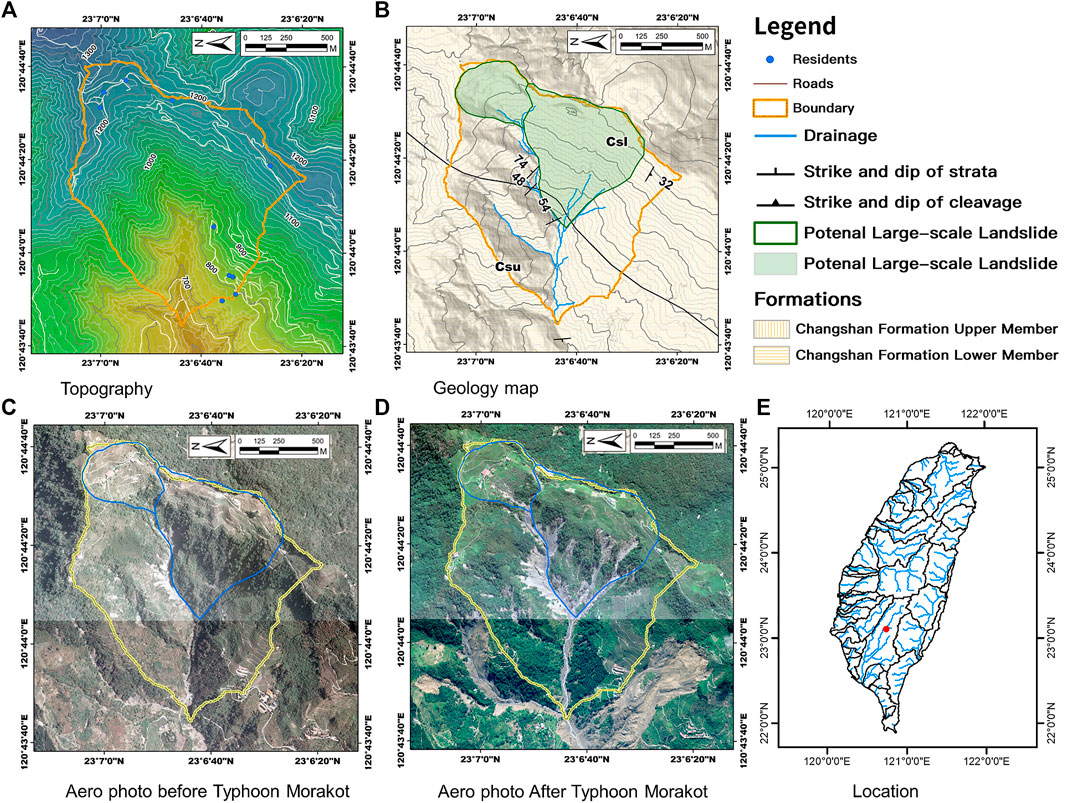
FIGURE 2. Location, topography, and historical image of research area. (A) Topography, (B) geology map, (C) aero photo before Typhoon Morakot, (D) aero photo after Typhoon Morakot, (E) location.
Because of the passing of the Changshan Formation and the fragility of geology in the upper member, at the upper edge of the slope near the ridge, there is obviously a double ridge feature, which may develop during early large-scale slope sliding, as shown in Figure 3A. After field investigation, it can be divided into upper and lower members according to lithology. The upper member has a low degree of metamorphism. Lithology is dominated by hard shale (argillite) and prevalent pencil structures developed by weathering (Figure 3B). It implied that penetration could be faster and the fluctuation of groundwater could be more sensitive in this region. The lower member has a higher degree of metamorphism, and the lithology is dominated by slate rock. Due to the low degree of metamorphism, slaty cleavage is less developed (Figure 3C). Near the gully on the slope, the resultant from low lithology resistance to weathering, there is susceptibility to river and creek erosion, leading to side bank collapses. The upper slope was affected and started to deform, which could be observed from the damaged on-site artificial structures. Taiwan’s Central Geological Survey has set up a continuous GPS monitoring station to observe the slope activity status. These observations help quantify area activity. Hence, there are two PLSLs in this catchment. The green area in Figure 3A is one PLSL area that has been recognized by the Central Geological Survey 1). The other one in Figure 3A is another PLSL area 2), which defined by this study.
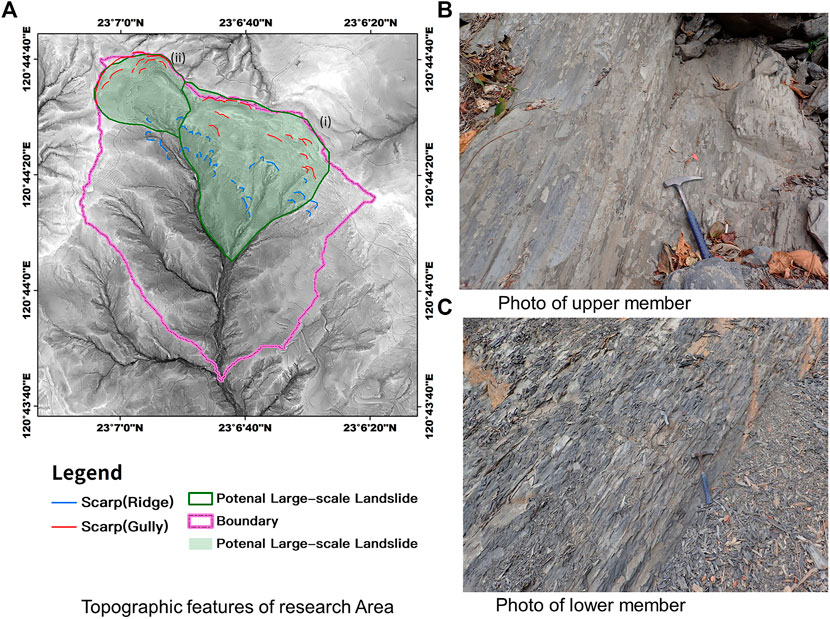
FIGURE 3. Geology information of research area. (A) Geology map, (B) photo of upper member, (C) photo of lower member.
To elucidate spatial changes of EC, this study was performed using direct on-site observation. Water samples of streams in the study area were collected from downstream to upstream for EC measurement. Sampling locations (Figure 4A) were selected as outlets 1), downstream sections of the river 2), middle reaches of the river 3), the boundary of the PLSL 4), and location in the PLSL area 5). The sampling method was to take water on-site (Figure 4B) and measure it with an EC pocket meter, in which the range of measurement is 0–2,000
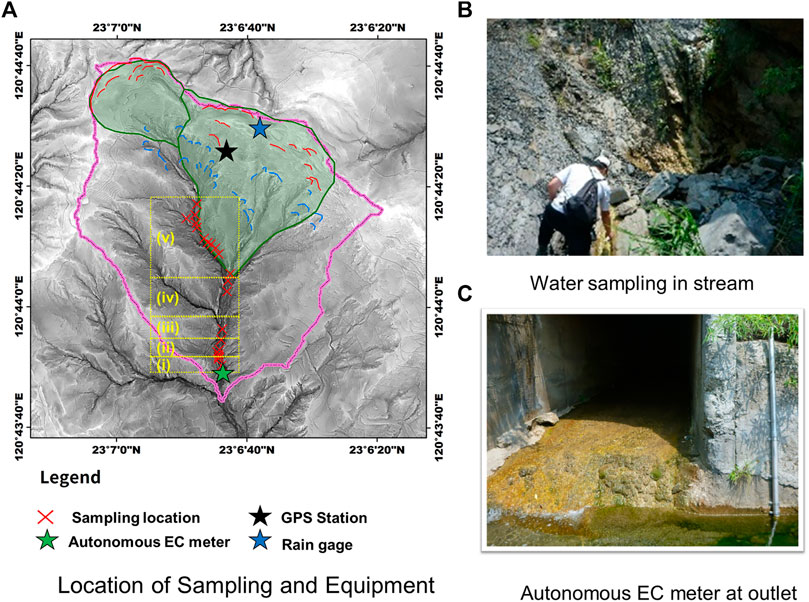
FIGURE 4. Stream conductivity survey method. (A) Location of sampling and equipment, (B) on-site sampling, (C) automatic observation at the outlet point.
Rainfall data were adopted from an automatic rain gauge. The rainfall data were recorded one time per hour automatically. Daily rainfall and monthly rainfall were obtained from data calculation. Daily rainfall was used to discuss the variation of EC with precipitation. Monthly rainfall was used to clarify the different seasons.
The area’s surface deformation observation results were collected to present the activity of PLSL. Surface displacement data were from single-frequency GPS monitoring stations installed by the Central Geological Survey in the ZulinPLSL; the location is shown in Figure 4A. The observational data from 905 GPS stations were selected due to their obvious surface displacement, and the station is shown in Figure 5A. The deformation results were solved every hour with 10 mm resolution. In accordance with daily coordinates (E, N, H) provided by ground adjustment, as shown in Figure 5B, the movement distance and cumulative displacement were both calculated. Calculation formulas are in (Eq. 1) and (Eq. 2):
where ∆S is the daily deformation (mm), ∆E is the daily E coordinate change (mm), ∆N is the daily N coordinate change (mm), ∆Z is the daily Z coordinate change (mm), and S: cumulative deformation (mm).
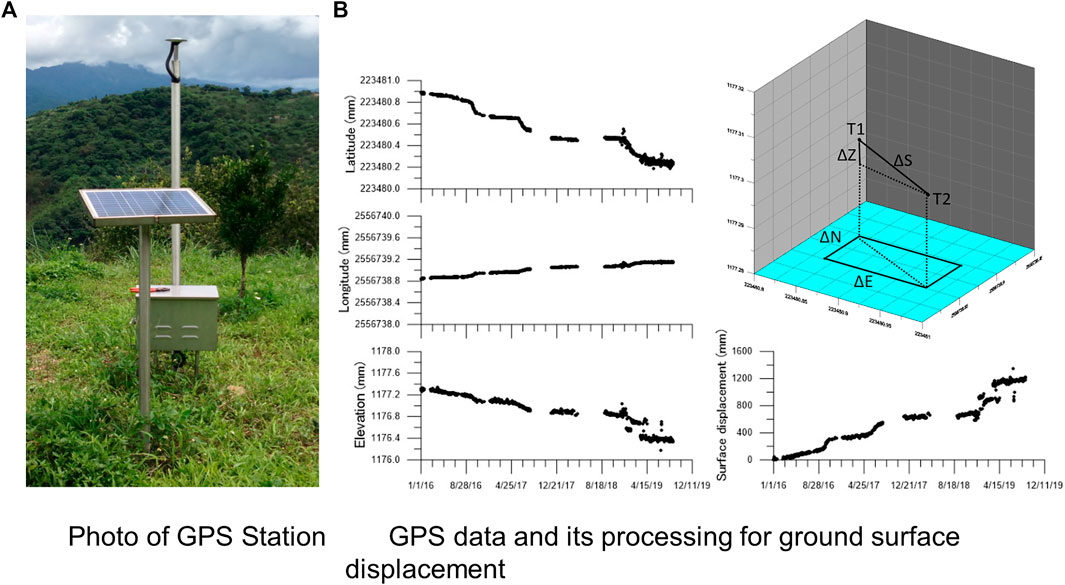
FIGURE 5. GPS observing station and the data processing. (A) Photo of GPS station, (B) GPS data and its processing for ground surface displacement.
The data of stream EC obtained on-site over time with corresponding rainfall data were compared. There are 6 surveys from October 2018 to April 2019. In Figure 6, the horizontal axis is time and the vertical axis is conductivity and rainfall. Monthly accumulated rainfall was used to consider seasonal variation in conductivity.
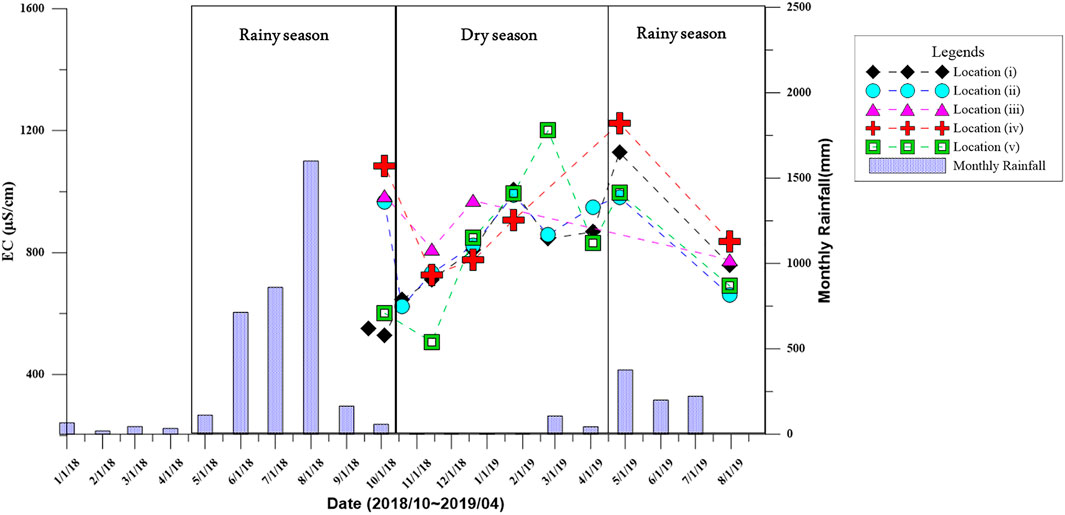
FIGURE 6. Temporal change of EC along the stream.
Accordingly, as shown in Figure 6, it may be ascertained that dry season stream EC is higher than the wet season, and stream EC continues to increase with time during the dry season, only then gradually decreasing at wet season onset. In the dry season, the mainstream flow relies on groundwater spring. Throughout this period, it is known that stream conductivity is higher. For the wet season, under the influence of rainfall replenishment, the stream water source is not only the original groundwater source but includes increasing rainfall, surface runoff, and other different sources. As it is refilled, stream EC is reduced by the increasing amount of water. Therefore, it can be seen for this study area that groundwater conductivity is higher than that of rainwater or surface runoff. Hence, the change in stream EC is indeed related to groundwater, which can be used to indirectly understand the correlation between surface water and groundwater. This result is in agreement with the investigation of stream EC in Japanese by Jitousono et al. (2006) and Jitousono(2014).
In analyzing stream conductivity, cumulative distance was set to 0 at outlet culvert, with cumulative distance increasing to the upstream direction, cf. Figure 4A shows stream EC at corresponding locations, with the horizontal axis as distance and the vertical axis as electrical conductivity value. The different symbols represent measurement results at different times. In Figure 7A, the stream EC was collected before the rainy season and in Figure 7B, after the rainy season.
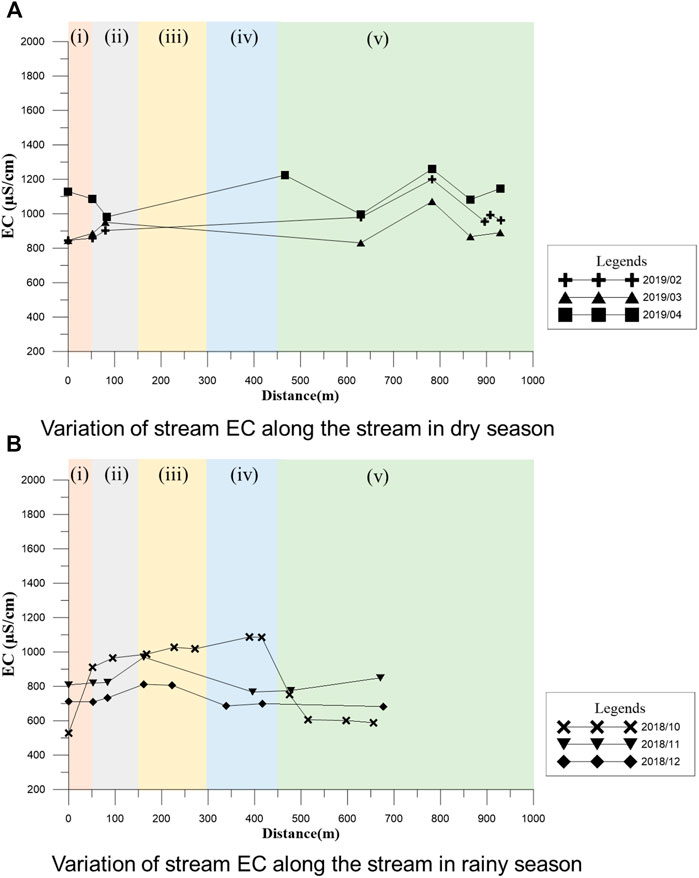
FIGURE 7. Spatial change of EC along the stream. (A) Variation of stream EC along the stream in dry season, (B) variation of stream EC along the stream in rainy season.
Figure 7B presents that the stream EC changes significantly around the river region 4 and region 5. As shown in Figure 4A, the slope toe of PLSL is located between the river region 4 and region 5. This phenomenon demonstrates that upstream stream conductivity increases significantly after passing the PLSL boundary and then decreases as it moves away. Take October 2018 data in Figure 7B for example, stream EC at the bottom edge of the river region 5 was 606 μS/cm, while stream EC at the top edge of the river region 4 increased to 1,085 μS/cm.
Figure 7A points out that there is another stream EC peak in the river region 5. According to the first peak, which this study pointed out in Figure 7B between the river regions 4 and 5, the peak of stream EC exists due to the spring water from PLSL. This evidence in Figure 7A indicates that there is another groundwater spring out at this location increasing stream EC. Consider the topographic features, as shown in Figure 4A. Thus, a supplementary on-site survey was deployed, as shown in Figure 8. The new identified area is the newly added LSL area for this survey. The artificial structure in the area is due to strong subsurface damage, with a highly active east ridge and clear cliff topography, as shown in Figure 8, with an exposed new sliding surface. Hence, additional groundwater outflow is possible. From the overall spatial change analysis results, it is seen that using the change points in conductivity can indeed elucidate whether the slope has a PLSL area or whether there is groundwater influx.
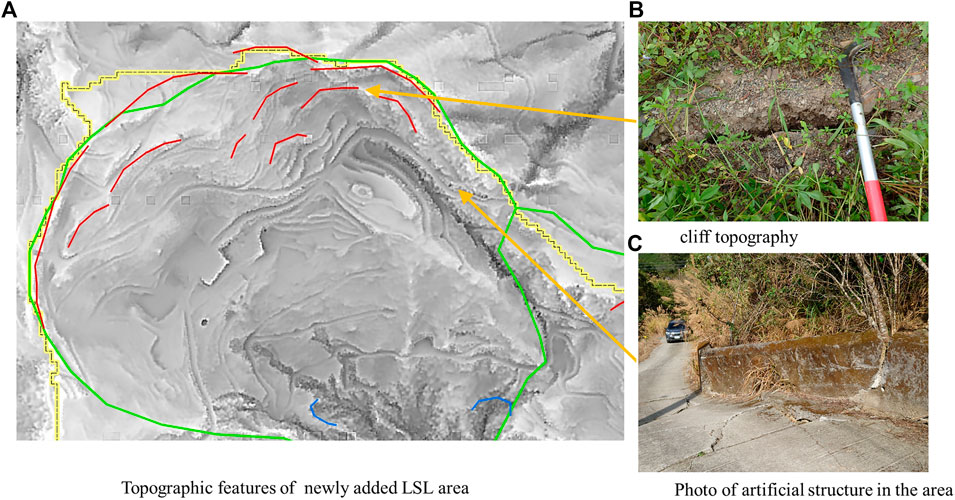
FIGURE 8. Regional PLSL supplementary survey. (A) Topographic features of newly added LSL area, (B) cliff topography, (C) photo of artificial structure in the area.
To clarify the relationship between stream EC variation and rainfall, this study observed the stream EC of the watershed outlet continuously; the comparison is depicted in Figure 9. In Figure 9, the horizontal axis is time, the vertical axis is the stream EC variation, and the bar graph is daily rainfall. As shown in Figure 9, EC dropped significantly after rainfall events and increased afterward. The EC drop could be observed easily after continuous rainfall. According to the concept of stream EC variation response to infiltration, as shown in Figure 1A, the amount of infiltration water can dilute the concentration of chemical ions, and so the stream EC decreased after peak of rainfall intensity. After the end of rainfall events, the supply of river came from the slope’s spring water. As the concept of stream EC variation response to groundwater, as shown in Figure 1B, the stream EC increased due to the spring water from groundwater. This evidence implied that the variation of stream EC could represent the amount of discharge of groundwater in a catchment indirectly.
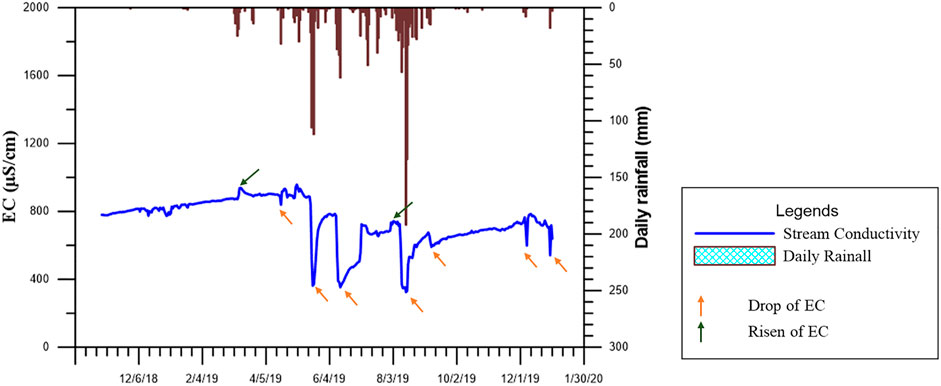
FIGURE 9. Comparison of rainfall and stream EC.
In order to evaluate the feasibility of using EC to estimate PLSL activity, this study confirmed the relationship between EC and ground surface displacement. This study collected observational results for ground surface displacement and stream EC in the study area. The comparison is plotted as Figure 10. In Figure 10, the orange line represents the accumulative displacement amount of the GPS station.
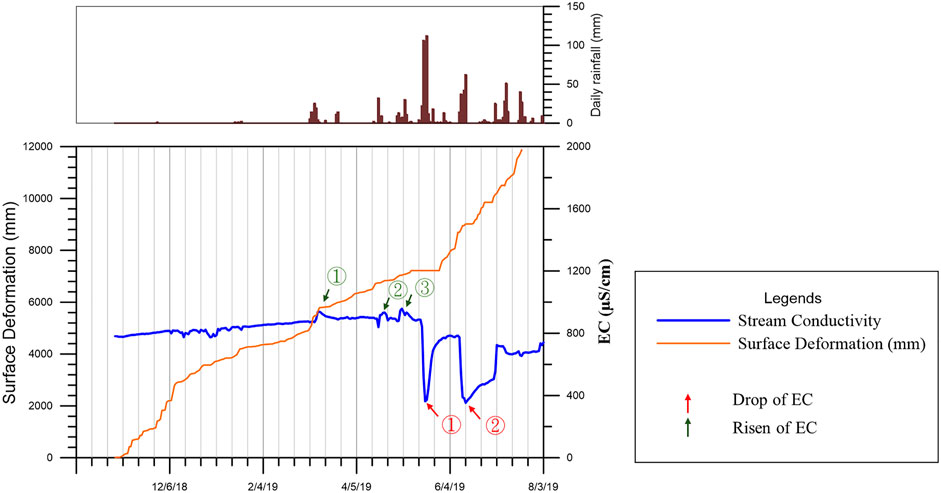
FIGURE 10. Comparison of stream EC and ground surface displacement.
There are two interesting phonemes shown in Figure 10. First, the activity of PLSL is positive with the increasing stream EC. In Figure 10, green number 1 indicated a steeper change of ground surface displacement, which means the activity of PLSL is faster. Coincidently, a jump of stream EC could be found at the same time. Besides, green numbers 2 and 3 also showed quickly increasing stream EC, and the cumulative displacement also reflected a minor increasing. These results implied that the sudden jump of stream EC could be used to judge the activity of PLSL indirectly. Second, the evolution of stream EC showed different rising speed after red numbers 2 and 3. According to the cumulative displacement, the PLSL was changed to more active after the time point of red number 2. This study considered that the high activity of PLSL might change the pattern of groundwater flow and resulted in a decrease of spring water from the groundwater system. Thus, the concentration of chemical ions in the stream after time point of red number 3 could not be supplied immediately. After the PLSL was maintained in a steady activity, which means the increasing speed of cumulative displacement remained as a fixed value, the groundwater could drain outside slope stably. Thereafter, the stream EC was also kept in a fixed range, which was 700 –800 μS/cm.
This study investigated the ZulinPLSL area exploring seasonal differences in stream conductivity over time. Spatially, EC changes along difference distance from the PLSL were analyzed. Finally, correlations between stream EC, rainfall, and ground surface displacement data were studied. The research results areas follows:
1) The study clearly determined that dry season conductivity is higher than that of wet season. During the wet season, streams are affected by rainfall and overland flow, and EC is lower. During the dry season, conductivity has a continuous upward trend due to deep groundwater continuous outflow, or because of higher proportional groundwater in the stream without rainfall, conductivity is higher.
2) In the ZulinPLSL, it was found that stream conductivity near the PLSL is higher, and stream conductivity upstream and downstream have a downward trend. Moreover, in light of differences in stream conductivity, it can be inferred that there are two groundwater springs or groundwater sources in this area.
3) This study explored relationships between cumulative rainfall, cumulative surface displacement, and EC. Based on the results, the cumulative rainfall and cumulative surface displacement have the same trends as the conductivity rise and drop-stop slope sections.
4) In accordance with the aforementioned research and analysis, measuring stream EC to estimate the activity of PLSL is effective. Hydrological changes and cumulative surface displacements can be elicited from long-term conductivity changes indirectly elucidating the activity level of PLSLs, which could serve as one of the monitoring indicators.
5) Since there are no existing drillings in the study area, continuous groundwater level data could not be obtained. It is suggested that the study area be drilled for further exploring relationships between groundwater level changes, groundwater level flow changes, and EC, which will be significantly useful for predicting occurrence of LSLs.
6) The results of this study implied a potential application for the monitoring of PLSL activity. By the investigation of temporal and spatial stream EC variation, the optimal location for automatic stream EC observation is the outlet point of catchment. The base line of stream EC can be estimated by the recording data in dry season. If there is any abnormal increasing stream EC, it is implied that the PLSL becomes active. This study is a pioneer research, and we expect to advance it in the following study.
The original contributions presented in the study are included in the article/Supplementary Material; further inquiries can be directed to the corresponding author.
Conceptualization, Y-JT; methodology, Y-JC, C-HW, K-AH, and W-LL; formal analysis, Y-JC, C-HW, and K-AH; Y-JT, F-TS, and W-LL wrote the manuscript, and all authors contributed to improving the paper. All authors have read and agreed to the published version of the manuscript.
The authors declare that the research was conducted in the absence of any commercial or financial relationships that could be construed as a potential conflict of interest.
All claims expressed in this article are solely those of the authors and do not necessarily represent those of their affiliated organizations, or those of the publisher, the editors, and the reviewers. Any product that may be evaluated in this article, or claim that may be made by its manufacturer, is not guaranteed or endorsed by the publisher.
Celia, M. A., and Binning, P. (1992). A Mass Conservative Numerical Solution for Two-phase Flow in Porous media with Application to Unsaturated Flow. Water Resour. Res.28 (10), 2819–2828. doi:10.1029/92wr01488
Chigira, M. (2014). “Geological and Topographic Detection of Dangerous Slopes on Large Scale Landslides,” in Abstract for the 63th annual meeting of SABO Society. Tokyo, Japan, 2014.
Jitousono, T., Shimokawa, E., and Teramoto, Y. (2006). Potnetial Site Prediction of Deep-Seated Landslide on the Western Flank of Mt. Yahazu-Dake, Izumi City, Kagoshima Prefecture, Japan. J. Jpn. Soc. Erosion Control. Eng.59 (2), 5–12.
Jitousono, T. (2014). Site Prediction of Potential Deep-Seated Landslides by Using Electric Conductivity of Mountain Stream Water. J. Jpn. Soc. Erosion Control. Eng.6 (6), 56–59.
Kirschbaum, D., and Stanley, T. (2018). Satellite-Based Assessment of Rainfall-Triggered Landslide Hazard for Situational Awareness. Earth's Future6, 505–523. doi:10.1002/2017EF000715
Lee, W.-L., Tai, Y.-C., Shieh, C.-L., Miyamoto, K., and Lin, Y.-F. (2019). Hydro-mechanical Response with Respect to the Air Ventilation for Water Filtration in Homogeneous Soil. J. Mt. Sci.16 (11), 2562–2576. doi:10.1007/s11629-019-5643-0
Lin, C. W., Yi, D. C., and Huang, M. L. (2012). Digital Terrain from Airborne LiDAR—An Effective Tool for Seeking Potential Large-Scale Landslides. Geo Topic31, 44–48.
Mantovani, F., Pasuto, A., Silvano, S., and Zannoni, A. (2000). Collecting Data to Define Future hazard Scenarios of the Tessina Landslide. Int. J. Appl. Earth Observation Geoinformation2 (1), 33–40. doi:10.1016/s0303-2434(00)85024-2
Marui, H. (2017). “Mitigation of Natural Hazards in Mountain Watersheds of Japan,” in Ecosystem Services of Headwater Catchments (Cham: Springer), 89–103. doi:10.1007/978-3-319-57946-7_10
Miyamoto, K., and Imaizumi, F. (2012). “A Theoretical Explanation of Triggering Condition of Deep-Seated Landslide,” in Proceedings of 3rd International Workshop on Multimodal Sediment Disasters, A-5, Takayama city, Japan, September, 2012, 1–8.
Ray, R. L., and Jacobs, J. M. (2007). Relationships Among Remotely Sensed Soil Moisture, Precipitation and Landslide Events. Nat. Hazards43, 211–222. doi:10.1007/s11069-006-9095-9
Stanley, T., and Kirschbaum, D. B. (2017). A Heuristic Approach to Global Landslide Susceptibility Mapping. Nat. Hazards87, 145–164. doi:10.1007/s11069-017-2757-y
Trigo, R. M., Zêzere, J. L., Rodrigues, M. L., and Trigo, I. F. (2005). The Influence of the North Atlantic Oscillation on Rainfall Triggering of Landslides Near Lisbon. Nat. Hazards36 (3), 331–354. doi:10.1007/s11069-005-1709-0
Van Asch, T. W. J., Buma, J., and Van Beek, L. P. H. (1999). A View on Some Hydrological Triggering Systems in Landslides. Geomorphology30, 25–32. doi:10.1016/s0169-555x(99)00042-2
Wei, Z.-l., Lü, Q., Sun, H.-y., and Shang, Y.-q. (2019). Estimating the Rainfall Threshold of a Deep-Seated Landslide by Integrating Models for Predicting the Groundwater Level and Stability Analysis of the Slope. Eng. Geology.253, 14–26. doi:10.1016/j.enggeo.2019.02.026
Wei, Z.-l., Wang, D.-f., Sun, H.-y., and Yan, X. (2020). Comparison of a Physical Model and Phenomenological Model to Forecast Groundwater Levels in a Rainfall-Induced Deep-Seated Landslide. J. Hydrol.586, 124894. doi:10.1016/j.jhydrol.2020.124894
Keywords: large-scale landslide, electrical conductivity, surface displacement, rainfall, landslide mechanism
Citation: Tsai YJ, Chen YJ, Weng CH, Syu FT, Hsu K-A and Lee WL (2022) Application of Stream Conductivity to Activity of Potential Large-Scale Landslide. Front. Earth Sci. 10:759556. doi: 10.3389/feart.2022.759556
Received: 16 August 2021; Accepted: 05 January 2022;
Published: 11 February 2022.
Edited by:
Chong Xu, Ministry of Emergency Management, ChinaReviewed by:
Siyuan Ma, China Earthquake Administration, ChinaCopyright © 2022 Tsai, Chen, Weng, Syu, Hsu and Lee. This is an open-access article distributed under the terms of the Creative Commons Attribution License (CC BY). The use, distribution or reproduction in other forums is permitted, provided the original author(s) and the copyright owner(s) are credited and that the original publication in this journal is cited, in accordance with accepted academic practice. No use, distribution or reproduction is permitted which does not comply with these terms.
*Correspondence: Yuan Jung Tsai, cm9uZ3RzYWlAZHByYy5uY2t1LmVkdS50dw==
Disclaimer: All claims expressed in this article are solely those of the authors and do not necessarily represent those of their affiliated organizations, or those of the publisher, the editors and the reviewers. Any product that may be evaluated in this article or claim that may be made by its manufacturer is not guaranteed or endorsed by the publisher.
Research integrity at Frontiers
Learn more about the work of our research integrity team to safeguard the quality of each article we publish.