 Faiz Muttaqy
 Andri Dian Nugraha
 James Mori3
 Pepen Supendi
 Supriyanto Rohadi
- 1Graduate Program of Geophysical Engineering, Faculty of Mining and Petroleum Engineering, Institut Teknologi Bandung, Bandung, Indonesia
- 2Global Geophysics Research Group, Faculty of Mining and Petroleum Engineering, Institut Teknologi Bandung, Bandung, Indonesia
- 3Disaster Prevention Research Institute, Kyoto University, Kyoto, Japan
- 4Agency for Meteorology, Climatology, and Geophysics (BMKG), Jakarta, Indonesia
The Central and East Java region, which is part of the Sunda Arc, has an important role in producing destructive earthquakes and volcanic complexes in Indonesia as a result of the convergence between the Indo-Australian plate that subducts under the Eurasian plate. In this study, the 3-D seismic velocity structure (Vp, Vs, and Vp/Vs) of the crust and upper mantle was determined to reveal the presence of the subducted slab, volcanic sources, and seismogenic features in the Central and East Java region. We have manually re-picked P- and S-arrivals of 1,488 events from January 2009 to September 2017 recorded at 27 stations of the BMKG network. An iterative damped least-squares inversion method was applied to simultaneously calculate both hypocenter relocations and velocity structure beneath this high-risk region to a depth of 200 km. We then compare the tomographic results and seismicity to interpret structural features in the seismic zones. The subducted slab is dipping toward the north, imaged by the high-velocity regions with low Vp/Vs at depths of about 50–100 km. Low-velocity anomalies with high Vp/Vs above the slab at a depth of ∼100 km, imply the possible location of partial melting from slab dehydration. Fluids and melts are ascending to feed the volcanoes i. e., Merapi-Merbabu, Wilis, Pandan, Semeru, Bromo, and Ijen that also have similar low-velocity anomalies at 10–30 km depths, suggesting the presence of the sedimentary basin or magma reservoir. We also have redetermined the hypocenter location of the 2021 (Mw 6.1) Malang earthquake at 8.94oS, 112.45oE, with a depth of 59.7 km. The location error in the x, y, and z directions are 3.08, 6.39, and 11.91 km, respectively. This intraslab event with a thrusting mechanism is located in the high-velocity region and close to the intermediate-depth seismic clusters, which indicates the geometry of the oceanic slab. In the region of 1994 (Mw 7.8) Banyuwangi earthquake, we found a low-velocity anomaly at ∼ 50 km depth that might be associated with the presence of subducting seamount that is more hydrated than the surrounding slab. The slip over this subducting seamount caused the tsunamigenic earthquake.
Introduction
Plate subduction along the Java Trench plays a major role in producing destructive earthquakes and volcanic complexes for the region. Many earthquakes are situated in or around the dipping Wadati-Benioff zone and are extensively caused by crustal faulting. Moreover, the joint effects between heat convection in the mantle wedge and fluids from slab dehydration lead to partial melting beneath the volcanic front, producing arc magmatism and volcanism (Zhao et al., 2012). To locate the subduction slab and estimate the magma plumbing system beneath the region, reliable subsurface information is necessary. Seismic tomography is one geophysical tool that can provide information about the three-dimensional distribution of seismic velocities of the subduction zone. For example, the presence of cold subducted slab and hot magma inclusions in the crust and upper mantle is reflected in the strong contrast of seismic velocities, which have been observed in many subduction zones (e.g., Zhao et al., 1995; Nakajima et al., 2001; Hall and Spakman, 2002; Husen et al., 2003; Reyners et al., 2006; Tsuji et al., 2008; Zhao et al., 2012).
The study area covers the Central and East Java region, which is part of the Sunda Arc, along the subduction zone in southwestern Indonesia, where there is orthogonal subduction of the Indo-Australian plate beneath the Eurasian Plate. The convergence rate was estimated at ∼5.6 cm/yr in the western part of Java and increased to ∼6.5 cm/yr in the east (Koulali et al., 2017). In addition to the subduction zone, several active faults and volcanoes control the seismicity around the study area (Marliyani, 2016; Pusat Studi Gempa Nasional, 2017) (Figure 1). The region has a seismic gap that has not shown significant seismicity between the southern coast of Java and the trench. This region holds the potential for future megathrust events, as Widiyantoro et al. (2020) suggested that the high slip deficit in Central and East Java would produce a Mw 8.8 earthquake with a return period of 400 years. Damaging events in the region include a tsunami earthquake that occurred near Banyuwangi (Mw 7.8) in 1994, caused by a slip over a subducting seamount (Abercrombie et al., 2001). In 2006, a moderate shallow earthquake occurred around Yogyakarta (Mw 6.3) due to the Opak fault activity. Recently, a Mw 6.1 intra-slab earthquake occurred in the south of East Java near Malang on April 10, 2021 with at least 334 houses damaged and seven fatalities, according to the report from National Disaster Management Authority (BNPB), Indonesia (https://www.bnpb.go.id/).
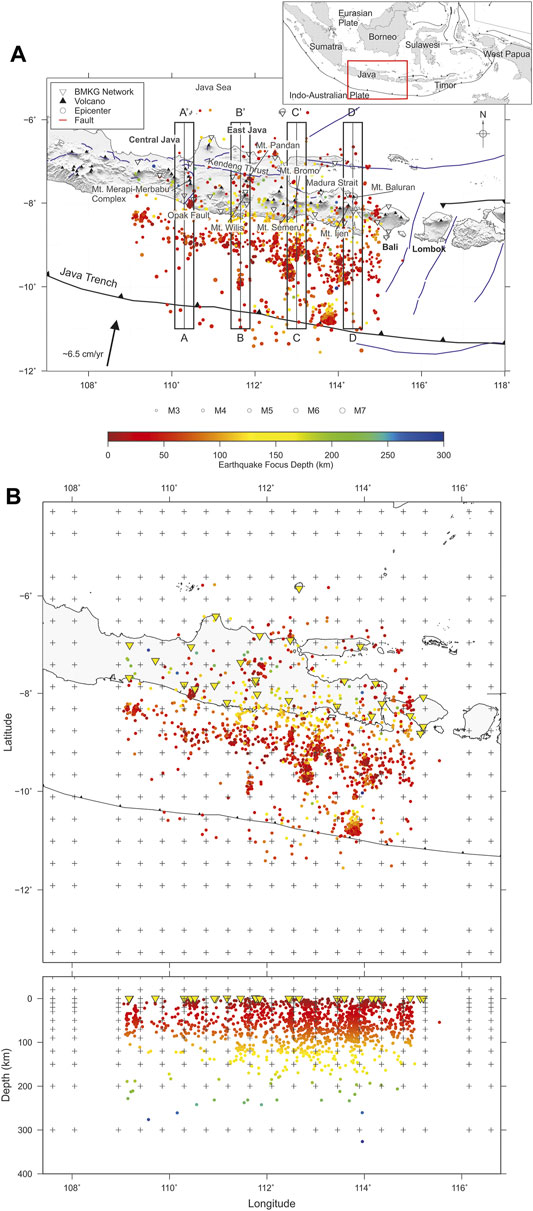
FIGURE 1. (A) Map showing the distribution of 27 BMKG stations (inverted triangles) and seismicity used in this study from January 2009 to September 2017. The rectangles A-D are the area used to plot the vertical cross-section in Figure 3 and Figure 5. (B) Grid node parameterization used for the seismic tomographic inversion (plus signs). The colors of the circles represent earthquake focus depth, active fault lineaments (blue lines) and volcanoes (black triangles) (Marliyani, 2016; Pusat Studi Gempa Nasional (PuSGeN), 2017).
The geological setting includes a basement structure beneath Java dominated by ophiolitic and volcanic arc material that was stranded at the margin of the ancient subduction zone (Sundaland) during the Late Cretaceous (Simandjuntak and Barber, 1996; Smyth et al., 2007). From the middle Eocene to the middle Miocene, the Southern Mountain zone and a large basin called the Kendeng zone were formed along the present subduction zone. In the Eocene-Pliocene, the Rembang zone was formed in the northern part of the island. Subduction ceased in the Cretaceous and started again in the Late Miocene, forming the modern volcanic arc, with mainly strato-volcanoes in central Java (Smyth et al., 2005, 2007, 2008). Monogenetic volcanoes, where the volcanism produces the formation of tens to thousands of edifices can be observed in a few places in Java with maar-type edifices (e.g., Ijen volcanic complex). However, lava dome-type polygenetic volcanoes are more dominated in Java (Marliyani et al., 2020).
Previous seismic tomography studies have been carried out in the Indonesia region, including the seismic velocity distribution beneath Central and East Java on both global (e.g., Hafkenscheid et al., 2001; Hall and Spakman, 2015; Zenonos et al., 2019) and regional scales using teleseismic events (e.g., Fukao et al., 1992; Puspito et al., 1993; Widiyantoro and Van Der Hilst, 1996). They suggested that the Java slab dips steeply at depths of 250–300 km. Both P- and S-wave tomographic models show a gap in the slab between 350–500 km and the absence of intense seismicity. The gap is correlated to a temperature increase, producing the low-velocity anomaly at this depth (Hall and Spakman, 2015; Zenonos et al., 2019). On local scales, previous studies have been used to study small-scale structures of crust and upper mantle i.e., fault zones and volcanism. They observed strong low-velocity anomalies beneath volcanoes in Central Java (Koulakov et al., 2007, 2016; Wagner et al., 2007; Bohm et al., 2013; Luehr et al., 2013; Rohadi et al., 2013; Haberland et al., 2014; Zulfakriza et al., 2014; Ramdhan et al., 2019). They have found an extreme low-velocity anomaly in the crust beneath Merapi and Lawu volcanoes (Merapi-Lawu anomaly (MLA)) with a high Vp/Vs ratio of 1.9. Based on these results, a model of magma supply to volcanoes in Central Java was proposed. The MLA is supposed to be an anomaly related to an area with high content of fluids and melts in the crust (Koulakov et al., 2007).
There are still few tomographic studies in East Java, in particular, models that can resolve the crust and upper mantle structure. One study by Martha et al. (2017) has successfully imaged the shallow structure beneath East Java, using ambient noise tomography (ANT) with both BMKG and portable seismographic networks. The study, which has a resolution depth of 12 km, found low shear wave velocities associated with basins and sedimentary layers, along with high velocities associated with igneous rocks and carbonates. The low-velocity anomalies correlate with the presence of volcanoes and oil/gas fields in East Java. The study results also concluded that the Kendeng basin has a thickness of 8–10 km. Another prominent feature in East Java is a sediment-hosted geothermal system, nicknamed Lusi (Lumpur Sidoarjo), which initially erupted in May 2006. The magma plumbing system feeding the Lusi eruption has been studied, using local earthquake tomography and ANT that resolve the structure to 25 km depth (e.g., Fallahi et al., 2017; Karyono et al., 2020; Lupi et al., 2022). They suggest that magma and fluids are coming from the volcanic complex around the region and migrating through the fault system to the sedimentary basin, promoting Lusi. Extensively, imaging the larger-scale structure may help the understanding of the relationship between subduction and volcanism in the region.
This study aims to determine the 3-D seismic velocity structure (Vp, Vs, and Vp/Vs ratio) of the crust and upper mantle and its relation to geological features around the seismogenic zone and volcanic arc of Central and East Java, Indonesia, which represents a high seismic hazard to the region and has a population of more than 73 million people.
Data and Method
We used P- and S-arrivals determined by Muttaqy et al. (2021–in review) that were manually re-picked from waveforms recorded at 27 stations of the Meteorological, Climatological, Geophysical Agency of Indonesia (BMKG) for earthquakes within the time period of January 2009 to September 2017 using Seisgram2K (Lomax and Michelini, 2009). The earthquake locations were then determined using the NLLoc program (Lomax et al., 2000) with the global velocity model of AK135 (Kennett et al., 1995) for the longitude and latitude ranges of 108o-118oE and 5o-12oS, respectively, with at least six high-quality phase picks and magnitude (Mw) >3. Most of the earthquakes are distributed in the south of the island, which results in a maximum azimuthal gap of greater than 180o with the average hypocenter location errors are 5.6, 15.5 and 20.5 km in the x, y, and z directions, respectively. In total, there are 1,488 initial events with 11,192 P- and 11,192 S-phases which were used for the tomographic inversion (Figure 1 and Supplementary Figure S1). The estimated picking errors for the observed P- and S-arrivals are 0.1886 s and 0.297 s, respectively. This results in better locations compared to the BMKG catalog, which uses Geiger method (Geiger, 1912) with global velocity model IASP91. The BMKG location, which use a fewer number of S-arrivals for quick determination have a fixed-depths of 10 km for the shallow earthquakes and larger residual times. A detailed description of the seismicity analysis for the events has been provided in Muttaqy et al. (2021–in review).
The choice of a particular model parameterization is always essential for assessing the quality of the 3-D tomographic images, considering the recovery of checkerboard resolution tests (CRT) over various grid size models. Several factors need to be considered, such as the size of features that can be resolved, distribution of available events and stations, and the computing limitations (Kissling et al., 2001). In this study, we used a 50 × 50 km2 grid spacing horizontally and various grid spacings of 10–100 km in the vertical direction (Figure 1B). The initial velocity model used in this study was the 1-D seismic velocity model of Central Java (Koulakov et al., 2007) with a constant Vp/Vs ratio of 1.75, based on the plotted Wadati diagram of this study (Supplementary Figure S1).
For the local tomographic inversion, we applied the SIMULPS12 code (Evans et al., 1994), which performs an iterative damped least-squares inversion method to calculate both hypocenter relocation and velocity structure, simultaneously. P-arrival times and S-P times are inverted directly for Vp and Vp/Vs ratio. It is more reliable to invert for Vp and Vp/Vs than Vp and Vs separately when there are fewer high-quality S-arrivals (Eberhart-Phillips, 1986). The procedure starts from determining the calculated arrival times using trial hypocenters, origin times, an initial model of the seismic velocity structure, and the pseudo-bending technique of Um and Thurber (1987) for the ray tracing (Supplementary Figure S2). The residuals between observed and calculated arrival times can be related to perturbations to the velocity structure parameters that are iteratively performed in order to minimize the weighted root-mean-square (RMS) misfit. During the inversion, there are the grid nodes that were both well-sampled and poorly sampled by the rays. Hence, damping regularization is required to stabilize the solution which is determined by comparing data variance with model variance, as shown in the trade-off curves of Supplementary Figure S3 for a series of one-step inversions within a range of damping values (Eberhart-Phillips, 1986). An appropriate damping value of 50 that balances the data and model variance was selected for both Vp and Vp/Vs The earthquakes are relocated at each iteration step using the current determined 3-D velocity model. We used a weighting scheme as a function of residual with the full weight (1.0) for residuals less than 0.15 s, zero-weight (0.0) for residuals greater than 10 s, and an intermediate value of 0.02 for residuals near 1.5 s. The linear tapers are from 0.15 to 1.5 s and 1.5–10 s, so that the high residual data above 10 s will be automatically discarded in early inversion steps. We set the maximum number of iterations up to 20. However, the inversion automatically stopped at the 15th iteration when the convergence and least weighted RMS were achieved. An F-test in SIMULPS is used to provide a stopping criterion, indicating that variance reduction has become insignificant with further iterations.
Results and Discussion
Resolution Tests
The capability of the parameterized model and the distribution of data to resolve the structure beneath the study area can be tested with synthetic data constructed using the same distribution of earthquakes and stations as in our data set. We used several resolution tests, i.e., ray hit count (RHC), derivative weighted sum (DWS) (Toomey and Foulger, 1989), diagonal resolution element matrix (DRE) (Menke, 1989), and checkerboard resolution test (CRT), which is the most common way to examine the resolution of seismic tomography (Supplementary Figure S4 and Supplementary Figure S5). For adjacent grid nodes of the model, we perturbed the velocity by ± 10% relative to the initial 1-D velocity model and then calculated the travel times to the stations for each earthquake location. In order to evaluate the resolution test more appropriately, we added Gaussian noise with a mean of −0.0401 and a standard deviation of 0.6149 s to synthetic data (Supplementary Figure S6 and Supplementary Figure S7). This synthetic data set of travel times was then inverted for the velocity structure using the same number of iterations as the real inversion to examine how well the checkerboard pattern was recovered and is usually consistent with the higher values of DWS, RHC, and DRE.
The CRT results highlight the resolved area within the dashed polygons in Figure 2 and Figure 3 for horizontal and vertical sections, respectively, which show a reasonably good resolution for the study area at depths of 10–90 km. Following most studies that use the checkerboard test, if the inversion results show that one grid/block has the same anomaly (positive or negative) as the input model, even with a reduction in amplitude due to the implementation of damping, we consider that block to be resolved by the data while considering the limitations of CRT (Rawlinson and Spakman, 2016). The similar areas are consistent with relatively high values for DRE, DWS, and RHC. Fairly high resolution is obtained around the slab model 2.0 (Hayes et al., 2018) and the mantle wedge, since many earthquakes are situated in the plate boundary and many seismic rays travel to the stations onshore, providing a relatively high density of seismic rays around given nodes beneath the region. Below 150 km, the resolution becomes smeared due to sparse many deep earthquakes.
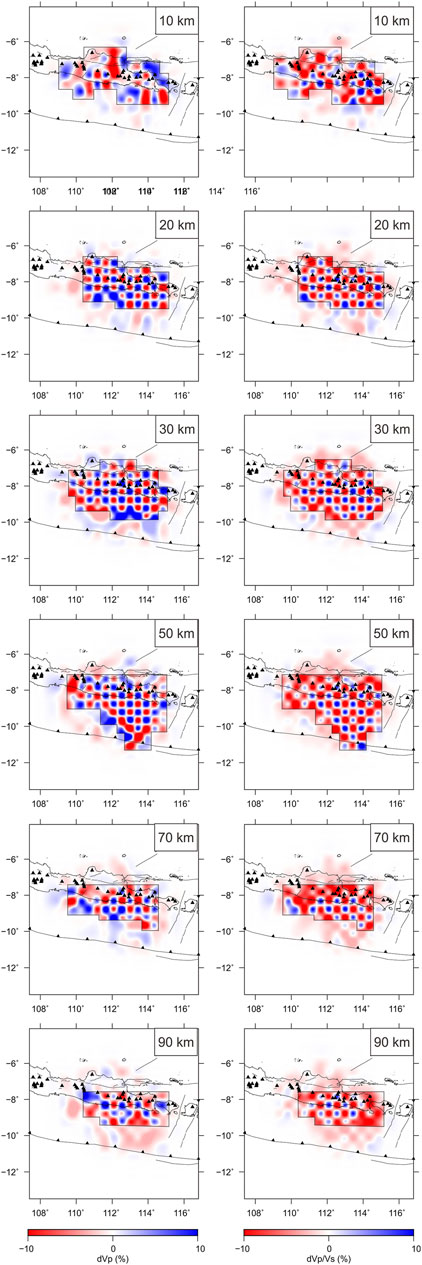
FIGURE 2. Results of checkerboard resolution test for Vp and Vp/Vs ratio at depths of 10–90 km beneath the study area. Blue and red colors represent positive and negative perturbations relative to the initial model, respectively. Dashed polygons are the area recovered by this study. Red lines and triangles indicate the fault and volcano distribution, respectively.
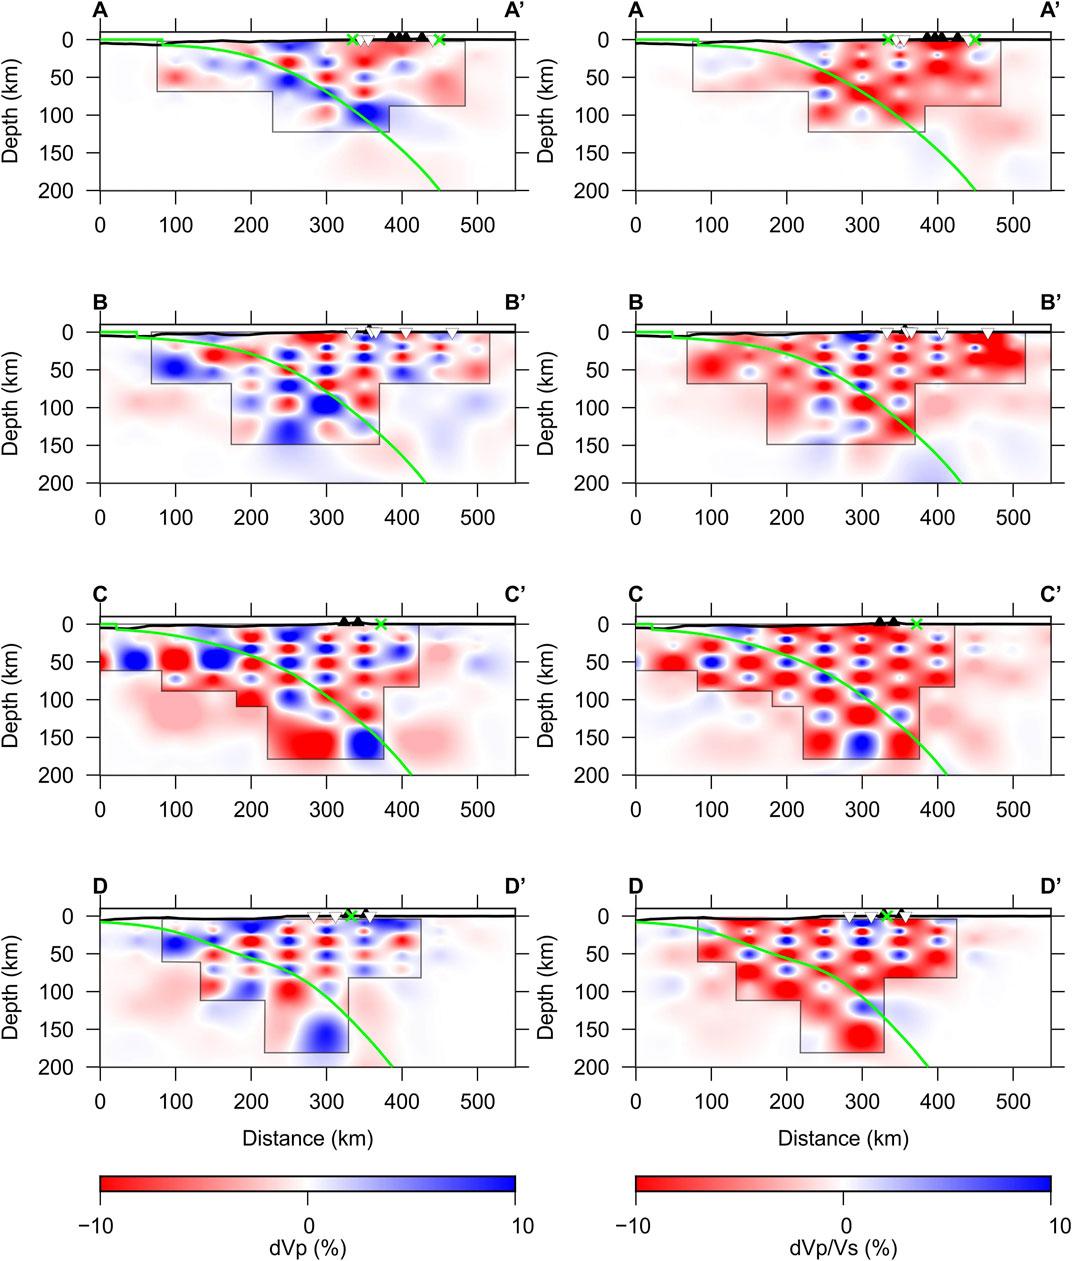
FIGURE 3. Results of checkerboard resolution test for Vp and Vp/Vs ratio in vertical direction across Mt. Merapi-Merbabu (A-A′), Mt. Wilis-Pandan (B-B′), Mt. Semeru-Bromo (C-C′), and Mt. Ijen-Baluran (D-D′). Green lines and crosses indicate the slab 2.0 model (Hayes et al., 2018) and faults, respectively. Black triangles show locations of volcanoes.
Vp, Vs and Vp/Vs Models
After the 15th iteration, the tomographic inversion was automatically stopped to update the velocity model and relocate the seismicity when the convergence and least weighted RMS had been reached (Supplementary Figure S8). It leads to a total weighted RMS reduction from 0.73022 to 0.32071 s with the P- and S-P data variances of 0.1483 and 0.0032 s2, respectively. Maps of seismicity distribution before and after relocation are shown in Supplementary Figure S9 and Supplementary Figure S10 in the Supplementary Material, showing that the relocated seismicity distribution is more clustered and statistically improved compared to the initial locations. The RMS residuals are mostly below 0.5 s with an average value of 0.216 s (Supplementary Figure S11A). In addition, the travel time residuals associated with the initial and final model are represented as histograms in Supplementary Figure S11B, in which most of the value of travel time residuals are in the range of ±0.75 s.
The final tomographic images of Vp and Vs (Figure 4 and Figure 5) are shown as percent perturbations relative to the initial 1-D seismic velocity model of Central Java (Koulakov et al., 2007). The blue and red colors represent high and low-velocity changes, respectively. The Vp/Vs values are shown in absolute values (Figure 4 and Figure 5). The Vp/Vs ratio is related to Poisson’s ratio, a physical property of elastic materials. Distributions of Vp/Vs values indirectly correspond to the variations of pressure, presence of fluid, strength, and temperature (Christensen, 1996; Jo and Hong, 2013; Lin et al., 2016). For this reason, the Vp/Vs ratio has been widely used to infer structural properties of subducting slabs such as the presence of partial melts or fluid-saturated medium (e.g., Nakajima et al., 2001; Zhang et al., 2004; Eberhart-Phillips et al., 2005; Nugraha and Mori 2006; Reyners et al., 2006; Koulakov et al., 2007; Tsuji et al., 2008; Rohadi et al., 2013; Rosalia et al., 2019). Based on the results of the resolution tests (Figure 2 and Figure 3, Supplementary Figure S4 and Supplementary Figure S5), the regions where the results are considered well constrained are within the dashed polygons.
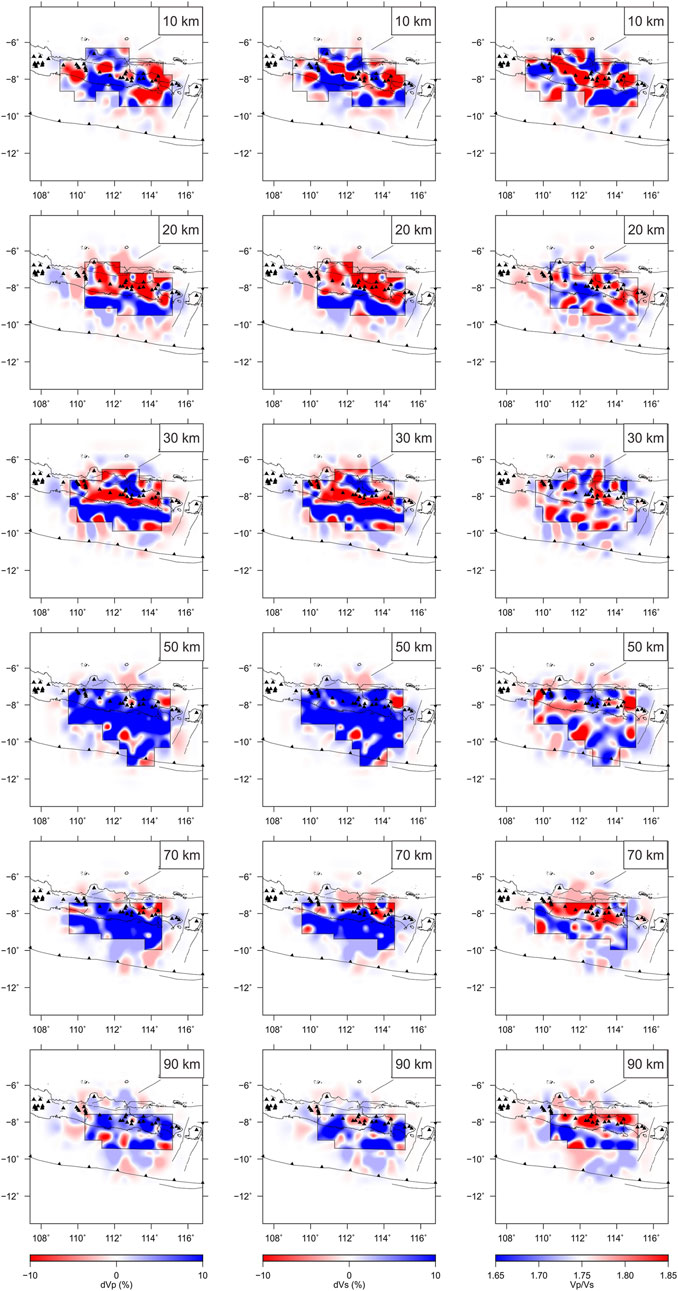
FIGURE 4. Horizontal sections for Vp, Vs, and Vp/Vs ratio resulting from tomographic inversions at depths 10–90 km. Dashed polygons are the areas with reliable velocity structure results in this study. Red lines and triangles indicate the faults and volcanoes, respectively.
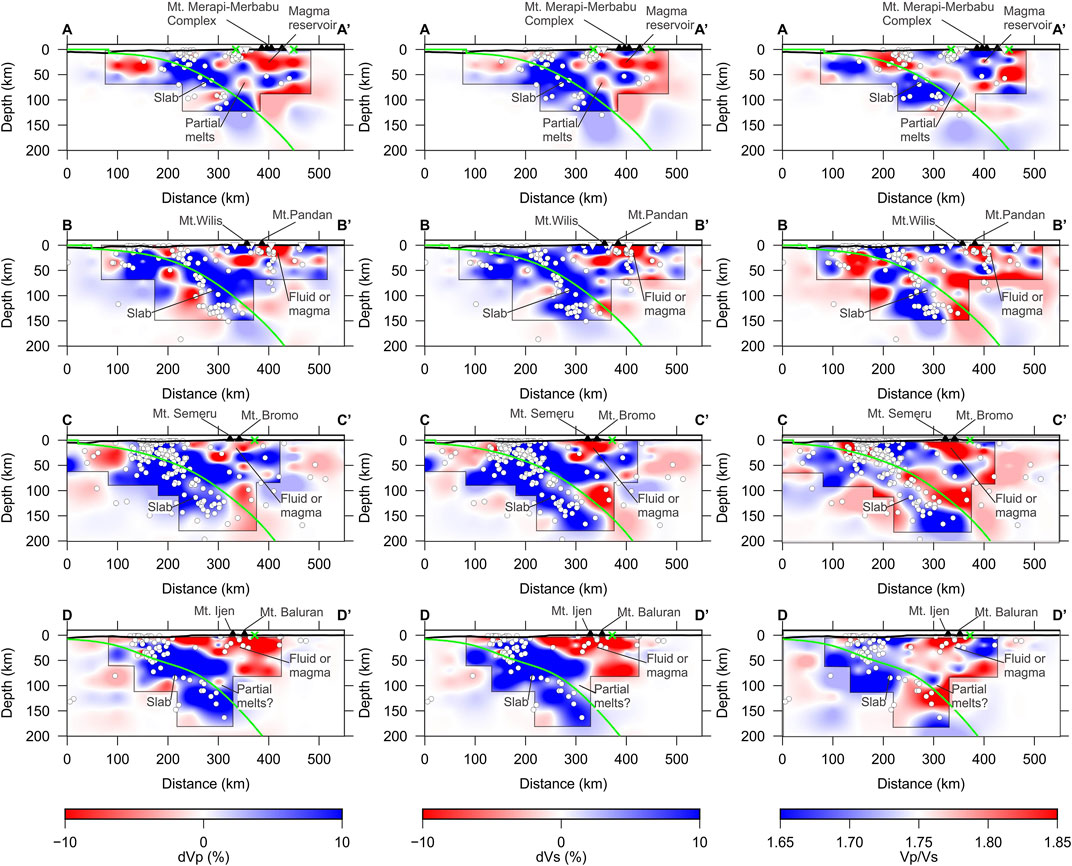
FIGURE 5. Vertical sections for Vp, Vs and Vp/Vs ratio with relocated seismicity across Mt. Merapi-Merbabu (A-A′), Mt. Wilis-Pandan (B-B′), Mt. Semeru-Bromo (C-C′), and Mt. Ijen-Baluran (D-D′). Green lines and crosses indicate the slab 2.0 model (Hayes et al., 2018) and faults, respectively. Black triangles show locations of volcanoes.
The horizontal sections of the tomographic results are shown from the depth of 10–90 km (Figure 4). The map of Bouguer gravity anomaly in Figure 6A shows correlated features, which is taken from Center for Geological Survey (PSG) (https://geology.esdm.go.id/). In general, we observed that the low velocities (Vp and Vs) dominate around the volcanic complex of the study area which may reflect some features such as sediments or magmatism beneath the volcanoes (Nakajima et al., 2001; Zhao, 2015). These strong low-velocity anomalies can be observed from the depth of 10–30 km beneath Mt. Lawu, Mt. Wilis, and Malang volcanic complex; and from 20 to 30 km beneath Mt. Merapi-Merbabu complex and Mt. Ijen-Baluran. The estimated Vp/Vs ratio for these regions is also relatively high (>1.75), suggesting the presence of fluids or partial melts in the sedimentary layer of the Kendeng basin. It correlates with the location of the strong negative Bouguer gravity anomaly of more than −75 mGal, which is at least 400 km long, parallel to the mainland (Figure 6A) (Smyth et al., 2005, 2008; Waltham et al., 2008) and previous tomographic studies which also confirmed the low-velocity anomaly area beneath Mt. Merapi-Lawu in Central Java with a high Vp/Vs ratio of 1.9 (Koulakov et al., 2007; Wagner et al., 2007; Rohadi et al., 2013; Zulfakriza et al., 2014).
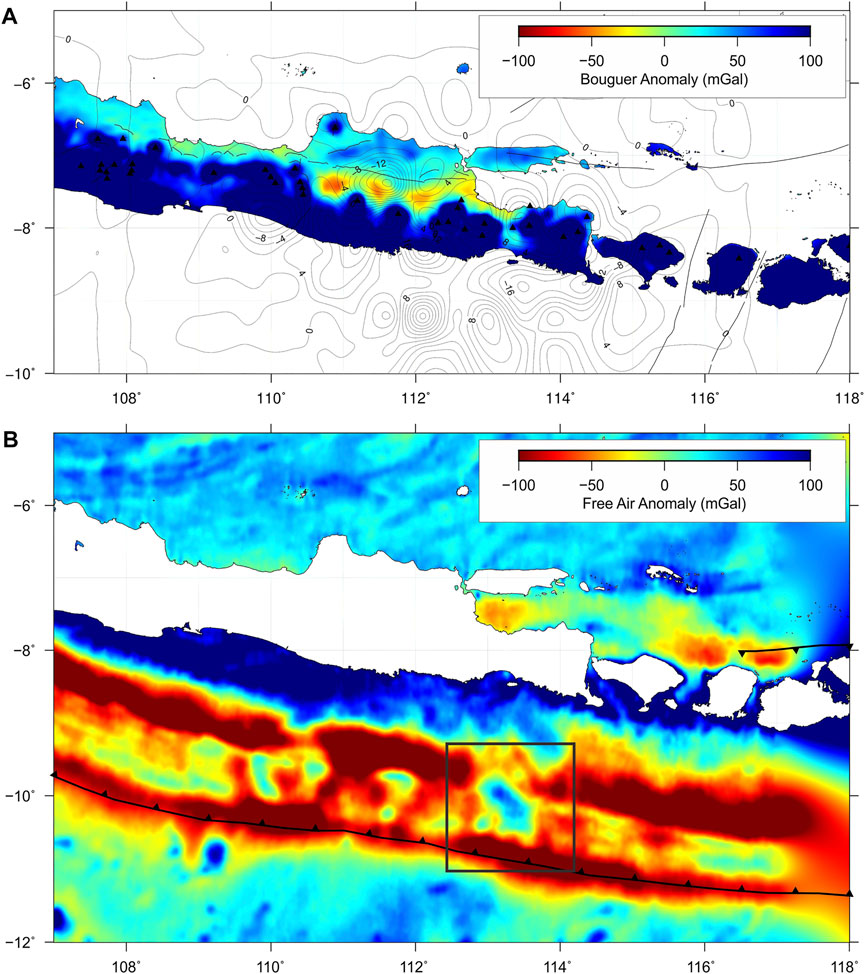
FIGURE 6. (A) Map of Bouguer gravity anomaly Center for Geological Survey (PSG) overlayed by Vp perturbation at 10 km depth (black contour) and (B) marine free-air gravity anomaly (Sandwell et al., 2014) in Central and East Java region. Black lines indicate faults and trench delineation. Black triangles are the volcanoes. Inset shows the location of subducted seamount.
Meanwhile, the high-velocity anomalies (Vp and Vs) are considerably found at a depth of 10 km in the southern and northern part of the island, which are associated with the positive Bouguer gravity anomaly of the Southern Mountains zone and Rembang zone, respectively (Smyth et al., 2005, 2008; Waltham et al., 2008). It is also consistent with low Vs anomaly in the northern and high-Vs anomaly in southern Java, as indicated by ambient noise tomography (Martha et al., 2017). From 20 to 30 km, we observe the high-velocity anomaly in southern Java that probably corresponds to the rigid forearc, and below 50 km, is associated with the oceanic lithosphere that is subducted toward the north.
We present vertical cross-sections through several areas across the Central and East Java region (Figure 5) to look at the vertical distribution of velocities with the overlayed seismicity. The locations of the vertical sections are shown in Figure 1. The presence of the subducted slab is recognizable, dipping toward the north at depths of about 50–100 km, by the high-velocity areas with a low Vp/Vs ratio (e.g., Zhang et al., 2004; Reyners et al., 2006) and is consistent with the delineation of slab model 2.0 (Hayes et al., 2018). The earthquakes are also located in this area with high Vp and Vs to a depth of 150 km along with the slab. The region below 150 km depth is not well-resolved in our model. According to the tomograms, seismicity, and slab model, the dip of the subducted slab is increasing with depth toward the north, as suggested by previous studies (Fukao et al., 1992; Koulakov et al., 2007; Zenonos et al., 2019). However, the thickness and geometry of the slab are hard to estimate precisely from tomographic images. Fine structures of the subduction slab can be further studied by a dense seismic network, in particular, the ocean-bottom-seismometer (OBS) network (Zhao, 2015). Meanwhile, low-velocity zones above the top limit of the subducted slab are likely to be found at ∼100 km depth as the possible location of partial melting zones. Thermal models of the Java subduction zone also estimate the transition depths (from the decoupling to coupling between the slab and the overriding mantle) of about 80–155 km with the maximum temperature at the transition zone and the mantle wedge beneath the volcanic arc up to 693 and 1,458°C, respectively (Syracuse et al., 2010). In such areas, the high-fluid and thermal conditions are probably responsible for this anomaly—the water released from marine sediments and the oceanic crust of the subducted slab before the downgoing slab reaches beneath the volcanic arc. Fluids from this slab dehydration and temperature increase in the mantle wedge due to the heat convection from the deeper part of structure, lead to partial melting. Thus, seismic velocity is significantly lower relative to surrounding dry areas (Syracuse et al., 2010; Zhao, 2015; Tonegawa et al., 2017).
As previously mentioned, low-velocity anomalies with high Vp/Vs ratio are observed beneath the volcanic complexes, especially seen in the vertical sections. In Figure 5A, where the vertical section A-A’ slices the Mt. Merapi-Merbabu complex, we see low-velocities (Vp and Vs) at a depth of 20 km. It is probably associated with the magmatism beneath Mt. Merapi or Kendeng sedimentary basin, as also represented by previous local tomographic studies in the same area (Koulakov et al., 2007; Wagner et al., 2007; Luehr et al., 2013; Ramdhan et al., 2019). Mt. Merapi is one of the most active volcanoes in the world, with an eruption cycle of two to 6 years and large eruptions occur every 50–100 years (Luehr et al., 2013; Ramdhan et al., 2019). Ramdhan et al. (2019) has imaged the internal structures of Mt. Merapi and determined two anomalies that are interpreted as shallow and intermediate magma bodies at depths of 5 and 15 km, respectively. The presence of these two magma bodies cannot be distinguished by the resolution of our tomography. However, our velocity models may depict the partial melting zone at a depth of ∼100 km, indicated by low-Vp and Vs The ascending fluids and melts migrate upward from the slab and concentrate beneath the volcanic front, supplying magma to the active volcanoes. Koulakov et al. (2007), Wagner et al. (2007), and Luehr et al. (2013) also highlight the prominent feature of Merapi-Lawu anomaly (MLA), as the strong low-velocity anomaly situated close to the Mt. Merapi and extendings to Mt. Lawu in the east. They discuss the origin of the MLA feature that is partly caused by thick lava and sedimentary deposits in the Kendeng basin which correlates with a negative gravity anomaly.
In the central part of the study area, Figure 5B shows vertical section B-B’ through Mt. Wilis-Pandan. A low-Vp and Vs anomaly with a high Vp/Vs ratio down to a depth 30 km beneath Mt. Pandan is probably associated with a location of magma, and its movement toward the surface can be related to the earthquake clusters. Mt. Pandan is defined as a dormant volcano north of Mt. Wilis and close to the Kendeng thrust fault. Mt. Pandan is not listed as an active volcano, and it is unclear whether the local earthquakes are associated with the Kendeng thrust activity or magmatic activity. A gravity survey has been conducted to delineate the internal structure of Mt. Pandan and link it to the earthquakes sequence around the region (Santoso et al., 2018). The map of Bouguer anomalies shows low-density value beneath Mt. Pandan that may be related to a weak zone, hot materials, or magma source. Santoso et al. (2018) suggested that the subduction process triggers the fault movement and, at the same time, triggers the ascending magma to the surface.
In the eastern part of the study area, the volcanoes are distributed relatively close to each other. Most of the volcanic areas show features of low velocities that are interpreted to be regions of fluids and magma. In Figure 5C, section C-C′ slices through Mt. Semeru-Bromo. Low-velocity anomalies with high Vp/Vs are observed at ∼ 50 km depth beneath the volcanoes. Section D-D’ in Figure 5D, which passes through Mt. Ijen-Baluran in the easternmost Java, shows a low-velocity anomaly with a high Vp/Vs ratio from ∼50 km depth beneath the volcano, and the wedge also appears to be associated with a low Vp/Vs ratio. The interaction between the volcanic and sedimentary domains is concentrated at the surface in East Java, producing sediment-hosted geothermal system and clastic-dominated geyser-like eruption (nicknamed Lusi-Lumpur Sidoarjo) (Fallahi et al., 2017; Lupi et al., 2022). The plumbing system that feeds Lusi has been proposed by several tomographic studies in the region (e.g., Fallahi et al., 2017; Karyono et al., 2020; Lupi et al., 2022), suggesting that the magmatic system of Lusi connects to the surrounding volcanoes (Mt. Penanggungan and Mt. Arjuno-Welirang complex. The plate subduction promotes the formation of thrust faults below the volcanic arc. Magma and fluids originating from volcanic complex migrate through the weakened rocks along the fault system to the sedimentary basin, manifesting in the sediment-hosted geothermal system of Lusi. Furthermore, our results depict the partial melts feature at ∼ 100 km depth above the slab that is indicated by a low-velocity anomaly with a high Vp/Vs ratio. The partial melting is promoted by joint effects between heat convection in the mantle wedge and fluids from slab dehydration beneath the volcanic arc, producing magmatism in the region (Zhao et al., 2012).
Based on the Vp models, we present the interpretative cross-sections in Figure 7 for the Central and East Java region. As the oceanic Indo-Australia plate moves northward and subducts beneath the Eurasian plate, partial melting occurs at a depth of about 100 km. Fluids and melts are ascending to the surface and feeding the volcanoes located above the low-velocity anomalies. We realize that our tomographic results might have limitations in producing smooth images. Some features can be observed in certain sections while not seen in other sections. We expect that the main factor is the limitation of the ray coverage. The station distribution used in this study is relatively sparse, and path distribution can also be highly heterogeneous. Model parameterization with an irregular grid may be adapted to improve the stability of inversion and extractions of structural information beneath Central and East Java in further studies, as described by Rawlinson et al. (2014).
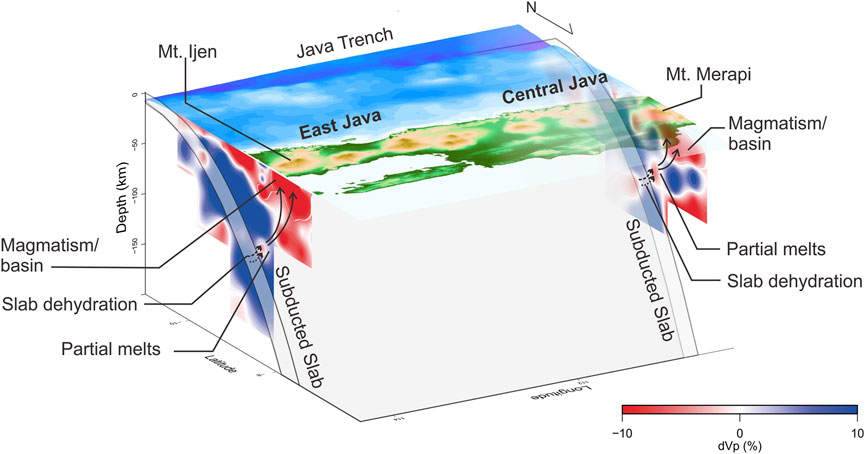
FIGURE 7. Interpretative cross-sections of the velocity structure from Vp beneath Central and East Java subduction zone. The tomography cross sections show Vp distributions which pass through Mt. Merapi-Merbabu and Mt. Ijen.
The Relationship to Recent Large Earthquakes
Inland faults contribute to the potential seismic hazard in the region since they have been recognized as active structures based on geological and geodetic studies (Marliyani, 2016; Pusat Studi Gempa Nasional, 2017), but some faults do not show a significant rate of recent seismicity. On the other hand, we observed shallow clustered earthquakes near the Opak fault, Central Java region. The activity of Opak fault is considered to be the cause of the 2006 Yogyakarta earthquake (Mw 6.3), with latitude, longitude, and depth of 8.04oS, 110.36oE, 15 km, respectively (International Seismological Centre, 2021) (http://www.isc.ac.uk/). The focal mechanism from the Global Centroid Moment Tensor (GCMT) (https://www.globalcmt.org/) (Dziewonski et al., 1981; Ekström et al., 2012) shows a strike-slip faulting mechanism with strike in the NE-SW direction. Figure 8B represents a vertical section of the tomographic model across the fault, along with the clustered earthquakes in the period of our observation, with depths less than 20 km. These earthquakes are located in the contrast of seismic velocities, reflecting the existence of different types of lithology. It is consistent with previous tomographic studies (e.g., Rohadi et al., 2013; Ramdhan et al., 2017; Diambama et al., 2019), and they suggested that low-velocity anomaly is associated with carbonates or other sedimentary rocks that overly the Oligo-Miocene volcanic deposits characterized by the high-velocity. However, we need to conduct a higher resolution of tomography in order to better image small-scale anomalies around the fault. Thi can be achieved by increasing the density of ray path coverage between the local earthquake and seismic stations and grid nodes refinement. At least, we can infer from our results that the geometry of Opak fault is dipping to the east, which supports the previous result of Tsuji et al. (2009) and Diambama et al. (2019).
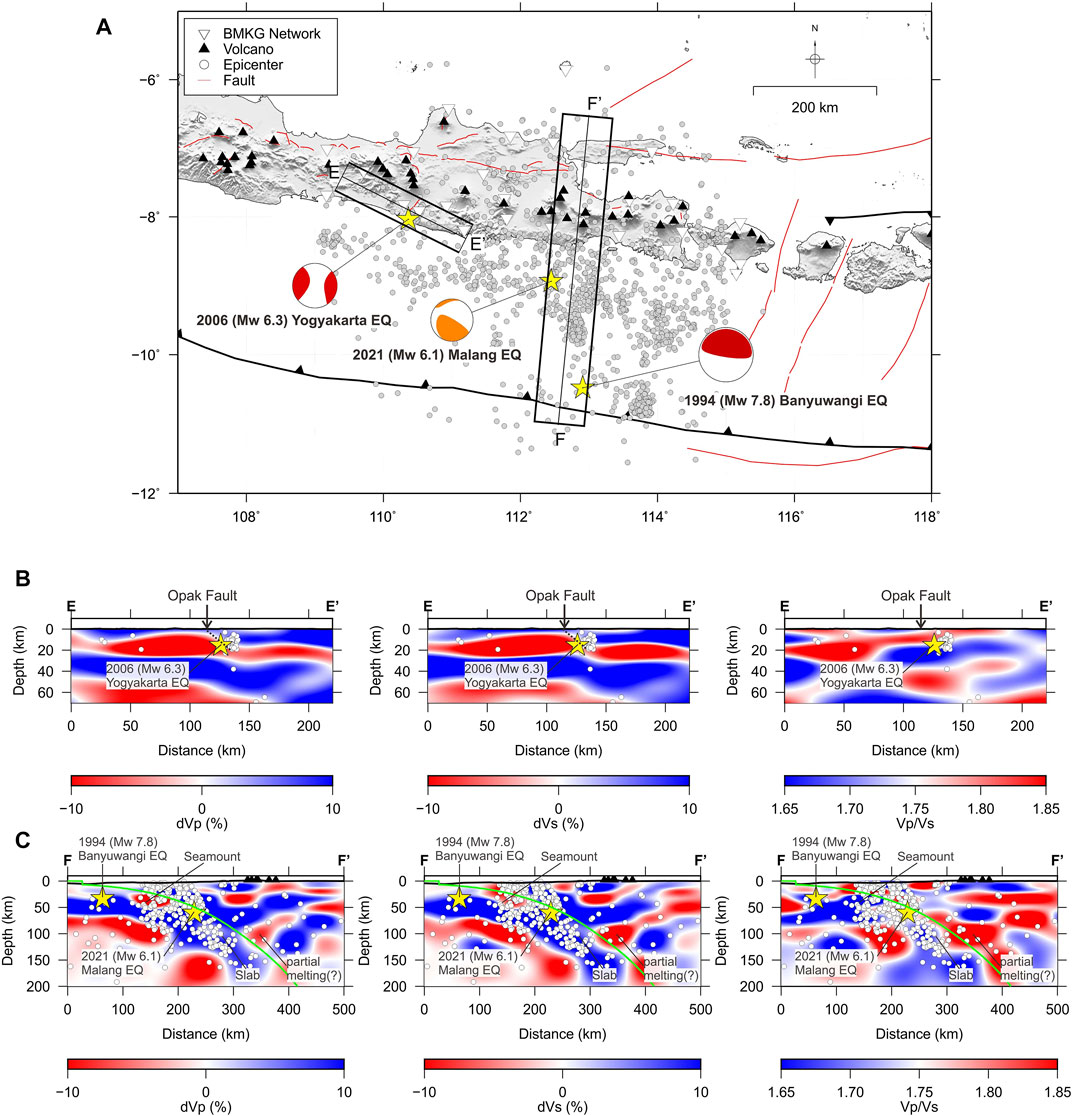
FIGURE 8. (A) Map of the large earthquake epicenters (yellow stars) and the seismicity (gray circles) used in this study. Focal mechanism solutions are taken from GCMT ((https://www.globalcmt.org/) The rectangles E and F are the area used to plot the vertical cross-section in Figure 8B, Figure 8C. Two bottom figures are vertical sections for Vp, Vs, and Vp/Vs ratio with relocated seismicity across (B) the 2006 Yogyakarta earthquake (Mw 6.3) (E-E′), (C) the 1994 Banyuwangi earthquake (Mw 7.8) and the 2021 Malang earthquake (F-F′). Green lines indicate the slab 2.0 model (Hayes et al., 2018). Black triangles show locations of volcanoes.
The recent study of Widiyantoro et al. (2020) has revealed the seismic gaps south of Java, one of which is in the Central and East Java region. The lack of recent megathrust events may indicate great tsunamigenic earthquakes (Mw8.8) can be possible with return periods of about 400 years. The latest tsunami earthquake in the region is the 1994 Banyuwangi earthquake (Mw 7.8), with the latitude, longitude, and depth of 10.48oS, 112.91oE, 32.1 km, respectively (International Seismological Centre, 2021). A thrusting fault mechanism is indicated for the mainshock (Dziewonski et al., 1981; Ekström et al., 2012) (https://www.globalcmt.org/), but the aftershocks are dominated by normal faulting (Abercrombie et al., 2001). They interpreted the observations as a mainshock that slipped over a subducted seamount, which produced normal faulting aftershocks at the outer rise of the Indo-Australian plate.
On April 10, 2021, a Mw 6.1 earthquake occurred near Malang, East Java, without triggering a tsunami for the coastal area of southern Java. However, the event produced strong shaking with MMI V in the East Java area, according to the shakemap reported by BMKG, causing building damage and fatalities (http://shakemap.bmkg.go.id/). The preliminary report of the hypocenter location is at 8.84oS, 112.47oE with a depth of 86 km (http://repogempa.bmkg.go.id/) with a thrust fault mechanism. To better constrain the event location, we have manually re-picked the mainshock arrivals from 19 stations (Supplementary Figure S7 and Supplementary Figure S8) and determined the hypocenter by applying a non-linear method (Lomax et al., 2000). We plotted the wadati diagram to see the linearity between the phases and obtained a Vp/Vs ratio of 1.75 (Supplementary Figure S9). Finally, we have updated the hypocenter location of the 2021 Malang earthquake (Mw 6.1) at 8.94oS, 112.45oE with a depth of 59.7 km and included the result on our tomographic models. The hypocentral errors for the event are 3.08, 6.39, and 11.91 km in x, y and z directions, respectively.
Figure 8C shows the vertical section of the velocity model across the 1994 and 2021 events. Both events are located on the high-velocity region associated with the geometry of the oceanic slab that steepens towards the north. Seismic clusters of our data period are also located relatively close to the 2021 event and provide the location of the rupture area in this region. Any ground shaking caused by large magnitude earthquakes will be a threat to the population of Java, although without triggering a tsunami. Meanwhile, the area near the 1994 event lacks thrust events since it is the location of the seismic gap. At ∼ 50 km depth, a low-velocity anomaly exists at the boundary of the subducted slab with a ∼50 km width and extends to the depth of ∼25 km. This feature may exhibit the presence of subducted seamount that were previously acknowledged by Abercrombie et al. (2001). Seamounts off Java have been initially recognized in early side-scan sonar along the eastern Java Trench (Masson et al., 1990) and revisited by multichannel seismic reflection profiles and multibeam bathymetric data (Kopp et al., 2006; Kopp, 2011; Xia et al., 2021). Some of these seamounts are currently being subducted and causing uplift of the forearc to the shallower water depth (Supplementary Figure S16). In the area of 1994 earthquake, a large subducting seamount modulates the seafloor bathymetry (Xia et al., 2021) and is manifested in the isolated free-air gravity anomaly close to the trench (Sandwell et al., 2014) (black square in Figure 6B). Based on these observations, Xia et al. (2021) suggest that the seamount has a height of ∼2 km and a possible width of ∼40–60 km. However, our resolution with grid spacings of 50 and 10 km in lateral and vertical variations, respectively, does not allow us to estimate the true dimension of this subducted seamount. Similar features of subducting seamounts indicated by low-V zones are also observed in the Pacific slab beneath Kanto, Japan with a ∼30 km width (Nakajima and Hasegawa, 2006) and Cocos slab beneath Costa Rica at 30 km depth (Husen et al., 2003; Dinc et al., 2010) and are associated with more hydrated regions compared to the surrounding slab. A possible location of partial melting is observed at a depth of 100 km, indicated by a low-velocity anomaly with a high Vp/Vs ratio. Fluids from slab dehydration and the temperature increase in the mantle wedge promote the partial melting in the area. The fluids/melts then ascend from the mantle wedge to feed volcanoes at the surface.
Conclusion
We have produced tomographic images of Vp, Vs, and Vp/Vs ratio beneath the Central and East Java region. Along with the relocated seismicity, we discuss the relationship between the earthquakes, subduction process and volcanism. In general, low-velocity features with relatively high Vp/Vs ratio dominate around the volcanic complexes, which probably correspond to the presence of fluid material and possible partial melting in the upper mantle which ascends from a depth of about 100 km. Shallow low-velocity features with low Vp/Vs ratio are probably associated with sedimentary deposits, such as the Kendeng basin. The subducted slab is revealed by high-velocity features with low Vp/Vs ratio at 50–100 km depths. The dip of the subducted slab is increasing with depth toward the north.
The 2006 (Mw 6.3) Yogyakarta earthquake is located on the structural discontinuity as indicated by the contrast between high-low velocity around the source region. We also have redetermined the hypocenter location of the 2021 (Mw 6.1) Malang earthquake at 8.94oS, 112.45oE, with a depth of 59.7 km. The 2021 event, along with the 1994 (Mw 7.8) Banyuwangi earthquake, are located in the high-velocity region and close to the seismic clusters, which reflects the geometry of the oceanic slab. A low-velocity anomaly at ∼ 50 km depth is associated with the presence of a subducting seamount that is likely more hydrated than the surrounding slab.
Data Availability Statement
The original contributions presented in the study are included in the article/Supplementary Material, further inquiries can be directed to the corresponding authors.
Author Contributions
FM, AN, JM, and NP conceived the study; FM, AN, JM, and PS contributed to the writing of the manuscript. All authors contributed to the preparation of the manuscript. All authors have read and approved the final manuscript.
Funding
This study was supported by the PMDSU 2017 scholarship from the Directorate General of Higher Education of Kemdikbud RI awarded to FM, Penelitian Dasar Unggulan Perguruan Tinggi from the Directorate General of Higher Education of Kemdikbud RI with contract number 2/AMD/E1/KP.PTNBH/2020, and Research Program from Lembaga Penelitian dan Pengembangan, Institut Teknologi Bandung (LPPM-ITB) awarded to NTP, and World Class Reseach 2021-2022 Kemristek/BRIN awarded to ADN.
Conflict of Interest
The authors declare that the research was conducted in the absence of any commercial or financial relationships that could be construed as a potential conflict of interest.
Publisher’s Note
All claims expressed in this article are solely those of the authors and do not necessarily represent those of their affiliated organizations, or those of the publisher, the editors, and the reviewers. Any product that may be evaluated in this article, or claim that may be made by its manufacturer, is not guaranteed or endorsed by the publisher.
Acknowledgments
We are grateful to the Agency for Meteorology, Climatology, and Geophysics (BMKG) Indonesia, as the provider of waveform and catalog data. All figures in this study were made by using the Generic Mapping Tools developed by Paul Wessel and Walter H.F. Smith.
Supplementary Material
The Supplementary Material for this article can be found online at: https://www.frontiersin.org/articles/10.3389/feart.2022.756806/full#supplementary-material
References
Abercrombie, R. E., Antolik, M., Felzer, K., and Ekström, G. (2001). The 1994 Java Tsunami Earthquake: Slip over a Subducting Seamount. J. Geophys. Res. 106, 6595–6607. doi:10.1029/2000JB900403
Bohm, M., Haberland, C., and Asch, G. (2013). Imaging Fluid-Related Subduction Processes beneath Central Java (Indonesia) Using Seismic Attenuation Tomography. Tectonophysics 590, 175–188. doi:10.1016/J.TECTO.2013.01.021
Christensen, N. I. (1996). Poisson's Ratio and Crustal Seismology. J. Geophys. Res. 101, 3139–3156. doi:10.1029/95jb03446
Diambama, A. D., Anggraini, A., Nukman, M., Lühr, B.-G., and Suryanto, W. (2019). Velocity Structure of the Earthquake Zone of the M6.3 Yogyakarta Earthquake 2006 from a Seismic Tomography Study. Geophys. J. Int. 216, 439–452. doi:10.1093/gji/ggy430
Dinc, A. N., Koulakov, I., Thorwart, M., Rabbel, W., Flueh, E. R., Arroyo, I., et al. (2010). Local Earthquake Tomography of central Costa Rica: Transition from Seamount to ridge Subduction. Geophys. J. Int. 183, 286–302. doi:10.1111/j.1365-246X.2010.04717.x
Dziewonski, A. M., Chou, T.-A., and Woodhouse, J. H. (1981). Determination of Earthquake Source Parameters from Waveform Data for Studies of Global and Regional Seismicity. J. Geophys. Res. 86, 2825–2852. doi:10.1029/JB086iB04p02825
Eberhart-Phillips, D., Reyners, M., Chadwick, M., and Chiu, J.-M. (2005). Crustal Heterogeneity and Subduction Processes: 3-DVp, Vp/VsandQin the Southern North Island, New Zealand. Geophys. J. Int. 162, 270–288. doi:10.1111/j.1365-246X.2005.02530.x
Eberhart-Phillips, D. (1986). Three-dimensional Velocity Structure in Northern California Coast Ranges from Inversion of Local Earthquake Arrival Times. Bull. Seismological Soc. America 76, 1025–1052. doi:10.1785/bssa0760030627
Ekström, G., Nettles, M., and Dziewoński, A. M. (2012). The Global CMT Project 2004-2010: Centroid-Moment Tensors for 13,017 Earthquakes. Phys. Earth Planet. Interiors 200-201, 1–9. doi:10.1016/j.pepi.2012.04.002
Evans, J. R., Eberhart-Phillips, D., and Thurber, C. H. (1994). User’s Manual for SIMULPS 12 for Imaging Vp and Vp/Vs: A Derivative of the Thurber Tomographic in Version SIMUL3 for Local Earthquakes and Explosion. Open File Rep.. U.S. Geological Survey, 94–431. doi:10.3133/ofr94431
Fallahi, M. J., Obermann, A., Lupi, M., Karyono, K., and Mazzini, A. (2017). The Plumbing System Feeding the Lusi Eruption Revealed by Ambient Noise Tomography. J. Geophys. Res. Solid Earth 122, 8200–8213. doi:10.1002/2017JB014592
Fukao, Y., Obayashi, M., Inoue, H., and Nenbai, M. (1992). Subducting Slabs Stagnant in the Mantle Transition Zone. J. Geophys. Res. 97, 4809–4822. doi:10.1029/91JB02749
Geiger, L. (1912). Probability Method for the Determination of Earthquake Epicenters from the Arrival Time Only. Bull. St. Louis Univ. 8, 60–71.
Haberland, C., Bohm, M., and Asch, G. (2014). Accretionary Nature of the Crust of Central and East Java (Indonesia) Revealed by Local Earthquake Travel-Time Tomography. J. Asian Earth Sci. 96, 287–295. doi:10.1016/J.JSEAES.2014.09.019
Hafkenscheid, E., Buiter, S. J. H., Wortel, M. J. R., Spakman, W., and Bijwaard, H. (2001). Modelling the Seismic Velocity Structure beneath Indonesia: A Comparison with Tomography. Tectonophysics 333, 35–46. doi:10.1016/S0040-1951(00)00265-1
Hall, R., and Spakman, W. (2015). Mantle Structure and Tectonic History of SE Asia. Tectonophysics 658, 14–45. doi:10.1016/J.TECTO.2015.07.003
Hall, R., and Spakman, W. (2002). Subducted Slabs beneath the Eastern Indonesia-Tonga Region: Insights from Tomography. Earth Planet. Sci. Lett. 201, 321–336. doi:10.1016/s0012-821x(02)00705-7
Hayes, G. P., Moore, G. L., Portner, D. E., Hearne, M., Flamme, H., Furtney, M., et al. (2018). Slab2, a Comprehensive Subduction Zone Geometry Model. Science 362, 58–61. doi:10.1126/science.aat4723
Husen, S., Quintero, R., Kissling, E., and Hacker, B. (2003). Subduction-zone Structure and Magmatic Processes beneath Costa Rica Constrained by Local Earthquake Tomography and Petrological Modelling. Geophys. J. Int. 155, 11–32. doi:10.1046/j.1365-246X.2003.01984.x
International Seismological Centre (2021). ISC-EHB Dataset. doi:10.31905/PY08W6S3 (Accessed May 24, 2021)
Jo, E., and Hong, T.-K. (2013). Vp/Vs Ratios in the Upper Crust of the Southern Korean Peninsula and Their Correlations with Seismic and Geophysical Properties. J. Asian Earth Sci. 66, 204–214. doi:10.1016/j.jseaes.2013.01.008
Karyono, K., Obermann, A., Nugraha, F., Sudradjat, A., Syafri, I., and Abdurrokhim, A. (2020). The Deep Subsurface Structure beneath Lusi and the Adjacent Volcanic Chain Inferred from Local Travel-Time Tomography. J. Volcanology Geothermal Res. 400, 106919. doi:10.1016/j.jvolgeores.2020.106919
Kennett, B. L. N., Engdahl, E. R., and Buland, R. (1995). Constraints on Seismic Velocities in the Earth from Traveltimes. Geophys. J. Int. 122, 108–124. doi:10.1111/j.1365-246X.1995.tb03540.x
Kissling, E., Husen, S., and Haslinger, F. (2001). Model Parametrization in Seismic Tomography: A Choice of Consequence for the Solution Quality. Phys. Earth Planet. Interiors 123, 89–101. doi:10.1016/S0031-9201(00)00203-X
Kopp, H., Flueh, E., Petersen, C., Weinrebe, W., Wittwer, A., and Scientists, M. (2006). The Java Margin Revisited: Evidence for Subduction Erosion off Java. Earth Planet. Sci. Lett. 242, 130–142. doi:10.1016/j.epsl.2005.11.036
Kopp, H. (2011). The Java Convergent Margin: Structure, Seismogenesis and Subduction Processes. Geol. Soc. Lond. Spec. Publications 355, 111–137. doi:10.1144/SP355.6
Koulakov, I., Bohm, M., Asch, G., Lühr, B.-G., Manzanares, A., Brotopuspito, K. S., et al. (2007). PandSvelocity Structure of the Crust and the Upper Mantle beneath central Java from Local Tomography Inversion. J. Geophys. Res. 112, 1–19. doi:10.1029/2006JB004712
Koulakov, I., Maksotova, G., Jaxybulatov, K., Kasatkina, E., Shapiro, N. M., Luehr, B.-G., et al. (2016). Structure of Magma Reservoirs beneath Merapi and Surrounding Volcanic Centers of Central Java Modeled from Ambient Noise Tomography. Geochem. Geophys. Geosystems 17, 1312–1338. doi:10.1002/2016gc006442
Koulali, A., McClusky, S., Susilo, S., Leonard, Y., Cummins, P., Tregoning, P., et al. (2017). The Kinematics of Crustal Deformation in Java from GPS Observations: Implications for Fault Slip Partitioning. Earth Planet. Sci. Lett. 458, 69–79. doi:10.1016/j.epsl.2016.10.039
Lin, J.-Y., Hsu, S.-K., Lin, A. T.-S., Yeh, Y.-C., and Lo, C.-L. (2016). Vp/Vs Distribution in the Northern Taiwan Area: Implications for the Tectonic Structures and Rock Property Variations. Tectonophysics 692, 181–190. doi:10.1016/j.tecto.2015.09.013
Lomax, A., and Michelini, A. (2009). Mwpd: a Duration-Amplitude Procedure for Rapid Determination of Earthquake Magnitude and Tsunamigenic Potential fromPwaveforms. Geophys. J. Int. 176, 200–214. doi:10.1111/j.1365-246X.2008.03974.x
Lomax, A., Virieux, J., Volant, P., and Berge-Thierry, C. (2000). “Probabilistic Earthquake Location in 3D and Layered Models,” in Advances in Seismic Event Location. Modern Approches in Geophysics. Editors C. H. Thurber, and N. Rabinowitz (Dordrecht: Springer Netherlands), 101–134. doi:10.1007/978-94-015-9536-0_5
Luehr, B.-G., Koulakov, I., Rabbel, W., Zschau, J., Ratdomopurbo, A., Brotopuspito, K. S., et al. (2013). Fluid Ascent and Magma Storage beneath Gunung Merapi Revealed by Multi-Scale Seismic Imaging. J. Volcanology Geothermal Res. 261, 7–19. doi:10.1016/j.jvolgeores.2013.03.015
Lupi, M., De Gori, P., Valoroso, L., Baccheschi, P., Minetto, R., and Mazzini, A. (2022). Northward Migration of the Javanese Volcanic Arc along Thrust Faults. Earth Planet. Sci. Lett. 577, 117258. doi:10.1016/j.epsl.2021.117258
Marliyani, G. I., Helmi, H., Arrowsmith, J. R., and Clarke, A. (2020). Volcano Morphology as an Indicator of Stress Orientation in the Java Volcanic Arc, Indonesia. J. Volcanology Geothermal Res. 400, 106912. doi:10.1016/j.jvolgeores.2020.106912
Marliyani, G. I. (2016). Neotectonics of Java, Indonesia: Crustal Deformation in the Overriding Plate of an Orthogonal Subduction System. [dissertation thesis]. Tempe, AZ: Arizona State University.
Martha, A. A., Cummins, P., Saygin, E., and Sri Widiyantoro, S. (2017). Imaging of Upper Crustal Structure beneath East Java-Bali, Indonesia with Ambient Noise Tomography. Geosci. Lett. 4, 14. doi:10.1186/s40562-017-0080-9
Masson, D. G., Parson, L. M., Milsom, J., Nichols, G., Sikumbang, N., Dwiyanto, B., et al. (1990). Subduction of Seamounts at the Java Trench: a View with Long-Range Sidescan Sonar. Tectonophysics 185, 51–65. doi:10.1016/0040-1951(90)90404-V
Pusat Studi Gempa Nasional (PuSGeN) (2017). “Peta Sumber Dan Bahaya Gempa Indonesia Tahun 2017. First,” in .Bandung: Pusat Penelitian Dan Pengembangan Perumahan Dan Pemukiman Badan Penelitian Dan Pengembangan Kementerian Pekerjaan Umum Dan Perumahan Rakyat. M. Irsyam, S. Widiyantoro, D. H. Natawidjaya, I. Meilano, A. Rudyanto, S. Hidayatiet al.
Muttaqy, F., Nugraha, A. D., Puspito, N. T., Sahara, D. P., Zulfakriza, Z., Rohadi, S., et al. (2021). Double-difference earthquake relocation using waveform cross-correlation in Central and East Java, Indonesia. EarthArXiv. [Preprint]. doi:10.31223/X5MS4F Available at: https://eartharxiv.org/repository/view/1842/
Nakajima, J., and Hasegawa, A. (2006). Anomalous Low-Velocity Zone and Linear Alignment of Seismicity along it in the Subducted Pacific Slab beneath Kanto, Japan: Reactivation of Subducted Fracture Zone. Geophys. Res. Lett. 33, 1–4. doi:10.1029/2006GL026773
Nakajima, J., Matsuzawa, T., Hasegawa, A., and Zhao, D. (2001). Three-dimensional Structure ofVp,Vs, andVp/Vsbeneath Northeastern Japan: Implications for Arc Magmatism and Fluids. J. Geophys. Res. 106, 21843–21857. doi:10.1029/2000jb000008
Nugraha, A. D., and Mori, J. (2006). Three-dimensional Velocity Structure in the Bungo Channel and Shikoku Area, Japan, and its Relationship to Low-Frequency Earthquakes. Geophys. Res. Lett. 33, 1–5. doi:10.1029/2006GL028479
Puspito, N. T., Yamanaka, Y., Miyatake, T., Shimazaki, K., and Hirahara, K. (1993). Three-dimensional P-Wave Velocity Structure beneath the Indonesian Region. Tectonophysics 220, 175–192. doi:10.1016/0040-1951(93)90230-H
Ramdhan, M., Widiyantoro, S., Dian Nugraha, A., Saepuloh, A., Métaxian, J.-P., Kristyawan, S., et al. (2017). Seismic Travel-Time Tomography beneath Merapi Volcano and its Surroundings: A Preliminary Result from DOMERAPI Project. IOP Conf. Ser. Earth Environ. Sci. 62, 012039. doi:10.1088/1755-1315/62/1/012039
Ramdhan, M., Widiyantoro, S., Nugraha, A. D., Métaxian, J.-P., Rawlinson, N., Saepuloh, A., et al. (2019). Detailed Seismic Imaging of Merapi Volcano, Indonesia, from Local Earthquake Travel-Time Tomography. J. Asian Earth Sci. 177, 134–145. doi:10.1016/j.jseaes.2019.03.018
Rawlinson, N., Fichtner, A., Sambridge, M., and Young, M. K. (2014). Seismic Tomography and the Assessment of Uncertainty. Adv. Geophys. 55, 1–76. doi:10.1016/bs.agph.2014.08.001
Rawlinson, N., and Spakman, W. (2016). On the Use of Sensitivity Tests in Seismic Tomography. Geophys. J. Int. 205, 1221–1243. doi:10.1093/gji/ggw084
Reyners, M., Eberhart-Phillips, D., Stuart, G., and Nishimura, Y. (2006). Imaging Subduction from the Trench to 300 Km Depth beneath the central North Island, New Zealand, withVpandVp/Vs. Geophys. J. Int. 165, 565–583. doi:10.1111/j.1365-246X.2006.02897.x
Rohadi, S., Widiyantoro, S., Nugraha, a. D., and Masturyono, M. (2013). Tomographic Imaging of P- and S-Wave Velocity Structure beneath Central Java , Indonesia : Joint Inversion of the MERAMEX and MCGA Earthquake Data. Int. J. Tomography Simulation 24, 16. Available at: http://www.ceser.in/ceserp/index.php/ijts/article/view/242
Rosalia, S., Widiyantoro, S., Widiyantoro, S., Dian Nugraha, A., and Supendi, P. (2019). Double-difference Tomography of P- and S-Wave Velocity Structure beneath the Western Part of Java, Indonesia. Earthquake Sci. 32, 12–25. doi:10.29382/eqs-2019-0012-2
Sandwell, D. T., Müller, R. D., Smith, W. H. F., Garcia, E., and Francis, R. (2014). New Global marine Gravity Model from CryoSat-2 and Jason-1 Reveals Buried Tectonic Structure. Science 346, 65–67. doi:10.1126/science.1258213
Santoso, D., Wahyudi, E. J., Kadir, W. G. A., Alawiyah, S., Nugraha, A. D., Supendi, P., et al. (2018). Gravity Structure Around Mt. Pandan, Madiun, East Java, Indonesia and its Relationship to 2016 Seismic Activity. Open Geosciences 10, 882–888. doi:10.1515/geo-2018-0069
Simandjuntak, T. O., and Barber, A. J. (1996). Contrasting Tectonic Styles in the Neogene Orogenic Belts of Indonesia. Geol. Soc. Lond. Spec. Publications 106, 185–201. doi:10.1144/GSL.SP.1996.106.01.12
Smyth, H., Hall, R., Hamilton, J., and Kinny, P. (2005). “East Java: Cenozoic Basins, Volcanoes and Ancient Basement,” in 30th Annual Convention of the Indonesian Petroleum Association (Jakarta: Indonesian Petroleum Association), 251–266. doi:10.29118/ipa.629.05.g.045
Smyth, H. R., Hall, R., and Nichols, G. J. (2008). “Cenozoic Volcanic Arc History of East Java, Indonesia: The Stratigraphic Record of Eruptions on an Active continental Margin,” in Formation and Applications of the Sedimentary Record in Arc Collision Zones (Geological Society of America Special Paper) (Boulder, CO: Geological Society of America), 199–222. doi:10.1130/2008.2436(10)
Smyth, H. R., Hamilton, P. J., Hall, R., and Kinny, P. D. (2007). The Deep Crust beneath Island Arcs: Inherited Zircons Reveal a Gondwana continental Fragment beneath East Java, Indonesia. Earth Planet. Sci. Lett. 258, 269–282. doi:10.1016/j.epsl.2007.03.044
Syracuse, E. M., van Keken, P. E., Abers, G. A., Suetsugu, D., Bina, C., Inoue, T., et al. (2010). The Global Range of Subduction Zone thermal Models. Phys. Earth Planet. Interiors 183, 73–90. doi:10.1016/j.pepi.2010.02.004
Tonegawa, T., Araki, E., Kimura, T., Nakamura, T., Nakano, M., and Suzuki, K. (2017). Sporadic Low-Velocity Volumes Spatially Correlate with Shallow Very Low Frequency Earthquake Clusters. Nat. Commun. 8, 1–7. doi:10.1038/s41467-017-02276-8
Toomey, D. R., and Foulger, G. R. (1989). Tomographic Inversion of Local Earthquake Data from the Hengill- Grensdalur central Volcano Complex, Iceland. J. Geophys. Res. 94, 17497–17510. doi:10.1029/jb094ib12p17497
Tsuji, T., Yamamoto, K., Matsuoka, T., Yamada, Y., Onishi, K., Bahar, A., et al. (2009). Earthquake Fault of the 26 May 2006 Yogyakarta Earthquake Observed by SAR Interferometry. Earth Planet. Sp 61, e29–e32. doi:10.1186/BF03353189
Tsuji, Y., Nakajima, J., and Hasegawa, A. (2008). Tomographic Evidence for Hydrated Oceanic Crust of the Pacific Slab beneath Northeastern Japan: Implications for Water Transportation in Subduction Zones. Geophys. Res. Lett. 35, 1–5. doi:10.1029/2008GL034461
Um, J., and Thurber, C. (1987). A Fast Algorithm for Two-point Seismic ray Tracing. Bull. Seismological Soc. America 77, 972–986. doi:10.1785/bssa0770030972
Wagner, D., Koulakov, I., Rabbel, W., Luehr, B.-G., Wittwer, A., Kopp, H., et al. (2007). Joint Inversion of Active and Passive Seismic Data in Central Java. Geophys. J. Int. 170, 923–932. doi:10.1111/j.1365-246X.2007.03435.x
Waltham, D., Hall, R., Smyth, H. R., and Ebinger, C. J. (2008). Basin Formation by Volcanic Arc Loading. Spec. Paper Geol. Soc. America 436, 11–26. doi:10.1130/2008.2436(02)
Widiyantoro, S., Gunawan, E., Muhari, A., Rawlinson, N., Mori, J., Hanifa, N. R., et al. (2020). Implications for Megathrust Earthquakes and Tsunamis from Seismic Gaps South of Java Indonesia. Sci. Rep. 10, 1–11. doi:10.1038/s41598-020-72142-z
Widiyantoro, S., and Van Der Hilst, R. (1996). Structure and Evolution of Lithospheric Slab beneath the Sunda Arc, Indonesia. Science 271, 1566–1570. doi:10.1126/science.271.5255.1566
Xia, Y., Geersen, J., Klaeschen, D., Ma, B., Lange, D., Riedel, M., et al. (2021). Marine Forearc Structure of Eastern Java and its Role in the 1994 Java Tsunami Earthquake. Solid Earth Discuss. 1994, 1–19. doi:10.5194/se-2021-61
Zenonos, A., De Siena, L., Widiyantoro, S., and Rawlinson, N. (2019). P and S Wave Travel Time Tomography of the SE Asia-Australia Collision Zone. Phys. Earth Planet. Interiors 293, 106267. doi:10.1016/j.pepi.2019.05.010
Zhang, H., Thurber, C. H., Shelly, D., Ide, S., Beroza, G. C., and Hasegawa, A. (2004). High-resolution Subducting-Slab Structure beneath Northern Honshu, Japan, Revealed by Double-Difference Tomography. Geol 32, 361–364. doi:10.1130/G20261.2
Zhao, D., Christensen, D., and Pulpan, H. (1995). Tomographic Imaging of the Alaska Subduction Zone. J. Geophys. Res. 100, 6487–6504. doi:10.1029/95JB00046
Zhao, D. (2015). Multiscale Seismic Tomography. 1st ed.. Tokyo: Springer Japan. doi:10.1007/978-4-431-55360-1
Zhao, D., Yanada, T., Hasegawa, A., Umino, N., and Wei, W. (2012). Imaging the Subducting Slabs and Mantle Upwelling under the Japan Islands. Geophys. J. Int. 190, 816–828. doi:10.1111/j.1365-246X.2012.05550.x
Keywords: seismic tomography, subduction zone, volcanism, Central Java, East Java, Malang Earthquake
Citation: Muttaqy F, Nugraha AD, Mori J, Puspito NT, Supendi P and Rohadi S (2022) Seismic Imaging of Lithospheric Structure Beneath Central-East Java Region, Indonesia: Relation to Recent Earthquakes. Front. Earth Sci. 10:756806. doi: 10.3389/feart.2022.756806
Received: 11 August 2021; Accepted: 05 January 2022;
Published: 26 January 2022.
Edited by:
Nibir Mandal, Jadavpur University, IndiaReviewed by:
Marina Manea, National Autonomous University of Mexico, MexicoGautier Stéphanie, Université de Montpellier, France
Copyright © 2022 Muttaqy, Nugraha, Mori, Puspito, Supendi and Rohadi. This is an open-access article distributed under the terms of the Creative Commons Attribution License (CC BY). The use, distribution or reproduction in other forums is permitted, provided the original author(s) and the copyright owner(s) are credited and that the original publication in this journal is cited, in accordance with accepted academic practice. No use, distribution or reproduction is permitted which does not comply with these terms.
*Correspondence: Faiz Muttaqy, ZmFpei5tdXR0YXF5QHlhaG9vLmNvbQ==; Andri Dian Nugraha, bnVncmFoYUBnZi5pdGIuYWMuaWQ=