 Camilla Penney
 Rory Walshe
 Hannah Baker
 Henri van Soest
 Sarah Dryhurst
 A. R. E. Taylor
94% of researchers rate our articles as excellent or good
Learn more about the work of our research integrity team to safeguard the quality of each article we publish.
Find out more
ORIGINAL RESEARCH article
Front. Earth Sci., 07 April 2022
Sec. Geohazards and Georisks
Volume 10 - 2022 | https://doi.org/10.3389/feart.2022.742016
This article is part of the Research TopicReimagining the History of Extreme EventsView all 7 articles
How to recognise potential disasters is a question at the centre of risk analysis. Over-reliance on an incomplete, often epistemologically-biased, historical record, and a focus on quantified and quantifiable risks, have contributed to unanticipated disasters dominating both casualties and financial losses in the first part of the 21st century. Here we present the findings of an online workshop implementing a new scenario-planning method, called downward counterfactual analysis, which is designed to expand the range of risks considered. Interdisciplinary groups of disaster researchers constructed downward counterfactuals for a present-day version of the 365CE Cretan earthquake and tsunami, imagining how these events might have been worse. The resulting counterfactuals have trans-national, long-term impacts, particularly in terms of economic losses, and connect risks previously identified in separate sectors. Most counterfactuals involved socio-political factors, rather than intrinsic components of the hazard, consistent with the idea that there are “no natural disasters”. The prevalence of cascading counterfactuals in our workshop suggests that further work is required to give the appropriate weight to pre-existing economic and social conditions in scenario-planning methods, such as downward counterfactual analysis, which focus on the occurrence of a hazard as the temporal starting point for a disaster. Both proposed counterfactuals and their justifications reflect a bias towards contemporary issues and recent historical disasters. We suggest that interdisciplinary groups can expand the range of imagined risks. However, the setup used here would be improved by including local stakeholders. Qualitative forms of downward counterfactual analysis have potential applications for community engagement and education, as well as for risk analysis.
Understanding potential future disasters, and the factors which might create them, is a critical component of risk analysis across many disciplines and sectors. Yet, definitions of risk vary widely between these communities (Wisner et al., 2004, pp.16–18). As Hewitt (1997) writes, “There is a struggle between a narrow, essentially quantitative understanding of risk and a broad social and cultural one”. An over-emphasis on quantification has been recognised as a logical fallacy (Yankelovich, 1972; O’Mahony, 2018), increasing the epistemic and ontological uncertainty associated with possible futures by excluding important, unquantifiable risks and qualitative forms of knowledge (Nissan et al., 2019; Tironi and Manríquez, 2019). There is also a tension between probabilistic approaches to risk, which “give the appearance of objectivity” (Shepherd, 2019), and wanting to explore rare, potentially catastrophic scenarios (sometimes referred to as “Black Swans,” Taleb, 2007, which individually have probabilities too low to be included in a probabilistic model). Since disasters occur when hazards intersect with multiple systemic and socio-cultural vulnerabilities (Blaikie et al., 1994; UNISDR, 2015), both quantitative and qualitative understandings of risk are crucial to disaster risk reduction (DRR).
Currently, risk models across sectors rely heavily on the historical record to identify future disasters. This record is possibly biased by the privileging of certain knowledges (usually quantitative) and voices (usually Western) over others, such as archival records (Degroot et al., 2021) or geomythology (Piccardi and Masse, 2007; Nunn, 2014). Even if all events were documented for environmental hazards, such as earthquakes, the historical record is often short relative to the time between the largest events. As such, historical records might not accurately reflect the range of possible hazard events (e.g., Stein and Friedrich, 2014; Stevens and Avouac, 2016; Shepherd, 2019). Similarly, since disasters involve the interaction of hazards with social, economic and political systems, changes in socio-economic conditions through time, and the complexity of such systems, mean that future disasters will not exactly replicate those in the past (Glantz, 1996; Schenk, 2015; Mignan et al., 2016).
On the other hand, the terminology of “unprecedented” events, and the implication that the current historical context is fundamentally different from the past (Kelman, 2014), can be leveraged to imply that disasters can be neither mitigated nor planned for, and to excuse poor preparation (Paté-Cornell, 2012; Hewitt, 2019). This situation had led some authors to suggest that the very concept of a “Black Swan” may be a “red herring” (Shaw, 2014), since the question of whether or not an event could have been foreseen is more a question of imagination and approach, than of genuine unpredictability.
Downward counterfactual analysis has recently been proposed (Woo, 2016; Woo et al., 2017) as an approach to go beyond the historical record in risk analysis, by considering the historical record as only one realisation of an inherently uncertain system. An historical event, or near miss, is taken as a seed event. A risk analyst (or group of participants, Section 2), then imagines ways of incrementally worsening this seed event, until some threshold is reached (such as the “worse-case scenario”, or exceedance of engineering code parameters; Lin et al., 2020). These incremental worsenings (“turns”) can be based on historical precedents, or changes with a similar likelihood to the original event. Downward counterfactual analysis, therefore, aims to identify rare events which might not currently be recognised as risks, but which are nonetheless “satisfactorily ‘real”’ (Lin et al., 2020). This approach is similar to the use of “storylines” in climate change modelling, some of which construct counterfactuals for past hazard events occurring under potential climate futures (Trenberth et al., 2015; Shepherd et al., 2018).
To date, studies using downward counterfactual analysis have focused on quantifying both the likelihood and the impacts of potential disasters (Woo and Mignan, 2018; Aspinall and Woo, 2019; Lin et al., 2020). In formalising the method, Lin et al. (2020) explicitly limit the allowed counterfactuals (e.g., only considering changes in timing). These limitations are in contrast to Woo (2019) imagining downward counterfactual analysis being conducted “like a Victorian parlour game”. The only previously documented use of downward counterfactual analysis in a workshop setting (Lin et al., 2019) also concluded that capturing stories was key to understanding potential disasters. Here, we present the first attempt to introduce imagination and qualitative forms of knowledge into downward counterfactual analysis by adopting a “serious games” approach (Abt, 1987, Section 2), using the 365CE Cretan earthquake and tsunami as a seed event (Section 1.1). We conducted this downward counterfactual analysis in an online workshop, our observations from which are presented in Section 3. We then discuss potential uses and limitations of our approach and of downward counterfactual analysis more generally (Section 4).
The initial downward counterfactual that we explore here is the 365CE Cretan earthquake and tsunami occurring at the present day. Many authors (e.g., Altinok and Ersoy, 2000; Tinti et al., 2005; Synolakis et al., 2011; IOC, 2020) have recognised that such an event would likely lead to a disaster, and have more severe consequences than in 365CE, particularly given high and increasing coastal population densities (
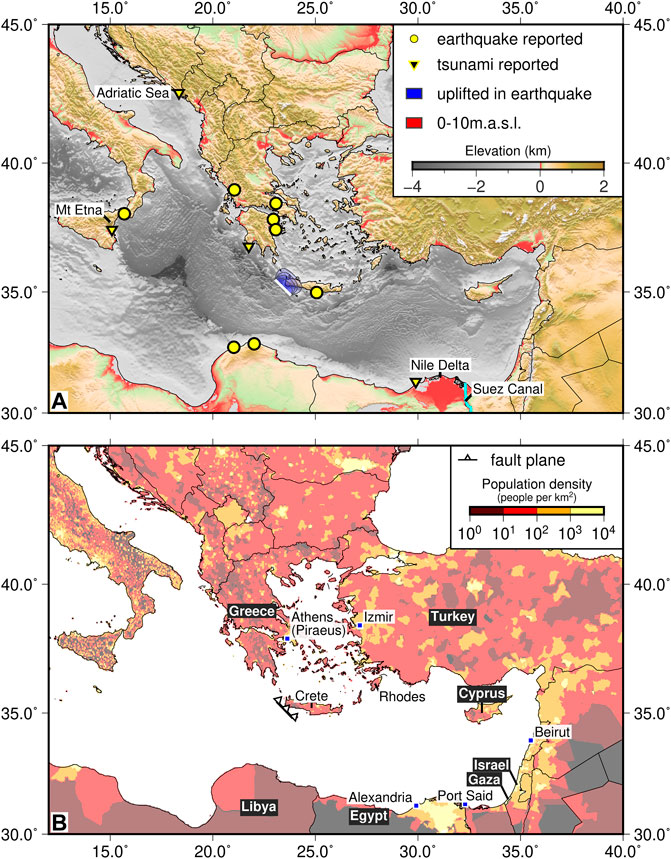
FIGURE 1. Map of the 365CE earthquake and locations referenced in the text. (A) Map showing topography of Eastern Mediterranean. Uplift due to the 365CE earthquake on the fault plane proposed by Shaw et al. (2008) is shown by blue shading (darker blue indicates greater uplift, contours are spaced at 2 m uplift from 1 to 9 m). Yellow circles show locations where earthquake shaking was reported, inverted triangles show locations of tsunami inundation (Shaw et al., 2008; Ambraseys, 2009). Red regions are less than 10 m above sea level. The cyan line shows the location of the present day Suez Canal. (B) Map showing contemporary population density (from Center for International Earth Science Information Network - CIESIN - Columbia University, 2018) around the Mediterranean (note the logarithmic colour scale), and locations mentioned in the text. Blue squares show cities. The surface projection of the fault plane proposed by Shaw et al. (2008) is shown with teeth on the hanging wall side of the fault, which is expected to move more in an earthquake.
The 365CE earthquake occurred off the south-east coast of Crete on 21st July (Figure 1A). The earthquake generated a tsunami, which caused destruction and loss of life around the Eastern Mediterranean, with reports of inundation as far away as Sicily and modern Dubrovnik (Figure 1A; Jacques and Bousquet, 1984; Ambraseys, 2009, pp.151–156). The earthquake uplifted the coastline of western Crete by up to ∼9 m (Pirazzoli et al., 1996; Shaw et al., 2008). Shaw et al. (2008) determined the location and style of the earthquake based on paleoshorelines. They concluded that the earthquake was likely to have been a thrust with magnitude up to Mw 8.5 (with the best-fitting location shown in Figure 1). The earthquake mechanism, however, does not constrain the directionality of the rupture.
The Hellenic subduction zone, where the 365CE earthquake occurred is unusual in that only a small fraction (
The main data collection exercise for this study was a 2.5 h virtual workshop held on 22nd March 2021. In this section we first present details of the workshop, then discuss the methods we have used to analyse the resulting data.
Participants for the workshop were recruited via the Cambridge Disaster Research Network (CDRN) and Cambridge Infrastructure Resilience Group (CIRG) mailing lists, which are run by the authors. CDRN is a network for researchers and practitioners interested in disasters and natural hazards. The CIRG is a network of researchers from across disciplines whose work touches on themes of societal and infrastructure resilience. There was no significant overlap in the membership of these mailing lists.
This research underwent a full ethical approval procedure through the Department of Geography at the University of Cambridge (#1848). Prior to the workshop, participants were informed that the workshop would be recorded and used for this research. This information was repeated in a briefing document sent to all participants (Supplementary Document S1). This briefing document also contained a content notice and informed participants that they were free to raise concerns with the workshop convenors (the authors) or to leave the workshop at any time. The use of the data, content notice and freedom to leave were re-stated at the start of the workshop.
The workshop had 22 participants (including the six authors). 18 of these participants were affiliated with the University of Cambridge, the remaining four with other universities, though two worked primarily outside academia. The majority (11) of the participants were postdoctoral researchers (including five of the authors), five participants were graduate students (including one of the authors), and four were faculty. Figure 2 shows the subject expertise of the participants by career stage. Six noted a specialism in volcanoes, volcanology or volcanic risk and four mentioned earthquakes or seismic hazards. Other noted interests included: climate policy, scenario development, risk perception, disaster management, hazard assessment and disaster knowledges. We did not ask whether participants identified as being from a physical or social sciences background, but the majority work on some component of the societal aspect of disasters. Although the participants were from a variety of career stages and disciplines, and thus represented interdisciplinary perspectives, the group was not diverse in that it was dominated by affiliates of the University of Cambridge, most of whom had limited, or no, previous research experience of the Eastern Mediterranean. Since our aim was primarily to test the downward counterfactual methodology, and to explore imaginative aspects of this analysis, the interdisciplinarity of the group was more important than particular backgrounds, however, the issue of who should be involved in downward counterfactual analysis is discussed further in Section 4.2.
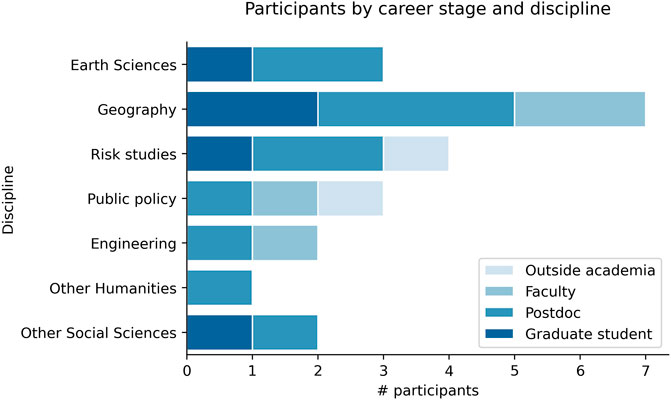
FIGURE 2. Number of participants in each discipline, subdivided by career stage. We have grouped related disciplines to capture the area of participants’ research and maintain anonymity.
The workshop was conducted on Zoom (Zoom Video Communications Inc., 2021) due to Covid-19 (WHO, 2020) restrictions on meeting in person. Groups were separated into “breakout rooms,” each of which was separately recorded. The registered participants had been pre-assigned into five groups, each led by a convenor, but these had to be adjusted based on the turn out. It was agreed in advance that no group should contain fewer than four participants (including the convenor) and that groups should maximise diversity of career stage and expertise. The convenor was allowed to contribute to the exercise; hereafter “participant” refers to both external participants and convenors).
We conducted three rounds of counterfactual exploration of the 365CE earthquake (Section 1.1). Participants were asked to state their suggested downward counterfactual or “turn,” if possible, identifying it with one or more of the turn types in Figure 3). They were also asked to say why this turn might worsen the scenario, and would not make the scenario significantly less likely. The meaning of “worse” was taken to be different in each round: Round 1—a higher number of casualties, Round 2—greater financial losses and Round 3—“participant choice” i.e., what each participant considered to be “worse,” emphasising ideas which had not come up in the previous rounds. What constituted a significant reduction in likelihood was open to interpretation by participants (see Section 4.3) and there was no requirement for quantitative justifications.
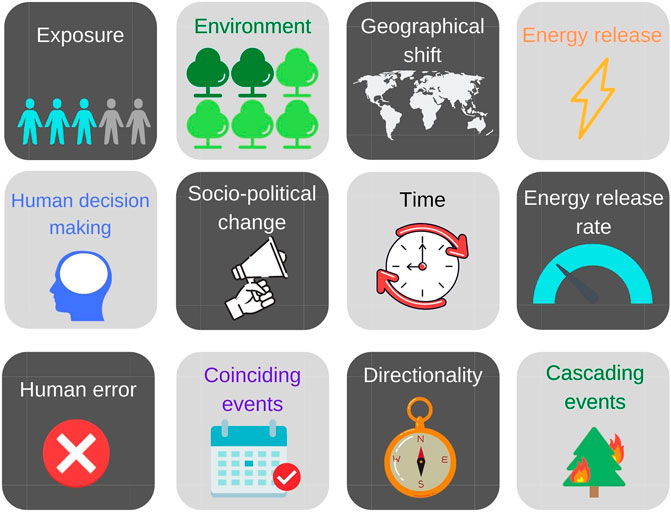
FIGURE 3. Turn types proposed by Lin et al. (2020) (with “directionality” added). This figure was given to the participants as a suggestion for the types of possible turns (Supplementary Document S1), and indicates the turn types used for deductive coding (Section 2).
Other participants could then comment on, clarify or dispute these turns, with the aim of agreeing on whether a turn was acceptable (i.e., that the turn would worsen the scenario based on that round’s definition of worse and not lead to a significant reduction in the likelihood of the scenario). The end point of each scenario (step 3 in Lin et al., 2020) was the worst case which could be achieved without making the scenario “significantly less likely,” or reaching a pre-specified time limit (25 min for the casualties and financial rounds and 20 min for the participant choice round). The exercise was intended to be imaginative, meaning that scenarios were not expected to be fully specified (either quantitatively or qualitatively) at the multiple geographical and temporal scales of interest.
After the third round, participants were invited to share their reflections on the exercise and the downward counterfactual methodology more generally, with an invitation to follow up with the convenors by email if they had further reflections. Convenors ensured that all participants were given the opportunity to comment.
Audio recordings obtained from Zoom’s internal recording software were uploaded to Otter.ai, (2021), which generated automatic transcripts of the workshop. Each of the authors then manually checked the transcripts from their group against the recording.
Manual coding was carried out using NVivo12 Pro (QSR International Pty Ltd., 2018). Coding refers to the tagging or identification of sections of text with labels, which may be pre-specified (“deductive coding”) or created based on the data (“inductive coding”; Creswell and Creswell, 2017; Gibbs, 2018). We used a combined approach.
Inductive coding was used to identify themes in the workshop discussions. Three major structural elements were clear from an initial investigation: first, themes which emerged in the discussions; second, comments or issues relating to the methodology and, third, justifications given to support proposed turns. These were taken as the basic structure of a codebook, and more detailed code proposals were grouped under these headings. Several of the authors then reviewed the list of proposed codes to identify areas of overlap and redundancy and generated a codebook in NVivo12 Pro. This codebook was then used to code the transcripts. A small number of further codes were proposed after this initial coding and were added to the final codebook (Supplementary Document S2). The same person then reviewed their coding of each section. Finally, a second author coded each section independently using the same codebook. The coders also identified the turns (downward counterfactual changes) made in each group in each round, classifying as a turn any proposal which changed the scenario.
Deductive coding was used to identify turn types, based on the classification proposed by Lin et al. (2020) (Figure 3), with an additional turn type (directionality) introduced to capture changes relating to the direction of energy release from a hazard (which we hypothesised might be of particular relevance for the earthquake/tsunami scenario discussed in this paper). These turn types had been given to the participants prior to the workshop (Supplementary Document S1). If a turn had been identified as a particular type during the workshop it was coded as this turn type, with additional turn types being added where these were felt to more accurately reflect the content of the changes. Each turn was classified into at least one, and up to three, of the categories shown in Figure 3. We then categorised the individual turns as being either social or physical. A number of orienting questions were used to reach a designation, such as, “does this turn involve people in any way?”. We also investigated the type of turns used from a physical vs. social perspective, by dividing Lin et al.’s proposed turn types into those relating to intrinsic properties of the hazard (“timing,” “geographical shift,” “directionality,” “energy release,” “energy release rate”) and those relating to socio-political systems or people (“exposure,” “socio-political change,” “human decision making,” “human error”). The remaining categories (“cascading events,” “coinciding events,” and “environment”) can contain changes in either category.
At least three of the authors manually reviewed each coder’s proposal for what constituted a turn and discussed their identification with turn types as proposed by Lin et al. (2020). This discussion was important because some turns were difficult to distinguish from their impacts and sometimes multiple turns were listed in a single statement. The “social” vs. “physical” designations were rechecked and confirmed by a second author, in reverse order. This approach was only possible because of the relatively small size of our dataset (153 separate turns, ∼12.5 h of transcripts). The identified turns and classifications are still subjective but this approach gives us confidence in the agreement between coders.
We also identified repeated or similar turns. In some cases, a single turn contained aspects of multiple repeated turns (Figure 4). For example, one participant proposed in the financial round that if the earthquake and tsunami were to occur “a bit further past Covid … 2023, potentially, when tourism is really making a comeback and … in the summer” this could lead to expensive damage to super-yachts and that the disaster might become “really ingrained within the public imagination” leading to “damage [to] tourism in the region for a long time”. This turn is clearly about time relative to a pandemic (changing the timing to post-Covid), seasonality (changing the timing to summer) and long term impacts on tourism, so was coded as all of these. This turn also highlights the challenge of identifying turns, as distinct from their impacts, and the issue of participants effectively presenting multiple changes in a single “turn”.
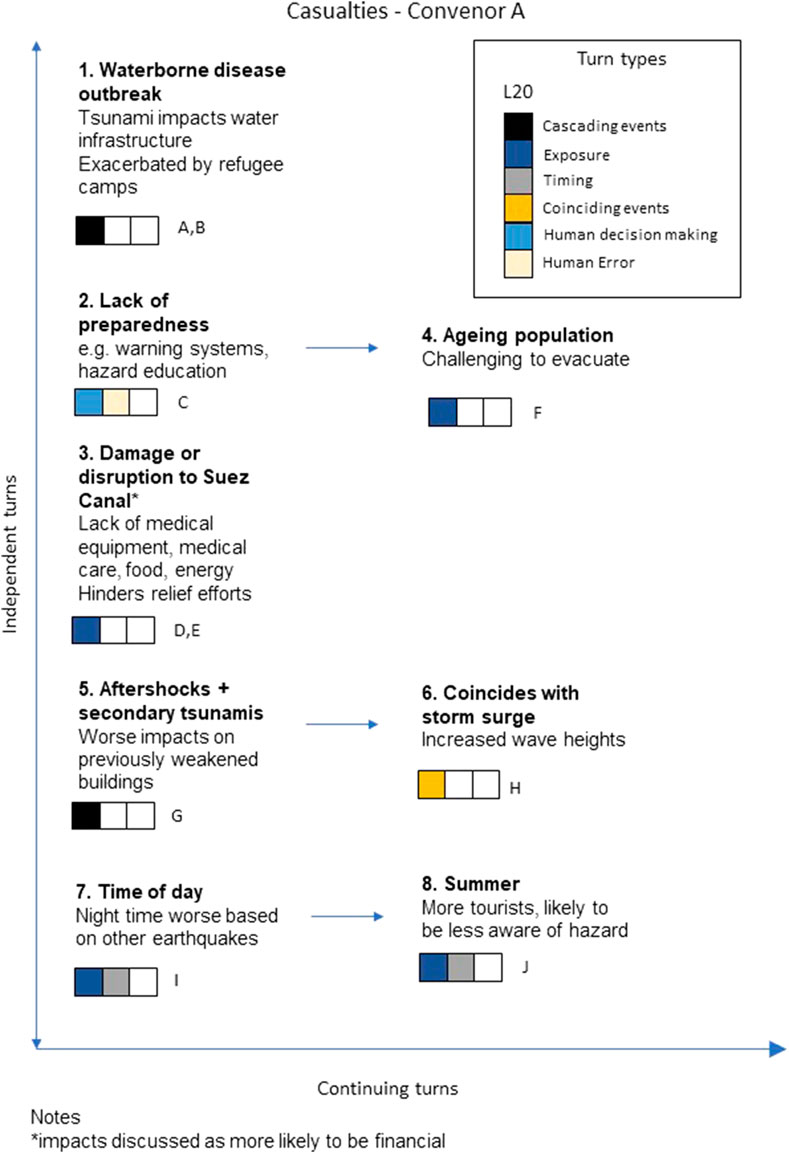
FIGURE 4. Example scenario building exercise based on the casualties round. Turns are numbered in the order in which they were made. The vertical axis shows turns which are independent i.e., don’t follow on from each other, or didn’t in the context of the conversation. Arrows and x axis show turns which follow from previous ones. The three coloured blocks beneath each turn show the Lin et al. (2020) turn type(s) with which the turn was coded ‘L20’ in the letters refer to turns identified as repeated: A–waterborne disease outbreak, B–damage to water infrastructure, C–lack of (timely) warning, D–damage to Suez Canal, E–food shortages, F–ageing population, G–aftershock, H–coinciding storm, I–time of day, J–season (see other diagrams in Supplementary Material S3).
We constructed scenario diagrams (Figure 4 and Supplementary Document S3) for each group and each round, showing both the order in which turns were made (text box numbers) and their interlinkages. In particular, we focused on whether turns followed on from, or relied on, previous turns (“continuing turns”), or could be viewed as direct worsenings of the initial scenario (“independent turns”). These diagrams represent the content and structure of the conversation and proposed turns, rather than the authors’ endorsement of the views or perspectives expressed.
Finally, using inductive coding techniques, we classified the different forms of justification that participants used or referred to into: case studies, disciplinary expertise, lived experience or anecdotal evidence, and regional knowledge (whether “expert” or general), with additional codes for items explicitly referred to as ‘outside a participant’s area of expertise’ and for incorrect information.
This section outlines the results of our workshop. Whilst the detailed results are likely to be specific to our workshop setup and the participants involved, they nonetheless offer insights into how introducing imaginative components into downward counterfactual analysis might look. The constructed scenarios also offer five different sets of perspectives on risk in the Eastern Mediterranean.
In total, we identified 153 turns over the three rounds amongst the five groups. Convenors on average contributed the same number of, or slightly fewer, turns than other participants, so their turns did not dominate the scenarios. Figure 4 shows the progression of a downward counterfactual analysis from a representative group for the casualties round. Similar diagrams for the other groups and rounds can be found in Supplementary Document S3.
Figure 5A shows a heatmap of the number of instances of each theme in different groups and rounds. The most common themes were: critical infrastructure, other natural hazards, and political breakdown, which are broken down further in Figures 5B–D. There was more discussion of critical infrastructure and other natural hazards in the casualties and financial rounds, and more discussion of political breakdown in the financial and participant choice rounds.
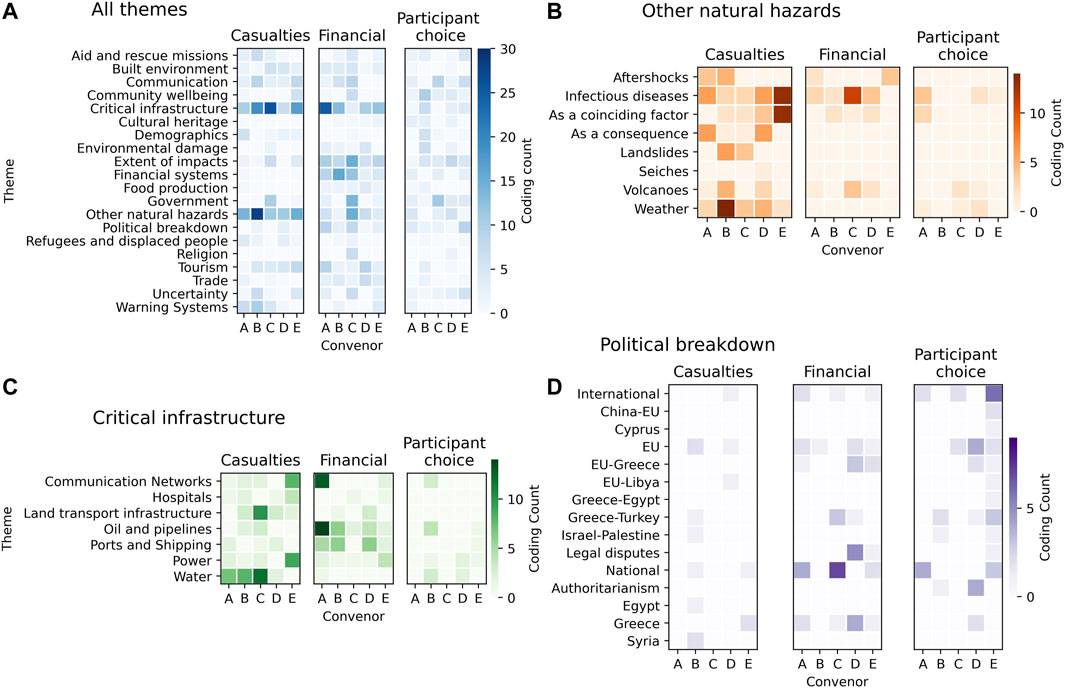
FIGURE 5. Heat maps of themes discussed by different groups in different rounds. (A) shows the overall themes discussed and (B), (C) and (D) show more detailed breakdowns of the “other natural hazards,” “critical infrastructure,” and “political breakdown” themes respectively. Note that for “political breakdown,” the code “international” encompasses both coding generically as international political breakdown and the specific instances listed between “international” and “national”. Similarly, “national” includes both coding with “political breakdown-national” and the codes listed below ‘national”.
Within critical infrastructure, the most coding instances related to water infrastructure, although these were almost all in the casualties round. In the financial round, all groups discussed oil and pipeline infrastructure, often in relation to ports and shipping (particularly in the context of the Suez Canal, which we discuss in more detail in Section 4.1). Electrical power and potential electricity failures were a common theme across all rounds and groups.
The discussion of ‘other natural hazards’ was dominated by infectious diseases, reflecting both the common proposal that the earthquake and tsunami would be followed by waterborne disease outbreaks (via the damage to water infrastructure mentioned above), and frequent references to pandemics (discussed further in Sections 3.2 and 4.1). We note that whilst infectious diseases (i.e., pathogens) themselves are natural, the conditions which create epidemics or pandemics are social, demonstrating the subjectivity of coding, and quantifying, discussion. Weather was also discussed in all groups, often in the context of coinciding rainstorms (leading to slope instability and landslides or, again, waterborne disease) or hot weather leading to more tourists on beaches. Aftershocks were discussed in three out of five groups.
“Political breakdown” was used to encompass national and international political tensions and conflicts, with the most discussion focused on relations between Greece and Turkey, including tensions in Cyprus. This theme also included the breakdown of international organisations. The collapse of the EU or the eurozone were particularly frequently mentioned, either as pre-existing conditions likely to make disaster response more challenging, or as a potential result of the costs of reconstruction (see Section 4.1). Such political breakdown exemplifies the theme “extent of impacts” (sub-divided into spatial and temporal) which emerged, particularly in the financial round, to describe references to the impacts of the disaster extending beyond the Eastern Mediterranean (e.g., collapse of the reinsurance industry) or further in time (e.g., long term loss of tourism). This theme is important for considering the utility of downward counterfactual analysis because it demonstrates the difficulty of assigning causality to complex and evolving risks.
In addition to these general themes, we investigated which specific counterfactual turns were most frequently repeated across rounds and groups. Figure 6 shows the 24 turns which were repeated at least three times during the workshop. Most of these repeated turns (n = 15, 65%) occurred in multiple rounds, and all occurred in multiple groups.
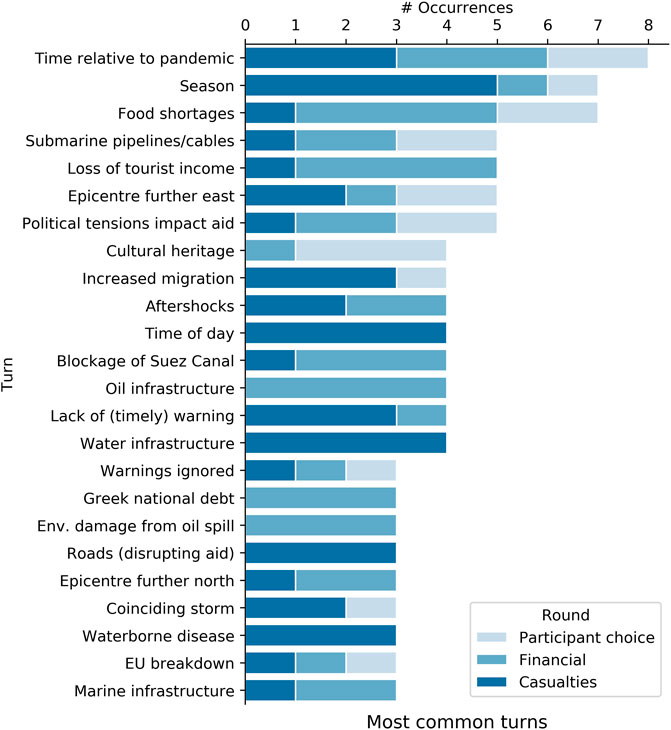
FIGURE 6. Number of occurrences of common turns. Colours in the bars show the number of times a particular turn occurred in each round (note that each turn type can only occur once per round per convenor so the maximum number of occurrences would be 15 and five occurrences in any round implies all groups used a particular turn). Turns written as a type of infrastructure are generally about damage to that infrastructure. “increase in migration” refers to increased numbers of displaced people resulting from changes in economic or socio-political conditions, mostly with reference to current refugee camps near sea level on Greek islands (e.g., Chtouris and Miller, 2017).
The most frequently repeated turn (n = 8) was; “time relative to a pandemic,” used to describe turns which located the occurrence of the earthquake and tsunami temporally either relative to the Covid-19 pandemic, which was ongoing at the time of the exercise, or to a potential future pandemic.
The casualties and financial rounds each had one turn which was made by all groups: seasonality and loss of income from tourism respectively. Both of these turns reflect regional and anecdotal understanding of the context of the Eastern Mediterranean (discussed further in Section 3.4). Several other turns occurred in four out of five groups in particular rounds. In the casualties round these were: time of day and damage to water infrastructure. In most cases, damage to water infrastructure was also linked to waterborne disease outbreaks, establishing causality between the earthquake and diseases (Section 4.4). In the financial round the most repeated turns were: food shortages, damage to oil infrastructure and environmental damage due to an oil spill (the latter two turns were always linked as either two separate turns or within the same turn).
In addition to analysing the content of the turns, we also investigated what types of downward counterfactuals participants used. The primary aim of this analysis was to investigate whether the classifications of counterfactuals proposed by Lin et al. (2020) provide a useful framework, either for conducting downward counterfactual analysis, or for classifying the resulting scenarios.
Figure 7A shows the prevalence of different turn types. “Cascading events” (n = 76, 50% of turns); worsenings of the scenario as a result of events following on from the initial hazard, were the most common turn type, followed by “exposure” (n = 53, 35% of turns); changes in the amount of people or infrastructure likely to be affected by the event.
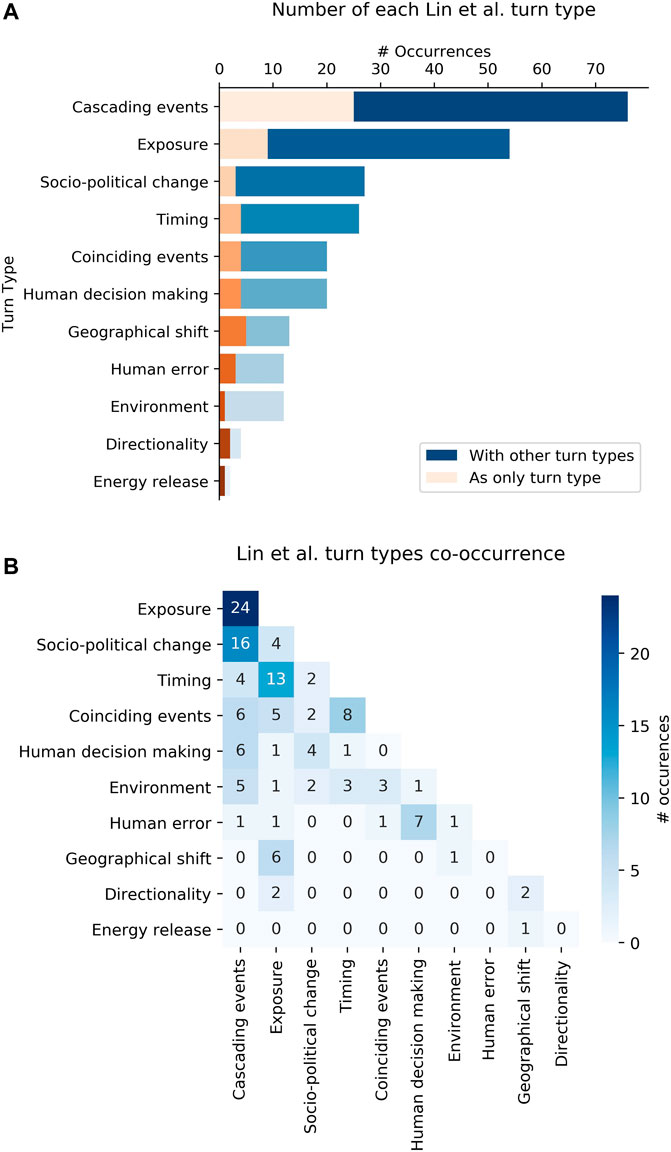
FIGURE 7. Lin et al. (2020) turn type (co-)occurrence. (A) Frequency of different turn types proposed by Lin et al. (2020). Orange bars show the number of turns coded with only that turn type, blue bars show the number of turns coded with that turn type and one or more other turn types. (B) heatmap showing co-occurrence of Lin et al. (2020) turn types. Numbers and shading show the number of instances of each co-occurrence (note that these co-occurrences could represent overlaps of just these two turn types or these two turn types with a third type i.e., the sum of the values corresponding to a particular turn type need not be equal to the size of the blue bar in (A).
We used multiple turn types to code the majority of turns (blue bars in Figure 7A), to reflect the complexity of turns, the difficulty of distinguishing between a turn and its impacts, and uncertainty in the appropriate categorisation for a particular turn. The overlaps between different turn types are shown in Figure 7B, with darker colours highlighting the more frequently occurring overlaps. The largest overlap is between “cascading events” and “exposure,” often signifying turns where cascading effects resulted from damage to infrastructure. Similarly, “timing” overlaps significantly with “coinciding events,” since for events to coincide often requires a change in timing, e.g., for the earthquake to occur on an election day. The interlinkage between cascading events and infrastructure exposure is seen in one participant’s suggestion of “extensive damage to Piraeus, which is the port in Athens … Potentially, you either block the port, or you start backing up international maritime traffic”. This turn incorporates exposure (of the port) and cascading events (“backing up international maritime traffic”) into a single turn, but also demonstrates the challenge of distinguishing between a turn and its impacts. Whether the turn here is “damage to Piraeus,” which might be an initial consequence of a repeat of the 365CE event, or the cascading effects of such damage, is subjective and requires understanding the context of the discussion, not only the single paragraph where it is stated. Quantifying a discussion through coding does not capture the full picture.
Our results suggest that turn types related to intrinsic properties of the hazard were less commonly used (n = 45, 29% of turns) than social turn types (n = 112, 73% of turns), and that hazard-based turn types also tended to be coded with a social code. “Timing” and “geographical shift,” for example, co-occur with “exposure” in 50% (n = 13) and 46% (n = 6) of their respective occurrences, reflecting turns such as changes in seasonality making the event worse because of larger numbers of tourists on beaches, or moving the epicentre leading to exposure of a particular port or harbour. These findings reflect our general results that 93 of the turns (61%) were primarily social (e.g., failure to warn populations or lack of awareness), 22 of the turns (14%) were primarily physical (e.g., an increase in the magnitude of the mainshock, or the occurrence of aftershocks) and 38 turns (25%) were a mix of both physical and social components. That the turns, and turn types, were primarily social might be attributable to the make up of the group, the set-up of the exercise (including the choice of seed event) or a number of other factors, but suggests the importance of understanding social and qualitative components of disasters.
Participants used various approaches to justify that their turns were both plausible (or not significantly less likely than the original event) and downward (i.e., would actually worsen the scenario). References to other disasters were the most common form of justification, including references to participants’ understanding about how something had happened or was done in a particular place (43 references) or references to a specific disaster or hazard case study (104 references). Participants also used their own disciplinary expertise (90 references), regional understanding of the Eastern Mediterranean (146 references, which included references to regional information in the briefing document) and lived or anecdotal experience (47 references).
42 unique case studies were referenced, several of them by more than one group. The characteristics of 13 other events were referred to, but the names of these case studies or their locations were not mentioned. Table 1 shows events that were talked about in at least three of the groups, with the full list of cases studies given in Supplementary Document S4.
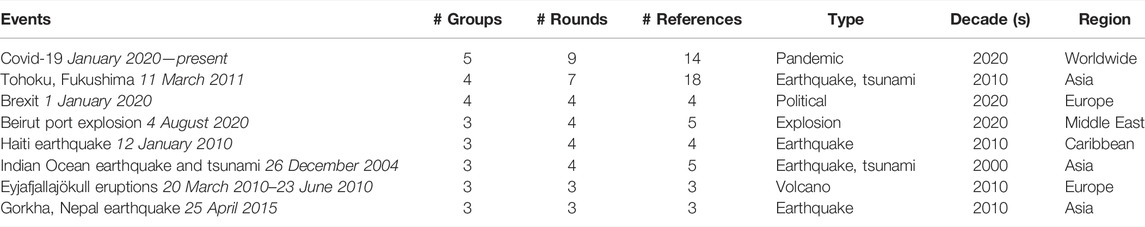
TABLE 1. Specific case studies referred to by three or more groups (Section 3.4). The full list of case studies used is available in Supplementary Document S4. The Gorkha, Nepal earthquake was mentioned as an example in the briefing presentation.
The case studies were not only previous earthquakes, although these were the most common (14 separate events including two earthquakes/tsunamis), but also volcanic eruptions, hurricanes, infectious diseases and non-natural hazards including conflict, terrorism and economic crashes (with four or fewer separate case studies in each of these categories, Supplementary Table S1). These case studies were geographically diverse, though not evenly distributed, with the majority from Asia and Europe (Supplementary Table S2).
Case studies were used to justify turns being “downward” (i.e., making the scenario worse), as the following example shows:
Convenor: “[Speaker 1] raised the point about the roads, is that from a human loss perspective, what would be the direct impact of the loss of the road network?”
Speaker 2: “That was a huge issue in Haiti [after the 2010 earthquake]. Because a whole part of the island got cut off, and they couldn’t get relief in and people are getting sick, and cholera and stuff was spreading, and they couldn’t get their health stuff and couldn’t get the food or that can significantly affect fatalities.”
Perhaps due to the qualitative nature of the workshop, the idea emerged in multiple groups that a counterfactual change was “satisfactorily real” (Lin et al., 2020) if it had occurred in a previous disaster, as seen in the following discussion:
Speaker 1: “Is that possible from a geology perspective? To put it somewhere … like beside a nice island in the Pacific, where it could potentially take out a complete society and culture?”
Speaker 2: “so that actually did happen. But it … was an earthquake combined with a volcanic eruption. So you had the Minoan civilisation that was, like, wrecked by this, this massive, massive eruption of Santorini in Greece. And so if you change it from being a tectonically-controlled earthquake and tsunami, to a volcanically-controlled situation, again, less likely, but like that has happened.’
We term such scenarios, composed of the worst parts of past disasters, “counterfactual Chimaeras,” after the legendary Greek monster which is part lion, goat and serpent (Homer, n.d.).
Analogues can be both spatial and temporal. The majority of the events referred to occurred recently (Supplementary Table S3), with 29 of the case studies (70%) having occurred since 2000. Only one event referred to occurred pre-1900, which was the Santorini eruption of around 1600 BCE (referred to above).
Whilst the main aim of this study is to explore how qualitative approaches and storytelling might be used in downward counterfactual analysis, it is also instructive to assess whether the scenarios developed bear any relation to risks which have already been recognised in the Eastern Mediterranean. A detailed comparison is beyond the scope of this paper but the themes and turns discussed are intended to give insight into how useful, and realistic, some of the downward counterfactual turns proposed were.
Both this exercise, and the work of previous authors (e.g., Tinti et al., 2005; Synolakis et al., 2011; England et al., 2015) suggest that any major earthquake and tsunami in the Eastern Mediterranean under current conditions is likely to lead to a disaster. A series of recent earthquakes (Heidarzadeh et al., 2017; Papadopoulos et al., 2020; UNESCO, 2020) have demonstrated issues with both the timeliness of tsunami alerts (IOC, 2020; Papadopoulos et al., 2020) and regional tsunami awareness (Yalçıner et al., 2017). These issues are consistent with the frequently repeated turn “lack of (timely) warning” in our workshop (Figure 6), and with discussion about failure to prepare (e.g. convenor C, participant choice round, Supplementary Document S3).
The temporal and spatial scale of the evolved scenarios might seem extreme (and there are certainly issues with the simplistic causality implied; Section 4.4), but the plausibility of several such turns is supported by previous risk analyses across multiple sectors and events after the workshop. One proposed turn which merits particular attention is damage or disruption to the Suez Canal, which was discussed by three separate groups. Some of the possible outcomes of such a blockage proposed by the groups in our workshop were: major disruption to international trade, food shortages, and oil bidding wars. The morning after our workshop took place, on Tuesday 23 March 2021, the vessel Ever Given became stuck in the Suez Canal, blocking all ships from moving through the canal for 6 days (Reality Check and Visual Journalism, 2021). Although the full scale of the impacts are not yet known, the blockage has indeed had significant impacts on trade (Ramos et al., 2021), and complex legal ramifications (Gaunt and Aston, 2021, 41:30). Such legal disputes, resulting from uncertain liability and whether or not an event constitutes force majeure (or in this case “perils of the sea”) were also proposed as a downward counterfactual in the context of the earthquake and tsunami in our workshop, suggesting that some of the seemingly improbable or high impact turns may be sensible to consider in risk analysis. However, the full scale of cascading events from a blockage of the Suez Canal proposed in our workshop (including food shortages, “pathological economic behaviour” and the collapse of the global reinsurance industry) have not, or, at least, not yet, occurred. These proposals can be considered downward counterfactuals for a blockage of the Suez Canal.
Financial instability at the EU level (Section 3.1) might also seem to be an extreme consequence of an earthquake and tsunami. However, the impacts of austerity measures imposed on Greece in the wake of the financial crisis (Matsaganis, 2011) has diminished the country’s capacity to maintain reserves against the event of a disaster (International Bank for Reconstruction and Development/The World Bank, 2021). A recent analysis of EU member states’ financial exposure to seismic hazard (International Bank for Reconstruction and Development/The World Bank, 2021) suggests that currently available EU disaster funds cover less than 4% of the annual expected government losses due to earthquakes. In the event of a major disaster, therefore, or cascading disasters (as discussed in our scenario building) there might indeed be major EU-scale financial ramifications (International Bank for Reconstruction and Development/The World Bank, 2021). The two examples above demonstrate the potential cascade of consequences from such a hazard event, and that scenarios with unquantifiable impacts may nonetheless represent significant risks.
Many of the themes which arose, including relations between Greece and Turkey and precarious financial relations between Greece and the EU, related to the current geopolitical situation or what might be considered “common knowledge” about the Eastern Mediterranean, in the sense of stories which have recently been in the news, or lived and anecdotal experience (Section 3.4). Two examples, which were discussed in all groups, are worth mentioning: tourism (particularly the potential exposure of tourists unaware of the regional earthquake and tsunami hazard, and the long term financial impacts of reduced tourism after such a disaster), and refugees and migration (including the vulnerability of coastal refugee camps on the Greek islands, as well as longer term displacement; e.g., Moris and Kousoulis, 2017). Both of these turns highlight known vulnerabilities (Arce et al., 2017; Alam et al., 2020; IOC, 2020), and systemic factors influencing the desire or ability of affected populations to mitigate the impacts of a potential disaster. The divide between known risks and appropriate risk reduction measures is evident in the Eastern Mediterranean, where the tsunami warning system (NEAMTWS; IOC, 2020) only began to be established after the Sumatra 2004 earthquake and tsunami brought tsunamis into the public consciousness globally, though academics had highlighted the risk of Mediterranean tsunamis for a least a decade beforehand (e.g., Tinti, 1993).
The turns above, based on contemporary regional knowledge, and repeated turns related to pandemics and countries leaving the EU, lead us to suggest that repeated turns in our workshop were more often related to current events or regional common knowledge than the probability of a particular turn or its likely impacts. Although we did not perform the same exercise prior to the Covid-19 pandemic or the United Kingdom leaving the European Union (on 1st January 2021, and still central to United Kingdom news at the time of the workshop, Adler, 2021), it seems unlikely that a pandemic, or the breakdown of the European Union and the associated loss of communal disaster response mechanisms, would have occupied so much of the discussion either at an earlier time or, in the latter case, outside the United Kingdom. One participant reflected:
“I got blindsided by thinking about the current situation of the world. I was like, Oh, yeah, we’ve got this major pandemic. We’ve got this like, migration crisis going on, we’ve got climate change and everything else worsening like, especially coastal community. Also [the] EU [is] struggling, like, these larger geopolitical things, it’s already pretty bad, in terms of comorbidities.”
The dominance of repeated turns by those which are contemporary, rather than those which are likely, suggests that simple quantification of a discursive risk analysis may not capture the desired information.
We observed a similar tempophilia (the prioritisation of current time in thinking about potential futures, Kelman et al., 2017, also referred to as the “availability heuristic” in psychology; Tversky and Kahneman, 1973) in the case studies invoked as justifications (Section 3.4), which were dominantly from the last 20 years. This focus on the contemporary might mean that insights from older events are missed, and lead to the fallacy of planning for the most recent disaster, rather than anticipating the next (Ewing and Synolakis, 2011; Paté-Cornell, 2012).
The scenarios generated in this workshop, therefore, have components consistent with pre-existing analyses of risk in the Eastern Mediterranean, but have a greater emphasis on unquantifiable risks, and are, therefore, potentially useful in identifying risks which might not currently be considered in individual risk analyses.
The above examples demonstrate that the scenarios constructed in our workshop capture known risks in the Eastern Mediterranean and provide connections between others. We now look at the role of interdisciplinary groups in developing scenarios.
Unique turns, which express ideas only thought of by a single participant, frequently came from participants’ specific experience or disciplinary backgrounds, suggesting that using interdisciplinary groups to conduct downward counterfactual analysis may broaden the range of identified scenarios. Some examples from this exercise include: rumours spreading on social media leading to instability in financial markets (specifically, “social networks [report] that Elon Musk, Mark Zuckerberg, the president of Greece and the president of Egypt are missing [as a result of the earthquake/tsunami]”), the loss of household and government records, and a deliberate misinformation campaign which could “lead to … loss of trust in the government, in the authorities, and therefore [lack of] willingness of the public … to respond to advice and communications in a … cohesive way”. The idea that particularly useful perspectives come from unique turns and varied expertise is consistent with Durance and Godet (2010)’s observation that “insofar as an expert represents a fresh perspective, his or her point of view should be taken into consideration.”
Several participants appealed to the known expertise of others in their group, as shown in the quotes in Section 3.4. Such interactions support the idea that a group discussion provides a greater diversity and depth of knowledge than an individual person conducting this exercise on their own (Lewis and Herndon, 2011), and provides a check on the possibility of proposed counterfactuals. These interactions also suggest that it was useful to have groups small enough to remember the other participants’ backgrounds. Our observations of group dynamics lead us to suggest that future downward counterfactual analyses, whether in a financial risk context or for DRR, should include interdisciplinary perspectives to broaden the range of imagined scenarios.
Several groups highlighted the importance of including local stakeholders, rather than only interdisciplinary academics, in future downward counterfactual analyses. Including stakeholders, such as residents and Civil Protection Agencies, could help both to better understand the complex factors leading to disasters and to engage local communities in understanding and mitigating disaster risk. The idea of including local stakeholders was based on the implicit assumption, common to most groups, that downward counterfactual analysis was intended for understanding future disasters with the aim of building resilient communities, rather than improving financial loss models (Woo, 2016; Woo et al., 2017). This assumption was demonstrated by one participant’s comment that, “if [downward counterfactual analysis] was used as a methodology it would be local experts doing it”. Whilst the value of local knowledge is widely recognised in DRR (e.g., Donovan et al., 2012), in the financial and (re)insurance sectors such an exercise might only be conducted by risk analysts.
Local stakeholders might also bring more detailed knowledge of the seemingly minor factors which can significantly worsen a disaster. A specific example from the exercise was that one participant said, “the way the [Greek] Civil Protection Authority is alerted [to a tsunami warning] is by fax” (a proposal confirmed by Papadopoulos et al., 2020, though it is not clear whether faxes operate in isolation as a warning mechanism or in combination with emails) leading to a discussion of specific failures associated with non-standard or outdated technologies. Conducting the analysis with local stakeholders would acknowledge the humanity and fallibility of traditional “experts” (Donovan, 2019) and could uncover additional context-specific vulnerabilities (e.g., Jigyasu, 2019). At the same time, it is important not to “romanticise” the knowledge of local people (Hilhorst, 2003).
There might also be benefits to including other forms of knowledge in downward counterfactual analysis beyond increasing the range of anticipated risks. One participant suggested that “you could do this as an educational exercise,” making the experience about the participants understanding the interconnected nature of disasters, rather than the actual scenarios (similar to the proposal of Gill and Malamud, 2014; Mignan et al., 2016, that risk mapping could be used to engage educators). Another participant commented:
“maybe the outcome is less important than … getting the different stakeholders and the group together, talking about all the things that could happen … potentially, it’s a very useful exercise to get people to think about it differently.”
These comments lead us to suggest that downward counterfactual analysis could be used in a wide range of settings. Scenarios should not be seen as the only potential output of such an exercise, the process and communication involved in conducting downward counterfactual analysis could itself be beneficial.
The workshop generated a wide variety of downward counterfactuals, and, perhaps more importantly, conversation between participants. There were very few instances of participants passing on taking a turn, and, as discussed above, many appealed to the expertise of different group members and commented that they enjoyed the interactions. There were, however, a number of challenges, both in conducting the exercise and in the subsequent analysis. We now discuss some of these challenges and possible resolutions, which might be useful for conducting similar exercises in future.
In terms of the actual workshop, a significant challenge was convening comparably with different group dynamics. Although all convenors used the same, pre-agreed structure, there were slight differences in emphasis. As a result, some groups focused more on the relative likelihood of a turn occurring, whilst others concentrated on justifying that their turns were “downward” (i.e., made the scenario worse). These variations are likely to be an inevitable results of different people leading different groups in a conversational exercise (e.g., O’Brien, 2004). We note that convenors made slightly fewer turns than other participants, and that the proportion of “social” vs. “physical” turns did not correlate with the convenors’ subject areas. As such, we do not think that convenors influenced the direction of the counterfactuals more than other group members. Different group members and power dynamics did, however, lead to very different experiences of the exercise. Having slightly larger groups (e.g., Six participants) might have reduced the influence of individual participants on the group dynamic, although keeping groups small enough for participants to have a good sense of each others’ expertise is also important (Section 4.2). These variations also mean that a direct quantitative comparison, for example of the number of turns of each type, between groups would not be appropriate, or adequately capture the different group dynamics.
There were also points to consider for future applications in terms of the set up of the workshop, namely: how to specify the starting scenario, defining and measuring “downward” or “worse” and how to decide if a turn is “satisfactorily real” (Lin et al., 2020). All of these are (relatively) simple for a quantitative analysis focussing on a particular parameter, conducted by a single analyst or team of analysts. However, the idea that only quantifiably worse losses are relevant or significant has been posed as a critique of disaster databases and risk analysis in general (Kar-Purkayastha et al., 2011; Nissan et al., 2019), and exploring the introduction of non-quantifiable or intangible losses into downward counterfactual analysis was the main aim of our study. The exact approaches which would be appropriate will depend on the intended outcome of the exercise.
Instead of modelling the initial scenario to establish a baseline for conducting downward counterfactual analysis, as proposed by Lin et al. (2020), we used qualitative reports from the 365CE earthquake and tsunami (Shaw et al., 2008; Ambraseys, 2009) combined with current maps of exposure and population density (Figure 1B) to give participants a sense of the initial scenario. We told participants that we were “interested in understanding the potential impacts of a similar earthquake and tsunami occurring in the present day or near future” (Supplementary Document S1) i.e., in a generally contemporary setting. This lack of specificity, which was intended to allow participants to determine the direction of the exercise, led to some differences of interpretation. Different groups took different views on whether the scenario involved an earthquake on the day of our workshop, on the same day as in 365CE but in 2021, or a more generally contemporary event. There was also uncertainty about whether outcomes would be expected based on the seed event or would constitute further downward counterfactuals. As an example, one participant proposed, “loss of the infrastructure, infrastructure of the city. Buildings, roads, any public land being destroyed by the, by the tsunami and the earthquake” as a turn. Major infrastructural damage occurred event in the 365CE event (Shaw et al., 2008), so is not obviously a downward turn from the seed event. Several participants suggested that an in-person workshop with maps, note cards and other visualisation aids could help to clarify the starting scenario, and subsequent turns.
Such aids might also help to address the challenge of determining whether turns were “downward,” who for and on what scale. As one participant noted, “in some of the cases when we were trying to build on the previous person’s sort of contribution wasn’t always 100% clear how it did make it worse.” This issue likely reflects the broad scope of the exercise (Section 4.3) which was deliberately open to allow participants to use their wide range of expertise (and some participants felt was successful in doing so, as one noted, “by not binding it … I actually think we uncovered a far broader range of potential implications”). Even for quantifiable losses, such as casualties or financial losses, real-time modelling is still likely to be too time consuming for a discursive workshop. In any case, many of the downward counterfactuals, particularly in the participants’ choice round, were obviously incomparable in terms of their impacts, such as changes to Israel’s blockade of Gaza and the extinction of Mediterranean tuna. The ability to account for and consider such unquantifiable impacts which are not obviously comparable is a key feature of including stories in downward counterfactual analysis. Including such unquantifiable losses is also an expansion of storyline approaches in climate change planning, which focus on qualitative scenarios as opposed to probabilistic hazard mapping (Shepherd et al., 2018), but still consider quantifiable outcomes. It would, however, be useful to consider systematic ways of assessing what a “worse” scenario looks like in a qualitative context. One participant proposed that a constructive approach might be to conduct the analysis on the basis of one loss metric and subsequently analyse the impact of the resultant scenario on other metrics e.g., using more casualties as a definition of “worse” and then investigating the financial impacts of the resulting scenario.
Just as it was hard to determine what constituted a “downward” turn, there was a similar difficulty in defining which counterfactuals were sufficiently “plausible” or likely. The approach arrived at organically in our workshop was the construction of “counterfactual Chimaeras,” scenarios combining aspects of previous disasters. As one participant noted, “I kept drawing on historical examples just to make sure that it was … within the realms of what happens”. Such counterfactual Chimaeras may provide an interesting approach to setting bounds on the risks of interest, with the caveat that further consideration needs to be given to biases towards contemporary analogues. This tempophilia could be reduced by encouraging participants to actively draw upon less well-known examples in the justification of their choices.
What constitutes an acceptably “plausible” turn or scenario depends on the setting in which such an analysis is being conducted. A key advantage of conducting a downward counterfactual analysis in the manner we have described is freedom to be creative. As one participant put it, “it is more a kind of opportunity for idea generation, if you like, rather than necessarily a precise calculation of a possible scenario”. Thus, potentially unlikely turns might be interesting to explore in the context of bringing together stakeholders (Section 4.2), or for expanding the space of imagined risks, but be less useful for a more specific risk analysis, where the type of risk to be explored is already known, and, perhaps, quantifiable, as in the examples given by Lin et al. (2020). The level of choice given to participants in similar exercises in the future should depend on the intended outcome of the exercise, but it is important to note that an exercise using, for example, flash cards (cf. Shepherd et al., 2018) has already pre-determined the space of events which are considered possible, irrespective of whether the analysis is qualitative or quantitative.
The conversational nature of the exercise meant that many participants provided counterfactuals in an unstructured way e.g., stating multiple possible counterfactuals at once or not distinguishing between counterfactuals and their consequences, which made it difficult to clearly identify turns in our subsequent coding. Whether this is an issue for future workshops will depend on the intended outcome–a stricter turn system or notes detailing the scenario, could be used if scenario development is the main outcome, but this might be unnecessary if the main aim is to build communication between stakeholders (Section 4.2).
Much of our analysis focused on the turn types proposed by Lin et al. (2020). Whilst we appreciate that these turn types are not intended to be exhaustive, it was interesting to investigate their impacts on the exercise. It was helpful to have these turn types as a guide, and certainly as examples of the type of counterfactuals which might be proposed. However, our general reflection as coders was that the turn types proposed by Lin et al. (2020) do not have sufficient provision for systems or situations in place before a disaster, or reflect the nuances of such systems (categorising all such turns as “socio-political change”). Many instances of multiple turn types arose from the socially constructed nature of disasters (Cannon, 2008; Oliver-Smith, 2010) meaning that turns altering the hazard are frequently associated with a social change (such as exposure), and also from the discursive nature of the exercise. The issue of how to incorporate the social construction of disasters might, however, relate more to downward counterfactual analysis as a methodology (which we discuss further in Section 4.4) than the turn types themselves, since in their original definitions Lin et al. (2020) specify that socio-political change and environment are meant to apply to the pre-existing conditions under which a hazard occurs.
We now discuss some of the underlying assumptions and issues with downward counterfactual analysis as an approach, based on this workshop and our observations.
The prevalence of cascading events in our scenarios suggests that participants saw the hazard event as the starting point of the counterfactual, both as the incident connected to historical reality and as a temporal beginning to the disaster (Hewitt, 2019, pp.5). Starting with a “seed event” (whether natural or not) presupposes a single starting point, and a disaster which unfolds from that point, whether or not this is the intention of the analysis. Thus, despite Woo (e.g., 2019) theoretically recognising that there are no natural disasters (O’Keefe et al., 1976), the framing of downward counterfactual analysis inherently privileges post-hazard evolution, rather than the pre-existing social factors and systems which enable the hazard to evolve into a disaster (Blaikie et al., 1994; Cannon, 2008; Oliver-Smith, 2010).
The use of cascading events to construct a linear narrative of how events might unfold or progressively worsen also stems from a logic of assumed causality, where the actual connection between events is not clear. Indeed, as Kelman (2018) argues, the concept of cascading disasters often imposes false “start” points that neglect the long term process of vulnerability, suggesting that the various loops and overlaps between events over time can be precisely indicated, contrary to many studies of disasters (Hewitt, 1997; Lewis, 1999). Mignan et al. (2016) give the examples of linking earthquakes to disease outbreaks as an incorrect application of cascading models in that although earthquakes are frequently associated with outbreaks of disease there are necessary causal links (such as damage to, and subsequent contamination of, water systems) which are missed through this direct connection. In our exercise, links between the earthquake and tsunami and disease outbreaks were made explicit in all cases, citing inundation of sewage systems as a result of the tsunami, exposure of sewage plants close to sea level and poor water infrastructure in refugee camps. However, in other cases the causality was less clear, for example two groups had the collapse of the eurozone in their financial round, and a further two groups proposed the collapse of the reinsurance industry, potentially leading to “more systemic issues for … the global financial system”. In all these cases, financial collapse was arrived at based on the large scale of the impact and damage, and concerns about Greek national debt (perhaps based on the Greek financial crisis which threatened the eurozone from 2009, Matsaganis, 2011). These concerns are shared by EU analysts (International Bank for Reconstruction and Development/The World Bank, 2021, see discussion in Section 4.1) but the chain of causality would likely be more complex than those proposed. This limited exploration of causality is important to acknowledge in conducting downward counterfactual analyses, since the role of scenario development is less to predict or precisely envisage futures than to explore the impacts of current actions on future risk (e.g., Durance and Godet, 2010; Shepherd, 2019).
That these cascading scenarios managed to reach global scales in relatively few turns in part reflect a tendency to overlook mitigation or resilience in constructing downward counterfactuals. Possible actions alleviating the inferred causal connections were discussed in several groups and used to challenge particular turns (detailed in the notes in the round summaries in Supplementary Document S3). Participants also discussed generating potential mitigating measures as a key component of encouraging governments and other stakeholders to take an interest in, and act on, such scenarios. Indeed, in disaster risk reduction the motivation for building scenarios is not to identify what will happen but rather to identify key weaknesses or points where advance action might reduce risk. Qualitative downward counterfactual analysis could provide a method to empower stakeholders to understand their current vulnerabilities and the origins of these vulnerabilities. However, anticipating future risks will not in itself prevent them from occurring (in contrast to Taleb’s statement that “11 September 2001: had the risk been conceivable on September 10, it would not have happened”; Taleb, 2007, p. xix).
These issues of causality and connectedness point to one of the key motivations for including stories in downward counterfactual analysis. Many of the turns made have multiple implications, and it is often in the proposed impacts, rather than the turns themselves that we observe the unexpected (at least to us). Whilst it is clear how moving the earthquake to a bank holiday weekend could be included in a casualty model on the basis of the average numbers of tourists in Crete at a particular time of year, the logic for this counterfactual in one of our discussions was that the decision makers in the civil protection agency might also be on holiday and difficult to contact, with associated (and much less easily quantifiable) impacts on both tsunami warning and the emergency response. Similarly, though the number of casualties associated with schools collapsing could be estimated, the long term psycho-social impacts of the deaths of large numbers of young people cannot (Woo, 2019).
The complexity and intangibility of both the risks and the causal links between aspects of disasters highlights the need to move beyond using only quantifiable knowledge in downward counterfactual analysis. Our results demonstrate that some aspects of a discursive exercise, such as the number of each type of turn, can be quantified, but with many caveats. The analysis, even of this relatively simple aspect of discussion, is subjective (although turns and most turn types were agreed upon, each return to the data has yielded new complexities and uncertainties). Further, the numbers do not necessarily convey the information that we might have sought (as with the number of repeats of each turn being more related to current events and regional knowledge than the actual likelihood of the turn). Finally, such quantification fails to capture the nuances and impacts of turns. We conclude that quantifying stories is unlikely to be the best approach to including them in downward counterfactual analysis, but that familiarity with multiple narratives and forms of knowledge will lead to a wider range of scenarios. The importance of recognising and valuing diverse forms of knowledge is consistent with work in DRR emphasising the importance of multiple epistemologies for community engagement (Donovan et al., 2012).
We therefore propose three possible extensions to the current study, which are beyond the scope of this work. The first is to investigate the likelihoods and quantitative impacts of those turns which can be quantified, e.g., loss of life due to disease outbreaks or exposure in refugee camps. The second is to identify mitigation measures for those counterfactuals which are not purely related to the hazard. The third, is the broader “gamification” of the downward counterfactual approach. Given the inherent creativity of interdisciplinary groups and our discussion in Section 4.2 of the importance of engaging stakeholders and using other kinds of knowledge, an interesting extension would be to build a game, accessible to a broad range of participants, which could be used to explore downward counterfactuals. A major challenge in such “gamification” would be how to simultaneously limit scenarios to those which are plausible whilst harnessing the creativity of a wider community.
We have conducted a downward counterfactual analysis of the 365CE Cretan earthquake and tsunami with five groups of interdisciplinary researchers, using different meanings of “worse” to build scenarios. We find that there is a strong emphasis on recent and current events in the proposed counterfactuals, which may be disproportionate to their likelihood or potential impact. Nonetheless, many of the proposed scenarios provide potential starting points for more in-depth risk analysis in the Eastern Mediterranean. We coin the term “counterfactual Chimaera” to refer to a potential future disaster composed of the worst elements of past ones, based on the extensive use of case studies to justify downward counterfactuals. We find that using interdisciplinary groups is helpful in investigating a broad range of scenarios but that the analysis would likely be improved by involving local or regional stakeholders. Our results clearly demonstrate that intangible or unquantifiable aspects of disaster risk should not be neglected, and this paper provides a first contribution towards their inclusion in downward counterfactual analysis.
The datasets presented in this article are not readily available because participants might be identifiable from their contributions (consistent with the ethical approval for this study). The progression of scenarios is shown in the Supplementary Material and further details are available on request to the authors. Requests to access the datasets should be directed to CP, Y3A0NTFAY2FtLmFjLnVr.
The studies involving human participants were reviewed and approved by Department of Geography, University of Cambridge, Cambridge, United Kingdom (#1848). Written informed consent for participation was not required for this study in accordance with the national legislation and the institutional requirements.
All authors were involved in the design of the study. CP, HB, RW, HvS, and AT acted as workshop convenors, SD as a participant. CP, RW, HB, HvS, and SD contributed to the coding and data analysis. CP wrote the manuscript and made the figures. RW and HB wrote sections of the manuscript, which was also edited by SD and HvS. All authors read and approved the submitted manuscript.
CP was supported by a Junior Research Fellowship from Queens’ College, University of Cambridge, United Kingdom RW is funded through the ERC (ERC grant no. 804162). HB is part of the Expertise Under Pressure project, which is part of the Centre for Research in Arts, Social Science and Humanities, Cambridge, funded by The Humanities and Social Change International Foundation. No funding was received to support this project.
SD was formerly employed by Frontiers.
The remaining authors declare that the research was conducted in the absence of any commercial or financial relationships that could be construed as a potential conflict of interest.
All claims expressed in this article are solely those of the authors and do not necessarily represent those of their affiliated organizations, or those of the publisher, the editors and the reviewers. Any product that may be evaluated in this article, or claim that may be made by its manufacturer, is not guaranteed or endorsed by the publisher.
The authors would like to thank all of the workshop participants for contributing their time, knowledge and interesting ideas. We would also like to thank three reviewers for their constructive reviews, which helped improve the quality of the manuscript. Figure 1 was produced using the Generic Mapping Tools (Wessel et al., 2019). Figure 3 was produced in Canva (https://www.canva.com/; last accessed 14-07-2021). All other figures were produced using jupyter notebook (Kluyver et al., 2016) and seaborn (Waskom, 2021).
The Supplementary Material for this article can be found online at: https://www.frontiersin.org/articles/10.3389/feart.2022.742016/full#supplementary-material
Aktas, Y., O’Kane, A., Ozden, A. T., Köşker, A., Vatteri, A. P., Durmaz, B., et al. (2021). The Aegean Earthquake and Tsunami of 30 October 2020. Tech. Rep. EEFIT.
Alam, A., Sammonds, P., and Ahmed, B. (2020). Cyclone Risk Assessment of the Cox's Bazar District and Rohingya Refugee Camps in Southeast Bangladesh. Sci. Total Environ. 704, 135360. doi:10.1016/j.scitotenv.2019.135360
Altinok, Y., and Ersoy, Ş. (2000). Tsunamis Observed on and Near the Turkish Coast. Nat. Hazards 21, 185–205. doi:10.1023/a:1008155117243
Ambraseys, N. (2009). “Catalogue of Earthquakes,” in Earthquakes in the Mediterranean and Middle East (Cambridge: Cambridge University Press), Vol. 136, 60–814. doi:10.1017/CBO9781139195430.004
Arce, R. S. C., Onuki, M., Esteban, M., and Shibayama, T. (2017). Risk Awareness and Intended Tsunami Evacuation Behaviour of International Tourists in Kamakura City, Japan. Int. J. Disaster Risk Reduction 23, 178–192. doi:10.1016/j.ijdrr.2017.04.005
Aspinall, W., and Woo, G. (2019). Counterfactual Analysis of Runaway Volcanic Explosions. Front. Earth Sci. 7, 1–15. doi:10.3389/feart.2019.00222
Blaikie, P., Cannon, T., Davis, I., and Wisner, B. (1994). At Risk. taylor & f edn. London: Routledge.
Cannon, T. (2008). Vulnerability, “Innocent” Disasters and the Imperative of Cultural Understanding. Disaster Prev. Manag. Int. J. 17, 350–357. doi:10.1108/09653560810887275
[Dataset] Center for International Earth Science Information Network - CIESIN - Columbia University (2018). Gridded Population of the World, Version 4 (GPWv4): Population Count, Revision 11. doi:10.7927/H4JW8BX5
Chtouris, S., and Miller, D. S. (2017). Refugee Flows and Volunteers in the Current Humanitarian Crisis in Greece. J. Appl. Security Res. 12, 61–77. doi:10.1080/19361610.2017.1228025
Creswell, J. W., and Creswell, J. D. (2017). Research Design: Qualitative, Quantitative, and Mixed Methods Approaches. London: SAGE Publications Ltd.
Cruz, A. M., Krausmann, E., and Franchello, G. (2011). Analysis of Tsunami Impact Scenarios at an Oil Refinery. Nat. Hazards 58, 141–162. doi:10.1007/s11069-010-9655-x
Degroot, D., Anchukaitis, K., Bauch, M., Burnham, J., Carnegy, F., Cui, J., et al. (2021). Towards a Rigorous Understanding of Societal Responses to Climate Change. Nature 591, 539–550. doi:10.1038/s41586-021-03190-2
Donovan, A. (2019). Critical Volcanology? Thinking Holistically about Risk and Uncertainty. Bull. Volcanol 81, 20. doi:10.1007/s00445-019-1279-8
Donovan, A., Oppenheimer, C., and Bravo, M. (2012). Social Studies of Volcanology: Knowledge Generation and Expert Advice on Active Volcanoes. Bull. Volcanol 74, 677–689. doi:10.1007/s00445-011-0547-z
Durance, P., and Godet, M. (2010). Scenario Building: Uses and Abuses. Technol. Forecast. Soc. Change 77, 1488–1492. doi:10.1016/j.techfore.2010.06.007
England, P., Howell, A., Jackson, J., and Synolakis, C. (2015). Palaeotsunamis and Tsunami Hazards in the Eastern Mediterranean. Phil. Trans. R. Soc. A. 373, 20140374. doi:10.1098/rsta.2014.0374
Ewing, L., and Synolakis, C. (2011). Coastal Resilience: Can We Get beyond Planning the Last Disaster? Solutions to Coastal Disasters 2011, 233–245.
[Dataset] Gaunt, I., and Aston, C. (2021). Maritime Arbitration, the LMAA and the Suez Canal/Ever Given Case Study.
Gibbs, G. R. (2018). Analyzing Qualitative Data. London: SAGE Publications Ltd. doi:10.4135/9781526441867
Gill, J. C., and Malamud, B. D. (2014). Reviewing and Visualizing the Interactions of Natural Hazards. Rev. Geophys. 52, 680–722. doi:10.1002/2013RG000445
Glantz, M. H. (1996). “Forecasting by Analogy: Local Responses to Global Climate Change,” in Adapting to Climate Change (New York, NY: Springer New York), 407–426. doi:10.1007/978-1-4613-8471-7_35
Hayes, G. P., Wald, D. J., and Johnson, R. L. (2012). Slab1.0: A Three-Dimensional Model of Global Subduction Zone Geometries. J. Geophys. Res. 117, a–n. doi:10.1029/2011JB008524
Heidarzadeh, M., Necmioglu, O., Ishibe, T., and Yalciner, A. C. (2017). Bodrum-Kos (Turkey-Greece) Mw 6.6 Earthquake and Tsunami of 20 July 2017: a Test for the Mediterranean Tsunami Warning System. Geosci. Lett. 4, 31. doi:10.1186/s40562-017-0097-0
Hewitt, K. (2019). Interpretations of Calamity. 1st edn. London: Routledge. doi:10.4324/9780429329579
Hilhorst, D. (2003). Responding to Disasters: Diversity of Bureaucrats, Technocrats and Local People. Int. J. Mass Emergencies Disasters 21, 37–55.
Howell, A., Jackson, J., Copley, A., McKenzie, D., and Nissen, E. (2017). Subduction and Vertical Coastal Motions in the Eastern Mediterranean. Geophys. J. Int. 211, 593–620. doi:10.1093/gji/ggx307
International Bank for Reconstruction and Development/The World Bank (2021). Financial Risk and Opportunities to Build Resilience in Europe. Tech. Rep.
IOC (2020). Tsunami Warning and Mitigation Systems to Protect Coastal Communities: Tsunami Early Warning and Mitigation System in the North-Eastern Atlantic, the Mediterranean and Connected Seas ( NEAMTWS ). Tech. Rep.
Jackson, J., and McKenzie, D. (1988). The Relationship between Plate Motions and Seismic Moment Tensors, and the Rates of Active Deformation in the Mediterranean and Middle East. Geophys. J. Int. 93, 45–73. doi:10.1111/j.1365-246x.1988.tb01387.x
Jacques, F., and Bousquet, B. (1984). Le raz de marée du 21 juillet 365. [Du cataclysme local à la catastrophe cosmique]. mefr 96, 423–461. doi:10.3406/mefr.1984.1412
Jigyasu, R. (2019). “Reducing Disaster Vulnerability through Local Knowledge and Capacity,” in The Cultural Turn in International Aid. 1st edn. (London: Routledge), 15. doi:10.4324/9781351208598-12
Kar-Purkayastha, I., Clarke, M., and Murray, V. (2011). DEALING with DISASTER DATABASES - what CAN WE LEARN from HEALTH and SYSTEMATIC REVIEWS? Application in Practice. Plos Curr. 3, RRN1272. doi:10.1371/currents.RRN1272
Kelman, I. (2018). Connecting Theories of Cascading Disasters and Disaster Diplomacy. Int. J. Disaster Risk Reduction 30, 172–179. doi:10.1016/j.ijdrr.2018.01.024
Kelman, I. (2014). No Change from Climate Change: Vulnerability and Small Island Developing States. Geographical J. 180, 120–129. doi:10.1111/geoj.12019
Kelman, I., Upadhyay, H., Simonelli, A. C., Arnall, A., Mohan, D., Lingaraj, G. J., et al. (2017). Here and Now: Perceptions of Indian Ocean Islanders on the Climate Change and Migration Nexus. Geografiska Annaler: Ser. B, Hum. Geogr. 99, 284–303. doi:10.1080/04353684.2017.1353888
Kluyver, T., Ragan-Kelley, B., Pérez, F., Granger, B., Bussonnier, M., Frederic, J., et al. (2016). Jupyter Notebooks—A Publishing Format for Reproducible Computational Workflows. Comput. Eng. Des. Group 2016, 87–90. doi:10.3233/978-1-61499-649-1-87
Lewis, J. (1999). Development in Disaster-Prone Places. Rugby, Warwickshire, UK: Practical Action Publishing. doi:10.3362/9781780442013
Lewis, K., and Herndon, B. (2011). Transactive Memory Systems: Current Issues and Future Research Directions. Organ. Sci. 22, 1254–1265. doi:10.1287/orsc.1110.0647
Lin, Y. C., Jenkins, S. F., Chow, J. R., Biass, S., Woo, G., and Lallemant, D. (2020). Modeling Downward Counterfactual Events: Unrealized Disasters and Why They Matter. Front. Earth Sci. 8, 1–16. doi:10.3389/feart.2020.575048
Lin, Y., Lallemant, D., and Jenkins, S. (2019). “Counterfactual Black Swans Workshop Summary Report,” in Counterfactual Black Swans Workshop.
Matsaganis, M. (2011). The Welfare State and the Crisis: the Case of Greece. J. Eur. Soc. Pol. 21, 501–512. doi:10.1177/0958928711418858
Mignan, A., Scolobig, A., and Sauron, A. (2016). Using Reasoned Imagination to Learn about Cascading Hazards: a Pilot Study. Disaster Prev. Manage. 25, 329–344. doi:10.1108/DPM-06-2015-0137
Moris, D., and Kousoulis, A. (2017). Refugee Crisis in Greece: Healthcare and Integration as Current Challenges. Perspect. Public Health 137, 309–310. doi:10.1177/1757913917726019
Necmioglu, O., and Özel, N. M. (2015). Earthquake Scenario-Based Tsunami Wave Heights in the Eastern Mediterranean and Connected Seas. Pure Appl. Geophys. 172, 3617–3638. doi:10.1007/s00024-015-1069-y
Nissan, H., Goddard, L., de Perez, E. C., Furlow, J., Baethgen, W., Thomson, M. C., et al. (2019). On the Use and Misuse of Climate Change Projections in International Development. Wires Clim. Change 10, 1–16. doi:10.1002/wcc.579
Nunn, P. D. (2014). Geohazards and Myths: Ancient Memories of Rapid Coastal Change in the Asia-Pacific Region and Their Value to Future Adaptation. Geosci. Lett. 1, 3. doi:10.1186/2196-4092-1-3
O'Keefe, P., Westgate, K., and Wisner, B. (1976). Taking the Naturalness Out of Natural Disasters. Nature 260, 566–567. doi:10.1038/260566a0
O’Brien, F. A. (2004). Scenario Planning - Lessons for Practice from Teaching and Learning. Eur. J. Oper. Res. 152, 709–722. doi:10.1016/S0377-2217(03)00068-7
Oliver-Smith, A. (2010). Haiti and the Historical Construction of Disasters. NACLA Rep. Americas 43, 32–36. doi:10.1080/10714839.2010.11725505
O’Mahony, S. (2018). Medicine and the McNamara Fallacy. J. R. Coll. Physicians Edinb. 47, 281–287. doi:10.4997/JRCPE.2017.315
Papadopoulos, G. A., Lekkas, E., Katsetsiadou, K.-n., Rovythakis, E., and Yahav, A. (2020). Tsunami Alert Efficiency in the Eastern Mediterranean Sea: The 2 May 2020 Earthquake (Mw6.6) and Near-Field Tsunami South of Crete (Greece). GeoHazards 1, 44–60. doi:10.3390/geohazards1010005
Paté-Cornell, E. (2012). On "Black Swans" and "Perfect Storms": Risk Analysis and Management when Statistics Are Not Enough. Risk Anal. 32, 1823–1833. doi:10.1111/j.1539-6924.2011.01787.x
Pirazzoli, P. A., Laborel, J., and Stiros, S. C. (1996). Earthquake Clustering in the Eastern Mediterranean during Historical Times. J. Geophys. Res. 101, 6083–6097. doi:10.1029/95jb00914
Ramos, K. G., Rocha, I. C. N., Cedeño, T. D. D., Dos Santos Costa, A. C., Ahmad, S., Essar, M. Y., et al. (2021). Suez Canal Blockage and its Global Impact on Healthcare amidst the COVID-19 Pandemic. Int. Maritime Health 72, 145–146. doi:10.5603/IMH.2021.0026
Schenk, G. (2015). “Learning from History”? Chances, Problems, and Limits of Learning from Historical Natural Disasters,” in Culture and Disasters: Understanding Cultural Framings in Disaster Risk Reduction. Editors F. Krüger, G. Bankoff, T. Cannon, B. Orlowski, and E. L. F. Schipper (London: Routledge), 72–88.
Shaw, B., Ambraseys, N. N., England, P. C., Floyd, M. a., Gorman, G. J., Higham, T. F. G., et al. (2008). Eastern Mediterranean Tectonics and Tsunami hazard Inferred from the AD 365 Earthquake. Nat. Geosci 1, 268–276. doi:10.1038/ngeo151
Shaw, S. (2014). “Black Swans Are Red Herrings,” in 17th Annual International Symposium (College Station, Texas: TEES), 1.
Shepherd, T. G., Boyd, E., Calel, R. A., Chapman, S. C., Dessai, S., Dima-West, I. M., et al. (2018). Storylines: an Alternative Approach to Representing Uncertainty in Physical Aspects of Climate Change. Climatic Change 151, 555–571. doi:10.1007/s10584-018-2317-9
Shepherd, T. G. (2019). Storyline Approach to the Construction of Regional Climate Change Information. Proc. R. Soc. A. 475, 20190013. doi:10.1098/rspa.2019.0013
Stein, S., and Friedrich, A. M. (2014). How Much Can We clear the crystal ball? Astron. Geophys. 55, 11–217. doi:10.1093/astrogeo/atu076
Stevens, V. L., and Avouac, J. P. (2016). Millenary M W > 9.0 Earthquakes Required by Geodetic Strain in the Himalaya. Geophys. Res. Lett. 43, 1118–1123. doi:10.1002/2015GL067336
Synolakis, C., Kalligeris, N., Flouri, E., and Alexandrakis, G. (2011). The Great Cretan Splash Up-A Coastal Disaster Preparedness Exercise in Greece. Solutions to Coastal Disasters, 233–245. doi:10.1061/41185(417)35
Tinti, S., Armigliato, A., Pagnoni, G., and Zaniboni, F. (2005). Scenarios of Giant Tsunamis of Tectonic Origin in the Mediterranean. ISET J. Earthquake Technol. 42, 171–188.
Tinti, S. (1993). Evaluation of Tsunami Hazard in Calabria and Eastern Sicily, Italy. Dordrecht: Springer Netherlands, 141–157. doi:10.1007/978-94-017-3620-6_12Evaluation of Tsunami Hazard in Calabria and Eastern Sicily, Italy
Tironi, M., and Manríquez, T. (2019). Lateral Knowledge: Shifting Expertise for Disaster Management in Chile. Disasters 43, 372–389. doi:10.1111/disa.12313
Trenberth, K. E., Fasullo, J. T., and Shepherd, T. G. (2015). Attribution of Climate Extreme Events. Nat. Clim Change 5, 725–730. doi:10.1038/nclimate2657
Tversky, A., and Kahneman, D. (1973). Availability: A Heuristic for Judging Frequency and Probability. Cogn. Psychol. 5, 207–232. doi:10.1016/0010-0285(73)90033-9
[Dataset] UNESCO (2020). Serious Tsunami Hits Greece and Turkey after 7.0 Earthquake. Paris, France: UNESCO.
Valle, B. L., Kalligeris, N., Findikakis, A. N., Okal, E. A., Melilla, L., and Synolakis, C. E. (2014). Plausible Megathrust Tsunamis in the Eastern Mediterranean Sea. Proc. Inst. Civil Eng. - Eng. Comput. Mech. 167, 99–105. doi:10.1680/eacm.13.00027
Vernant, P., Reilinger, R., and McClusky, S. (2014). Geodetic Evidence for Low Coupling on the Hellenic Subduction Plate Interface. Earth Planet. Sci. Lett. 385, 122–129. doi:10.1016/j.epsl.2013.10.018
Wessel, P., Luis, J. F., Uieda, L., Scharroo, R., Wobbe, F., Smith, W. H. F., et al. (2019). The Generic Mapping Tools Version 6. Geochem. Geophys. Geosyst. 20, 5556–5564. doi:10.1029/2019GC008515
Wisner, B., Blaikie, P., Cannon, T., and Davis, I. (2004). At Risk. second edi edn. London: Routledge.
Woo, G. (2019). Downward Counterfactual Search for Extreme Events. Front. Earth Sci. 7. doi:10.3389/feart.2019.00340
Woo, G., Maynard, T., and Seria, J. (2017). Reimagining History: Counterfactual Risk Analysis. Tech. Rep. RMS.
Woo, G., and Mignan, A. (2018). Counterfactual Analysis of Runaway Earthquakes. Seismological Res. Lett. 89, 2266–2273. doi:10.1785/0220180138
Yalçıner, A. C., Annunziato, A., Papadopoulos, G. A., Dogan, G. G., Guler, H. G., Cakir, T. E., et al. (2017). The 20th July 2017 (22:31 UTC) Bodrum/Kos Earthquake and Tsunami; Post-tsunami Field Survey Report. Tech. Rep. July.
Yankelovich, D. (1972). Corporate Priorities: A Continuing Study of the New Demands on Business. Stanford, CT: Yankelovich Inc.
Keywords: risk analysis, downward counterfactual, disasters, Eastern Mediterranean, earthquake, tsunami, Black Swan, uncertainty
Citation: Penney C, Walshe R, Baker H, van Soest H, Dryhurst S and Taylor ARE (2022) Introducing Stories Into Downward Counterfactual Analysis: Examples From a Potential Mediterranean Disaster. Front. Earth Sci. 10:742016. doi: 10.3389/feart.2022.742016
Received: 15 July 2021; Accepted: 07 March 2022;
Published: 07 April 2022.
Edited by:
David Lallemant, Nanyang Technological University, SingaporeReviewed by:
Mark Bebbington, Massey University, New ZealandCopyright © 2022 Penney, Walshe, Baker, van Soest, Dryhurst and Taylor. This is an open-access article distributed under the terms of the Creative Commons Attribution License (CC BY). The use, distribution or reproduction in other forums is permitted, provided the original author(s) and the copyright owner(s) are credited and that the original publication in this journal is cited, in accordance with accepted academic practice. No use, distribution or reproduction is permitted which does not comply with these terms.
*Correspondence: Camilla Penney, Y3A0NTFAY2FtLmFjLnVr
Disclaimer: All claims expressed in this article are solely those of the authors and do not necessarily represent those of their affiliated organizations, or those of the publisher, the editors and the reviewers. Any product that may be evaluated in this article or claim that may be made by its manufacturer is not guaranteed or endorsed by the publisher.
Research integrity at Frontiers
Learn more about the work of our research integrity team to safeguard the quality of each article we publish.