 Jun Uetake
 Denis Samyn
 Simon Anguma5
 Nozomu Takeuchi
- 1National Institute of Polar Research, Tokyo, Japan
- 2Field Research Center for Northern Biosphere, Hokkaido University, Tomakomai, Japan
- 3The International Centre for Integrated Mountain Development, Kathmandu, Nepal
- 4Royal Museum for Central Africa, Department of Earth Science, Tervuren, Belgium
- 5Academic Affairs, Muni University, Arua, Uganda
- 6Department of Earth Science, Chiba University, Chiba, Japan
Diverse microbes have been revealed to live in glaciers worldwide, but only a few biological studies were dedicated to glaciers in tropical Africa. These glaciers are shrinking rapidly and are expected to disappear shortly. In this study, we carried out biological and glaciological field observations on Stanley Glacier, the largest remaining glacier in the Rwenzori Mountains, Uganda, Africa. Microbial aggregates ranging from micrometer to centimeter in size were found on the glacier surface and contained moss and various types of Chlorophyta, among which a new endemic species of green alga. Concentrations of total impurities on the glacier surface, including microbial aggregates, varied spatially and decreased as altitude increased. The large microbial aggregates (larger than 4 cm in diameter) were found only at the glacier surface near the terminus and side margins, where the surface was less frequently covered with snow. It is also shown that the total organic matter on the glacier surface is determined by the timing of snow cover, which affects the quantity of solar radiation reaching the glacier ice surface. Furthermore, the total impurity content was negatively correlated with surface reflectivity, revealing their potential role in albedo reduction at the glacier surface through positive feedback between enhanced meltwater and increased biological growth.
Introduction
Glaciers and ice sheets are biological habitats hosting various forms of life (Boetius et al., 2015). Microbial communities on glaciers and ice sheets play essential roles in carbon (e.g., carbon fixation, carbon degradation) and nitrogen cycles (e.g., nitrogen fixation, nitrification, and denitrification) (Anesio et al., 2009; Telling et al., 2011), which are important for the activity not only of supra- or intra-glacier biota but also of downstream terrestrial and marine ecosystems (Lawson et al., 2014).
Due to climate change, African glaciers are shrinking very rapidly (Nicholson et al., 2013; Prinz et al., 2016) and are expected to disappear shortly (Taylor et al., 2006; Thompson et al., 2009). In the Rwenzori Mountains, located at the border between Uganda and the Democratic Republic of Congo in Eastern Africa, glacier wastage is thought to result from the combined effects of climate warming (Taylor et al., 2006) and changes in atmospheric moisture (i.e., decreased humidity and reduced cloudiness) (Mölg et al., 2006).
Snow and ice albedo constitutes another important factor controlling glacier volume evolution (Takeuchi, 2009; Takeuchi et al., 2015). Glacial micro-organisms have been recognized as important in this regard due to the darkening of their intracellular pigment at the snow or glacier surface (Lutz et al., 2016b; Tanaka et al., 2016; Yallop et al., 2012). Also, submillimeter to millimeter-sized biological aggregates known as “cryoconite granules” have similar effects, thereby reducing surface reflectivity (Cook et al., 2015). These granules are bound together through an extracellular polymeric substance produced by filamentous cyanobacteria (Langford et al., 2010; Uetake et al., 2019), forming a layered structure of microorganisms with complex biofilm (Smith et al., 2016; Takeuchi et al., 2010). The growth of cryoconite granules and subsequent reduction of glacier surface reflectivity and glacier melting has been reported in the Himalayas (Takeuchi et al., 2001a), Eastern Asia (Takeuchi et al., 2015), and Greenland (Takeuchi et al., 2018). The large-scale effect of these granules on water cycling in the Arctic has also been reported (Musilova et al., 2016).
Although glacier shrinkage significantly impacts glacier ecosystems and periglacial downstream environments, only very few biological studies have been carried out in African glacierized regions: in Mt. Kilimanjaro (Vimercati et al., 2019), Mt. Kenya (Kuja et al., 2018) and Rwenzori Mountains (Uetake et al., 2014; Zawierucha et al., 2018). For example, on Stanley Glacier located in the Rwenzori Mountains at the border between Uganda and the Democratic Republic of Congo (DRC) (Uetake et al., 2014) described for the first time the existence of unique and relatively large (from micrometers to centimeters in size) biological aggregates made of moss. These aggregates were called “glacial moss gemmae aggregates” (GMGA), the term “gemma” referring to the cell components resulting from asexual reproduction. On the same glacier, Zawierucha et al. (2018) recently found new tardigrade species (Adropion afroglacialis sp. nov.), revealing unexpected biodiversity and activity in this poorly studied region of the world.
In order to shed light on African glacier biodiversity and characterize the effect of supraglacial impurities on surface reflectivity, we sampled and analyzed the biological content of surface impurities from 17 sites across Stanley Glacier in the Rwenzori Mountains and described their spatial distribution and surface reflectivity. We first discuss here the factors affecting the growth of organisms on the glacier and, second, the effect of supraglacial impurities on the reflectivity of the glacier surface.
Materials and Methods
Glacier Characteristics and Sampling Site
Stanley Glacier represents the largest glacier in the Rwenzori Mountains, flowing on the flank of Mount Stanley’s second highest peak, Alexandra Peak (Figures 1, 2). The area of the glacier was estimated to be 0.248 km2 in February 2012 based on Worldview satellite imagery. The glacier flows southwards from 4,960 m to 4,770 m a.s.l. forming a plateau glacier called Stanley (or Elena) Glacier. According to a recent report, the glacier’s area has now declined to less than 30% of its early 20th century area and is confined to the summit part of Mt Stanley (Samyn et al., 2017). We conducted field campaigns during the February month of four consecutive years between 2012 and 2015, during which snow and ice were collected at various sites on the glacier surface. In February 2012, surface ice and snow samples (10 × 10 × 5 cm) were collected for microscopic observation at three sites (2012 ST1 to 2012 ST3 in Figure 3A). In February 2015, surface ice and snow samples (10 × 10 × 5 cm) were collected for biological analysis at 17 sites selected 70–80 m apart across the glacier area. The samples were collected using an electric chainsaw (MUC250D, Makita, Japan) without any lubricants for ice and a stainless scoop for snow (Figure 4). Ice and snow samples were stored in the field into non-contaminating plastic bags until complete melting. These plastic bags were then hung in the camp, and supraglacial impurities settled at the bottom were carefully transferred into 100 or 5 ml plastic bottles for respective analyses. All 100 ml bottle samples were fixed using approximately 3% (final concentration) of 37% formaldehyde solution and transferred to the laboratory in Japan at environmental temperature for further size measurements. In contrast, the 5 ml bottle samples were kept cool during fieldwork and transportation, with plenty of ice in a large insulated container, for further morphological analysis in the laboratory.
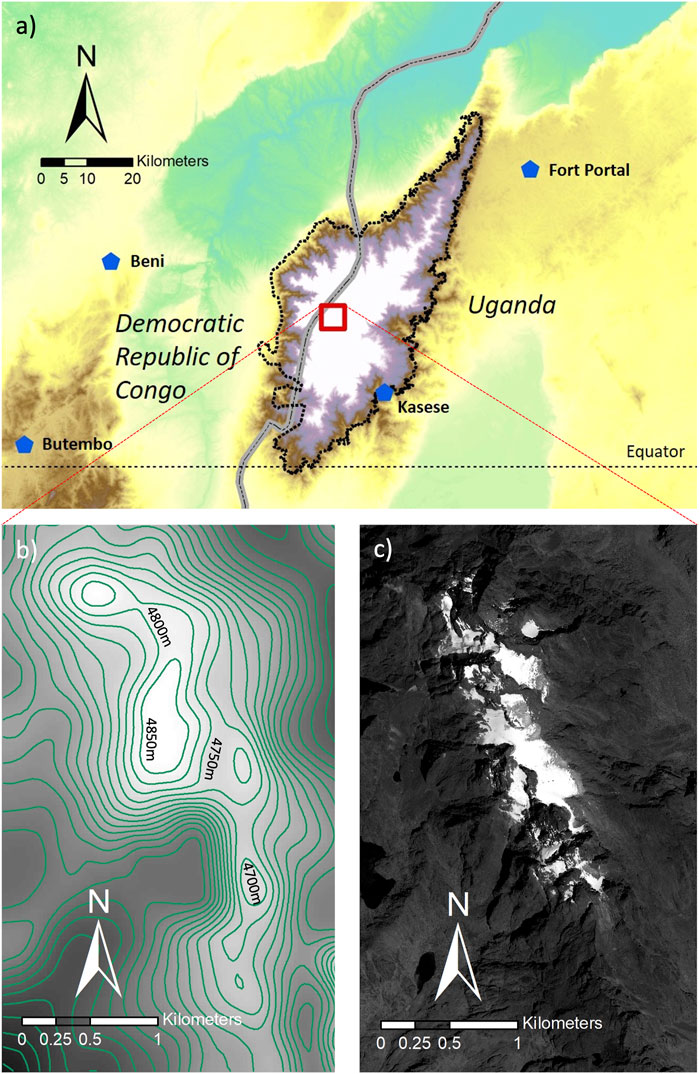
FIGURE 1. (A) Map of the Rwenzori region (bold dotted contours) with national borders between Uganda and D.R. Congo (thick grey line); (B) DEM (SRTM) of Stanley Plateau area, with 50 m contour lines; (C) satellite image (Worldview) of Stanley Plateau area, with the same extent and scale as in (B).
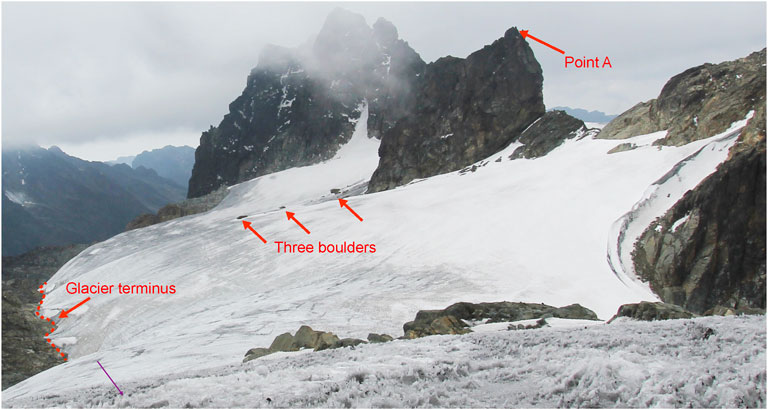
FIGURE 2. General view of Stanley Glacier, Rwenzori mountains, looking southeastwards, from the 2012-ST3 sampling site (Figure 3). The image was taken in February 2012, 1 month after the Worldview satellite image shown in Figures 1, 3. The position and direction of the photo are plotted on the same satellite image (Figure 3).
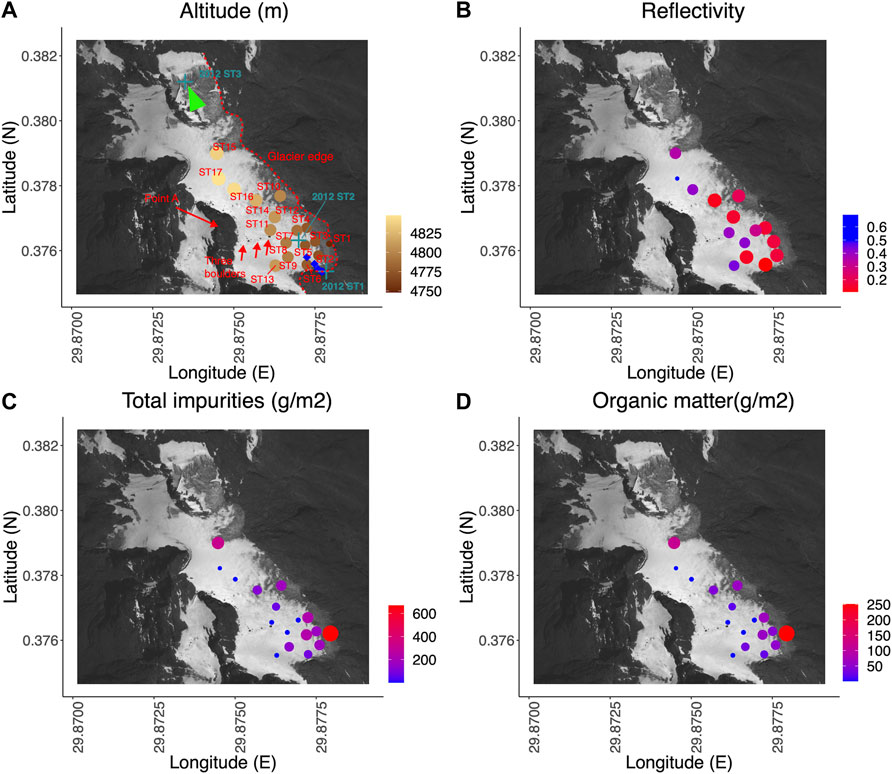
FIGURE 3. Satellite image (Worldview) of sampling sites on Stanley Glacier in 22 January 2012 and spatial distribution of reflectivity and total impurities and organic matters. An overview picture of the corresponding sampling area is given in Figure 3. (A) Altitude of sampling sites in 2015 (circles), and site locations of snow depth measurements in 2013 (blue diamonds) and of phototroph collection in 2012 (teal green cross). The red dashed line indicates glacier terminus and margins on 22 January 2012; (B) reflectivity (spectral range: 353–1,008 nm); (C) total impurity content; (D) organic matter content. Point values (circles) are displayed through their respective color and size. Green triangle shows the position and angle of view used in Figure 2.
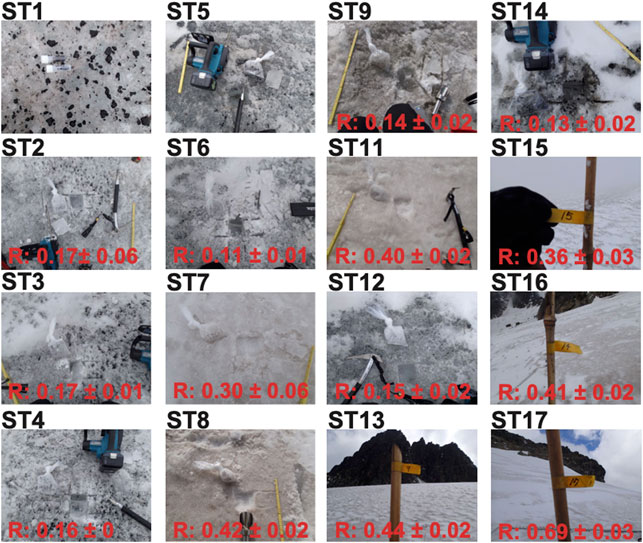
FIGURE 4. Surface condition at each sampling site on Stanley Glacier. Measured reflectivity (R) is indicated with standard deviation at the bottom of each image (no reflectivity measurements were conducted at ST1 and ST5). All images were taken in February 2015.
Biogenic Material Size Sorting and Weighing
To characterize the impurities collected on the glacier surface, the 100 ml samples were sieved using stainless steel meshes and sorted into the following classes: Class 4,000 (with longest axis larger than 4,000 µm), Class 1,000 (1,000–3,999 µm), Class 250 (250–999 µm) and Class U250 (smaller than 250 µm). After size sorting, the total impurity content (organic matter + inorganic matter) of each sample was measured before homogenization and combusted at 850°C in the furnace of the NC analyzer (Sumigraph NC-22A, Sumika Ltd., Japan). Ignition loss (%) was calculated from the weight before and after combustion (Takeuchi et al., 2005a; Edwards et al., 2014). The amount of organic matter was estimated by multiplying the impurity content lost during combustion to the total impurity content. Both total impurity and organic matter contents were subsequently converted to weight per unit area (g m−2). The weight per unit area threshold for accurate measurement was 0.056 g m−2, and all samples with an ignition loss lower than this value were discarded from further analysis.
Microscopic Observations
Immediately after our samples arrived in the laboratory, the 5 ml bottle samples collected for morphological observation were analyzed using an optical microscope (FV1000: Olympus, Tokyo, Japan), focusing on the morphology of microbial cells, especially green algae and moss gemmae. In order to quantify their cell concentrations, the samples were diluted 12 to 60-fold with Milli-Q water and filtrated using a membrane filter (JGWP01300, Millipore) before the number of cells in the entire field of view were counted on each filter.
Surface Reflectivity and Snow Measurements
The glacier surface light spectrum (in the 344–1,051 nm range) was measured at all sites except ST1 and ST5 in February 2015 (Figure 3B) using a hand-held spectrometer (MS-720, EKO instruments, Japan) with a 25° field of view adapter from 10 cm above the measured surface (corresponding to about 15 cm2 of measured surface area). The white reference for the spectrometer calibration was always kept horizontal against the glacier surface before each measurement. Surface reflectivity was calculated from the mean value of the measured spectrum (with a nominal wavelength ranging from 353 to 1,008 nm). In addition, snow depth was measured using an avalanche probe and a ruler on 10 February 2013, when most of the glacier surface was covered with temporary snow (Supplementary Figure S1).
Images of the Glacier
The satellite image (panchromatic band) used for glacio-biological mapping and shown in Figures 1, 3 was acquired by WorldView-1 (DigitalGlobe, United States) on 22 January 2012, and distributed to the authors by the Japan Space Imaging Corporation (http://www.spaceimaging.co.jp/en/, image ID: 1020010019691400). An overview picture was taken from the studied glacier area on 7 February 2012, from the upper part of Stanley Glacier (2012_ST3) and shown in Figure 3.
Results
Microorganisms and Supraglacial Impurities on the Glacier
Optical microscopy revealed that the supraglacial impurities collected from all sites on Stanley Glacier contained mainly three major phototrophs, including moss gemmae of Celatodon purpureus, Cylindrocystis brebissonii and an unknown phototrophic organism (Figure 5). Three types of green algae were also observed, including red-pigmented green algae (Figure 5). The total cell concentration of the three most abundant taxa (C. purpureus, unidentified green alga, and C. brebissonii) shows a more significant value near the glacier terminus (2012-ST1: 450-5100, 1500-13350 and 2400-6600 cells/ml, respectively) and a lower value at the highest glacier site (2012-ST3: not detectable, 0-2.52 and 0.72-3.96 cells/ml) (Figure 6; Supplementary Table S1).
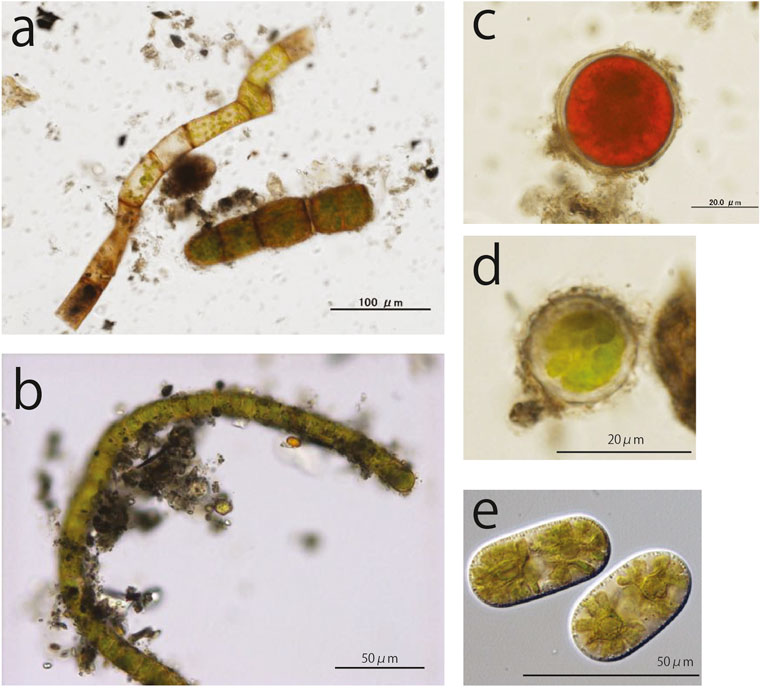
FIGURE 5. Phototrophs (moss gemma and Chlorophyta) on Stanley Glacier surface: (A) Celatodon purpureus, (B) unidentified green algae, (C) snow red algae, (D) unidentified round, green algae, (E) Cylindrocystis brebissonii.
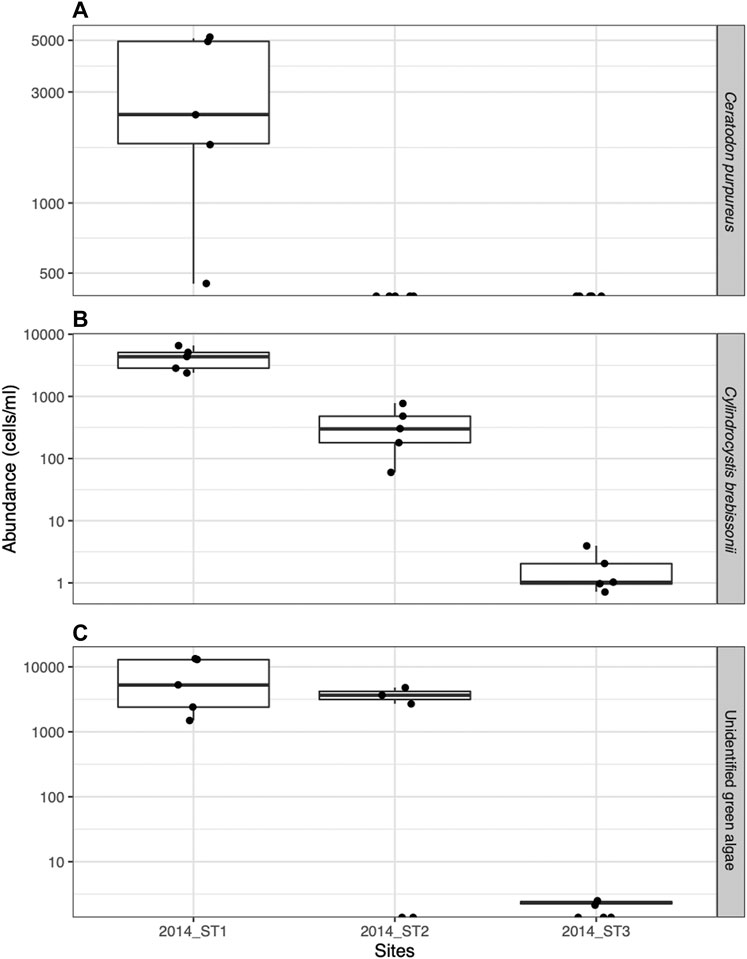
FIGURE 6. Spatial variation of the cell concentration (cell count/ml) of phototrophs on Stanley Glacier: (A) Celatodon purpureus, (B) Cylindrocystis brebissonii, and (C) unidentified green algae).
The same spatial pattern as for the total cell concentration was observed across the glacier in terms of total impurity content, which reflects the concentration of aggregates made up of the most abundant phototrophs, other microorganisms such as bacteria, and mineral dust. The mean total impurity content ranged from 0.06 to 801.0 gm−2 (mean SD: 143.8 ± 211.8 gm−2), with the greatest and smallest concentrations occurring at the lowest site (669 ± 166 gm−2 at ST1) and the highest site (0.35 ± 0.33 gm−2 at ST17), respectively (Supplementary Table S2). The corresponding mean loss on ignition amounted to 33.2 ± 4.8%, whereas the mean total organic matter of impurities was of 46.3 ± 81.8 gm−2 (Supplementary Figure S3; Supplementary Tables S3, S4). Our measurements of the four different size fractions of impurities show that both total impurity and organic matter contents of Class 4,000 were the largest (total impurities: mean 65.93 gm−2; organic matter: mean 22.34 gm−2), followed by the smallest size class (Class U250) (total impurities: mean 35.40 gm−2; organic matter: mean 10.53 gm−2). The following ranking classes in terms of weight were Class 250 (total impurities: mean 32.56 gm−2; organic matter: mean 10.21 gm−2) and Class 1,000 (total impurities: mean 9.90 gm−2; organic matter: mean 3.26 gm−2) (Supplementary Figure S3).
Glacier Reflectivity
The surface reflectivity ranged from 0.10 to 0.73 (mean + -SD: 0.28 ± 0.16 gm-2), with the lowest value at the terminus: ST6 and the highest at the snow-covered ST17 (Figure 3B, Supplementary Table S5). A correlation table and matrix between the altitude, reflectivity, organic matter and total impurity content are shown in Table 1 and Supplementary Figure S2. The concentration of total impurities (Impurity_Total) was negatively correlated (r = −0.52) with the reflectivity of the glacier surface (p = 0.05), whereas no significant correlation was found between the concentration of total organic matter (Organic_Total) and the glacier reflectivity (p = 0.11). In addition, the concentration of Class 4,000, which is the most abundant impurity fraction (45.9 and 48.2% of the total impurity and organic matter contents respectively), was not significantly correlated with reflectivity. However, the correlation coefficient between size fraction (for both total impurity and the organic matter contents) and reflectivity increased with decreasing size (Table 1).

TABLE 1. The Pearson correlation matrix between altitude, reflectivity, total impurity content and organic matter content. Each significance level (p-value) is associated to a symbol: <0.001: “***”; <0.01: “**”; <0.05: “*”.
Discussion
A Unique Phototrophs Biodiversity
The unknown phototrophic organism shown in Figure 5 presents novel taxonomic characteristics regarding its morphology. Due to logistical constrains, DNA-level identification of this type of organism was not possible within the context of the present work. However, some criteria, including cell size and the presence of chloroplast, suggest a strong likelihood to the green algae taxon. Since, first, the only occurrence of C. purpureus on a glacier has been reported from Stanley Glacier (Uetake et al., 2014), and, second, our unidentified filamentous alga has never been reported in any other region globally, these two phototrophic species can reasonably be considered as endemic of Rwenzori glacial environments in current knowledge. Two other types of green algae found on Stanley Glacier, including Cylindrocystis brebissonii and a red-pigmented alga, present similar morphological features as other algae commonly distributed on other glaciers worldwide (North America Hoham, 1975; Himalayas Yoshimura et al., 2000; Mueller and Pollard, 2004; Uetake et al., 2010; Yallop et al., 2012).
Factors Affecting the Biomass of Phototrophs
The concentration of these algal cells on Stanley Glacier surface decreases with elevation. Altitudinal variations of glacier microbes are commonly found in mountain glaciers (Segawa et al., 2010; Takeuchi, 2013; Takeuchi et al., 2005b, 2019; Uetake et al., 2010; Yoshimura et al., 1997). As air temperature decreases linearly with increasing elevation, seasonal snow cover melts faster at lower glacier elevation as a result of larger cumulated solar radiation on the glacier ice surface, thereby inducing more optimum conditions for algal growth (Yoshimura et al., 1997). In February 2013, when most of the glacier surface was covered with snow despite the typically dry season period, snow depth gradually increased (from 0 to 0.8 m) with altitude (Supplementary Figure S1). Although the snow depth survey was conducted in limited areas and therefore only reflects a limited temporal pattern (blue diamond in Figure 3A), it is reasonable to consider that this altitudinal gradient of snow depth is likely to occur in other years.
Additionally, the area near the glacier terminus, including our lowest altitude sample (2012-ST1), was always free of snow cover during each of our February visits from 2012 to 2015, as exemplified on the 2012 satellite image in Figure 3. The presence of snow on the ice surface can significantly reduce light penetration through the snowpack (e.g., irradiance is reduced by one third under 5 cm snowpack, as shown by Pomeroy and Brun (2001), from which we assume as a corollary that the frequency of snowfall can constitute another factor leading to altitudinal changes in the distribution of phototrophs.
As a result of the snow depth altitudinal gradient, the solar radiation at the ice surface is likely to be strongest in the lowest area of the glacier, which is likely to promote the growth of phototrophs. Although the growth conditions of moss gemmae on glaciers have not yet been fully appraised, nutrient availability can be considered a limiting factor for phototrophs (Jones, 1991). Comparison of multiple glacier environments with varying geological settings also showed that the metabolic growth of green algae is promoted by the presence of nitrogen in sufficient concentration (Lutz et al., 2016a). For logistical reasons, nutrient concentration could not be measured in this study, however, previous glacier studies reported nutrient concentration as a secondary factor for growth compared to altitudinal change (Hodson et al., 2005; Yoshimura et al., 1997).
Effect of Impurities on the Reflectivity of Glacier Surface
Most of Stanley Glacier surface impurities consisted of aggregates of organic and inorganic material, including phototrophic and heterotrophic microorganisms together with mineral dust. The total impurity content on Stanley Glacier (143 ± 188 gm−2) was significantly more extensive than those reported on glaciers in the Arctic (Takeuchi et al., 2014: 18.8 ± 21.6 gm−2), in Russia (Takeuchi et al., 2015: 45.2 ± 12.0 gm−2), in Patagonia (Takeuchi et al., 2001b: 38 gm−2 on average), in Alaska (Takeuchi, 2002: 23 gm−2 on average), and Caucasus Mountains (Kutuzov et al., 2021: 36 ± 38 gm−2). However, it was lower than on Central Asian glaciers, where the greatest concentration of supraglacial impurity has been reported globally (Takeuchi et al., 2005: 292 ± 196 gm−2; Takeuchi and Li, 2008: 335 ± 211 gm−2). In terms of organic matter content, Stanley Glacier exhibited significantly larger values (46.3 ± 68.6 gm−2) than Central Asian glaciers (Takeuchi et al., 2005: 25.4 ± 16.5 gm−2 and 8.6 ± 1.9%, Takeuchi and Li, 2008: 30.2 ± 15.6 gm−2 and 9.4 ± 1.6%) or any other glacier described in the literature [see, e.g., Edwards et al. (2014)]. Our results, therefore, point to relatively high impurity content and exceptionally high organic content at the surface of Stanley Glacier compared to other regions of the world.
The total impurity and organic matter contents were spatially variable (Figure 3, Supplementary Figure S3). In particular, both the total impurity and organic matter contents of the smallest size fraction significantly decreased with altitude (Supplementary Figure S2), except at the “high altitude” glacier marginal sites (including ST9, ST10, ST14, and ST15) where total impurity and organic matter contents were relatively larger than elsewhere on the glacier. In the vicinity of the glacier terminus (ST1, ST2, ST3, ST5), at the side margins (ST4) and at high altitude glacier marginal sites (ST9, ST10, ST14, ST15), the total organic matter content was especially large and to our knowledge larger than any other record values [e.g., 30.2 gm−2 Takeuchi and Li (2008)]. This can be attributed to the presence of GMGAs in high concentrations since the fraction of Class 4,000 to the total organic matter content is also generally high at these sites (except ST5, ST9, and ST 14) (Supplementary Figure S3B). Most of the high GMGA concentration sites (ST1, ST2, ST3, ST4, ST10, ST15) were located in the darker ice area identified on the satellite image acquired in January 2012 (Figure 3) and on the field picture taken 1 month later (Figure 2). The snow cover at these sites is less frequent throughout the year, thereby favoring the growth of phototrophs compared to other areas.
As can be seen from Figures 3, 4, the impurity content as well as their size distribution vary from site to site across the glacier surface. Although the impurity content on the glacier surface was well recognized as an important factor leading to the reduction of glacier reflectivity, both the total amount of impurities and their size distribution should also be considered in that regard, owing to the negative correlation observed between size fraction of impurities and glacier reflectivity. It is interesting to note that the largest size fraction (Class 4,000), which was associated with the largest measured impurity content due to the presence of moss aggregates, did not correlate well with ice surface reflectivity. Conversely, the correlation coefficients between the finer size fractions (i.e. Class 250 and Class U250) and reflectivity were relatively large (Table 1; Supplementary Figure S2). These findings support the fact that, despite their low ratio in organic matter, small and homogeneously spread impurities (e.g., ST9 in Figure 4) were probably more effective in reducing albedo than large and scattered GMGAs (e.g., ST2, ST3, and ST4 in Figure 4). These finer size fractions are likely to provide vital ground for the development process of the larger aggregates.
Conclusion
Based on its taxonomic characteristics, a new species of green algae, endemic of Rwenzori glacial environments in Africa, was discovered within the present work. Together with another endemic species of moss previously reported by the authors, more ubiquitous green alga taxa were also observed, suggesting a high degree of microbial diversity. Our measurements of total impurity concentration at the surface of Stanley Glacier point to exceptionally high organic content compared to other regions of the world. An inverse relationship was found between the surface reflectivity and the total impurity content. Our work supports previous findings suggesting that supraglacial impurities, including microbial aggregates, effectively reduce albedo and are likely to promote snow and ice melting at the glacier surface. In turn, albedo reduction possibly has a positive feedback effect on glacial microbial communities due to enhanced meltwater availability and increased solar radiation absorption. A size effect was also observed on glacier reflectivity by microbial impurities, with finely distributed granules having a stronger impact on surface albedo reduction than larger moss aggregates. In the framework of further investigations, we suggest focusing on moss generation processes such as the growth of phototrophs and their subsequent detachment/aggregating mechanisms in order to better understand the spatial distribution evolution of the various impurity size fractions and their respective impact on glacier reflectivity.
Data Availability Statement
The original contributions presented in the study are included in the article/Supplementary Material, further inquiries can be directed to the corresponding author.
Author Contributions
JU designed research; JU, DS, and SA performed field research; JU analyzed data; and JU, DS, and NT wrote the paper.
Funding
JU.acknowledges support from a Grant-in-Aid for Young Scientists (B; Grant agreement #25740012) from the Ministry of Education, Culture, Sports, Science and Technology of Japan. DS acknowledges support from a Marie Curie fellowship of the European Commission (H2020-EU.1.3.2.; Grant agreement #656847) and Fonds Ernest Solvay (Belgium). NT acknowledges support from a Grant-in-Aid for Scientific Research (A; Grant agreement #19H01143) from the Ministry of Education, Culture, Sports, Science and Technology of Japan.
Conflict of Interest
The authors declare that the research was conducted in the absence of any commercial or financial relationships that could be construed as a potential conflict of interest.
Publisher’s Note
All claims expressed in this article are solely those of the authors and do not necessarily represent those of their affiliated organizations, or those of the publisher, the editors and the reviewers. Any product that may be evaluated in this article, or claim that may be made by its manufacturer, is not guaranteed or endorsed by the publisher.
Acknowledgments
The field research was supported by the Uganda Wildlife Authority, the Uganda National Council for Science and Technology. In addition, the authors would like to thank A. Wada of the Greenleaf Tourist Club for management of local transportation in Uganda. We also thank the guides and porters of the Rwenzori Mountaineering Service for guidance and transportation of research equipment, Y. Tsuji, for operating the NC analyzer.
Supplementary Material
The Supplementary Material for this article can be found online at: https://www.frontiersin.org/articles/10.3389/feart.2022.740998/full#supplementary-material
References
Anesio, A. M., Hodson, A. J., Fritz, A., Psenner, R., and Sattler, B. (2009). High Microbial Activity on Glaciers: Importance to the Global Carbon Cycle. Glob. Chang. Biol. 15, 955–960. doi:10.1111/j.1365-2486.2008.01758.x
Boetius, A., Anesio, A. M., Deming, J. W., Mikucki, J. A., and Rapp, J. Z. (2015). Microbial Ecology of the Cryosphere: Sea Ice and Glacial Habitats. Nat. Rev. Microbiol. 13, 677–690. doi:10.1038/nrmicro3522
Cook, J., Edwards, A., Takeuchi, N., and Irvine-Fynn, T. (2015). Cryoconite. Prog. Phys. Geogr. Earth Environ. 40, 66–111. doi:10.1177/0309133315616574
Edwards, A., Mur, L. A. J., Girdwood, S. E., Anesio, A. M., Stibal, M., Rassner, S. M. E., et al. (2014). Coupled Cryoconite Ecosystem Structure-Function Relationships Are Revealed by Comparing Bacterial Communities in alpine and Arctic Glaciers. FEMS Microbiol. Ecol. 89, 222–237. doi:10.1111/1574-6941.12283
Hodson, A. J., Mumford, P. N., Kohler, J., and Wynn, P. M. (2005). The High Arctic Glacial Ecosystem: New Insights from Nutrient Budgets. Biogeochemistry 72, 233–256. doi:10.1007/s10533-004-0362-0
Hoham, R. W. (1975). Optimum Temperatures and Temperature Ranges for Growth of Snow Algae. Arctic Alpine Res. 7, 13. doi:10.2307/1550094
Jones, H. G. (1991). “Snow Chemistry and Biological Activity: a Particular Perspective on Nutrient Cycling,” in Seasonal Snowpacks. Editors T. D. Davies, M. Tranter, and H. G. Jones (Berlin, Heidelberg: Springer Berlin Heidelberg), 173–228. doi:10.1007/978-3-642-75112-7_8
Josiah, O. K., Huxley, M. M., Hamadi, I. B., Anne, T. W. M., and Jun, U. (2018). Phylogenetic Diversity of Prokaryotes on the Snow-Cover of Lewis Glacier in Mount Kenya. Afr. J. Microbiol. Res. 12, 574–579. doi:10.5897/ajmr2017.8750
Kutuzov, S., Shahgedanova, M., Krupskaya, V., and Goryachkin, S. (2021). Optical, Geochemical and Mineralogical Characteristics of Light-Absorbing Impurities Deposited on Djankuat Glacier in the Caucasus Mountains. Water 13, 2993. doi:10.3390/w13212993
Langford, H., Hodson, A., Banwart, S., and Bøggild, C. (2010). The Microstructure and Biogeochemistry of Arctic Cryoconite Granules. Ann. Glaciol. 51, 87–94. doi:10.3189/172756411795932083
Lawson, E. C., Wadham, J. L., Tranter, M., Stibal, M., Lis, G. P., Butler, C. E. H., et al. (2014). Greenland Ice Sheet Exports Labile Organic Carbon to the Arctic Oceans. Biogeosciences 11, 4015–4028. doi:10.5194/bg-11-4015-2014
Lutz, S., Anesio, A. M., Edwards, A., and Benning, L. G. (2016a). Linking Microbial Diversity and Functionality of Arctic Glacial Surface Habitats. Environ. Microbiol. 19, 551–565. doi:10.1111/1462-2920.13494
Lutz, S., Anesio, A. M., Raiswell, R., Edwards, A., Newton, R. J., Gill, F., et al. (2016b). The Biogeography of Red Snow Microbiomes and Their Role in Melting Arctic Glaciers. Nat. Commun. 7, 1–9. doi:10.1038/ncomms11968
Mölg, T., Rott, H., Kaser, G., Fischer, A., and Cullen, N. J. (2006). Comment on "Recent Glacial Recession in the Rwenzori Mountains of East Africa Due to Rising Air Temperature" by Richard G. Taylor, Lucinda Mileham, Callist Tindimugaya, Abushen Majugu, Andrew Muwanga, and Bob Nakileza. Geophys. Res. Lett. 33, 33–36. doi:10.1029/2006GL027254
Mueller, D. R., and Pollard, W. H. (2004). Gradient Analysis of Cryoconite Ecosystems from Two Polar Glaciers. Polar Biol. 27, 66–74. doi:10.1007/s00300-003-0580-2
Musilova, M., Tranter, M., Bamber, J. L., Takeuchi, N., and Anesio, A. (2016). Experimental Evidence that Microbial Activity Lowers the Albedo of Glaciers. Geochem. Persp. Let. 2016, 106–116. doi:10.7185/geochemlet.1611
Nicholson, L. I., Prinz, R., Mölg, T., and Kaser, G. (2013). Micrometeorological Conditions and Surface Mass and Energy Fluxes on Lewis Glacier, Mt Kenya, in Relation to Other Tropical Glaciers. The Cryosphere 7, 1205–1225. doi:10.5194/tc-7-1205-2013
Pomeroy, J. W., and Brun, E. (2001). “Physical Properties of Snow,” in Snow Ecology. Editors H. G. Jones, J. W. Pomeroy, D. A. Walker, and R. W. Hoham (Cambridge: Cambridge University Press), 45–126.
Prinz, R., Nicholson, L. I., Mölg, T., Gurgiser, W., and Kaser, G. (2016). Climatic Controls and Climate Proxy Potential of Lewis Glacier, Mt. Kenya. The Cryosphere 10, 133–148. doi:10.5194/tc-10-133-2016
Samyn, D., Uetake, J., and Kervyn, F. (2017). In-Situ and Remotely-Sensed Glacier Monitoring in the Rwenzori Mountains, Uganda/D.R. Congo. In American Geophysical Union, Fall Meeting 2017, Abstract #C52A-07. Available at: https://ui.adsabs.harvard.edu/abs/2017AGUFM.C52A.07S/abstract.
Segawa, T., Takeuchi, N., Ushida, K., Kanda, H., and Kohshima, S. (2010). Altitudinal Changes in a Bacterial Community on Gulkana Glacier in Alaska. Microb. Environ. 25, 171–182. doi:10.1264/jsme2.ME10119
Smith, H. J., Schmit, A., Foster, R., Littman, S., Kuypers, M. M., and Foreman, C. M. (2016). Biofilms on Glacial Surfaces: Hotspots for Biological Activity. Npj Biofilms Microbiomes 2, 16008. doi:10.1038/npjbiofilms.2016.8
Takeuchi, N., Fujisawa, Y., Kadota, T., Tanaka, S., Miyairi, M., Shirakawa, T., et al. (2015). The Effect of Impurities on the Surface Melt of a Glacier in the Suntar-Khayata Mountain Range, Russian Siberia. Front. Earth Sci. 3, 1–11. doi:10.3389/feart.2015.00082
Takeuchi, N., Kohshima, S., and Seko, K. (2001a). Structure, Formation, and Darkening Process of Albedo-Reducing Material (Cryoconite) on a Himalayan Glacier: A Granular Algal Mat Growing on the Glacier. Arctic, Antarctic, Alpine Res. 33, 115–122. doi:10.1080/15230430.2001.12003413
Takeuchi, N., Kohshima, S., Shiraiwa, T., and Kubota, K. (2001b). Characteristics of Cryoconite (Surface Dust on Glaciers) and Surface Albedo of a Patagonian Glacier, Tyndall Glacier, Southern Patagonia Icefield. Bull. Glaciol. Res. 18, 65–69.
Takeuchi, N., and Li, Z. (2008). Characteristics of Surface Dust on Ürümqi Glacier No. 1 in the Tien Shan Mountains, China. Arctic, Antarctic, Alpine Res. 40, 744–750. doi:10.1657/1523-0430(07-094)[takeuchi]2.0.co;2
Takeuchi, N., Matsuda, Y., Sakai, A., and Fujita, K. (2005a). A Large Amount of Biogenic Surface Dust(cryoconite) on a Glacier in the Qilian Mountains, China. Bull. Glacier Res. 22, 1–8. Available at: http://www-es.s.chiba-u.ac.jp/∼takeuchi/pdf/05bgr_qiyicryo_p.pdf.
Takeuchi, N., Nagatsuka, N., Uetake, J., and Shimada, R. (2014). Spatial Variations in Impurities (Cryoconite) on Glaciers in Northwest Greenland. Bull. Glacier Res. 32, 85–94. doi:10.5331/bgr.32.85
Takeuchi, N., Nishiyama, H., and Li, Z. (2010). Structure and Formation Process of Cryoconite Granules on Ürümqi Glacier No. 1 , Tien Shan, China. Ann. Glaciol. 51, 9–14. doi:10.3189/172756411795932010
Takeuchi, N., Sakaki, R., Uetake, J., Nagatsuka, N., Shimada, R., Niwano, M., et al. (2018). Temporal Variations of Cryoconite Holes and Cryoconite Coverage on the Ablation Ice Surface of Qaanaaq Glacier in Northwest Greenland. Ann. Glaciol. 59, 21–30. doi:10.1017/aog.2018.19
Takeuchi, N. (2013). Seasonal and Altitudinal Variations in Snow Algal Communities on an Alaskan Glacier (Gulkana Glacier in the Alaska Range). Environ. Res. Lett. 8, 035002. doi:10.1088/1748-9326/8/3/035002
Takeuchi, N. (2002). Surface Albedo and Characteristics of Cryoconite (Biogenic Surface Dust) on an Alaska Glacier, Gulkana Glacier in the Alaska Range. Bull. Glaciol. Res. 19, 63–70.
Takeuchi, N., Tanaka, S., Konno, Y., Irvine-Fynn, T. D. L., Rassner, S. M. E., and Edwards, A. (2019). Variations in Phototroph Communities on the Ablating Bare-Ice Surface of Glaciers on Brøggerhalvøya, Svalbard. Front. Earth Sci. 7, 1–10. doi:10.3389/feart.2019.00004
Takeuchi, N. (2009). Temporal and Spatial Variations in Spectral Reflectance and Characteristics of Surface Dust on Gulkana Glacier, Alaska Range. J. Glaciol. 55, 701–709. doi:10.3189/002214309789470914
Takeuchi, N., Uetake, J., Fujita, K., Aizen, V., and Nikitin, S. (2005b). A Snow Algal Community on Akkem Glacier in the Russian Altai Mountains A Snow Algal Community on Akkem Glacier in the Russian Altai Mountains. Cambridge: Cambridge University Press, 1–26.
Tanaka, S., Takeuchi, N., Miyairi, M., Fujisawa, Y., Kadota, T., Shirakawa, T., et al. (2016). Snow Algal Communities on Glaciers in the Suntar-Khayata Mountain Range in Eastern Siberia, Russia. Polar Sci. 10, 227–238. doi:10.1016/j.polar.2016.03.004
Taylor, R. G., Mileham, L., Tindimugaya, C., Majugu, A., Muwanga, A., and Nakileza, B. (2006). Recent Glacial Recession in the Rwenzori Mountains of East Africa Due to Rising Air Temperature. Geophys. Res. Lett. 33, a–n. doi:10.1029/2006GL025962
Telling, J., Anesio, A. M., Tranter, M., Irvine-Fynn, T., Hodson, A., Butler, C., et al. (2011). Nitrogen Fixation on Arctic Glaciers, Svalbard. J. Geophys. Res. 116, 2–9. doi:10.1029/2010JG001632
Thompson, L. G., Brecher, H. H., Mosley-Thompson, E., Hardy, D. R., and Mark, B. G. (2009). Glacier Loss on Kilimanjaro Continues Unabated. Proc. Natl. Acad. Sci. 106, 19770–19775. doi:10.1073/pnas.0906029106
Uetake, J., Tobo, Y., Uji, Y., Hill, T. C. J., DeMott, P. J., Kreidenweis, S. M., et al. (2019). Seasonal Changes of Airborne Bacterial Communities over Tokyo and Influence of Local Meteorology. Front. Microbiol. 10, 1572. doi:10.3389/fmicb.2019.01572
Uetake, J., Naganuma, T., Hebsgaard, M. B., Kanda, H., and Kohshima, S. (2010). Communities of Algae and Cyanobacteria on Glaciers in West Greenland. Polar Sci. 4, 71–80. doi:10.1016/j.polar.2010.03.002
Uetake, J., Tanaka, S., Hara, K., Tanabe, Y., Samyn, D., Motoyama, H., et al. (2014). Novel Biogenic Aggregation of moss Gemmae on a Disappearing African Glacier. PLoS One 9, e112510. doi:10.1371/journal.pone.0112510
Vimercati, L., Darcy, J. L., and Schmidt, S. K. (2019). The Disappearing Periglacial Ecosystem Atop Mt. Kilimanjaro Supports Both Cosmopolitan and Endemic Microbial Communities. Sci. Rep. 9, 1–14. doi:10.1038/s41598-019-46521-0
Yallop, M. L., Anesio, A. M., Perkins, R. G., Cook, J., Telling, J., Fagan, D., et al. (2012). Photophysiology and Albedo-Changing Potential of the Ice Algal Community on the Surface of the Greenland Ice Sheet. ISME J. 6, 2302–2313. doi:10.1038/ismej.2012.107
Yoshimura, Y., Kohshima, S., and Ohtani, S. (1997). A Community of Snow Algae on a Himalayan Glacier: Change of Algal Biomass and Community Structure with Altitude. Arctic Alpine Res. 29, 126–137. doi:10.2307/1551843
Yoshimura, Y., Kohshima, S., Takeuchi, N., Seko, K., and Fujita, K. (2000). Himalayan Ice-Core Dating with Snow Algae. J. Glaciol. 46, 335–340. doi:10.3189/172756500781832918
Keywords: glacier ecosystem, tropical glacier, moss aggregation, psychrophile, Rwenzori mountains, albedo
Citation: Uetake J, Samyn D, Anguma S and Takeuchi N (2022) Spatial Distribution of Unique Biological Communities and Their Control Over Surface Reflectivity of the Stanley Glacier, Uganda. Front. Earth Sci. 10:740998. doi: 10.3389/feart.2022.740998
Received: 14 July 2021; Accepted: 19 January 2022;
Published: 17 February 2022.
Edited by:
Michael Lehning, Swiss Federal Institute of Technology Lausanne, SwitzerlandReviewed by:
Stephen Warren, University of Washington, United StatesMaria Shahgedanova, University of Reading, United Kingdom
Copyright © 2022 Uetake, Samyn, Anguma and Takeuchi. This is an open-access article distributed under the terms of the Creative Commons Attribution License (CC BY). The use, distribution or reproduction in other forums is permitted, provided the original author(s) and the copyright owner(s) are credited and that the original publication in this journal is cited, in accordance with accepted academic practice. No use, distribution or reproduction is permitted which does not comply with these terms.
*Correspondence: Jun Uetake, anVuLnVldGFrZUBmc2MuaG9rdWRhaS5hYy5qcA==