 Masato Iguchi
 Taishi Yamada
95% of researchers rate our articles as excellent or good
Learn more about the work of our research integrity team to safeguard the quality of each article we publish.
Find out more
ORIGINAL RESEARCH article
Front. Earth Sci. , 07 March 2022
Sec. Volcanology
Volume 10 - 2022 | https://doi.org/10.3389/feart.2022.727909
This article is part of the Research Topic Multidisciplinary Investigations for Determining the Structure and Dynamics of Active Volcanic Systems View all 9 articles
Mechanisms that control fluctuation of long-term eruptive activity are not well understood. Since 1955, Sakurajima volcano has experienced repeated Vulcanian eruptions accompanied by deflation. However, ground deflations sometimes occurred even if no eruption took place. Characteristics of the non-eruptive deflation (NED) have not been investigated because of the related ambiguous ground vibration, infrasound and visual phenomena. In this study, we categorize deflation events contained in continuous deformation records covering eruptive activities at the Sakurajima volcano Minamidake crater during the period from November 2017 to December 2020. The deflation events are classified into eruptive and NED types by examining the seismic data, infrasound generations, and visual phenomena. Their event type occurrence characteristics are then further clarified based on their relationships to pressure source volume changes. Comparing the pressure source volume changes with the monthly mass of volcanic ash expelled from the crater, which is estimated from deposition data around the volcano, we found the contribution of NED events to volcanic ash mass eruption amounts to be much smaller than that for Vulcanian events, and visual observations confirm that NED events are phenomena that primarily emit volcanic gas. The NED event changes during the episode are interpreted by the magna transition from bubble-rich to bubble-poor conditions and are supported by the sulfur dioxide (SO2) discharge rate. The activity of NED events is helpful to understand long-term variations in eruptive activity.
Eruptive activity at volcanoes with the open-vent systems often continues for a long time, changing its intensity and the style of the eruptions and location of vents. Mechanisms that control such a fluctuation of eruptive activity are not well understood. In the years since 1955, Vulcanian eruptions have occurred frequently at the Minamidake Summit crater or Showa crater (located 500 m east of the Minamidake crater) at Sakurajima volcano in southern Kyushu, Japan. The repeated Minamidake crater eruptions recorded from 1955 to 2005 featured frequent Vulcanian and Strombolian eruptions and continuous ash emissions. Then, the eruption center shifted to the Showa crater, which had been dormant for 58 years, and in June 2006, a series of eruptive activities commenced that lasted until October 2017, at which time the eruption center returned to the Minamidake crater where eruptive events were ongoing as of May 2021.
These eruptive activity transitions are influenced by long-term magma intrusions from a large magma chamber beneath the Aira caldera to the north of Sakurajima volcano (Figure 1; Iguchi et al., 2013; Yamamoto et al., 2013), and eruption types are controlled by short-term magma intrusions into the Sakurajima conduit (Iguchi et al., 2019). Bubble-rich magma intrusions also influence eruptive activities, as can be seen in the large amounts of volcanic gas emissions recorded during measurements of sulfur dioxide (SO2) discharge rates (Mori et al., 2008). Separately from the SO2 discharge measurement, analyses of water-soluble volcanic ash contents have shown that eruption-type transitions are related to volatile-rich magma intrusions (Nogami et al., 2006).
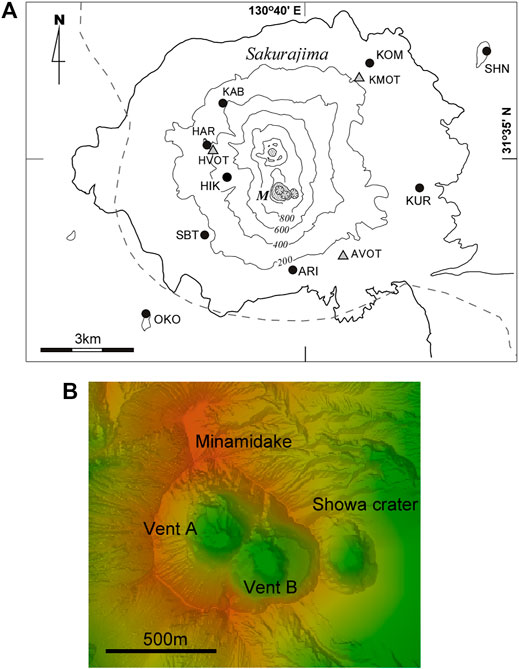
FIGURE 1. (A) Locations of seismic and ground deformation stations on Sakurajima volcano. The dots and triangles show the seismic stations and underground tunnels equipped with tiltmeters and strainmeters, respectively. “M” indicates the Minamidake summit area. Dashed line indicates the rim of Aira caldera. (B) Enlargement of summit area topography.
In order to understand the variations of eruptive activity, it is necessary to reliably capture the occurrence of Vulcanian eruptions, which are characteristic of Sakurajima. The vulcanian eruptions are phenomena during which pyroclastic material is violently ejected from volcanoes. As such, they are normally accompanied by impulsive explosion earthquakes and infrasound generation (Johnson and Lees, 2000; Green and Neuberg, 2005; Ohminato et al., 2006; Zobin and Martínez, 2010; Yamada et al., 2016). Because of this, seismic and infrasonic signal recordings are utilized to supplement visual observations for occurrence discrimination, particularly when the eruption site is obscured by weather phenomena. At Sakurajima volcano, frequent Vulcanian eruptions are recorded using visual observations, seismic, and infrasound signals. In addition to these monitoring methods, ground deformation methods are helpful for detecting Vulcanian eruptions because deformation signals obtained in less noisy conditions provided by underground tunnels also correspond to eruptions of this type.
Each Vulcanian eruption is preceded by upward crater side tilt and extensional strain that occurs from 10 min to 7 h prior to the eruption onset and is followed by downward tilt and contractive strain (Kamo and Ishihara, 1989; Ishihara, 1990; Iguchi et al., 2013). These events indicate that inflation due to pressurization precedes an eruption, which is then followed by the eruption itself. Successive Strombolian eruptions are also associated with deflation events. However, their deformation rates are lower than those seen with Vulcanian eruptions (Tateo and Iguchi, 2009). Additionally, the pressure source volume changes that induce deflationary ground deformations associated with these eruptions are well correlated with mass ejections of volcanic ash (Iguchi, 2016). Hence, ground deformation monitoring provides a more quantitative understanding of the processes involved than seismic or infrasound observations. However, it should also be remembered that deflation episodes occur regularly and do not always presage an eruption. In light of this, more work needs to be conducted in order to understand the causes of non-eruptive deflation (NED) events.
In this study, we categorize deflation events contained in continuous deformation records for eruptive activities at the Sakurajima volcano Minamidake crater during the period from November 2017 to December 2020. Next, the deflation events are classified into eruptive and non-eruptive types by examining the seismic data, infrasound generation, and visual phenomena. These event type occurrence characteristics are then further clarified based on their relationship to pressure source volume changes. Finally, these activities are discussed quantitatively in terms of eruptive activity episode transitions, with emphasis on the September 2019 to June 2020 episode, during which the intrusion of bubble-rich magma is considered via the SO2 gas discharge rate.
Eruptions at Sakurajima volcano are characterized by Vulcanian eruptions from 1955 to 2020. The Vulcanian events are accompanied by ballistic bombs, intense air-shocks, and large ash clouds. Historically, the Sakurajima Volcanological Observatory (SVO), which is currently known as the Sakurajima Volcano Research Center (SVRC), has only counted Vulcanian eruptions via instrumental observations at station HAR (Figure 1A) when they have seismic event amplitudes of ≥10 μ and infrasound pressure increases of ≥10 Pa. In contrast, the Kagoshima Meteorological Office of the Japan Meteorological Agency (JMA) counts Vulcanian eruptions principally based on related phenomena such as ballistic bombs, intense air-shocks, and large ash clouds as Ex-type (explosion with intense air-shock) eruptions. In addition, although Sakurajima frequently emits volcanic ash with no audible sound and/or ballistic bombs, ash emission frequency makes counting all such events unrealistic. Currently, the JMA counts weak eruptions with ash plumes elevations ≥1,000 m above the crater as Er-type (non-explosion with weak infrasound) eruptions.
Most of the eruptions examined in this study were registered by both the SVO and the JMA, although there were slight differences in their recorded details. However, since only the JMA categorizes Er-type eruptions in detail, it was first necessary to compile a comprehensive list of Vulcanian eruptions from the SVO database and Kagoshima JMA database published on the Volcanological Bulletin (Japan Meteorological Agency, 1961-2006; Kagoshima Meteorological Office, 2019), and then redefine those events as follows. Eruptions with infrasound levels ≥10 Pa measured at a designated station were listed as Ex-type events and those with levels <10 Pa were considered Er-type events. The 10 Pa threshold was determined from changes to the amplitude distribution pattern of the infrasound (Supplementary Figure S1). The designated recording stations were HAR for the Minamidake crater and AVOT for the Showa crater and were chosen based on the relative locations of the craters (Figure 1B) and the stations (Figure 1A). Based on this redefinition process, 14,681 Ex-type and 7,285 Er-type events were identified.
To obtain an improved overall understanding of transient eruptive activities covering the period from 1955 to 2020, annual counts and 30-days running sums of Ex-type eruptions along with the annual estimated sum of erupted volcanic ash were calculated as shown in Supplementary Figure S2. Here, it should be noted that volcanic ash amounts have been estimated since 1978 using the monthly deposits at 58 (62 after 2011) sampling points located at distances up to 50 km from the Sakurajima volcano summit (Iguchi, 2016).
As shown in Supplementary Figure S2A, the eruptive activity from 1955 to 2020 is divided into four periods based on the activities of the eruptive crater: first Minamidake crater (1955–1971), second Minamidake crater (1972–2005), Showa crater (2006 to October 2017) and the third Minamidake crater (starting November 2017 and ongoing as of May 2021). The Vulcanian eruption that occurred on 13 October 1955, is considered to be the dawn of the eruptivity era that has continued for more than 65 years. Eruptive activities during the first Minamidake crater period peaked in 1960, when 418 Ex-type events were recorded, after which volcanic activity gradually decreased. There was a repose of eruptive activity for 10 months between the first and second Minamidake crater periods, the latter of which started in March 1972.
The second Minamidake crater period events showed a sudden increase in September 1972, after which frequent eruptions continued for 30 years. Of particular note, annual counts of 411, 434, and 484 Ex-type eruptions were recorded in 1974, 1983, and 1985, respectively. Volcanic ash eruption rates during the second Minamidake crater period were the largest of the four periods, as shown in Supplementary Figure S2B. More specifically, annual mass eruptions were recorded at 3 × 10¹⁰ kg in 1985 and exceeded 5 × 10⁹ kg in the period up to 1992. When the first period of Minamidake eruptivity started, only Vent-A was open in the summit area (Figure 1B). However, in the early 1960s, Vent-B opened 300 m southeast of Vent-A and increased in size as the number of eruptions grew. Eruptive activity in the second Minamidake crater period declined significantly in 2003, after which the eruptive center shifted to the Showa crater (Figure 1B).
The first Showa crater eruption, which was one of two phreatomagmatic type events observed in this study period, occurred on 4 June 2006. The second phreatomagmatic event occurred in May 2007 (Miyagi et al., 2010) but became magmatic in February 2008. The number of Ex-type eruptions increased in 2009 and became particularly frequent (1,044 and 1,086 Ex events in 2010 and 2011, respectively) until the middle of 2015. It should also be noted that the annual volcanic ash eruptions were smaller (less than 1 × 10¹⁰ kg) than the second Minamidake crater period and that the Showa crater period was characterized by frequent minor eruptions.
Eruptive activity switched from the Showa to Minamidake craters at the end of October 2017, marking the start of the third Minamidake eruptive period, where most eruptions have occurred since then. In particular, it is noteworthy that no eruptions have occurred at Showa crater since April 2018. The volcanic eruptions in the third Minamidake crater period were even smaller (ash ≤2 × 10⁹ kg/year) than the second Minamidake and Showa crater periods.
As stated above, most of the eruptions at the Minamidake crater occurred after 30 October 2017. In total, six eruptive episodes separated by intervals of >20 days were identified (Figure 2) for this period. The durations and repose times of the episodes are listed in Table 1. Episodes 1 and 2 were short-period increases in eruptive activity, while Episodes 3, 4, and 5 each continued for periods ranging from seven to 10 months. Of these, Episode 5 had the largest number of Vulcanian eruptions (465 Ex-type and 277 Er-type events), and the amplitudes of the explosion earthquakes were larger than in the other episodes (Figure 2C). This episode featured a decreasing infrasound amplitude trend (Figure 2B).
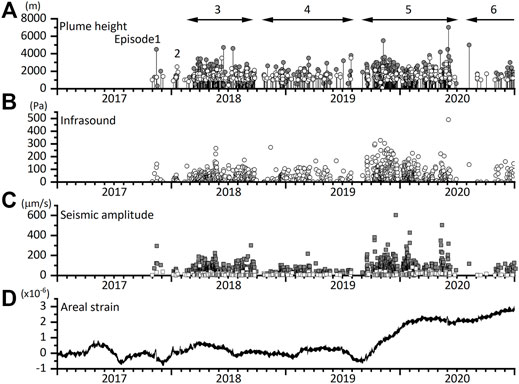
FIGURE 2. Eruptive activity of Sakurajima volcano in the third Minamidake crater period from November 2017 to December 2020. (A) Plume heights of volcanic ash ejected by Ex- (gray circles) and Er-type (open circles) eruptions. (B) Air shock amplitude of the compressional phase of Ex-type eruptions at station HVOT. (C) The maximum amplitude of explosion earthquakes that accompanied Ex-type (gray squares) and Er-type (open squares) eruptions at station AVOT. (D) Dilatational areal strain changes recorded in station HVOT. Dilatational areal strain changes are the sum of linear strain changes in the directions of the Minamidake crater and at right angles to it.
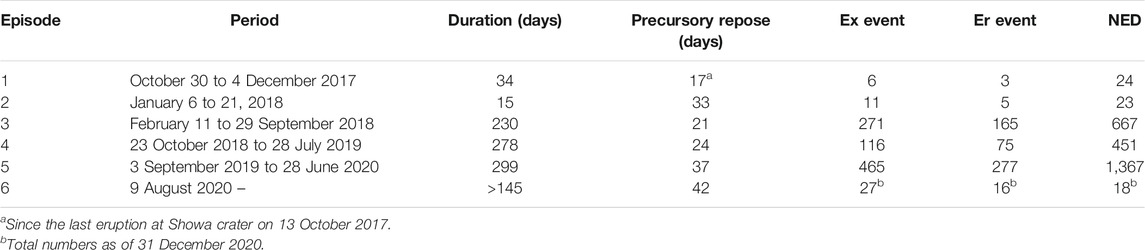
TABLE 1. Eruptive episodes in the third Minamidake period.
An increase in areal strain was detected during the period from September 2019 to February 2020. After this period, the strain stopped increasing and showed a slight decrease until June 2020 (Figure 2D). This increase in areal strain is interpreted to be due to the inflation of a Mogi-type source at depths of 2–6 km below the Minamidake crater (Ishihara, 1990). Three notable Ex-type eruptions occurred during Episode 5. The volcanic plume of the Vulcanian eruption that occurred at 17:24 Japan Standard Time (JST) on 8 November 2019, reached an elevation of 5,500 m above the crater (Note that all times given hereafter in this study are JST (Universal Time +9 h)). The eruption at 13:37 on 1 June 2020, was accompanied by the largest deflationary ground deformation since 1988. In this event, the downward tilt of the crater side was measured at 370 nanoradians at station HVOT. Separately, the Vulcanian eruption at 02:59 on 4 June 2020, was the most violent event in the third Minamidake crater period, producing a volcanic plume up to an elevation >7,000 m above the crater. Here, the infrasound amplitude was measured at 490 Pa at station HAR, and a volcanic bomb from the eruption was found to have traveled 3.3 km from the crater.
Vulcanian eruptions at Sakurajima volcano are proceed by gradual inflationary ground deformations, which last from about 10 min to 7 hours and are accompanied by sudden (less than 1 hour) deflationary deformations, which are detected by the high-sensitivity water-tube tiltmeter and strainmeter installed in the underground tunnel of station HVOT (Ishihara, 1990). Deformation detection is enhanced by the same types of sensors installed in the underground tunnel of station AVOT, which is closer to the crater (Iguchi et al., 2013). Figure 3 shows a sample record of strain changes observed at station AVOT (Figure 1). The strainmeter is composed of displacement sensors and 28 m long quartz glass bars in the direction of Minamidake crater (radial component), orthogonal to it (tangential component), and at a 45° angle to it (oblique component). One edge of the bar is attached to the ground, and the other is free-floating to detect ground displacements by the sensor. The noise level of the strain signal is 0.4 nanostrain at station AVOT, and collected strain signals are digitized at 1 s interval with a nanostrain resolution of 0.058. In this measurement, the ocean tide effects are removed from the strain records by using sea-level observations and a Bayesian method (Tamura et al., 1991).
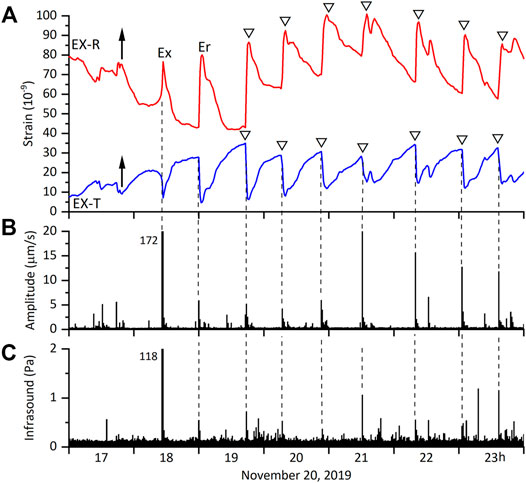
FIGURE 3. Example of ground deformation events. (A) Strain changes at station AVOT with tidal components removed. The red and blue curves are radial and tangential components, respectively. “Ex” and “Er” indicate onsets of Ex- and Er-type eruptions, respectively. The arrows indicate the inflation onsets prior to the Ex-type events, while the triangles indicate the onset of deflation events that did not accompany significant eruptions. (B) Seismic and (C) infrasound amplitudes observed at station AVOT.
In this event, the extensional strain changes in the tangential component and the contraction strain changes in the component radial from the crater started at 17:49, prior to the Ex-type eruption at 18:26. When the eruption occurred, the deformation transitioned to rapid contraction and extension in the tangential and radial components, respectively. This deformation was caused by an increase in pressure resulting from an inflation of the source prior to the eruption and a deflation of the source associated with the eruption. The inverted polarity of strain changes—extension in the radial and contraction in the tangential components—was caused by the shallowness (0–1.5 km) of the pressure source (Iguchi et al., 2013). A similar extension and contraction pattern was recognized in the strain record before and after the onset of the type Er eruption that occurred at 19:00.
Since the amplitudes of the Ex- and Er-type deformation events in Figure 3 were smaller than typical events, enlarged details of the deflation components of typical Ex- and Er-type events are shown in Figures 4A,B, respectively. At the onset of the explosion earthquake of the Ex-type event, deflationary ground deformation was indicated by the contraction strain in the tangential component and extensional strain in the radial component that started suddenly and continued for 60 s (Figure 4A). The Er-type eruption was accompanied by a similar strain change pattern that continued for 45 s (Figure 4B). These characteristic strain changes correspond well with other Ex- or Er-type events, which gives us a means to identify eruptive events by using ground deformation data independent of visual, seismic, and infrasound information.
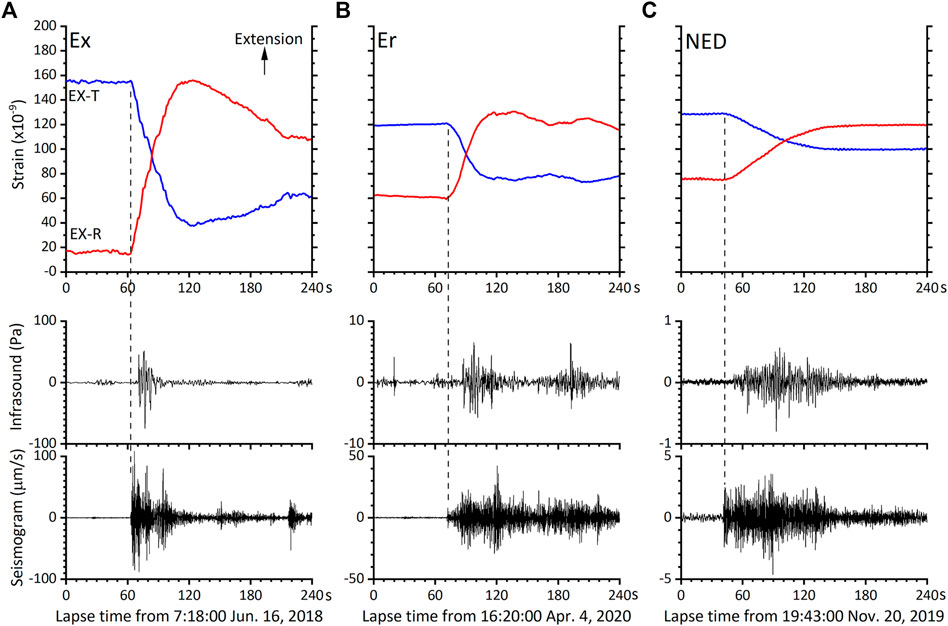
FIGURE 4. Ground deformation events and infrasound and seismic records. (A) An Ex-type event. (B) Er-type event. (C) NED event.
As shown in Figure 4A, the Ex-type eruption was accompanied by an impulsive explosion earthquake (240 μm/s at AVOT) and infrasound generation (50 Pa at AVOT) 7 s later. The non-explosive eruption earthquake (42 μm/s) and infrasound generation (6 Pa) associated with the Er-type eruption were much smaller than the Ex-type. The larger explosion earthquake amplitudes and infrasound values for Ex-type over Er-type events are reflected in the explosive intensity. However, there were no systematic differences in the strain change.
Characteristic ground deformation patterns composed of gradual inflation and sudden deflation events are sometimes detected even when Vulcanian Ex- and Er-type eruptions have not occurred. The ground deformation events marked by triangles in Figure 3 show deformation event examples that are not listed in the combined SVO and JMA list. Here, an Ex-type eruption occurred at 18:26 in conjunction with an explosive earthquake and air shock, followed by an Er-type eruption at 19:00. The Ex- and Er-type eruptions produced whitish-gray volcanic plumes reaching elevations of 1800 and 1,200 m above the crater, respectively (Kagoshima Meteorological Office, 2019).
These eruption onsets were preceded by a gradual extension and followed by a sudden contraction in the tangential strain component. In the radial strain, the polarities were inverted due to the shallowness of the pressure source (Iguchi et al., 2013). Following the Ex- and Er-type eruptions, similar strain change patterns were identified at 19:43, 20:16, and 20:53 (onset times of sudden deflation), etc., in time intervals of 33–49 min. However, these events are not listed in the eruption database as Ex- or Er-type eruptions because the volcanic plume tops stayed at elevations of just several hundred meters above the crater. Hence, the deflation was designated as a “non-eruptive deflation” (NED) event.
Enlargement of the NED event comparison of the Ex- and Er-types is shown in Figure 4C. At the onset of ground vibration, deflationary ground deformation indicated by contraction strain in the tangential component and extensional strain in the radial component started and continued for 100 s. Here, it can be seen that the ground vibration (<4 μm/s) and infrasound (<1 Pa) values are much smaller than the Ex-type (Figure 4A) and the Er-type (Figure 4B) events.
The visual phenomena associated with a NED event are shown in video images captured at 1-min intervals (Figure 5). Volcanic gas was continuously emitted from the Minamidake crater. A NED event occurred at 11:09 on 23 February 2020 (168 s in the time axis), as indicated by a tensional strain change in the radial component and a contraction in the tangential component (Figure 5B). The NED, which was accompanied by minor infrasound (174s in Figure 5C) and ground vibration (168s in Figure 5D), was also clearly followed by the appearance of a white steam plume 1 minute later (Figure 5A). This indicates that the NED event was caused by a temporary increase in volcanic gas emissions.
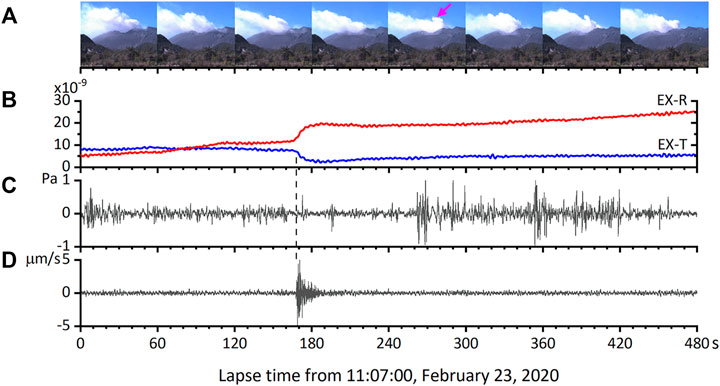
FIGURE 5. An example of visual phenomena associated with the NED event on 23 February 2020. (A) Images above the Minamidake crater captured minute-by-minute. The images were taken from station KUR (Figure 1A). The pink arrow indicates an increasing white plume. (B) Strain changes in radial (red curve) and tangential (blue) components are included to show the NED event. (C) Infrasound record. (D) Seismogram. Strain, infrasound, and seismic observations were taken at station AVOT (Figure 1A).
NED events are defined as deflation events with strain rates that are >5 nanostrain within 5 minutes in the radial component or < -5 nanostrain in the tangential component at station AVOT. In the continuous strain records of the third Minamidake crater period, 2745 NED events are identified (Supplementary Table S1). Monthly NED event numbers are plotted in Figure 6B, where it can be seen that the following NED event peaks appeared in the initial parts of the eruptive episodes: December 2017 (Episode 2), March 2018 (Episode 3), November 2019 and February 2020 (Episode 5). The monthly NED peak in November 2019 was the largest (480 events, Figure 6B) in the third Minamidake crater period. The time series of NED event strain changes is shown in Supplementary Figure S3 in a comparison of Ex- and Er-types. Ex-type strain changes are distributed up to 100 nanostrain through Episode 1 to 5, and the Er-type amplitudes range from 5 to 50 nanostrain. Between Episodes 1 and 2, there is an increase in high-amplitude NEDs, but most of the NEDs are smaller than 10 nanostrain. A histogram of NED event strain changes is shown in Supplementary Figure S4, where it can be seen that the strain change for most (83%) NED events is less than 10 nanostrain. Such small changes account for 44 and 67% of the Ex- and Er-types. This indicates that NED events are smaller than the Ex- and Er-types.
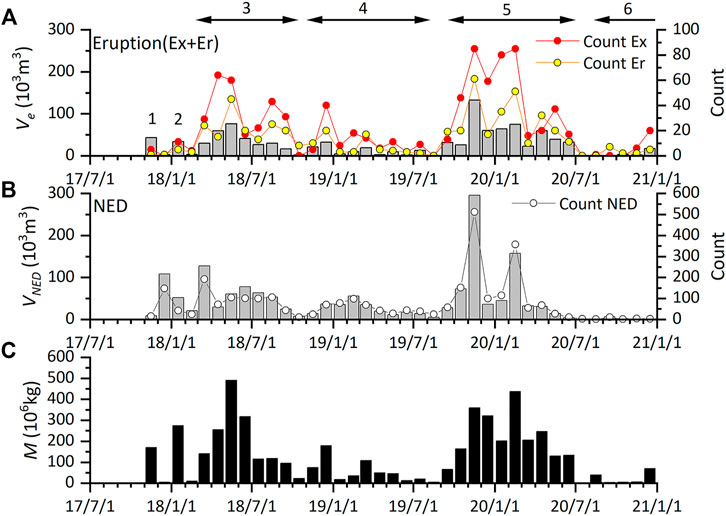
FIGURE 6. (A) Eruptive activity indicated by monthly counts of types Ex- (red circle) and Er-type (yellow circle) events and the monthly sum of volume pressure source changes estimated from the ground deformation (grey bars). (B) NED event activities are indicated by monthly count (open circle), and the monthly sums of pressure source volume changes (grey bars) are estimated from ground deformations. (C) Monthly volcanic ash mass eruption values.
In order to evaluate NED event activity quantitatively, the pressure source volume changes that induce NED events are estimated based on Mogi’s model (Mogi, 1958). Since clear ground deformation associated with NED events is recorded in the strain changes at station AVOT, strain changes are used for the estimation. Radial strain (
where the parameter k is expressed using Lamé’s constants
The inverted polarity between the radial and tangential components is caused by the shallower depth (
Then, the source depth is obtained from the ratio of the radial to the tangential strain:
Considering the relation of volume change between the ground surface and at the source (Delaney and McTigue, 1994), the volume change (
where
When examining volcanic ash mass eruptions, wide-area tephra campaign sampling is normally conducted around volcanoes after large-scale eruptions to estimate the mass discharged by these eruptions (e.g., Maeno et al., 2019). However, since the frequency of eruptions at Sakurajima make it unrealistic to collect tephra samples after each event, the ash fall deposits collected in buckets at 62 sampling points within 50 km from the crater are measured, and the weight of the deposition in a unit area is obtained monthly. According to the decay of deposition along the distance power function (Iguchi, 2016), the mass of volcanic ash ejected from the crater is estimated from the deposition data, as shown in Figure 6C. Volcanic ash can be discharged by instantaneous Ex- and Er-type eruptions and by continuous emissions. Ex and Er-type eruptions are accompanied by significant ground deformation, while continuous emissions are accompanied by volcanic tremors without deformation. Iguchi (2016) found an empirical relationship for the erupted mass of volcanic ash, which is approximated by a linear combination of terms for deflationary volume change from the ground deformation and seismic amplitude of the volcanic tremor, as follows:
where W is the monthly mass of volcanic ash expelled from the crater, and A and
White steam emissions are a visual phenomenon associated with NED events (Figure 5A) that indicate that the events are dominantly associated with volcanic gas. However, the contribution of NED events to ash emissions has not yet been evaluated quantitatively. Therefore, in order to evaluate this contribution, the pressure source volume change term
where
Volume changes and depths of pressure source inducing ground deformation events associated with Ex- and Er-type eruptions and NED events are estimated according to Eq. 6, thus fixing the pressure source location at Minamidake crater. Volume changes of individual events are shown in Supplementary Table S1. NED event volume changes are obtained within a range from 3 × 101 m3 to 6 × 10³ m3, and only 9% of those changes are larger than 1 × 10³ m3. The volume changes associated with Ex- and Er-type eruptions are larger than NED events, and 25% of these changes exceed 1 × 10³ m3.
The time series of the monthly sum of volume changes of the pressure sources and eruptions (Ex- and Er-type) and NED events for the third Minamidake crater period are shown in Figures 6A,B, respectively. The volume change amounts in November 2019 are the largest in terms of both eruptive and NED events, while the NED event peaks in December 2017 March 2018, and February 2020 are significantly larger in relation to eruptive volume amounts changes, which stayed at normal or lower levels.
Here, we examine the monthly pressure source volume change sums obtained from Ex- and Er-type eruptions (Figure 6A) and the monthly seismogram spectrum sum in a range of 2–3 Hz obtained from the short period (1 Hz) seismometer at station AVOT. The fit obtained using Eq. 8 for the erupted volcanic ash mass amount based on data collected at the previously mentioned 62 sampling points is shown in Figure 7 for the Showa crater and third Minamidake summit periods (Supplementary Figure S2) by adding the plots to the 2009 to 2013 data collected by Iguchi (2016). This shows that the estimated mass obtained using Eq. 8 correlates well with the volcanic ash mass eruption data calculated from the deposition data. The best-fit estimation using Eq. 8 with the erupted mass of volcanic ash based on deposition data is obtained at
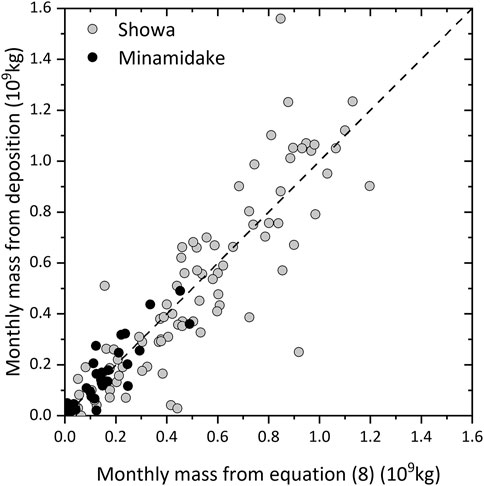
FIGURE 7. Comparison of monthly volcanic ash sums estimated via Eq. 8, with values derived from site measurements at 62 sampling points during periods of eruptivity at Showa crater from January 2009 to October 2017 (grey circles), and values recorded at Minamidake summit crater from November 2017 to December 2020 (dots).
The fit for the case of
This indicates that the contribution of NED events to volcanic ash mass eruption amounts is much smaller than that for Ex- and Er-type Vulcanian eruptions and that mass eruption amounts are reflected by the pressure source volume changes of Ex- and Er-type eruptions. In contrast, NED events are phenomena that primarily emit volcanic gas but very little volcanic ash.
Eruptive (Ex- and Er-types) and NED events accompany deflation ground deformation with similar patterns. These eruptive events contribute to ash eruptions, but NED events are primarily associated with gas emissions alone. Such eruptive events expel volcanic ash and emit a large amount of volcanic gas. It is suggested that ground deformations associated with eruptive and NED events are caused by the emission of volcanic gas, although the ground deformations during eruptive events accompanied by the simultaneous ejection of volcanic ash tend to be larger. Quantitatively, the total amount of strain change associated with eruptive events is larger than for NED events. Occurrences of Ex-, Er-, and NED-type events may be controlled by permeability at the top of the conduit. As shown in Figure 5A, volcanic gas is emitted continuously, which suggests high permeability of the top of the conduit. The increase in volcanic gas (i.e., the appearance of a higher white plume) associated with the NED was caused by gas flux fluctuations or a temporary decrease in permeability. Before the occurrence of an Ex-type event, the top of the conduit is plugged (low permeability), and bubbly magma below the plug is ejected as a mixture of volcanic gas and ash. The permeability for Er-type events may be between those for Ex- and NED events.
While considering the characteristics of each NED event described above, we compared NED event activities with eruptive activity transitions. In order to improve the time resolution, the running deflationary volume sums of pressure sources for 30 days during the third Minamidake crater period are shown in Figure 8A for NEDs and both Ex- and Er-type eruptive events. The eruptive events time series is a parameter that quantitatively represents episode intensities and is similar to the temporary change pattern for NED events for the 38 months of the period. For NED events, we identified four volume change peaks that were larger than the period’s eruptive peaks. The peak in December 2017 appeared before Episode 2, and the peak in March 2018 appeared in the initial part of Episode 3. The other two peaks were found in November 2019 and February 2020 during Episode 5.
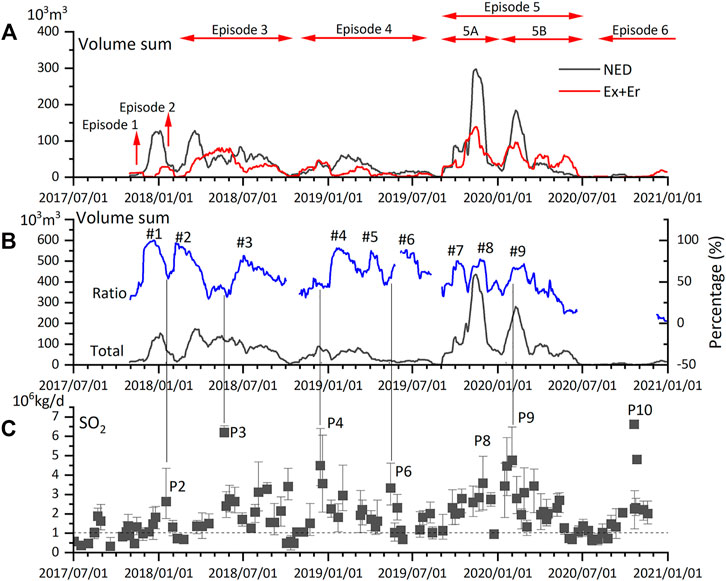
FIGURE 8. (A) 30-days running sums of volume changes caused by eruptions (Ex- and Er-type) and NED events are indicated by red and grey curves, respectively. (B) 30-days running sums of volume changes caused by both eruption types and NED events (Total: grey curve). 30-days running volume ratio of NED events to eruptions is shown by the blue curve. Labels #1 through #9 are the ratio peaks. (C) SO2 discharge mass rate measured by JMA (Japan Meteorological Agency, 2020).
The ratio of the volume change induced by NED events to the total volume change (NED plus eruptive events) is examined in Figure 8B. Here, several volume change ratio peaks are identified, and it can be seen that the ratio increased prior to the climax of each eruptive episode. The first peak (#1 in Figure 8B) appeared in the middle of December 2017, prior to Episode 2. The second peak (#2) appeared at the onset of Episode 3. The NED volume ratio gradually decreased and dropped to a minimum (40%) when the volume of eruptive events in Episode 3 climaxed in May 2018. The next peak (#3) appeared in July 2018 and was followed by a minor increase in eruptivity from August to September 2018. Then, the increase-decrease ratio pattern was repeated, and three peaks (#4, #5, and # 6) were identified in Episode 4.
Episode 5 was the most active among the episodes in the third Minamidake crater period, as indicated by the two eruptive event volume change peaks in November 2019 and February 2020, when NED event volume changes and ratios also increased (#8 and #9). The increase in the volume ratio of NED events to eruptive events indicates that NED event volume changes increased more rapidly than eruptive events. Similar to Episode 3, peak #7 appeared at the initial part of Episode 5, and the volume change ratio of NED events decreased gradually in the latter part after the eruptivity climax of peak (#9). The common transition to note here is that these episodes are initiated with a gas-rich phase (indicated by the increase in NED events) and that the latter part is dominated by eruption-induced volcanic ash discharges.
Since NED events are related to volcanic gas emissions, this section examines the time series of NED events in comparison with SO2 gas discharge rate transitions. At Sakurajima volcano, JMA measures SO2 gas discharge rates (Japan Meteorological Agency, 2020) by traverse campaign measurement using a differential optical absorption spectroscopy (DOAS) network over irregular time intervals of from one to 25 days depending on weather conditions, but at least once a month (Figure 8C). SO2 discharge rates exceeded 1 × 10⁶ kg/day over most of the third Minamidake crater period.
The SO2 discharge rate shows several peaks, including jumped values to irregular interval measurements. Increases in the NED volume change ratio were preceded by SO2 discharge rate peaks (Figures 8B,C). After the appearance of SO2 discharge rate peaks (P2, P3, P4, P6, and P9 in Figure 8C), the ratio of NED volume change to eruptive events increased over a one-to-two month period, as shown by peaks (#2, #3, #4, #6, and #9 in Figure 8B), respectively. Here, it should be noted that the SO2 measurements may not be sufficiently frequent to discuss correspondence with peak #5 in Figure 8C, and that there is no SO2 measurement period in February 2019. Peak #7 appeared in the increasing trend of SO2 discharge rate that started in September 2019.
The increasing pattern of the SO2 discharge rate corresponds well to the NED volume change ratio during the period from September 2019 to February 2020 in Episode 5. When examined in detail, it can be seen that the SO2 discharge rate increase trend includes a temporary drop to a level of 0.9 × 10⁶ kg/day in December 2019 and two identified peaks. The first peak (P8 in Figure 8C) of 3.6 × 10⁶ kg/day is seen in November 2019, and the second peak (P9 in Figure 8C) of 4.7 × 10⁶ kg/day is seen in January 2020. The volume changes of NED and eruptive events also have two peaks in November 2019 and February 2020, respectively (Figure 8A). The temporary SO2 discharge rate drop to 0.9 × 10⁶ kg/day in December 2019 corresponds to a decrease in the volume changes of NED and eruptive events. In particular, we note that neither NED nor eruptive events occurred during the period from 25 December 2019 to 4 January 2020. The discharge rate showed a decreasing trend in March 2020 and dropped to a level smaller than 1 × 10⁶ kg/day in June 2020. Similarly, NED event volume changes gradually decreased from March 2020, and only a subtle NED volume change was detected in June 2020.
Although it is difficult to estimate volcanic gas discharge amounts because the main component of the gas is water vapor, the discharge rate of SO2 gas can be considered a representative parameter for use in volcanic gas discharge activity evaluations. For example, Hidalgo et al. (2015) quantified SO2 discharge rates in two distinct phases via continuous SO2 monitoring of a multiple-station DOAS network at Tungurahua volcano, Ecuador. At Sakurajima volcano, SO2 discharge rates exceeded 1 × 10⁶ kg/day during most of the third Minamidake crater period, but high discharge rates (1×10⁶–5×10⁶ kg/day) were also noted during the second Minamidake (Mori et al., 2008) and Showa crater (Kazahaya et al., 2016) periods. Even in non-eruptive periods, large long-term SO2 emissions have been recorded from active volcanoes, such as Sicily’s Mt. Etna volcano. At that volcano, the average emission rate over 20 years is 1.7 × 10⁹ kg/year (4.6 × 10⁶ kg/day), which is one order of magnitude larger than during the eruptive period (Allard, 1997). Estimations of volcanic gas flux have also been made from SO2 discharge rates. For example, Hirabayashi et al. (1995) estimated the volcanic gas flux at 7,700 tons/day from the SO2 discharge rate for the Unzen volcano using the chemical composition of the high-temperature volcanic gases sampled around a newly effused lava dome (Ohba et al., 1994) during the same SO2 measurement period.
In the case of Sakurajima volcano, since highly eruptive activities made it nearly impossible to obtain the chemical compositions of volcanic gases from the Minamidake crater during the periods examined in our NED analysis, it was assumed that the SO2 composition in the total flux of volcanic gases did not change during the measurement periods and that the discharge rate for SO2 could be treated as an indicator of a transition of the total flux of volcanic gases. As shown in Figures 8B,C, the increases in the NED volume change ratio were preceded by SO2 discharge rate peaks, which indicate increases in gas flux. This suggests that NED event activities are enhanced by gas-rich magma intrusions.
Araya et al. (2019) determined the H2O content in melt inclusions from Plinian eruptions (1471, 1779, and 1914) and recent Vulcanian eruptions (1975–2010) at Sakurajima volcano. They found that melt inclusions in the Vulcanian products have clearly lower H2O contents (0.7–2.3 wt%) than those in the Plinian pumices (1.4–3.6 wt%). These lower H2O contents suggest that the magma is degassed during the ascent through the conduit. However, relatively few H2O content measurements were recorded during the period from 1975 to 2010, and a change in H2O content is not recognized during the (less than 1 year) episode discussed here.
The increase in SO2 discharge rates that peaked by P10 in Episode 6 did not lead to an increase in NED activity or eruptive events. As shown by Figure 3A, a NED is a deflation ground deformation event preceded by inflation that is associated with gas accumulation. This indicates that NEDs are induced by instantaneous volcanic gas discharges that accumulate over short-term periods (less than 1 hour, as indicated by the strain changes in Figure 3A) prior to such discharges. Frequent NED event occurrences are reflected by unstable volcanic gas emissions under conditions where large amounts of volcanic gas are supplied from deeper parts. In contrast, stable gas emissions do not induce NED events, even if large amounts of volcanic gas are supplied, which means that stable gas emissions are not necessary to induce volcanic eruptions (Allard, 1997). Since Sakurajima Vulcanian eruptions are preceded by sudden SO2 gas emission decreases (Kazahaya et al., 2016), it is believed that NED event activity could be used as a parameter to evaluate volcanic gas emission instability, which is related to eruption occurrences.
In order to verify a gas-rich magma intrusion, the ratio of the erupted mass to the deflation volume change is examined. Hereafter, the ratio of the erupted mass to the deflation volume change is referred to as the “pseudo density”. Since volcanic gas is continuously being emitted from the Sakurajima volcano, the volume changes induced by NED and eruptive events do not cover all the gas emissions. However, even though the pseudo density is not a real measurement of magma density, it can be used as a parameter in magma density discussions. The erupted mass of volcanic ash is estimated using the monthly deposition load of volcanic ash at the 62 previously mentioned sampling points (Iguchi, 2016).
Monthly pseudo density values are plotted in Figure 9C, where it can be seen that the average pseudo density (1900 kg/m3) is smaller than 2,600 kg/m3, which is frequently used for dense-rock-equivalent volume calculations (e.g., Wallace et al., 2006). It can also be seen that the pseudo density in the third Minamidake crater period ranges from 54 to 3,700 kg/m3. Pseudo density variations are related to eruptive activity transitions. For example, in Episodes 3 and 5, when a large amount of volcanic ash (total mass 1.5 × 10⁹ kg and 2.3 × 10⁹ kg, respectively) was expelled, smaller pseudo density values appeared in the first part and increased in the latter part of those episodes.
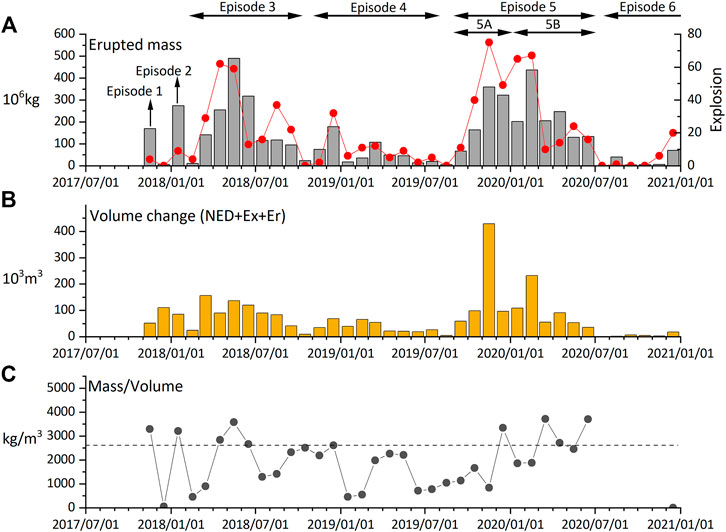
FIGURE 9. Comparison of pressure source volume changes with volcanic ash mass eruption levels. (A) Monthly volcanic ash mass eruption levels are shown by grey bars and monthly Ex-type eruptions by red dots. (B) Monthly sum of pressure source volume changes induced by eruptions and NED events. (C) Monthly ratio of volcanic ash mass eruption to pressure source volume change.
In Episode 3, the pseudo density values were only 440 and 580 kg/m3 for February and March 2018, respectively, after which the density value increased to 3,600 kg/m3 in May 2018 when 4.9 × 10⁸ kg of volcanic ash were expelled. Pseudo density values then remained relatively high until December 2018. In Episode 5, the pseudo density was lower than 1700 kg/m3 from September to November 2019, after which it increased to 3,300 kg/m3 in December 2019. Lower pseudo density (1900 kg/m3) values appeared again in January and February 2020, but the value increased to 3,700 kg/m3 in March and remained high until June 2020. This suggests that volatiles play important roles in eruptive activity transitions.
As shown in Figure 2D, inflationary ground deformation was detected in the first stage (September 2019 to February 2020) of Episode 5, during which the SO2 discharge rate increased up to 4.7 × 10⁶ kg/day (Figure 8C), and the pseudo density was estimated to be lower than 1900 kg/m3. In the latter stage, from March to June 2020, ground inflation subsided or showed a subtle deflation trend. The SO2 discharge rate decreased, and the pseudo density value increased up to 3,700 kg/m3 (Figure 9C). This indicates that the degassed magma is expelled mostly as volcanic ash. Episode 5 is interpreted by considering a model of bubble accumulation in the chamber top prior to excess degassing eruptions (Wallace, 2001; Shinohara, 2008) on the open conduit of Sakurajima, which has seen sustained long-term activity since 1955. Bubble-rich magma intrudes in the conduit in the initial stage of Episode 5, which can also be inferred from the lower pseudo density value. As a result, the SO2 discharge rate increased, and NED occurrences and eruptive events became increasingly frequent. NED event occurrences well reflect bubble-rich magma eruptions with less ash emissions. This indicated that the effusion of bubble-rich magma changed the chamber state from bubble-rich to bubble-poor, and the bubble-poor magma was erupted in the latter stage, mostly as volcanic ash. The increase in areal strain (inflation) corresponds to the lower pseudo density in the second half of 2019 when Ex- and Er-type eruptions frequently occurred. These phenomena indicate the intrusion of magma and the simultaneous occurrence of volcanic eruptions. Sakurajima volcano has an open conduit because the eruptive activity has continued since 1955. This open-conduit magma system allows the simultaneous occurrence of volcanic eruptions and the intrusion of bubble-rich magma.
As shown in Figure 9A, Episode 5 could be separated into two sub-episodes (5A: September to December 2019, 5B: January to June 2020) by a NED activity gap and dormancy of eruptive activities during the period from 25 December 2019, to 4 January 2020. The small pseudo density value seen in September corresponds to the initial stage of Episode 5A, which remained at a low level in October and November, thereby indicating an intrusion of bubble-rich magma. The larger pseudo density in December corresponds to the latter stage of Episode 5A. The small pseudo density value in January corresponding to the initial stage of Episode 5B indicates a recurrence intrusion of bubble-rich magma, and the larger apparent density value from March to June indicates that the bubble-poor magma erupted in the latter stage of Episode 5B.
Ex-type eruptive events may contain large amounts of gas in their initial stages. Air-shock pulse is induced by a gas outburst beneath the lava plug at the top of the conduit (Fee and Matoza, 2013), which means the larger air-shock amplitude (ca >300 Pa) in the initial stage of Episode 5 (Figure 2B) may be reflected by the explosive release of accumulated gas emitted from bubble-rich magma. Note that the air-shock amplitude gradually decreased in the latter stage of the episode and was less than 120 Pa after March 2020, except for a few Ex-type events. The small infrasound amplitude of these Ex-type eruptions is consistent with the low gas volume of degassed magma.
The Ex-type event that occurred at 02:59 on 4 June 2020, was exceptionally large in the latter stage of Episode 5. An infrasound amplitude of 490 Pa was recorded at station HAR (Δ = 2.7 km), and the eruption launched a volcanic bomb that traveled a distance of 3.3 km from the crater. From these results, it can be inferred that highly pressurized gas from bubble-rich magma contributed to the large air-shock amplitude and the long-distant flight of the bomb. The characteristics of the Ex-type event that occurred on 4 June 2020 were different from gas-poor magma that normally erupts from the latter stage of Ex-type events.
Next, the ground deformation associated with the Ex-type eruption on 4 June 2020 was examined to extract event characteristics (Supplementary Figure S7). The most significant precursor was a sudden deflation caused by the Ex-type event 61 h before (13:37 on June 1). More specifically, deflation of 217 nanostrain and 183 nanostrain of the contraction strain in the radial and tangential components, respectively, were recorded at station HVOT. The strain change was the largest among the third Minamidake crater period. The inflation prior to the Ex-type began 4 days before, and neither eruptive nor NED events occurred during the inflation (Supplementary Table S1) period. This reflects the intrusion of bubble-poor magma. A large amount of bubble-poor magma remaining in the latter stage was extruded from the conduit by June 1, but a rapid extension strain began 18 h after the eruption, and the radial and tangential strain changes were 135 nanostrain and 126 nanostrain, respectively, for 43 h before the onset of the June 4 Ex-type event. During the inflation period, four Ex-type events, one Er-type event, and two NED events occurred (Supplementary Table S1), thus suggesting the intrusion of bubble-rich magma. This also suggests that the bubble-rich magma that happened to remain in the initial stage may have intruded in the conduit rapidly, thus causing the June 4 Ex-type event. The ejection of numerous ballistic bombs (Supplementary Figure S8) with strong air shocks (490 Pa at HVOT) suggests low magma permeability for the plug at the top of the conduit and a highly pressurized gas pocket below it. The bubble-rich magma may separate clearly into a low-permeable plug and a gas pocket at an extremely shallow part of the conduit. The variations in long-term eruptive activity are controlled by the amount of bubbles in the intruded magma. The activity of NED events is helpful to understand the long-term variations in eruptive activity also from other volcanoes characterized by open conduit.
Vulcanian eruptions occur when there is a low-permeability plug and a gas-rich region supported by the supply of gas from a deeper region. The Montserrat Vulcanian eruptions ER1 and ER2 (Gottsmann et al., 2011) suggest the need to discuss differences between Ex- and Er-type eruptions. Compared to the ER1, the ER2 eruption appears to have released greater overpressure over a shorter time from a source situated closer to the surface, such as a gas pocket beneath the dome carapace (Gottsmann et al., 2011). The ER2 characteristics are similar to the Ex-type of Sakurajima. The ER1 was accompanied by smaller excess pressure and strain change, as well as non-impulsive ground motion. The Sakurajima Er-types have characteristics that are more similar to ER1 than ER2. The Montserrat Vulcanian ER1 eruption expelled juvenile magmatic material and a minor amount of dome fragments, which indicates lower plug permeability, thus indicating that plug permeability may control whether Ex- or Er-type events occur.
Through examinations of continuous ground deformations at the Sakurajima volcano, we identified non-eruptive deflation (NED) events as well as eruptive Ex-type (explosion with intense air-shock) and Er-type (non-explosive) events accompanied by volcanic ash emissions and found that NED events are induced by temporary increases in volcanic gas discharge rates. Although the activities accompanying NED events do not cover the processes of all volcanic gas emissions, it was found that pressure source volume changes that induce NED events could be used as an evaluation parameter for rating bubbles in the intruding magma, comparing pressure source volume changes with eruptive events, examining volcanic ash mass eruptions, and determining SO2 discharge rates.
In the Third Minamidake crater period, in which Episodes 3 and 5 were found to be particularly active, we determined that magna containing large amounts of bubbles intruded into the conduit in the initial stage of the episode sequence and that the eruption of bubble-poor magma as an effusion of volcanic ash was dominant in the latter stage of those episodes. The transition of magma from bubble-rich to bubble-poor was also identified in the sequence of episodes.
The original contributions presented in the study are included in the article/Supplementary Material, further inquiries can be directed to the corresponding author.
MI analyzed the data and wrote the manuscript. TY conducted infrasound monitoring at station HAR and prepared the related video. TT identified infrasound events in the Showa crater period.
This study was supported by the Ministry of Education, Culture, Sports, Science and Technology (MEXT) of Japan, under its Earthquake and Volcano Hazards Observation and Research Program, and the Grant-in-Aid for Scientific Research(B) (20H01986).
The authors declare that the research was conducted in the absence of any commercial or financial relationships that could be construed as a potential conflict of interest.
All claims expressed in this article are solely those of the authors and do not necessarily represent those of their affiliated organizations, or those of the publisher, the editors, and the reviewers. Any product that may be evaluated in this article, or claim that may be made by its manufacturer, is not guaranteed or endorsed by the publisher.
The Osumi Office of the River and National Highway department of the Kyushu Regional Development Bureau, Ministry of Land, Infrastructure, Transport and Tourism (MLIT) provided the seismic, infrasonic, and geodetic data collected at station AVOT. The Kagoshima Meteorological Office of the Japan Meteorological Agency (JMA) provided unpublished visible phenomena records on the Sakurajima volcano that had been collected before 1960.
The Supplementary Material for this article can be found online at: https://www.frontiersin.org/articles/10.3389/feart.2022.727909/full#supplementary-material
Supplementary Figure 1 | Amplitudes of infrasound generated by eruptions of Sakurajima volcano during the period from 1955 to 2020. (A) The amplitudes are arranged in ascending order. The arrow indicates an inflection point. (B) An enlargement of (A).
Supplementary Figure 2 | Eruptive activity at Sakurajima volcano during period from 1955 to 2020. (A) Counts of Vulcanian eruptions, based on SVO records (1963–2020) and supplemented by Kagoshima Local Meteorological Observatory of Japan Meteorological Agency (JMA) reports from 1955 to 1962. A 30-days running sum of eruptions is indicated by lines. The bars show annual eruption numbers during the eruptive periods at Minamidake crater (pink) and Showa crater (orange). (B) The annual mass of volcanic ash is estimated from monthly load deposits at 58 (62 since 2011) sampling points around Sakurajima.
Supplementary Figure 3 | Time series of strain change associated with (A) Ex-type, (B) Er-type, and (C) NED events. The black dots indicate strain changes in the tangential component at AVOT (Fig. 1A). Amplitudes of infrasound generated by these types of events are added as blue dots.
Supplementary Figure 4 | Histogram of strain change associated with (A) Ex-type, (B) Er-type and (C) NED events. Arrows indicate the maximum values.
Supplementary Figure 5 | Histogram of volume change of pressure source associated with (A) Ex-type, (B) Er-type, and (C) NED events. Arrows indicate the maximum values.
Supplementary Figure 6 | Comparison of monthly sums of volcanic ash between estimates using Eq. (8) assuming and values derived from site measurements at 62 sampling points during eruptivity periods at Showa crater from January 2009 to October 2017 (grey circles) and at Minamidake crater from November 2017 to December 2020 (dots).
Supplementary Figure 7 | Ground deformation associated with eruptive activity during period from May 27 to 4 June 2020. (A) Strain changes of radial (red curve) and tangential (blue) components at station HVOT. The black arrows indicate the occurrence of Ex-type eruptions, and the grey arrows show four Er-type eruptions on 27 May 2020. The seismogram and infrasound amplitudes recorded at station AVOT are shown in panels (B) and (C), respectively.
Supplementary Figure 8 | Vulcanian eruption starting at 02:59 on 4 June 2020. A ballistic bomb reached a distance of 3.3 km from the Minamidake crater. The video image was taken by the Osumi Office of the River and National Highway Department of the Kyushu Regional Development Bureau, Ministry of Land, Infrastructure, Transport and Tourism (MLIT). https://www.youtube.com/watch? v = 3BWGy0QIYk4.
Allard, P. (1997). Endogenous Magma Degassing and Storage at Mount Etna. Geophys. Res. Lett. 24, 2219–2222. doi:10.1029/97gl02101
Araya, N., Nakamura, M., Yasuda, A., Okumura, S., Sato, T., Iguchi, M., et al. (2019). Shallow Magma Pre-charge during Repeated Plinian Eruptions at Sakurajima Volcano. Sci. Rep. 9, 1979. doi:10.1038/s41598-019-38494-x
Delaney, P. T., and McTigue, D. F. (1994). Volume of Magma Accumulation or Withdrawal Estimated from Surface Uplift or Subsidence, with Application to the 1960 Collapse of Kilauea Volcano. Bull. Volcanol. 56, 417–424. doi:10.1007/bf00302823
Fee, D., and Matoza, R. S. (2013). An Overview of Volcano Infrasound: From Hawaiian to Plinian, Local to Global. J. Volcanol. Geothermal Res. 249, 123–139. doi:10.1016/j.jvolgeores.2012.09.002
Gottsmann, J., De Angelis, S., Fournier, N., Van Camp, M., Sacks, S., Linde, A., et al. (2011). On the Geophysical Fingerprint of Vulcanian Explosions. Earth Planet. Sci. Lett. 306, 98–104. doi:10.1016/j.epsl.2011.03.035
Green, D. N., and Neuberg, J. (2005). Seismic and Infrasonic Signals Associated with an Unusual Collapse Event at the Soufrière Hills Volcano, Montserrat. Geophys. Res. Lett. 32, L07308. doi:10.1029/2004GL022265
Hidalgo, S., Battaglia, J., Arellano, S., Steele, A., Bernard, B., Bourquin, J., et al. (2015). SO2 Degassing at Tungurahua Volcano (Ecuador) between 2007 and 2013: Transition from Continuous to Episodic Activity. J. Volcanol. Geothermal Res. 298, 1–14. doi:10.1016/j.jvolgeores.2015.03.022
Hirabayashi, J.-i, Ohba, T., Nogami, K., and Yoshida, M. (1995). Discharge Rate of SO2 from Unzen Volcano, Kyushu, Japan. Geophys. Res. Lett. 22, 1709–1712. doi:10.1029/95gl01319
Iguchi, M., Tameguri, T., Ohta, Y., Ueki, S., and Nakao, S. (2013). Characteristics of Volcanic Activity at Sakurajima Volcano’s Showa Crater during the Period 2006 to 2011. Bull. Volcanol. Soc. Jpn. 58, 115–135. doi:10.18940/kazan.58.1_115
Iguchi, M., Tameguri, T., Nakamichi, H., and Hirabayashi, J. (2019). Forecasting Volcanic Eruption of Sakurajima Volcano Based on Magma Intrusion Rate. Bull. Volcanol. Soc. Jpn. 64, 33–51. doi:10.18940/kazan.64.2_33
Iguchi, M. (2016). Method for Real-Time Evaluation of Discharge Rate of Volcanic Ash - Case Study on Intermittent Eruptions at the Sakurajima Volcano, Japan. J. Disaster Res. 11, 4–14. doi:10.20965/jdr.2016.p0004
Ishihara, K. (1990). “Pressure Sources and Induced Ground Deformation Associated with Explosive Eruptions at an Andesitic Volcano: Sakurajima Volcano, Japan,” in Magma Transport and Storage. Editor M. P. Ryan (Chichester: John Wiley & Sons), 335–356.
Japan Meteorological Agency (1961-2006). The Volcanological Bulletin of the Japan Meteorological Agency (“Kazan Hokoku” in Japanese), Vols. 1–36.
Japan Meteorological Agency (2020). Report of 147th Coordinating Committee of Prediction of Volcanic Eruption. Available at: https://www.data.jma.go.jp/svd/vois/data/tokyo/STOCK/kaisetsu/CCPVE/shiryo/147/147_2-1.pdf (Accessed December 15, 2020).
Johnson, J. B., and Lees, J. M. (2000). Plugs and Chugs-Seismic and Acoustic Observations of Degassing Explosions at Karymsky, Russia and Sangay, Ecuador. J. Volcanol. Geothermal Res. 101, 67–82. doi:10.1016/s0377-0273(00)00164-5
Kagoshima Meteorological Office (2019). Sakurajima Eruption Table. Available at: https://www.jma-net.go.jp/kagoshima/vol/data/skr_exp_list/skr_exp_2019.html (Accessed January 20, 2021).
Kamo, K., and Ishihara, K. (1989). “A Preliminary Experiment on Automated Judgement of the Stages of Eruptive Activity Using Tiltmeter Records at Sakurajima, Japan,” in Volcanic Hazards: Assessment and Monitoring. Editor J. H. Latter (Berlin Heidelberg: Springer-Verlag), 585–598. doi:10.1007/978-3-642-73759-6_35
Kazahaya, R., Shinohara, H., Mori, T., Iguchi, M., and Yokoo, A. (2016). Pre-eruptive Inflation Caused by Gas Accumulation: Insight from Detailed Gas Flux Variation at Sakurajima Volcano. Jpn. Geophys. Res. Lett. 43, 11,219–11,225. doi:10.1002/2016gl070727
Maeno, F., Nakada, S., Yoshimoto, M., Shimano, T., Hokanishi, N., Zaennudin, A., et al. (2019). A Sequence of a Plinian Eruption Preceded by Dome Destruction at Kelud Volcano, Indonesia, on February 13, 2014, Revealed from Tephra Fallout and Pyroclastic Density Current Deposits. J. Volcanol. Geothermal Res. 382, 24–41. doi:10.1016/j.jvolgeores.2017.03.002
Miyagi, I., Itoh, J., and Shinohara, H.Kagoshima Observatory, Japan Meteorological Agency (2010). Re-activation Process of Showa Volcanic Vent at Sakurajima Volcano in 2008: Evidence From Volcanic Ash. Bull. Volcanol. Soc. Jpn. 55, 21–39. doi:10.18940/kazan.55.1_21
Mogi, K. (1958). Relation between the Eruptions of Various Volcanoes and the Deformations of the Ground Surface Around Them. Bull. Earthq. Res. Inst. Univ. Tokyo 38, 99–134.
Mori, T., Kagesawa, H., Hirabayashi, J., Yamamoto, K., Miki, D., Yokoo, A., et al. (2008). “Temporary Change of Discharge Rate of SO2 Gas for Recent 10 Years,” in The Report on the 10th Joint Observation at Sakurajima Volcano. Editor K. Ishihara (Kagoshima: Sakurajima Volcano Research Center, Disaster Prevention Research Institute, Kyoto University), 137–142. Available at: http://www.svo.dpri.kyoto-u.ac.jp/H19sakura/report/16_mori.pdf (Accessed December 15, 2020).
Nogami, K., Iguchi, M., Ishihara, K., Hirabayashi, J.-i., and Miki, D. (2006). Behavior of Fluorine and Chlorine in Volcanic Ash of Sakurajima Volcano, Japan in the Sequence of its Eruptive Activity. Earth Planet. Sp. 58, 595–600. doi:10.1186/bf03351956
Ohba, T., Hirabayashi, J.-i., and Yoshida, M. (1994). Equilibrium Temperature and Redox State of Volcanic Gas at Unzen Volcano, Japan. J. Volcanol. Geothermal Res. 60, 263–272. doi:10.1016/0377-0273(94)90055-8
Ohminato, T., Takeo, M., Kumagai, H., Yamashina, T., Oikawa, J., Koyama, E., et al. (2006). Vulcanian Eruptions with Dominant Single Force Components Observed during the Asama 2004 Volcanic Activity in Japan. Earth Planet. Sp. 58, 583–593. doi:10.1186/bf03351955
Shinohara, H. (2008). Excess Degassing from Volcanoes and its Role on Eruptive and Intrusive Activity. Rev. Geophys. 46, RG4005. doi:10.1029/2007RG000244
Tamura, Y., Sato, T., Ooe, M., and Ishiguro, M. (1991). A Procedure for Tidal Analysis with a Bayesian Information Criterion. Geophys. J. Int. 104, 507–516. doi:10.1111/j.1365-246X.1991.tb05697.x
Tateo, Y., and Iguchi, M. (2009). Ground Deformation Associated with BL-type Earthquake Swarms at Sakurajima Volcano. Bull. Volcanol. Soc. Jpn. 54, 175–186. doi:10.18940/kazan.54.4_175
Wallace, K. L., Neal, C. A., and McGimsey, R. G. (2006). “Timing, Distribution, and Character of Tephra Fall from the 2005–2006 Eruption of Augustine Volcano,” in The 2006 Eruption of Augustine Volcano, Alaska. Editors J. A. Power, M. L. Coombs, and J. T. Freymueller (Reston, VA: USGS), 187–217. U.S. Geological Survey Professional Paper 1769.
Wallace, P. J. (2001). Volcanic SO2 Emissions and the Abundance and Distribution of Exsolved Gas in Magma Bodies. J. Volcanol. Geothermal Res. 108, 85–106. doi:10.1016/s0377-0273(00)00279-1
Yamada, T., Aoyama, H., Nishimura, T., Yakiwara, H., Nakamichi, H., Oikawa, J., et al. (2016). Initial Phases of Explosion Earthquakes Accompanying Vulcanian Eruptions at Lokon-Empung Volcano, Indonesia. J. Volcanol. Geothermal Res. 327, 310–321. doi:10.1016/j.jvolgeores.2016.08.011
Yamamoto, K., Sonoda, T., Takayama, T., Ichikawa, N., Ohkura, T., Yoshikawa, S., et al. (2013). Vertical Ground Deformation Associated with the Volcanic Activity of Sakurajima Volcano, Japan during 1996-2010 as Revealed by Repeated Precise Leveling Surveys. Bull. Volcanol. Soc. Jpn. 58, 137–151. doi:10.18940/kazan.58.1_137
Keywords: Sakurajima Volcano, ground deformation, gas emission, Vulcanian eruption, infrasound, volcanic ash
Citation: Iguchi M, Yamada T and Tameguri T (2022) Sequence of Volcanic Activity of Sakurajima Volcano, Japan, as Revealed by Non-Eruptive Deflation. Front. Earth Sci. 10:727909. doi: 10.3389/feart.2022.727909
Received: 20 June 2021; Accepted: 14 February 2022;
Published: 07 March 2022.
Edited by:
Jo Gottsmann, University of Bristol, United KingdomReviewed by:
Alessandro Bonaccorso, National Institute of Geophysics and Volcanology, ItalyCopyright © 2022 Iguchi, Yamada and Tameguri. This is an open-access article distributed under the terms of the Creative Commons Attribution License (CC BY). The use, distribution or reproduction in other forums is permitted, provided the original author(s) and the copyright owner(s) are credited and that the original publication in this journal is cited, in accordance with accepted academic practice. No use, distribution or reproduction is permitted which does not comply with these terms.
*Correspondence: Masato Iguchi, aWd1Y2hpLm1hc2F0by44bUBreW90by11LmFjLmpw
Disclaimer: All claims expressed in this article are solely those of the authors and do not necessarily represent those of their affiliated organizations, or those of the publisher, the editors and the reviewers. Any product that may be evaluated in this article or claim that may be made by its manufacturer is not guaranteed or endorsed by the publisher.
Research integrity at Frontiers
Learn more about the work of our research integrity team to safeguard the quality of each article we publish.